Zip Codes with the Highest Percentage of Population Employed in Administrative & Support Services in Corpus Christi, TX
RELATED REPORTS & OPTIONS
Administrative & Support Services
Corpus Christi
Compare Zip Codes
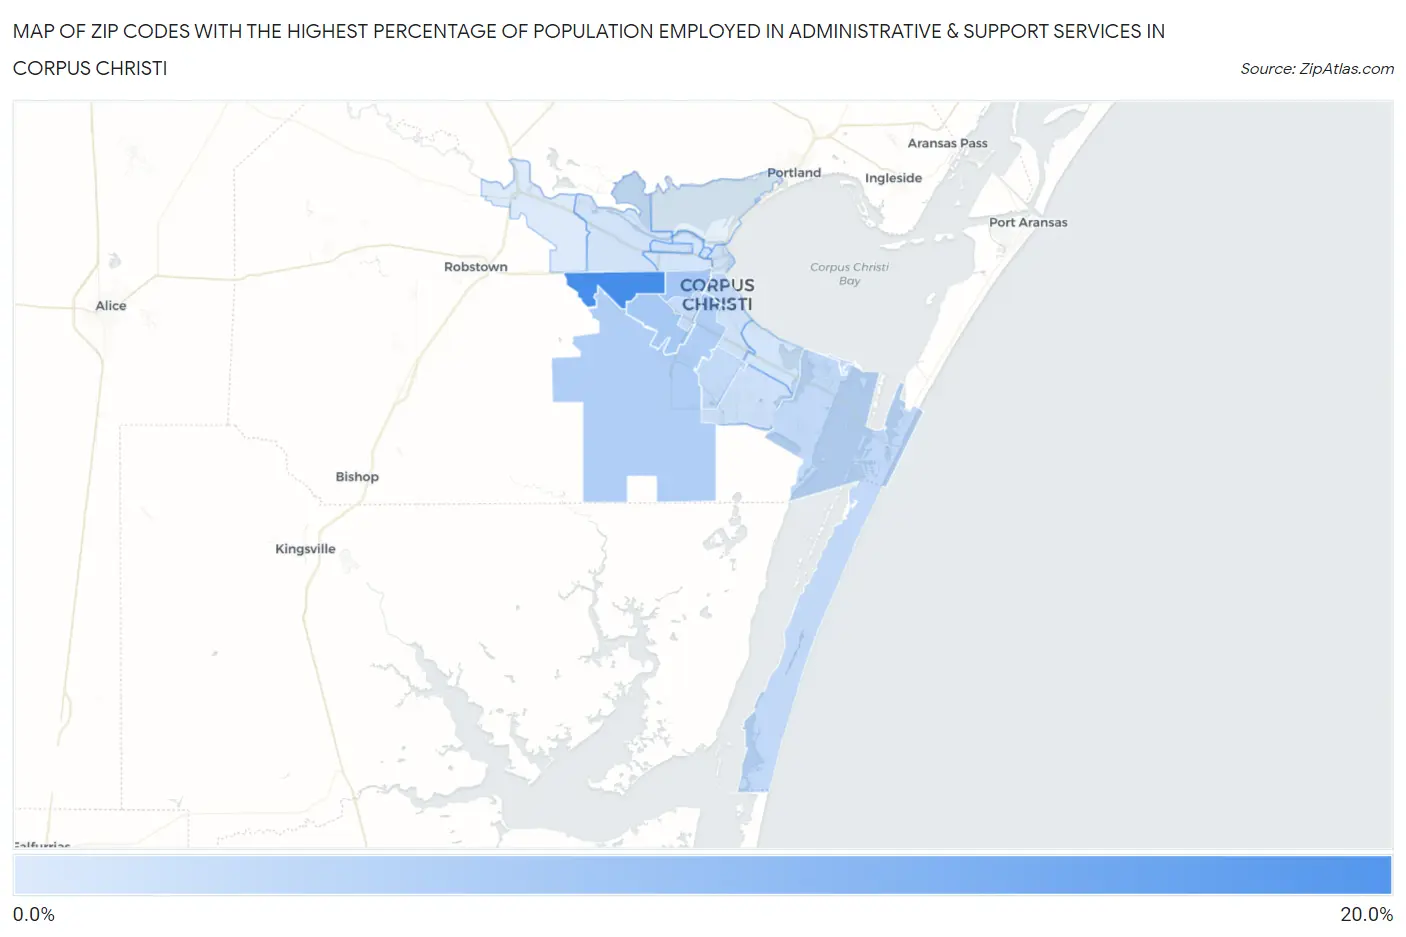
Map of Zip Codes with the Highest Percentage of Population Employed in Administrative & Support Services in Corpus Christi
0.0%
20.0%
Zip Codes with the Highest Percentage of Population Employed in Administrative & Support Services in Corpus Christi, TX
| Zip Code | % Employed | vs State | vs National | |
| 1. | 78406 | 17.7% | 4.4%(+13.3)#17 | 4.1%(+13.6)#364 |
| 2. | 78405 | 7.9% | 4.4%(+3.51)#159 | 4.1%(+3.77)#2,333 |
| 3. | 78417 | 7.7% | 4.4%(+3.25)#177 | 4.1%(+3.51)#2,537 |
| 4. | 78415 | 6.6% | 4.4%(+2.21)#276 | 4.1%(+2.47)#3,733 |
| 5. | 78404 | 5.1% | 4.4%(+0.713)#496 | 4.1%(+0.979)#6,757 |
| 6. | 78418 | 5.1% | 4.4%(+0.659)#505 | 4.1%(+0.926)#6,912 |
| 7. | 78419 | 5.0% | 4.4%(+0.626)#510 | 4.1%(+0.892)#6,990 |
| 8. | 78413 | 4.9% | 4.4%(+0.470)#547 | 4.1%(+0.736)#7,448 |
| 9. | 78416 | 4.7% | 4.4%(+0.298)#588 | 4.1%(+0.565)#7,985 |
| 10. | 78407 | 4.1% | 4.4%(-0.357)#732 | 4.1%(-0.091)#10,430 |
| 11. | 78414 | 3.9% | 4.4%(-0.471)#758 | 4.1%(-0.204)#10,913 |
| 12. | 78401 | 3.8% | 4.4%(-0.650)#803 | 4.1%(-0.384)#11,693 |
| 13. | 78411 | 3.6% | 4.4%(-0.771)#836 | 4.1%(-0.504)#12,261 |
| 14. | 78409 | 3.6% | 4.4%(-0.811)#848 | 4.1%(-0.545)#12,451 |
| 15. | 78412 | 3.4% | 4.4%(-1.05)#913 | 4.1%(-0.781)#13,603 |
| 16. | 78408 | 3.3% | 4.4%(-1.07)#917 | 4.1%(-0.807)#13,717 |
| 17. | 78410 | 2.4% | 4.4%(-2.00)#1,178 | 4.1%(-1.73)#18,568 |
1
Common Questions
What are the Top 10 Zip Codes with the Highest Percentage of Population Employed in Administrative & Support Services in Corpus Christi, TX?
Top 10 Zip Codes with the Highest Percentage of Population Employed in Administrative & Support Services in Corpus Christi, TX are:
What zip code has the Highest Percentage of Population Employed in Administrative & Support Services in Corpus Christi, TX?
78406 has the Highest Percentage of Population Employed in Administrative & Support Services in Corpus Christi, TX with 17.7%.
What is the Percentage of Population Employed in Administrative & Support Services in Corpus Christi, TX?
Percentage of Population Employed in Administrative & Support Services in Corpus Christi is 4.6%.
What is the Percentage of Population Employed in Administrative & Support Services in Texas?
Percentage of Population Employed in Administrative & Support Services in Texas is 4.4%.
What is the Percentage of Population Employed in Administrative & Support Services in the United States?
Percentage of Population Employed in Administrative & Support Services in the United States is 4.1%.