Lakeview, TX Map & Demographics
Lakeview Map
Lakeview Overview
$26,505
PER CAPITA INCOME
$77,813
AVG FAMILY INCOME
$39,375
AVG HOUSEHOLD INCOME
42.7%
WAGE / INCOME GAP [ % ]
57.3¢/ $1
WAGE / INCOME GAP [ $ ]
0.32
INEQUALITY / GINI INDEX
38
TOTAL POPULATION
20
MALE POPULATION
18
FEMALE POPULATION
111.11
MALES / 100 FEMALES
90.00
FEMALES / 100 MALES
56.0
MEDIAN AGE
2.6
AVG FAMILY SIZE
1.8
AVG HOUSEHOLD SIZE
26
LABOR FORCE [ PEOPLE ]
68.4%
PERCENT IN LABOR FORCE
Lakeview Zip Codes
Lakeview Area Codes
Income in Lakeview
Income Overview in Lakeview
Per Capita Income in Lakeview is $26,505, while median incomes of families and households are $77,813 and $39,375 respectively.
| Characteristic | Number | Measure |
| Per Capita Income | 38 | $26,505 |
| Median Family Income | 9 | $77,813 |
| Mean Family Income | 9 | $62,167 |
| Median Household Income | 21 | $39,375 |
| Mean Household Income | 21 | $42,833 |
| Income Deficit | 9 | $0 |
| Wage / Income Gap (%) | 38 | 42.72% |
| Wage / Income Gap ($) | 38 | 57.28¢ per $1 |
| Gini / Inequality Index | 38 | 0.32 |
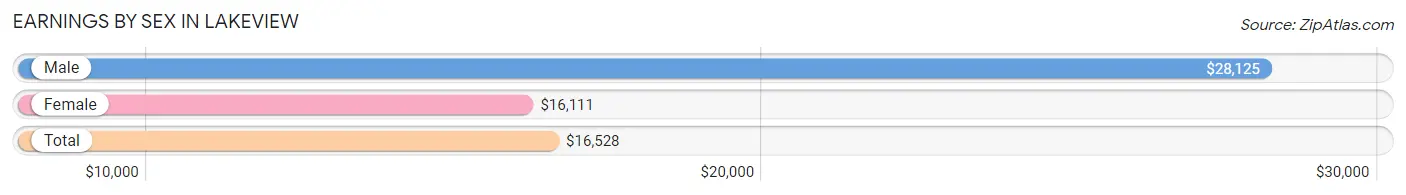
Earnings by Sex in Lakeview
Average Earnings in Lakeview are $16,528, $28,125 for men and $16,111 for women, a difference of 42.7%.
| Sex | Number | Average Earnings |
| Male | 19 (61.3%) | $28,125 |
| Female | 12 (38.7%) | $16,111 |
| Total | 31 (100.0%) | $16,528 |
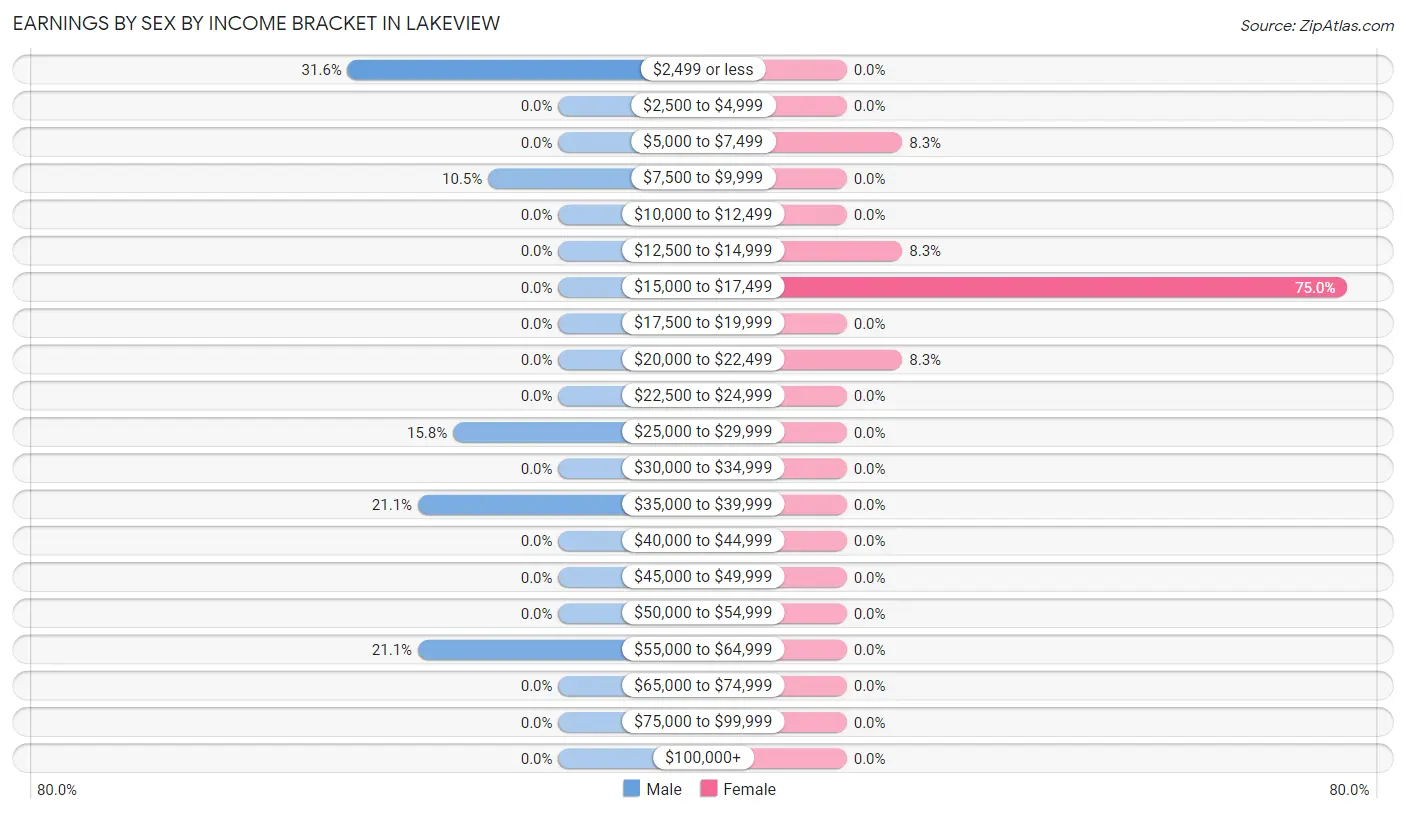
Earnings by Sex by Income Bracket in Lakeview
The most common earnings brackets in Lakeview are $2,499 or less for men (6 | 31.6%) and $15,000 to $17,499 for women (9 | 75.0%).
| Income | Male | Female |
| $2,499 or less | 6 (31.6%) | 0 (0.0%) |
| $2,500 to $4,999 | 0 (0.0%) | 0 (0.0%) |
| $5,000 to $7,499 | 0 (0.0%) | 1 (8.3%) |
| $7,500 to $9,999 | 2 (10.5%) | 0 (0.0%) |
| $10,000 to $12,499 | 0 (0.0%) | 0 (0.0%) |
| $12,500 to $14,999 | 0 (0.0%) | 1 (8.3%) |
| $15,000 to $17,499 | 0 (0.0%) | 9 (75.0%) |
| $17,500 to $19,999 | 0 (0.0%) | 0 (0.0%) |
| $20,000 to $22,499 | 0 (0.0%) | 1 (8.3%) |
| $22,500 to $24,999 | 0 (0.0%) | 0 (0.0%) |
| $25,000 to $29,999 | 3 (15.8%) | 0 (0.0%) |
| $30,000 to $34,999 | 0 (0.0%) | 0 (0.0%) |
| $35,000 to $39,999 | 4 (21.0%) | 0 (0.0%) |
| $40,000 to $44,999 | 0 (0.0%) | 0 (0.0%) |
| $45,000 to $49,999 | 0 (0.0%) | 0 (0.0%) |
| $50,000 to $54,999 | 0 (0.0%) | 0 (0.0%) |
| $55,000 to $64,999 | 4 (21.0%) | 0 (0.0%) |
| $65,000 to $74,999 | 0 (0.0%) | 0 (0.0%) |
| $75,000 to $99,999 | 0 (0.0%) | 0 (0.0%) |
| $100,000+ | 0 (0.0%) | 0 (0.0%) |
| Total | 19 (100.0%) | 12 (100.0%) |
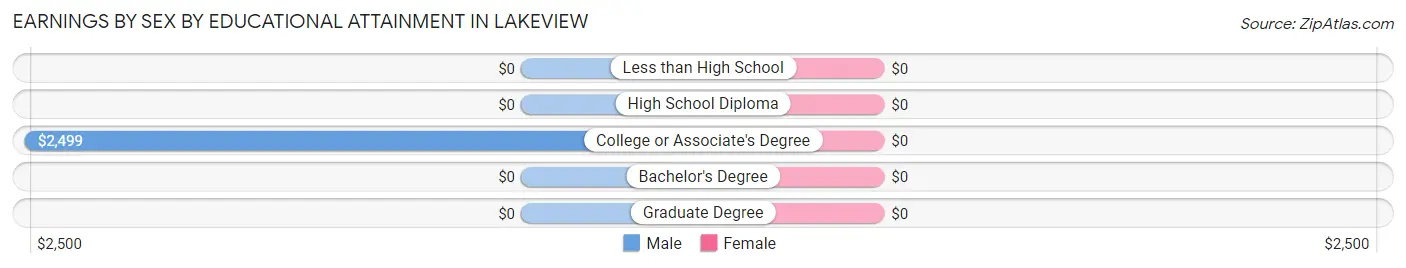
Earnings by Sex by Educational Attainment in Lakeview
| Educational Attainment | Male Income | Female Income |
| Less than High School | - | - |
| High School Diploma | - | - |
| College or Associate's Degree | $2,499 | $0 |
| Bachelor's Degree | - | - |
| Graduate Degree | - | - |
| Total | $28,125 | $16,111 |
Family Income in Lakeview
Family Income Brackets in Lakeview
According to the Lakeview family income data, there are 5 families falling into the $75,000 to $99,999 income range, which is the most common income bracket and makes up 55.6% of all families.
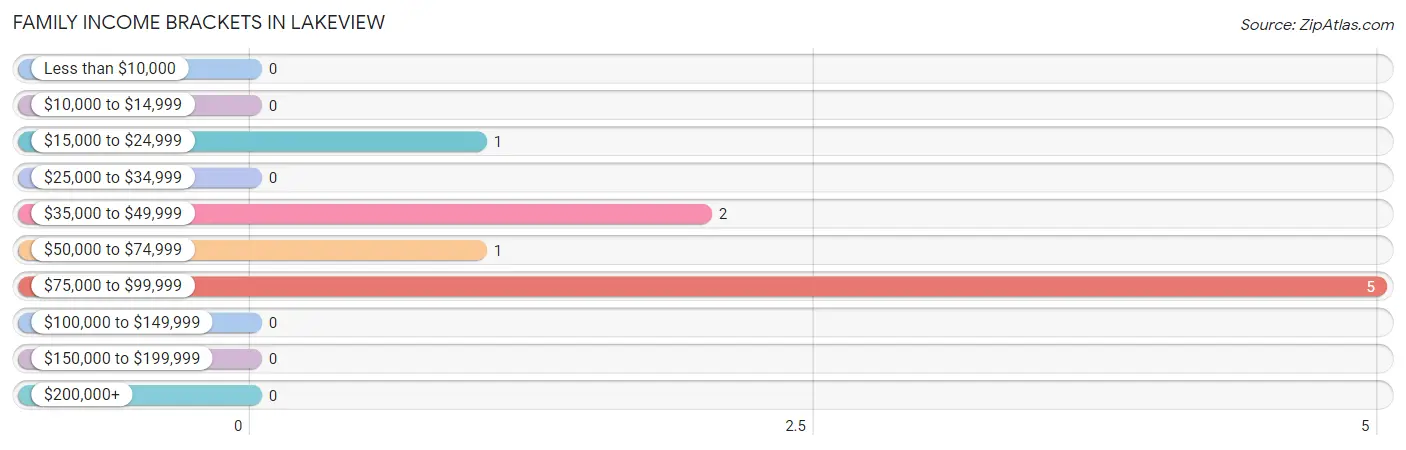
| Income Bracket | # Families | % Families |
| Less than $10,000 | 0 | 0.0% |
| $10,000 to $14,999 | 0 | 0.0% |
| $15,000 to $24,999 | 1 | 11.1% |
| $25,000 to $34,999 | 0 | 0.0% |
| $35,000 to $49,999 | 2 | 22.2% |
| $50,000 to $74,999 | 1 | 11.1% |
| $75,000 to $99,999 | 5 | 55.6% |
| $100,000 to $149,999 | 0 | 0.0% |
| $150,000 to $199,999 | 0 | 0.0% |
| $200,000+ | 0 | 0.0% |
Family Income by Famaliy Size in Lakeview
2-person families (9 | 100.0%) account for the highest median family income in Lakeview with $77,813 per family, while 2-person families (9 | 100.0%) have the highest median income of $38,906 per family member.
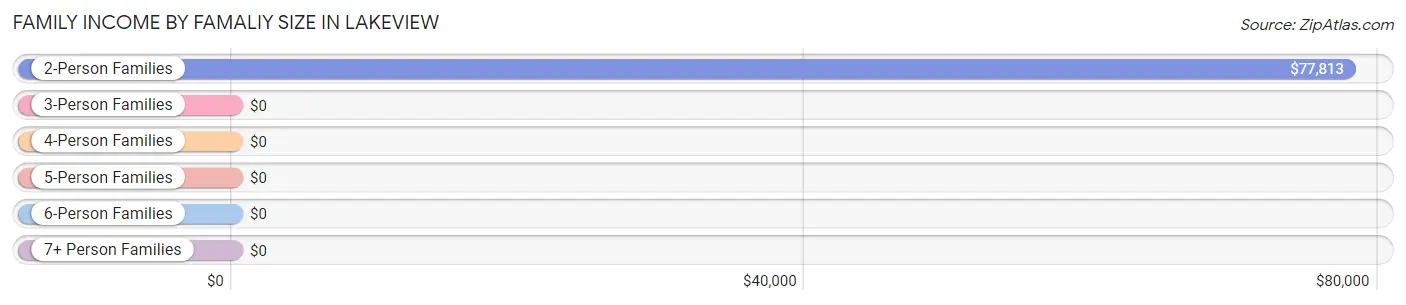
| Income Bracket | # Families | Median Income |
| 2-Person Families | 9 (100.0%) | $77,813 |
| 3-Person Families | 0 (0.0%) | $0 |
| 4-Person Families | 0 (0.0%) | $0 |
| 5-Person Families | 0 (0.0%) | $0 |
| 6-Person Families | 0 (0.0%) | $0 |
| 7+ Person Families | 0 (0.0%) | $0 |
| Total | 9 (100.0%) | $77,813 |
Family Income by Number of Earners in Lakeview
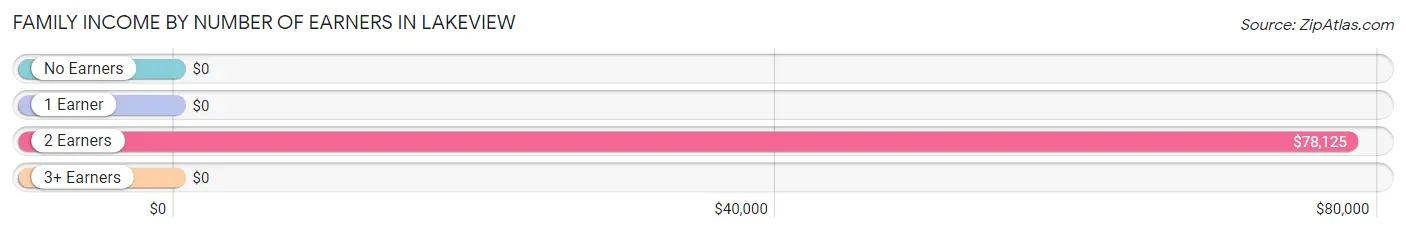
| Number of Earners | # Families | Median Income |
| No Earners | 1 (11.1%) | $0 |
| 1 Earner | 0 (0.0%) | $0 |
| 2 Earners | 8 (88.9%) | $78,125 |
| 3+ Earners | 0 (0.0%) | $0 |
| Total | 9 (100.0%) | $77,813 |
Household Income in Lakeview
Household Income Brackets in Lakeview
With 8 households falling in the category, the $15,000 to $24,999 income range is the most frequent in Lakeview, accounting for 38.1% of all households.
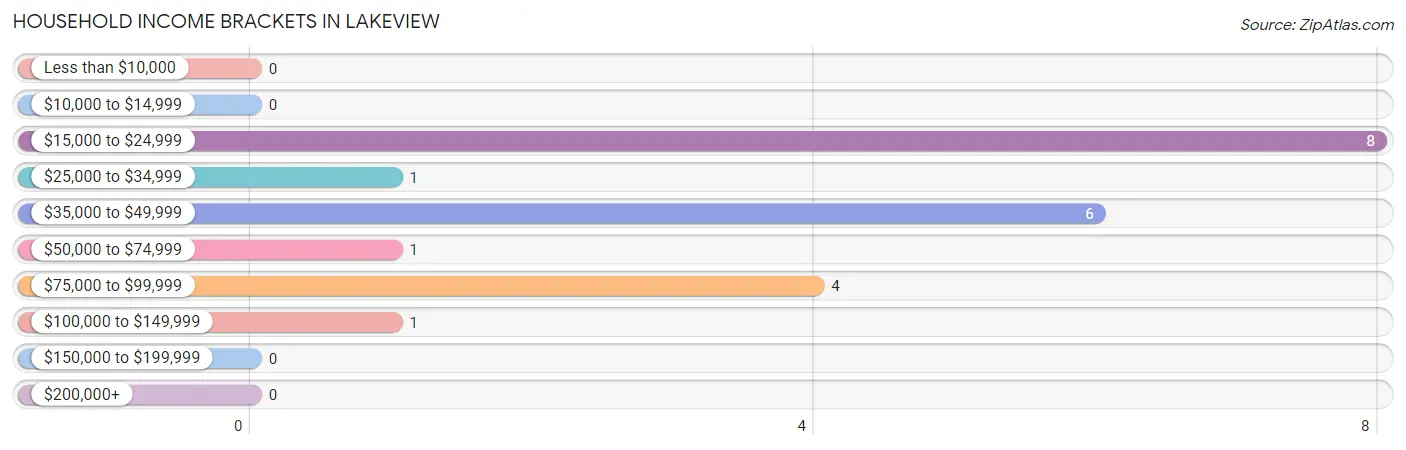
| Income Bracket | # Households | % Households |
| Less than $10,000 | 0 | 0.0% |
| $10,000 to $14,999 | 0 | 0.0% |
| $15,000 to $24,999 | 8 | 38.1% |
| $25,000 to $34,999 | 1 | 4.8% |
| $35,000 to $49,999 | 6 | 28.6% |
| $50,000 to $74,999 | 1 | 4.8% |
| $75,000 to $99,999 | 4 | 19.0% |
| $100,000 to $149,999 | 1 | 4.8% |
| $150,000 to $199,999 | 0 | 0.0% |
| $200,000+ | 0 | 0.0% |
Household Income by Householder Age in Lakeview
The median household income in Lakeview is $39,375, with the highest median household income of $41,875 found in the 65+ years age bracket for the primary householder. A total of 7 households (33.3%) fall into this category.
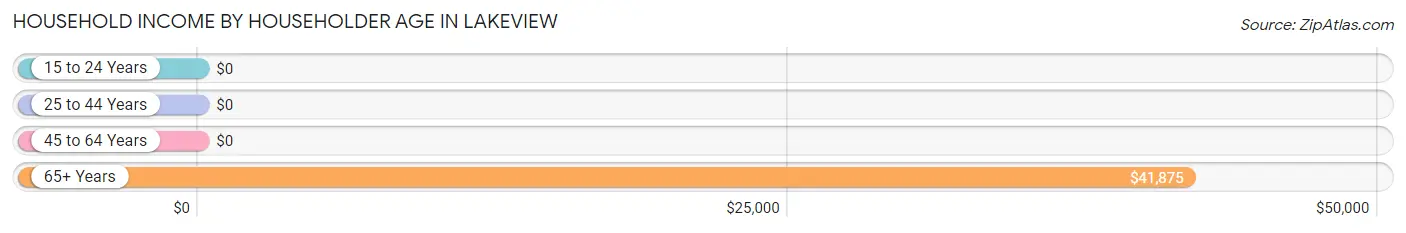
| Income Bracket | # Households | Median Income |
| 15 to 24 Years | 0 (0.0%) | $0 |
| 25 to 44 Years | 1 (4.8%) | $0 |
| 45 to 64 Years | 13 (61.9%) | $0 |
| 65+ Years | 7 (33.3%) | $41,875 |
| Total | 21 (100.0%) | $39,375 |
Poverty in Lakeview
Income Below Poverty by Sex and Age in Lakeview
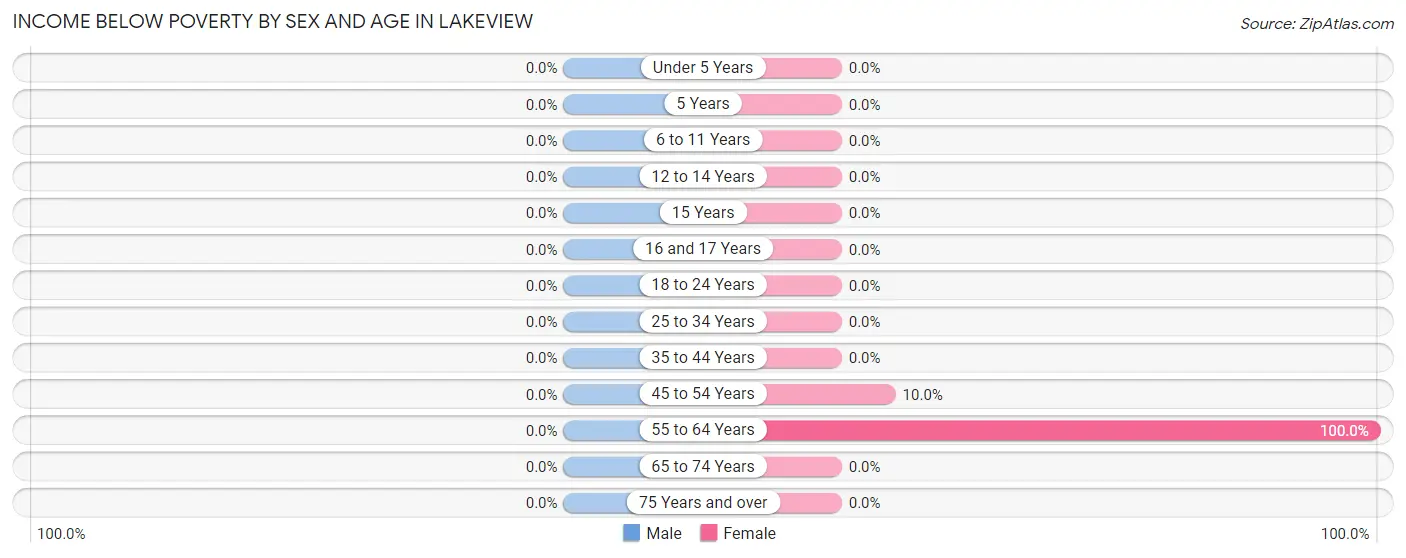
| Age Bracket | Male | Female |
| Under 5 Years | 0 (0.0%) | 0 (0.0%) |
| 5 Years | 0 (0.0%) | 0 (0.0%) |
| 6 to 11 Years | 0 (0.0%) | 0 (0.0%) |
| 12 to 14 Years | 0 (0.0%) | 0 (0.0%) |
| 15 Years | 0 (0.0%) | 0 (0.0%) |
| 16 and 17 Years | 0 (0.0%) | 0 (0.0%) |
| 18 to 24 Years | 0 (0.0%) | 0 (0.0%) |
| 25 to 34 Years | 0 (0.0%) | 0 (0.0%) |
| 35 to 44 Years | 0 (0.0%) | 0 (0.0%) |
| 45 to 54 Years | 0 (0.0%) | 1 (10.0%) |
| 55 to 64 Years | 0 (0.0%) | 2 (100.0%) |
| 65 to 74 Years | 0 (0.0%) | 0 (0.0%) |
| 75 Years and over | 0 (0.0%) | 0 (0.0%) |
| Total | 0 (0.0%) | 3 (16.7%) |
Income Above Poverty by Sex and Age in Lakeview
According to the poverty statistics in Lakeview, males aged 25 to 34 years and females aged 35 to 44 years are the age groups that are most secure financially, with 100.0% of males and 100.0% of females in these age groups living above the poverty line.
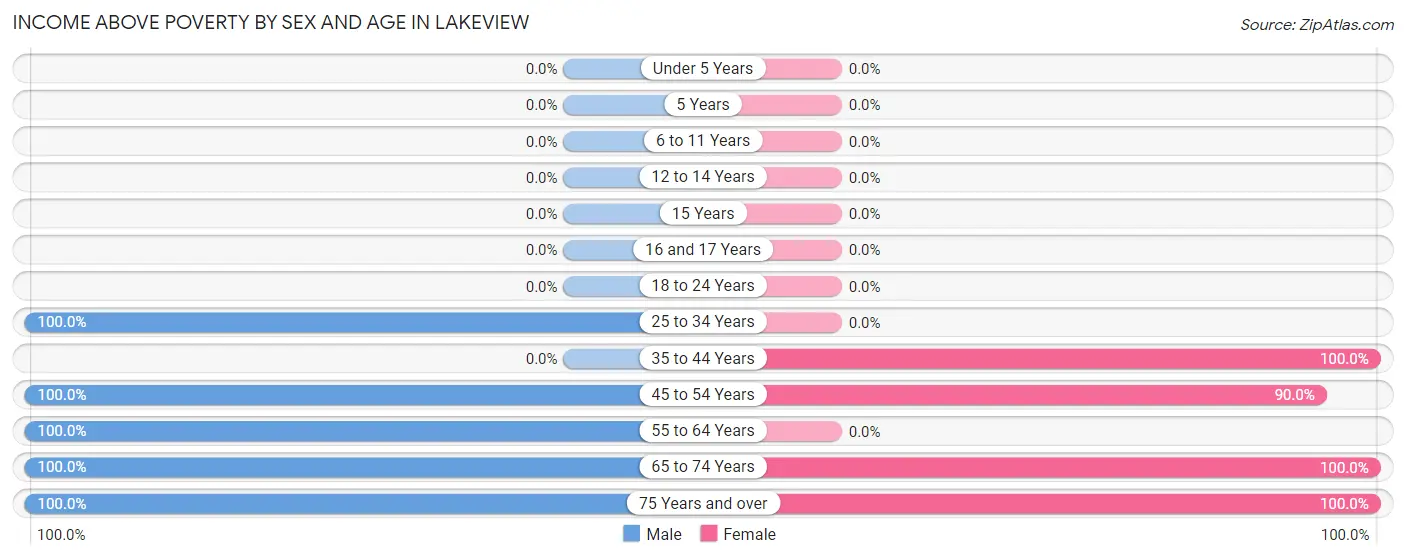
| Age Bracket | Male | Female |
| Under 5 Years | 0 (0.0%) | 0 (0.0%) |
| 5 Years | 0 (0.0%) | 0 (0.0%) |
| 6 to 11 Years | 0 (0.0%) | 0 (0.0%) |
| 12 to 14 Years | 0 (0.0%) | 0 (0.0%) |
| 15 Years | 0 (0.0%) | 0 (0.0%) |
| 16 and 17 Years | 0 (0.0%) | 0 (0.0%) |
| 18 to 24 Years | 0 (0.0%) | 0 (0.0%) |
| 25 to 34 Years | 2 (100.0%) | 0 (0.0%) |
| 35 to 44 Years | 0 (0.0%) | 1 (100.0%) |
| 45 to 54 Years | 6 (100.0%) | 9 (90.0%) |
| 55 to 64 Years | 8 (100.0%) | 0 (0.0%) |
| 65 to 74 Years | 3 (100.0%) | 1 (100.0%) |
| 75 Years and over | 1 (100.0%) | 4 (100.0%) |
| Total | 20 (100.0%) | 15 (83.3%) |
Income Below Poverty Among Married-Couple Families in Lakeview
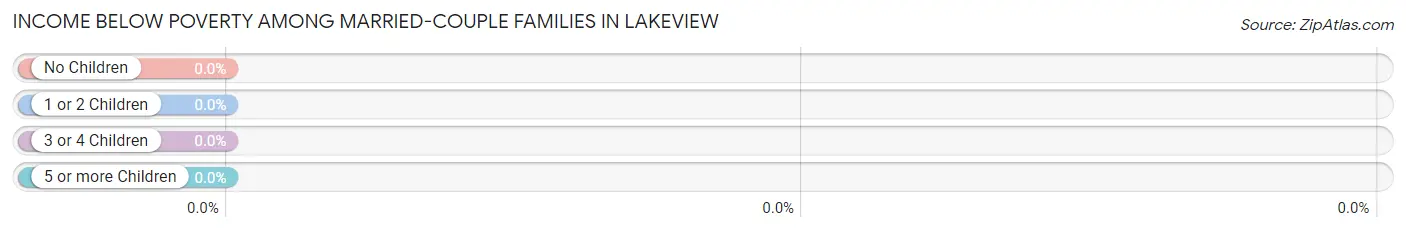
| Children | Above Poverty | Below Poverty |
| No Children | 8 (100.0%) | 0 (0.0%) |
| 1 or 2 Children | 0 (0.0%) | 0 (0.0%) |
| 3 or 4 Children | 0 (0.0%) | 0 (0.0%) |
| 5 or more Children | 0 (0.0%) | 0 (0.0%) |
| Total | 8 (100.0%) | 0 (0.0%) |
Income Below Poverty Among Single-Parent Households in Lakeview
| Children | Single Father | Single Mother |
| No Children | 0 (0.0%) | 0 (0.0%) |
| 1 or 2 Children | 0 (0.0%) | 0 (0.0%) |
| 3 or 4 Children | 0 (0.0%) | 0 (0.0%) |
| 5 or more Children | 0 (0.0%) | 0 (0.0%) |
| Total | 0 (0.0%) | 0 (0.0%) |
Income Below Poverty Among Married-Couple vs Single-Parent Households in Lakeview
| Children | Married-Couple Families | Single-Parent Households |
| No Children | 0 (0.0%) | 0 (0.0%) |
| 1 or 2 Children | 0 (0.0%) | 0 (0.0%) |
| 3 or 4 Children | 0 (0.0%) | 0 (0.0%) |
| 5 or more Children | 0 (0.0%) | 0 (0.0%) |
| Total | 0 (0.0%) | 0 (0.0%) |
Race in Lakeview
The most populous races in Lakeview are White / Caucasian (35 | 92.1%), Hispanic or Latino (18 | 47.4%), and Two or more Races (3 | 7.9%).
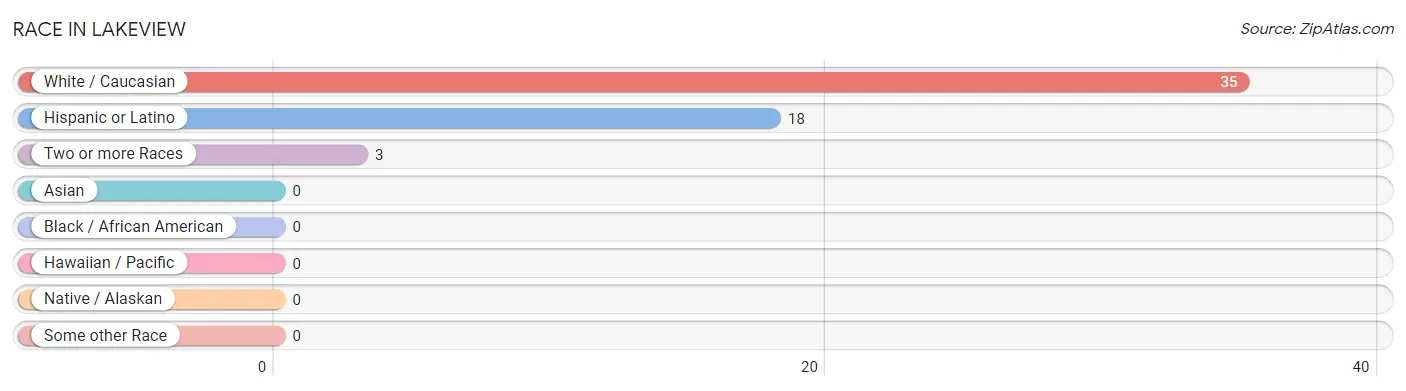
| Race | # Population | % Population |
| Asian | 0 | 0.0% |
| Black / African American | 0 | 0.0% |
| Hawaiian / Pacific | 0 | 0.0% |
| Hispanic or Latino | 18 | 47.4% |
| Native / Alaskan | 0 | 0.0% |
| White / Caucasian | 35 | 92.1% |
| Two or more Races | 3 | 7.9% |
| Some other Race | 0 | 0.0% |
| Total | 38 | 100.0% |
Ancestry in Lakeview
The most populous ancestries reported in Lakeview are Mexican (18 | 47.4%), English (4 | 10.5%), French (4 | 10.5%), Irish (3 | 7.9%), and German (2 | 5.3%), together accounting for 81.6% of all Lakeview residents.
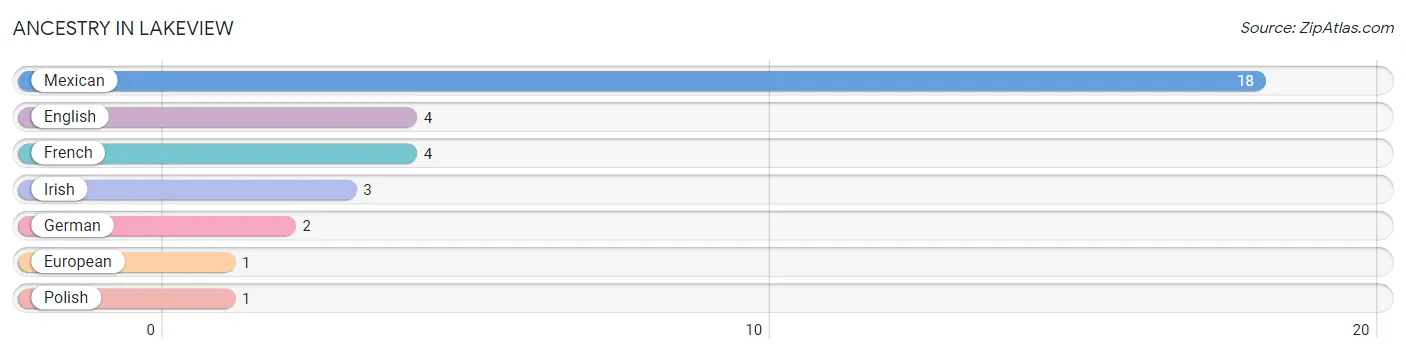
| Ancestry | # Population | % Population |
| English | 4 | 10.5% |
| European | 1 | 2.6% |
| French | 4 | 10.5% |
| German | 2 | 5.3% |
| Irish | 3 | 7.9% |
| Mexican | 18 | 47.4% |
| Polish | 1 | 2.6% | View All 7 Rows |
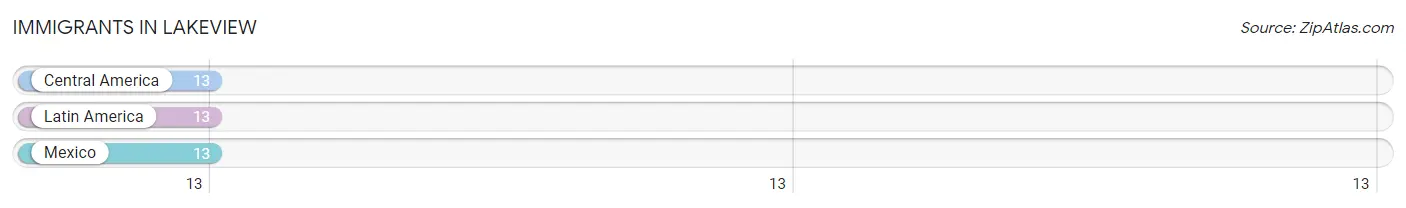
Immigrants in Lakeview
The most numerous immigrant groups reported in Lakeview came from Central America (13 | 34.2%), Latin America (13 | 34.2%), and Mexico (13 | 34.2%), together accounting for 102.6% of all Lakeview residents.
| Immigration Origin | # Population | % Population |
| Central America | 13 | 34.2% |
| Latin America | 13 | 34.2% |
| Mexico | 13 | 34.2% | View All 3 Rows |
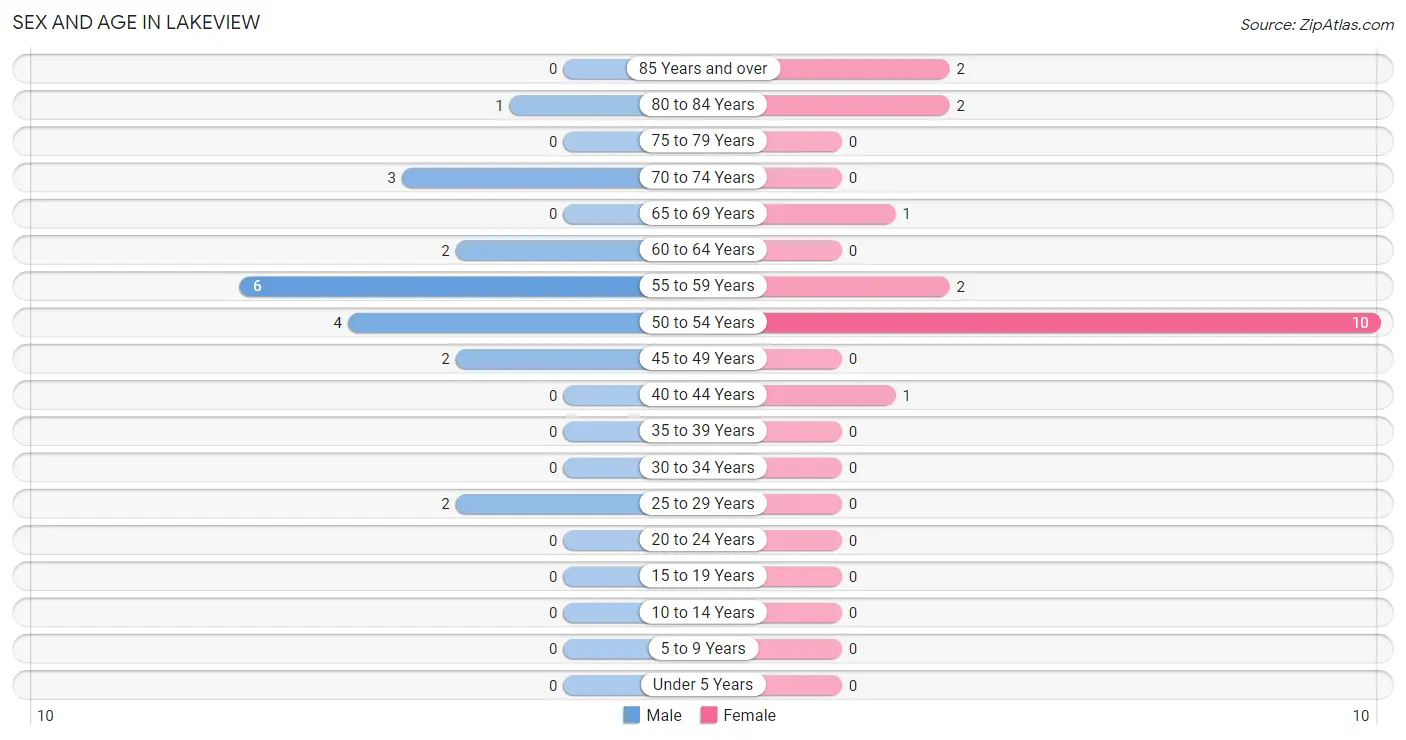
Sex and Age in Lakeview
Sex and Age in Lakeview
The most populous age groups in Lakeview are 55 to 59 Years (6 | 30.0%) for men and 50 to 54 Years (10 | 55.6%) for women.
| Age Bracket | Male | Female |
| Under 5 Years | 0 (0.0%) | 0 (0.0%) |
| 5 to 9 Years | 0 (0.0%) | 0 (0.0%) |
| 10 to 14 Years | 0 (0.0%) | 0 (0.0%) |
| 15 to 19 Years | 0 (0.0%) | 0 (0.0%) |
| 20 to 24 Years | 0 (0.0%) | 0 (0.0%) |
| 25 to 29 Years | 2 (10.0%) | 0 (0.0%) |
| 30 to 34 Years | 0 (0.0%) | 0 (0.0%) |
| 35 to 39 Years | 0 (0.0%) | 0 (0.0%) |
| 40 to 44 Years | 0 (0.0%) | 1 (5.6%) |
| 45 to 49 Years | 2 (10.0%) | 0 (0.0%) |
| 50 to 54 Years | 4 (20.0%) | 10 (55.6%) |
| 55 to 59 Years | 6 (30.0%) | 2 (11.1%) |
| 60 to 64 Years | 2 (10.0%) | 0 (0.0%) |
| 65 to 69 Years | 0 (0.0%) | 1 (5.6%) |
| 70 to 74 Years | 3 (15.0%) | 0 (0.0%) |
| 75 to 79 Years | 0 (0.0%) | 0 (0.0%) |
| 80 to 84 Years | 1 (5.0%) | 2 (11.1%) |
| 85 Years and over | 0 (0.0%) | 2 (11.1%) |
| Total | 20 (100.0%) | 18 (100.0%) |
Families and Households in Lakeview
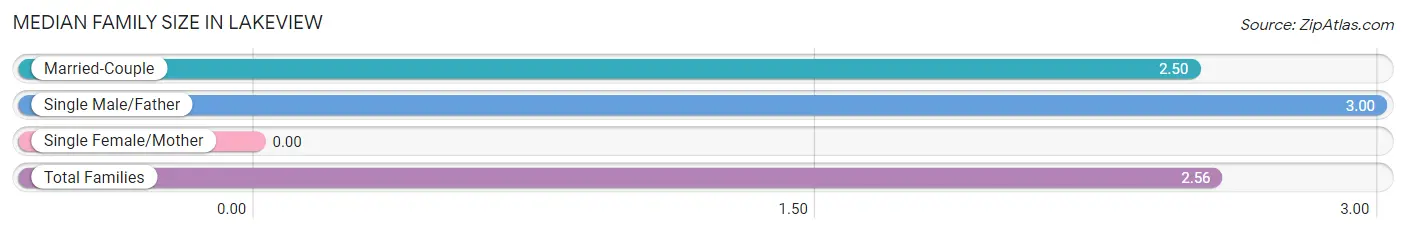
Median Family Size in Lakeview
| Family Type | # Families | Family Size |
| Married-Couple | 8 (88.9%) | 2.50 |
| Single Male/Father | 1 (11.1%) | 3.00 |
| Single Female/Mother | 0 (0.0%) | - |
| Total Families | 9 (100.0%) | 2.56 |
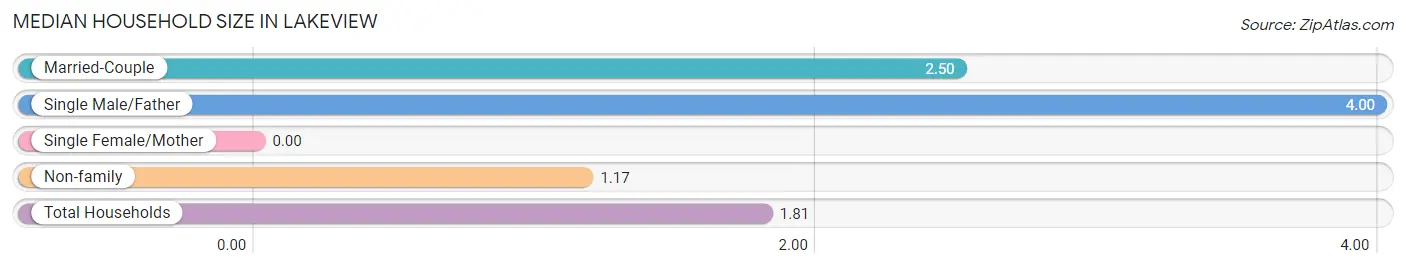
Median Household Size in Lakeview
| Household Type | # Households | Household Size |
| Married-Couple | 8 (38.1%) | 2.50 |
| Single Male/Father | 1 (4.8%) | 4.00 |
| Single Female/Mother | 0 (0.0%) | - |
| Non-family | 12 (57.1%) | 1.17 |
| Total Households | 21 (100.0%) | 1.81 |
Household Size by Marriage Status in Lakeview
Out of a total of 21 households in Lakeview, 9 (42.9%) are family households, while 12 (57.1%) are nonfamily households. The most numerous type of family households are 2-person households, comprising 8, and the most common type of nonfamily households are 1-person households, comprising 10.
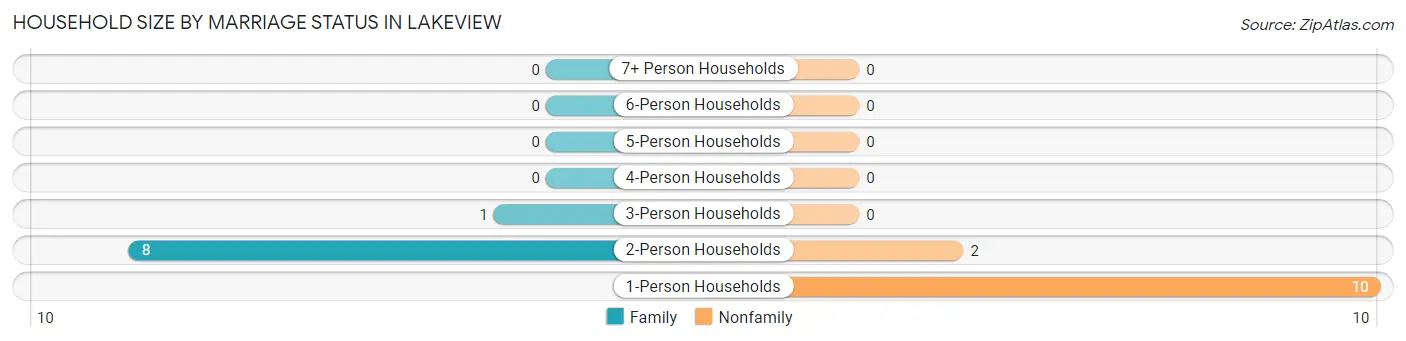
| Household Size | Family Households | Nonfamily Households |
| 1-Person Households | - | 10 (47.6%) |
| 2-Person Households | 8 (38.1%) | 2 (9.5%) |
| 3-Person Households | 1 (4.8%) | 0 (0.0%) |
| 4-Person Households | 0 (0.0%) | 0 (0.0%) |
| 5-Person Households | 0 (0.0%) | 0 (0.0%) |
| 6-Person Households | 0 (0.0%) | 0 (0.0%) |
| 7+ Person Households | 0 (0.0%) | 0 (0.0%) |
| Total | 9 (42.9%) | 12 (57.1%) |
Female Fertility in Lakeview
Fertility by Age in Lakeview
| Age Bracket | Women with Births | Births / 1,000 Women |
| 15 to 19 years | 0 (0.0%) | 0.0 |
| 20 to 34 years | 0 (0.0%) | 0.0 |
| 35 to 50 years | 0 (0.0%) | 0.0 |
| Total | 0 (0.0%) | 0.0 |
Fertility by Age by Marriage Status in Lakeview
| Age Bracket | Married | Unmarried |
| 15 to 19 years | 0 (0.0%) | 0 (0.0%) |
| 20 to 34 years | 0 (0.0%) | 0 (0.0%) |
| 35 to 50 years | 0 (0.0%) | 0 (0.0%) |
| Total | 0 (0.0%) | 0 (0.0%) |
Fertility by Education in Lakeview
| Educational Attainment | Women with Births | Births / 1,000 Women |
| Less than High School | 0 (0.0%) | 0.0 |
| High School Diploma | 0 (0.0%) | 0.0 |
| College or Associate's Degree | 0 (0.0%) | 0.0 |
| Bachelor's Degree | 0 (0.0%) | 0.0 |
| Graduate Degree | 0 (0.0%) | 0.0 |
| Total | 0 (0.0%) | 0.0 |
Fertility by Education by Marriage Status in Lakeview
| Educational Attainment | Married | Unmarried |
| Less than High School | 0 (0.0%) | 0 (0.0%) |
| High School Diploma | 0 (0.0%) | 0 (0.0%) |
| College or Associate's Degree | 0 (0.0%) | 0 (0.0%) |
| Bachelor's Degree | 0 (0.0%) | 0 (0.0%) |
| Graduate Degree | 0 (0.0%) | 0 (0.0%) |
| Total | 0 (0.0%) | 0 (0.0%) |
Employment Characteristics in Lakeview
Employment by Class of Employer in Lakeview
Among the 26 employed individuals in Lakeview, private company employees (20 | 76.9%), self-employed (not incorporated) (4 | 15.4%), and local government employees (2 | 7.7%) make up the most common classes of employment.
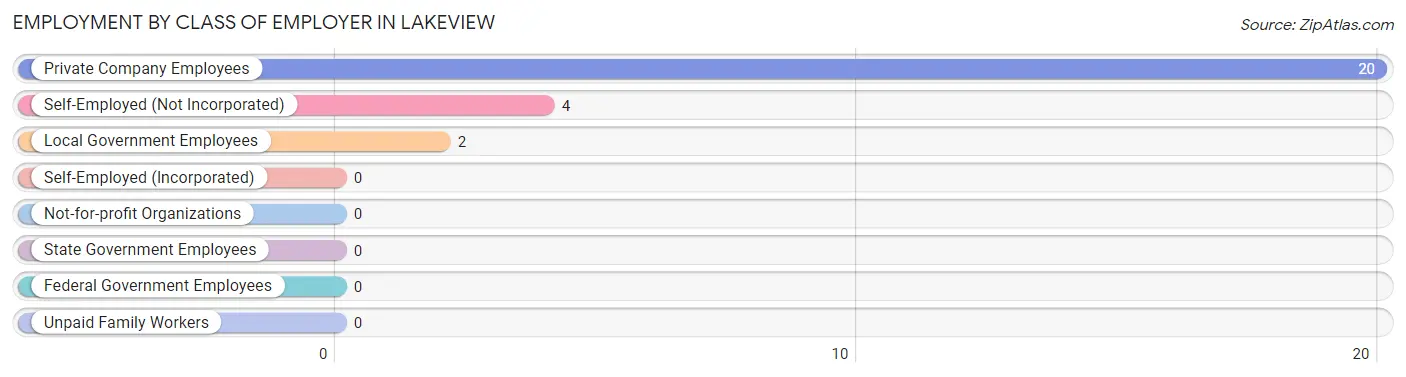
| Employer Class | # Employees | % Employees |
| Private Company Employees | 20 | 76.9% |
| Self-Employed (Incorporated) | 0 | 0.0% |
| Self-Employed (Not Incorporated) | 4 | 15.4% |
| Not-for-profit Organizations | 0 | 0.0% |
| Local Government Employees | 2 | 7.7% |
| State Government Employees | 0 | 0.0% |
| Federal Government Employees | 0 | 0.0% |
| Unpaid Family Workers | 0 | 0.0% |
| Total | 26 | 100.0% |
Employment Status by Age in Lakeview
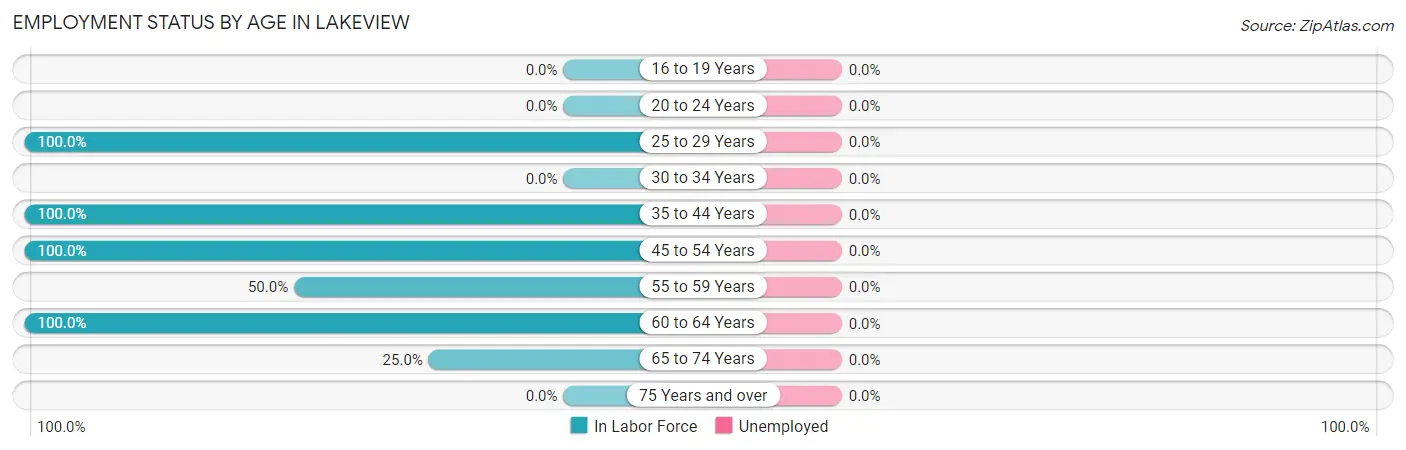
| Age Bracket | In Labor Force | Unemployed |
| 16 to 19 Years | 0 (0.0%) | 0 (0.0%) |
| 20 to 24 Years | 0 (0.0%) | 0 (0.0%) |
| 25 to 29 Years | 2 (100.0%) | 0 (0.0%) |
| 30 to 34 Years | 0 (0.0%) | 0 (0.0%) |
| 35 to 44 Years | 1 (100.0%) | 0 (0.0%) |
| 45 to 54 Years | 16 (100.0%) | 0 (0.0%) |
| 55 to 59 Years | 4 (50.0%) | 0 (0.0%) |
| 60 to 64 Years | 2 (100.0%) | 0 (0.0%) |
| 65 to 74 Years | 1 (25.0%) | 0 (0.0%) |
| 75 Years and over | 0 (0.0%) | 0 (0.0%) |
| Total | 26 (68.4%) | 0 (0.0%) |
Employment Status by Educational Attainment in Lakeview
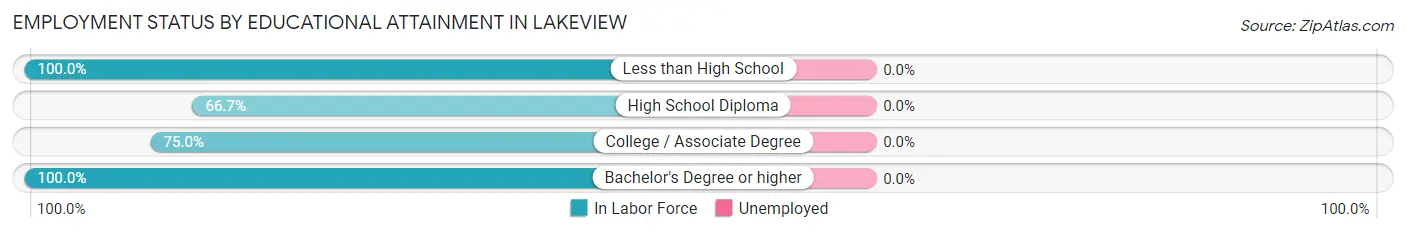
| Educational Attainment | In Labor Force | Unemployed |
| Less than High School | 13 (100.0%) | 0 (0.0%) |
| High School Diploma | 4 (66.7%) | 0 (0.0%) |
| College / Associate Degree | 6 (75.0%) | 0 (0.0%) |
| Bachelor's Degree or higher | 2 (100.0%) | 0 (0.0%) |
| Total | 25 (86.2%) | 0 (0.0%) |
Employment Occupations by Sex in Lakeview
Management, Business, Science and Arts Occupations
The most common Management, Business, Science and Arts occupations in Lakeview are Management (5 | 19.2%), Community & Social Service (1 | 3.8%), and Education Instruction & Library (1 | 3.8%).
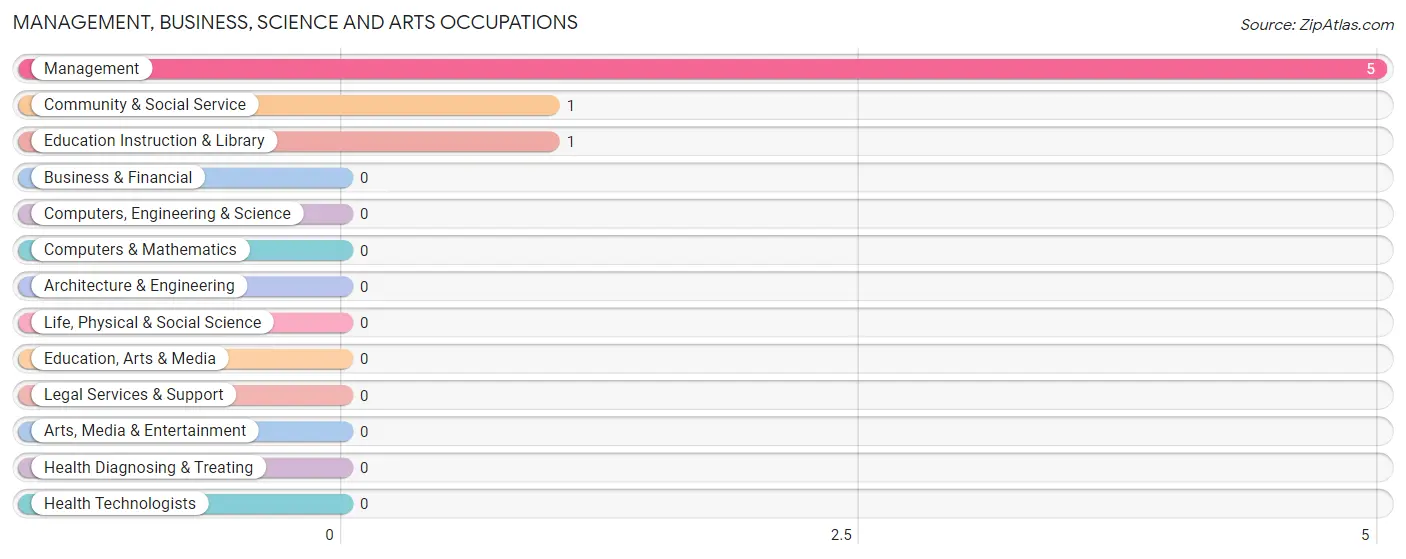
Management, Business, Science and Arts Occupations by Sex
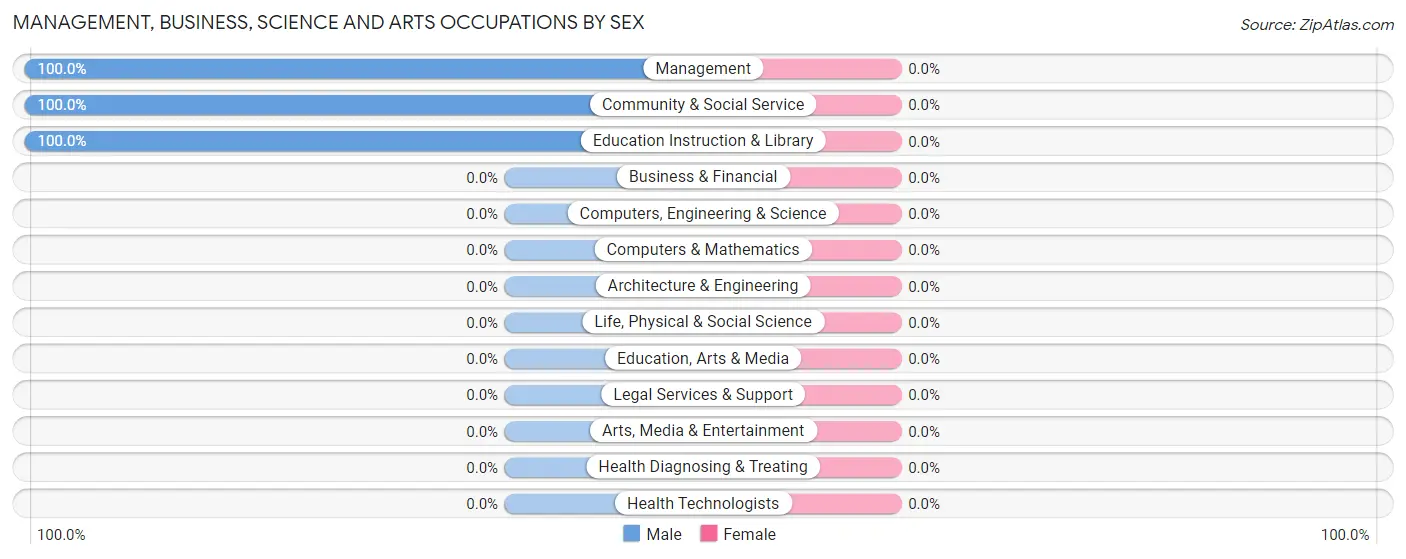
| Occupation | Male | Female |
| Management | 5 (100.0%) | 0 (0.0%) |
| Business & Financial | 0 (0.0%) | 0 (0.0%) |
| Computers, Engineering & Science | 0 (0.0%) | 0 (0.0%) |
| Computers & Mathematics | 0 (0.0%) | 0 (0.0%) |
| Architecture & Engineering | 0 (0.0%) | 0 (0.0%) |
| Life, Physical & Social Science | 0 (0.0%) | 0 (0.0%) |
| Community & Social Service | 1 (100.0%) | 0 (0.0%) |
| Education, Arts & Media | 0 (0.0%) | 0 (0.0%) |
| Legal Services & Support | 0 (0.0%) | 0 (0.0%) |
| Education Instruction & Library | 1 (100.0%) | 0 (0.0%) |
| Arts, Media & Entertainment | 0 (0.0%) | 0 (0.0%) |
| Health Diagnosing & Treating | 0 (0.0%) | 0 (0.0%) |
| Health Technologists | 0 (0.0%) | 0 (0.0%) |
| Total (Category) | 6 (100.0%) | 0 (0.0%) |
| Total (Overall) | 15 (57.7%) | 11 (42.3%) |
Services Occupations
The most common Services occupations in Lakeview are Cleaning & Maintenance (9 | 34.6%), and Personal Care & Service (1 | 3.8%).
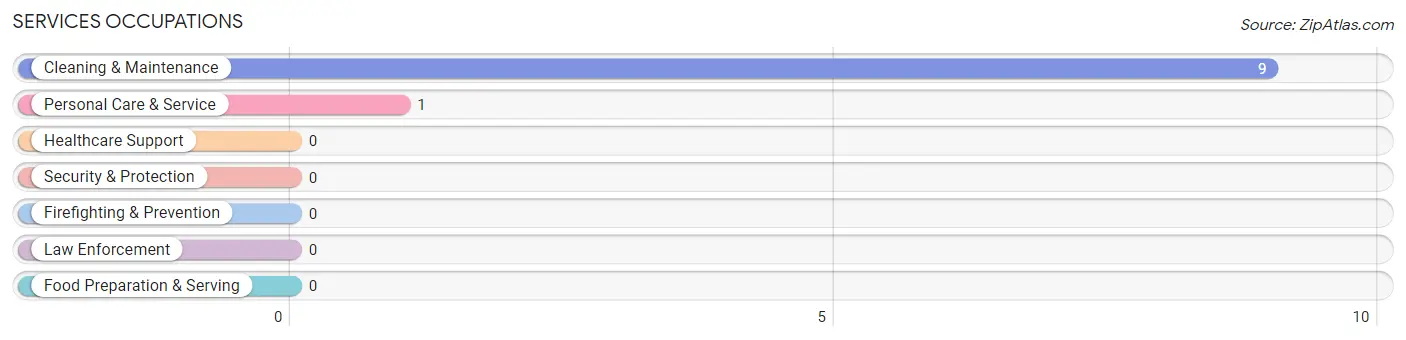
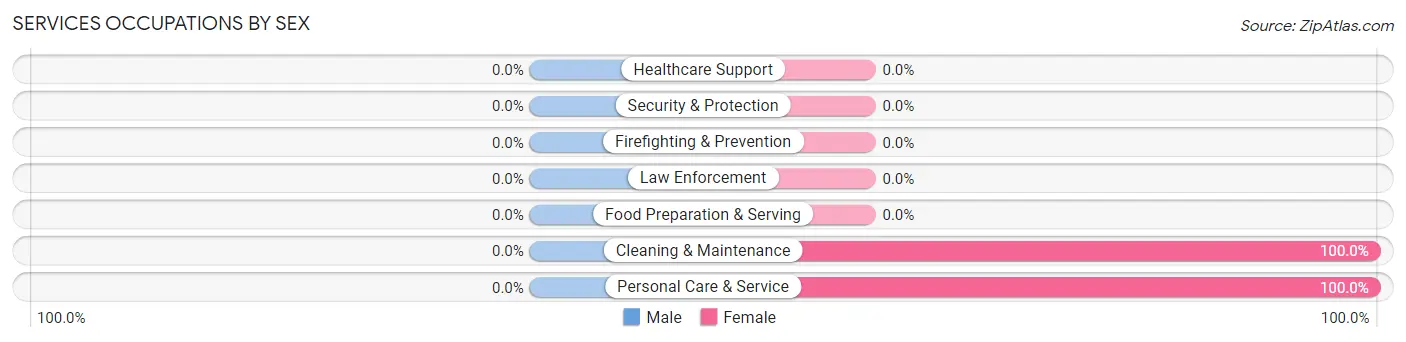
Services Occupations by Sex
| Occupation | Male | Female |
| Healthcare Support | 0 (0.0%) | 0 (0.0%) |
| Security & Protection | 0 (0.0%) | 0 (0.0%) |
| Firefighting & Prevention | 0 (0.0%) | 0 (0.0%) |
| Law Enforcement | 0 (0.0%) | 0 (0.0%) |
| Food Preparation & Serving | 0 (0.0%) | 0 (0.0%) |
| Cleaning & Maintenance | 0 (0.0%) | 9 (100.0%) |
| Personal Care & Service | 0 (0.0%) | 1 (100.0%) |
| Total (Category) | 0 (0.0%) | 10 (100.0%) |
| Total (Overall) | 15 (57.7%) | 11 (42.3%) |
Sales and Office Occupations

Sales and Office Occupations by Sex

| Occupation | Male | Female |
| Sales & Related | 0 (0.0%) | 0 (0.0%) |
| Office & Administration | 0 (0.0%) | 0 (0.0%) |
| Total (Category) | 0 (0.0%) | 0 (0.0%) |
| Total (Overall) | 15 (57.7%) | 11 (42.3%) |
Natural Resources, Construction and Maintenance Occupations
The most common Natural Resources, Construction and Maintenance occupations in Lakeview are Farming, Fishing & Forestry (4 | 15.4%), and Construction & Extraction (1 | 3.8%).
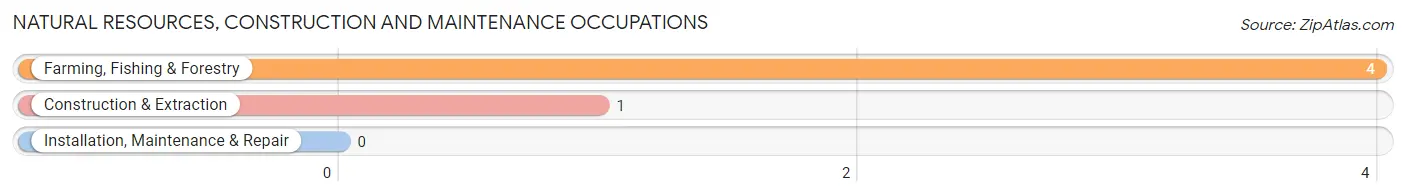
Natural Resources, Construction and Maintenance Occupations by Sex
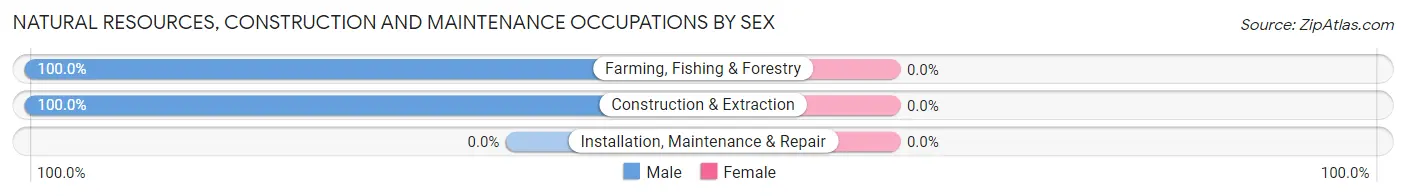
| Occupation | Male | Female |
| Farming, Fishing & Forestry | 4 (100.0%) | 0 (0.0%) |
| Construction & Extraction | 1 (100.0%) | 0 (0.0%) |
| Installation, Maintenance & Repair | 0 (0.0%) | 0 (0.0%) |
| Total (Category) | 5 (100.0%) | 0 (0.0%) |
| Total (Overall) | 15 (57.7%) | 11 (42.3%) |
Production, Transportation and Moving Occupations
The most common Production, Transportation and Moving occupations in Lakeview are Transportation (3 | 11.5%), and Production (2 | 7.7%).
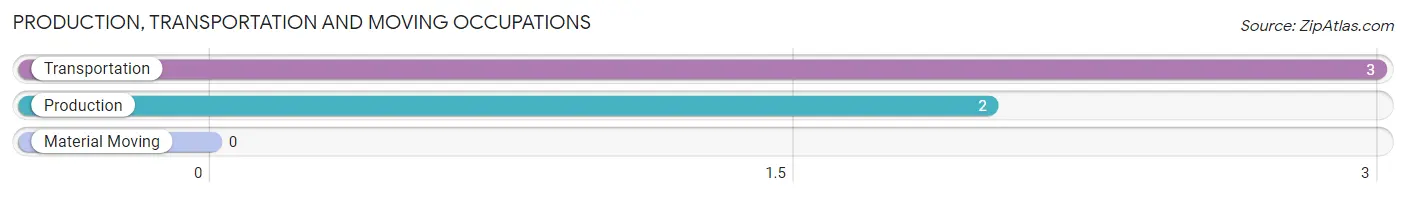
Production, Transportation and Moving Occupations by Sex
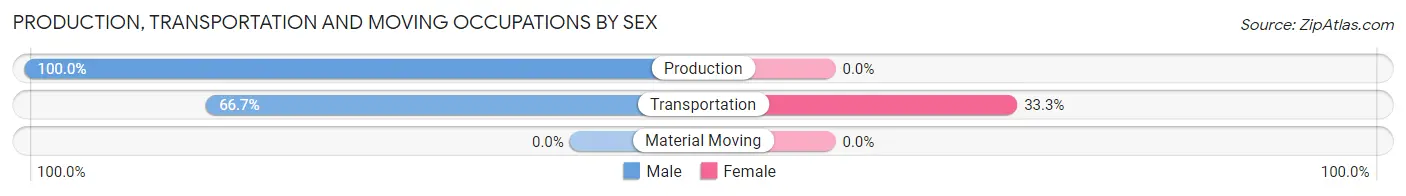
| Occupation | Male | Female |
| Production | 2 (100.0%) | 0 (0.0%) |
| Transportation | 2 (66.7%) | 1 (33.3%) |
| Material Moving | 0 (0.0%) | 0 (0.0%) |
| Total (Category) | 4 (80.0%) | 1 (20.0%) |
| Total (Overall) | 15 (57.7%) | 11 (42.3%) |
Employment Industries by Sex in Lakeview
Employment Industries in Lakeview
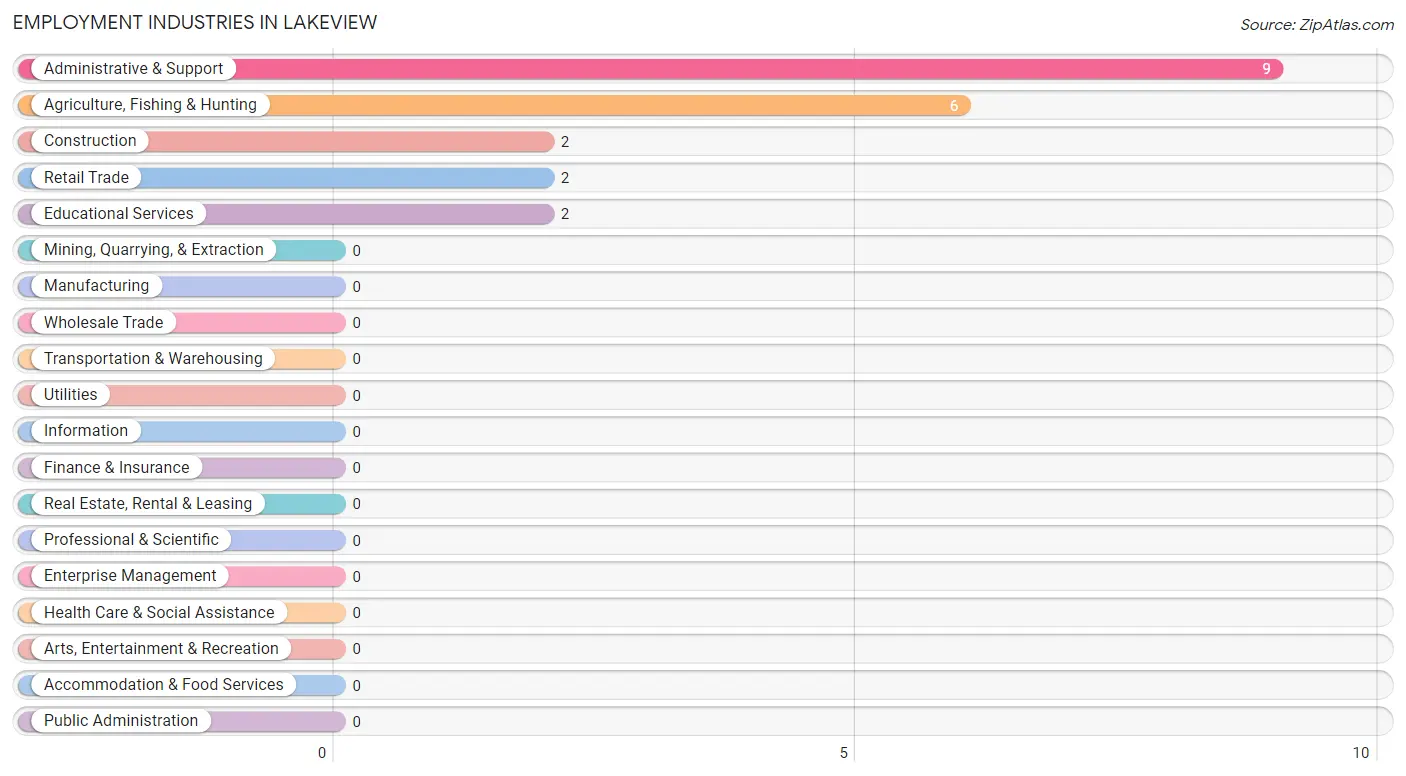
The major employment industries in Lakeview include Administrative & Support (9 | 34.6%), Agriculture, Fishing & Hunting (6 | 23.1%), Construction (2 | 7.7%), Retail Trade (2 | 7.7%), and Educational Services (2 | 7.7%).
Employment Industries by Sex in Lakeview
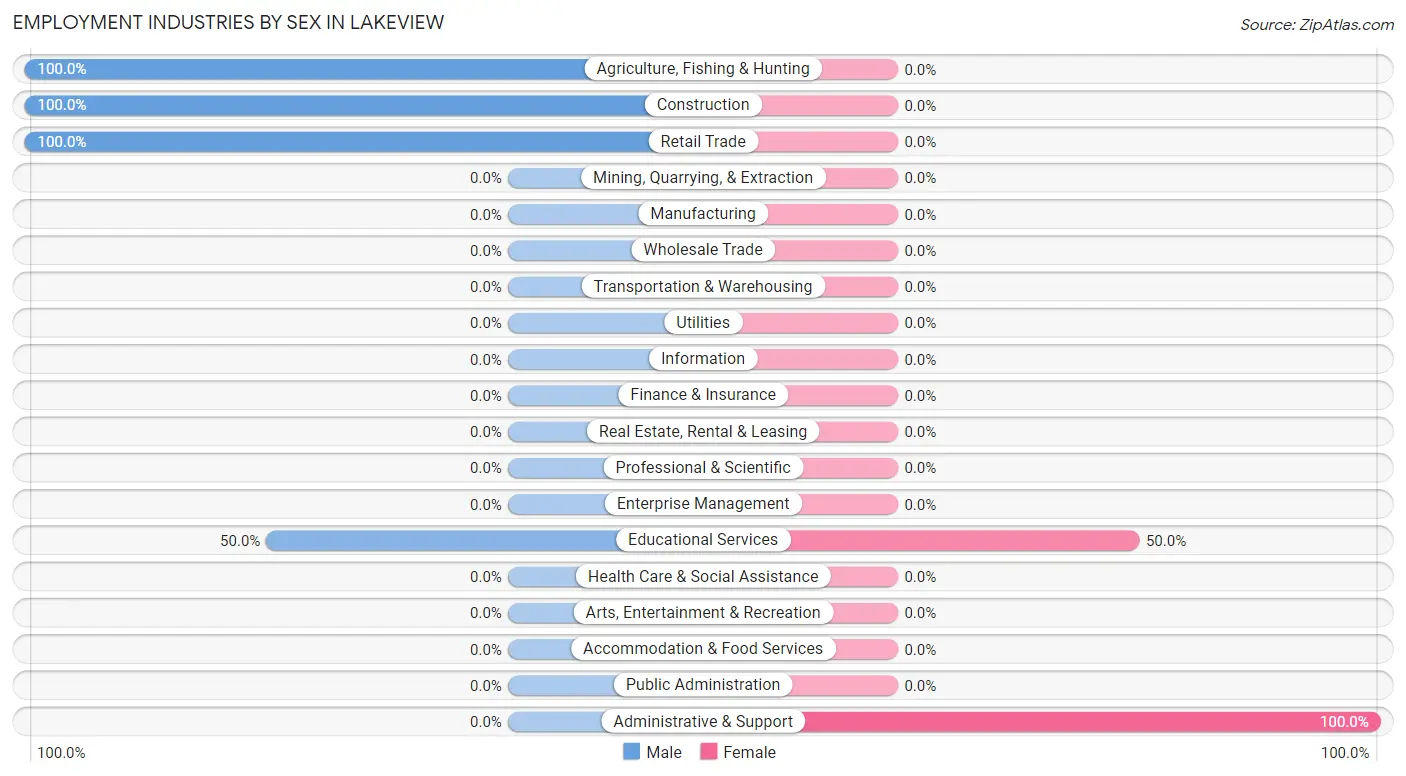
The Lakeview industries that see more men than women are Agriculture, Fishing & Hunting (100.0%), Construction (100.0%), and Retail Trade (100.0%), whereas the industries that tend to have a higher number of women are Administrative & Support (100.0%), and Educational Services (50.0%).
| Industry | Male | Female |
| Agriculture, Fishing & Hunting | 6 (100.0%) | 0 (0.0%) |
| Mining, Quarrying, & Extraction | 0 (0.0%) | 0 (0.0%) |
| Construction | 2 (100.0%) | 0 (0.0%) |
| Manufacturing | 0 (0.0%) | 0 (0.0%) |
| Wholesale Trade | 0 (0.0%) | 0 (0.0%) |
| Retail Trade | 2 (100.0%) | 0 (0.0%) |
| Transportation & Warehousing | 0 (0.0%) | 0 (0.0%) |
| Utilities | 0 (0.0%) | 0 (0.0%) |
| Information | 0 (0.0%) | 0 (0.0%) |
| Finance & Insurance | 0 (0.0%) | 0 (0.0%) |
| Real Estate, Rental & Leasing | 0 (0.0%) | 0 (0.0%) |
| Professional & Scientific | 0 (0.0%) | 0 (0.0%) |
| Enterprise Management | 0 (0.0%) | 0 (0.0%) |
| Administrative & Support | 0 (0.0%) | 9 (100.0%) |
| Educational Services | 1 (50.0%) | 1 (50.0%) |
| Health Care & Social Assistance | 0 (0.0%) | 0 (0.0%) |
| Arts, Entertainment & Recreation | 0 (0.0%) | 0 (0.0%) |
| Accommodation & Food Services | 0 (0.0%) | 0 (0.0%) |
| Public Administration | 0 (0.0%) | 0 (0.0%) |
| Total | 15 (57.7%) | 11 (42.3%) |
Education in Lakeview
School Enrollment in Lakeview
| School Level | # Students | % Students |
| Nursery / Preschool | 0 | 0.0% |
| Kindergarten | 0 | 0.0% |
| Elementary School | 0 | 0.0% |
| Middle School | 0 | 0.0% |
| High School | 0 | 0.0% |
| College / Undergraduate | 0 | 0.0% |
| Graduate / Professional | 0 | 0.0% |
| Total | 0 | 0.0% |
School Enrollment by Age by Funding Source in Lakeview
| Age Bracket | Public School | Private School |
| 3 to 4 Year Olds | 0 (0.0%) | 0 (0.0%) |
| 5 to 9 Year Old | 0 (0.0%) | 0 (0.0%) |
| 10 to 14 Year Olds | 0 (0.0%) | 0 (0.0%) |
| 15 to 17 Year Olds | 0 (0.0%) | 0 (0.0%) |
| 18 to 19 Year Olds | 0 (0.0%) | 0 (0.0%) |
| 20 to 24 Year Olds | 0 (0.0%) | 0 (0.0%) |
| 25 to 34 Year Olds | 0 (0.0%) | 0 (0.0%) |
| 35 Years and over | 0 (0.0%) | 0 (0.0%) |
| Total | 0 (0.0%) | 0 (0.0%) |
Educational Attainment by Field of Study in Lakeview
Communications (2 | 50.0%), science & technology (1 | 25.0%), and education (1 | 25.0%) are the most common fields of study among 4 individuals in Lakeview who have obtained a bachelor's degree or higher.
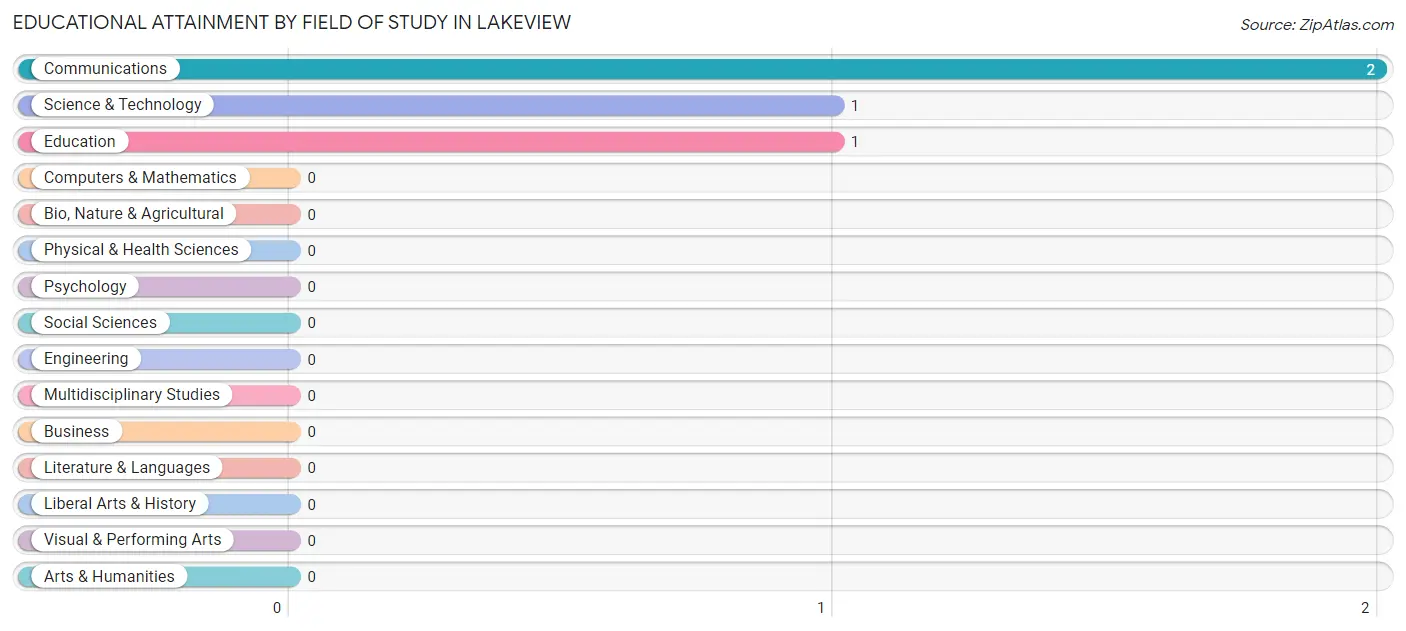
| Field of Study | # Graduates | % Graduates |
| Computers & Mathematics | 0 | 0.0% |
| Bio, Nature & Agricultural | 0 | 0.0% |
| Physical & Health Sciences | 0 | 0.0% |
| Psychology | 0 | 0.0% |
| Social Sciences | 0 | 0.0% |
| Engineering | 0 | 0.0% |
| Multidisciplinary Studies | 0 | 0.0% |
| Science & Technology | 1 | 25.0% |
| Business | 0 | 0.0% |
| Education | 1 | 25.0% |
| Literature & Languages | 0 | 0.0% |
| Liberal Arts & History | 0 | 0.0% |
| Visual & Performing Arts | 0 | 0.0% |
| Communications | 2 | 50.0% |
| Arts & Humanities | 0 | 0.0% |
| Total | 4 | 100.0% |
Transportation & Commute in Lakeview
Vehicle Availability by Sex in Lakeview
The most prevalent vehicle ownership categories in Lakeview are males with 3 vehicles (8, accounting for 53.3%) and females with 3 vehicles (9, making up 72.7%).
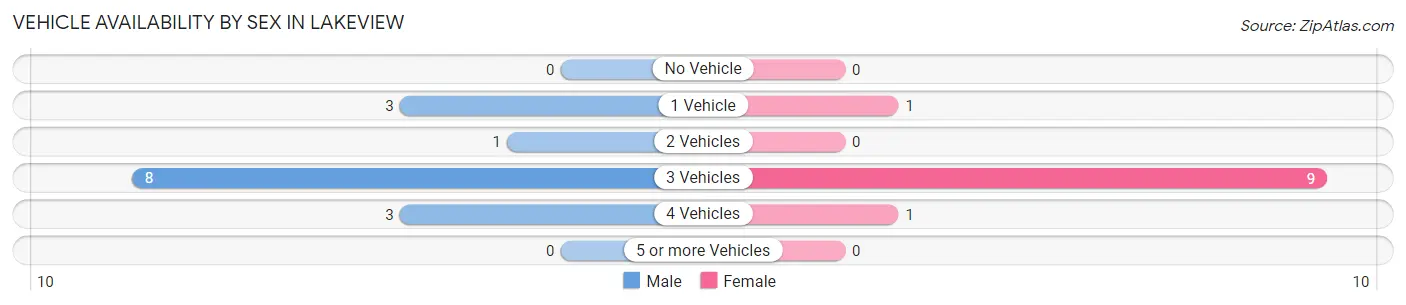
| Vehicles Available | Male | Female |
| No Vehicle | 0 (0.0%) | 0 (0.0%) |
| 1 Vehicle | 3 (20.0%) | 1 (9.1%) |
| 2 Vehicles | 1 (6.7%) | 0 (0.0%) |
| 3 Vehicles | 8 (53.3%) | 9 (81.8%) |
| 4 Vehicles | 3 (20.0%) | 1 (9.1%) |
| 5 or more Vehicles | 0 (0.0%) | 0 (0.0%) |
| Total | 15 (100.0%) | 11 (100.0%) |
Commute Time in Lakeview
The most frequently occuring commute durations in Lakeview are less than 5 minutes (14 commuters, 53.8%), 10 to 14 minutes (6 commuters, 23.1%), and 30 to 34 minutes (3 commuters, 11.5%).
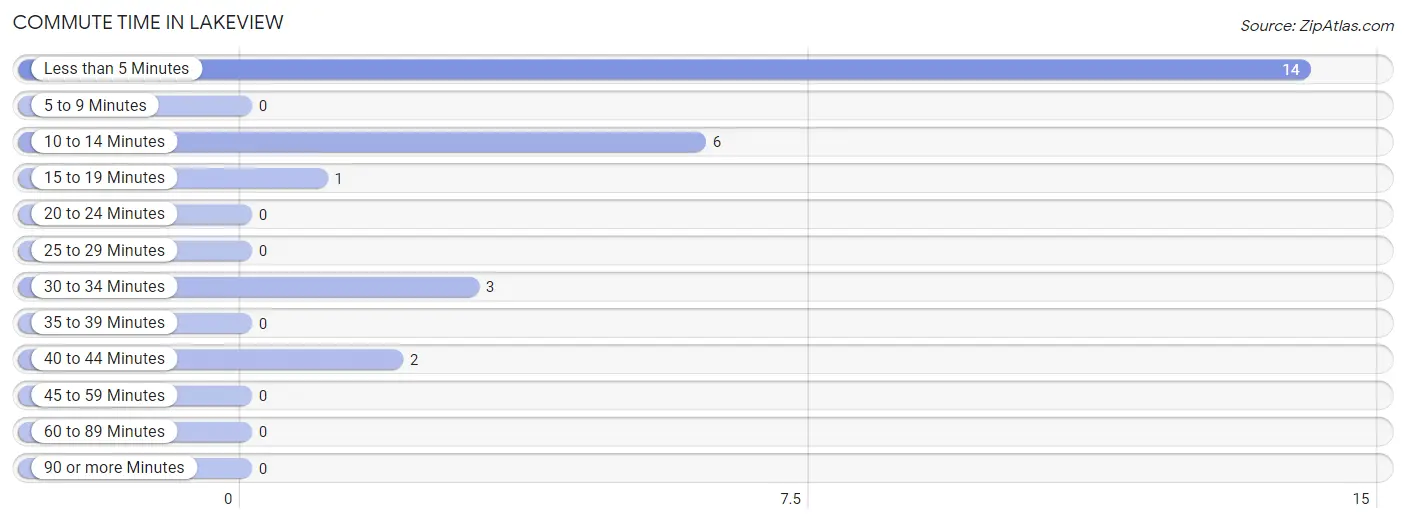
| Commute Time | # Commuters | % Commuters |
| Less than 5 Minutes | 14 | 53.8% |
| 5 to 9 Minutes | 0 | 0.0% |
| 10 to 14 Minutes | 6 | 23.1% |
| 15 to 19 Minutes | 1 | 3.8% |
| 20 to 24 Minutes | 0 | 0.0% |
| 25 to 29 Minutes | 0 | 0.0% |
| 30 to 34 Minutes | 3 | 11.5% |
| 35 to 39 Minutes | 0 | 0.0% |
| 40 to 44 Minutes | 2 | 7.7% |
| 45 to 59 Minutes | 0 | 0.0% |
| 60 to 89 Minutes | 0 | 0.0% |
| 90 or more Minutes | 0 | 0.0% |
Commute Time by Sex in Lakeview
The most common commute times in Lakeview are 10 to 14 minutes (6 commuters, 40.0%) for males and less than 5 minutes (10 commuters, 90.9%) for females.
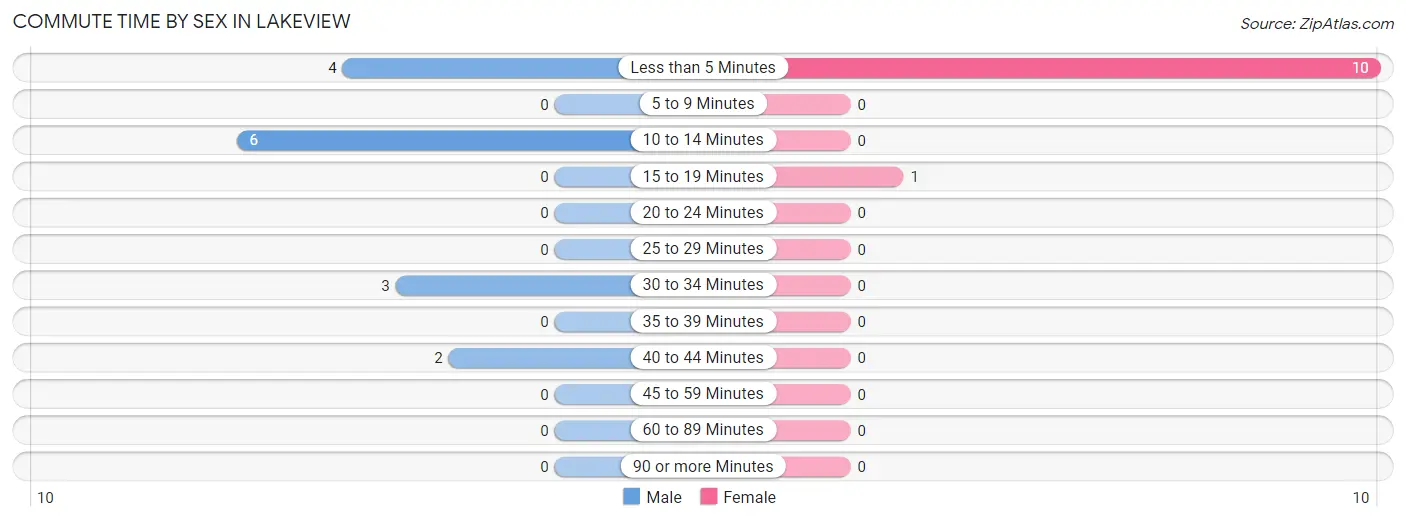
| Commute Time | Male | Female |
| Less than 5 Minutes | 4 (26.7%) | 10 (90.9%) |
| 5 to 9 Minutes | 0 (0.0%) | 0 (0.0%) |
| 10 to 14 Minutes | 6 (40.0%) | 0 (0.0%) |
| 15 to 19 Minutes | 0 (0.0%) | 1 (9.1%) |
| 20 to 24 Minutes | 0 (0.0%) | 0 (0.0%) |
| 25 to 29 Minutes | 0 (0.0%) | 0 (0.0%) |
| 30 to 34 Minutes | 3 (20.0%) | 0 (0.0%) |
| 35 to 39 Minutes | 0 (0.0%) | 0 (0.0%) |
| 40 to 44 Minutes | 2 (13.3%) | 0 (0.0%) |
| 45 to 59 Minutes | 0 (0.0%) | 0 (0.0%) |
| 60 to 89 Minutes | 0 (0.0%) | 0 (0.0%) |
| 90 or more Minutes | 0 (0.0%) | 0 (0.0%) |
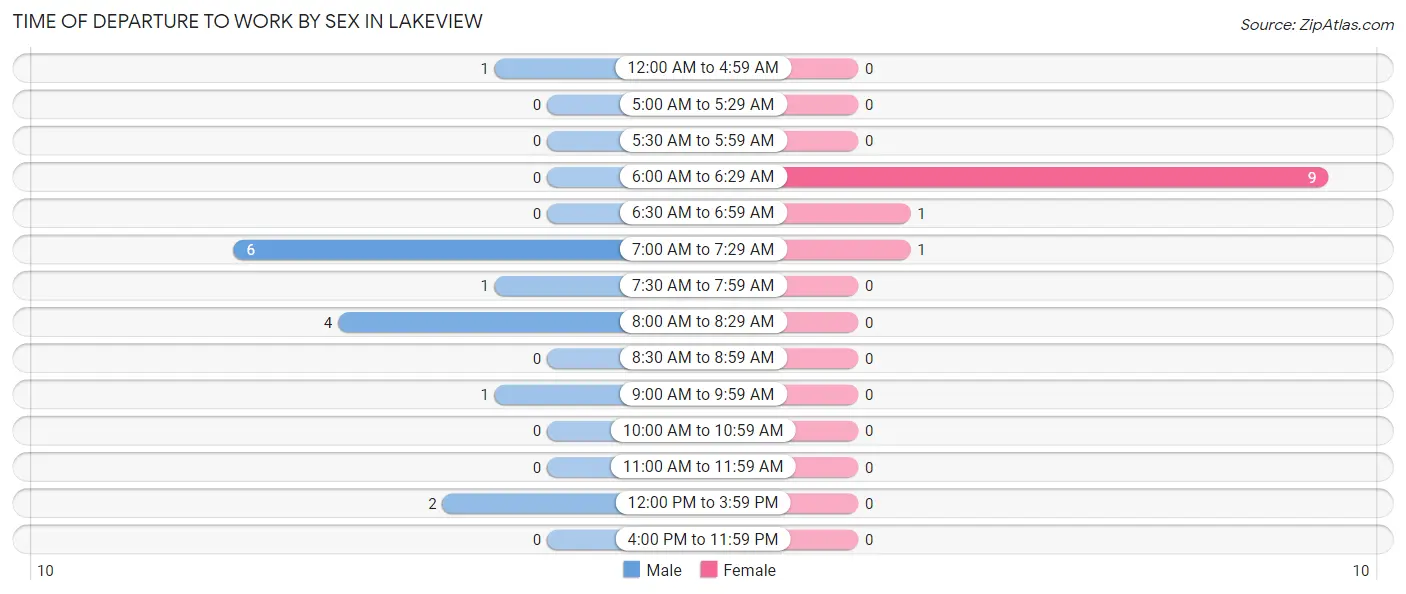
Time of Departure to Work by Sex in Lakeview
The most frequent times of departure to work in Lakeview are 7:00 AM to 7:29 AM (6, 40.0%) for males and 6:00 AM to 6:29 AM (9, 81.8%) for females.
| Time of Departure | Male | Female |
| 12:00 AM to 4:59 AM | 1 (6.7%) | 0 (0.0%) |
| 5:00 AM to 5:29 AM | 0 (0.0%) | 0 (0.0%) |
| 5:30 AM to 5:59 AM | 0 (0.0%) | 0 (0.0%) |
| 6:00 AM to 6:29 AM | 0 (0.0%) | 9 (81.8%) |
| 6:30 AM to 6:59 AM | 0 (0.0%) | 1 (9.1%) |
| 7:00 AM to 7:29 AM | 6 (40.0%) | 1 (9.1%) |
| 7:30 AM to 7:59 AM | 1 (6.7%) | 0 (0.0%) |
| 8:00 AM to 8:29 AM | 4 (26.7%) | 0 (0.0%) |
| 8:30 AM to 8:59 AM | 0 (0.0%) | 0 (0.0%) |
| 9:00 AM to 9:59 AM | 1 (6.7%) | 0 (0.0%) |
| 10:00 AM to 10:59 AM | 0 (0.0%) | 0 (0.0%) |
| 11:00 AM to 11:59 AM | 0 (0.0%) | 0 (0.0%) |
| 12:00 PM to 3:59 PM | 2 (13.3%) | 0 (0.0%) |
| 4:00 PM to 11:59 PM | 0 (0.0%) | 0 (0.0%) |
| Total | 15 (100.0%) | 11 (100.0%) |
Housing Occupancy in Lakeview
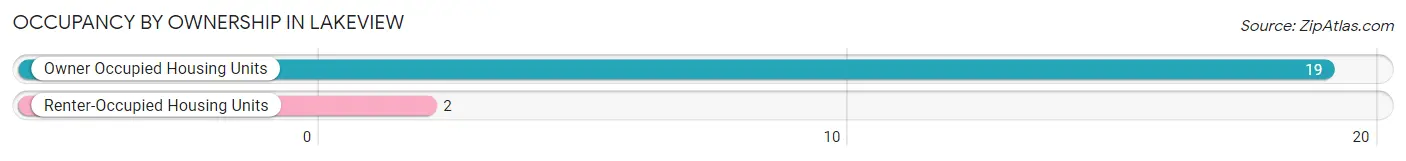
Occupancy by Ownership in Lakeview
Of the total 21 dwellings in Lakeview, owner-occupied units account for 19 (90.5%), while renter-occupied units make up 2 (9.5%).
| Occupancy | # Housing Units | % Housing Units |
| Owner Occupied Housing Units | 19 | 90.5% |
| Renter-Occupied Housing Units | 2 | 9.5% |
| Total Occupied Housing Units | 21 | 100.0% |
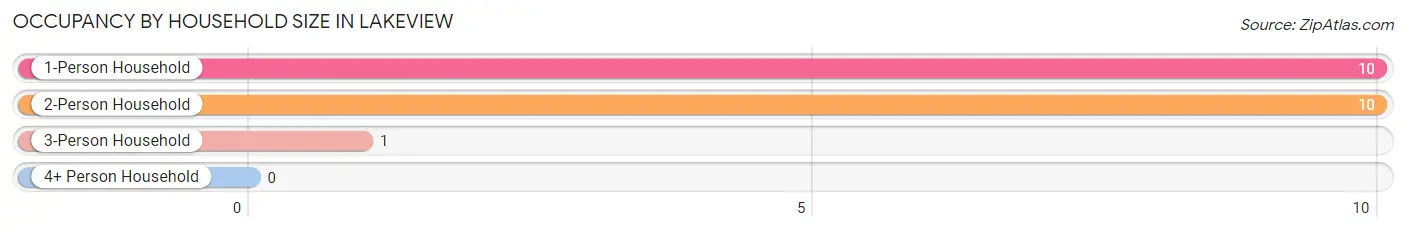
Occupancy by Household Size in Lakeview
| Household Size | # Housing Units | % Housing Units |
| 1-Person Household | 10 | 47.6% |
| 2-Person Household | 10 | 47.6% |
| 3-Person Household | 1 | 4.8% |
| 4+ Person Household | 0 | 0.0% |
| Total Housing Units | 21 | 100.0% |
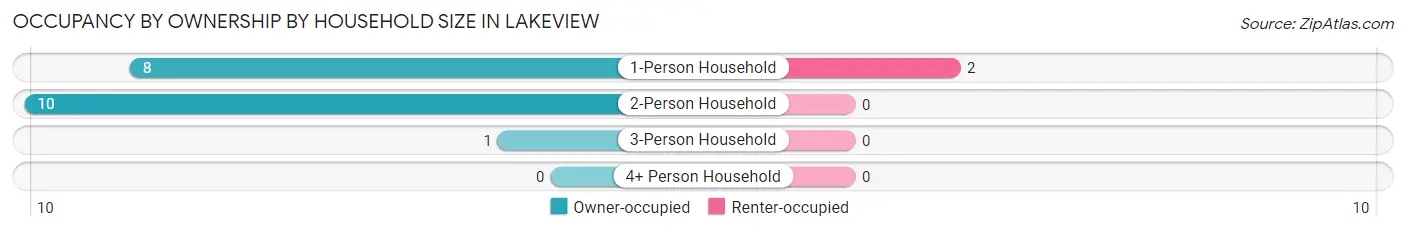
Occupancy by Ownership by Household Size in Lakeview
| Household Size | Owner-occupied | Renter-occupied |
| 1-Person Household | 8 (80.0%) | 2 (20.0%) |
| 2-Person Household | 10 (100.0%) | 0 (0.0%) |
| 3-Person Household | 1 (100.0%) | 0 (0.0%) |
| 4+ Person Household | 0 (0.0%) | 0 (0.0%) |
| Total Housing Units | 19 (90.5%) | 2 (9.5%) |
Occupancy by Educational Attainment in Lakeview
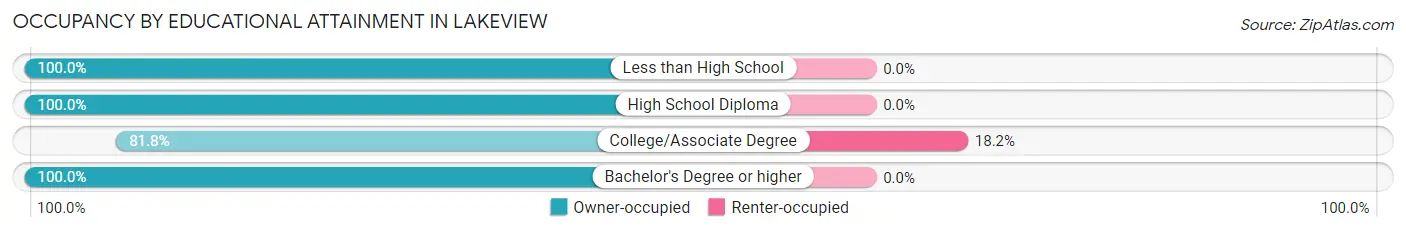
| Household Size | Owner-occupied | Renter-occupied |
| Less than High School | 4 (100.0%) | 0 (0.0%) |
| High School Diploma | 5 (100.0%) | 0 (0.0%) |
| College/Associate Degree | 9 (81.8%) | 2 (18.2%) |
| Bachelor's Degree or higher | 1 (100.0%) | 0 (0.0%) |
Occupancy by Age of Householder in Lakeview
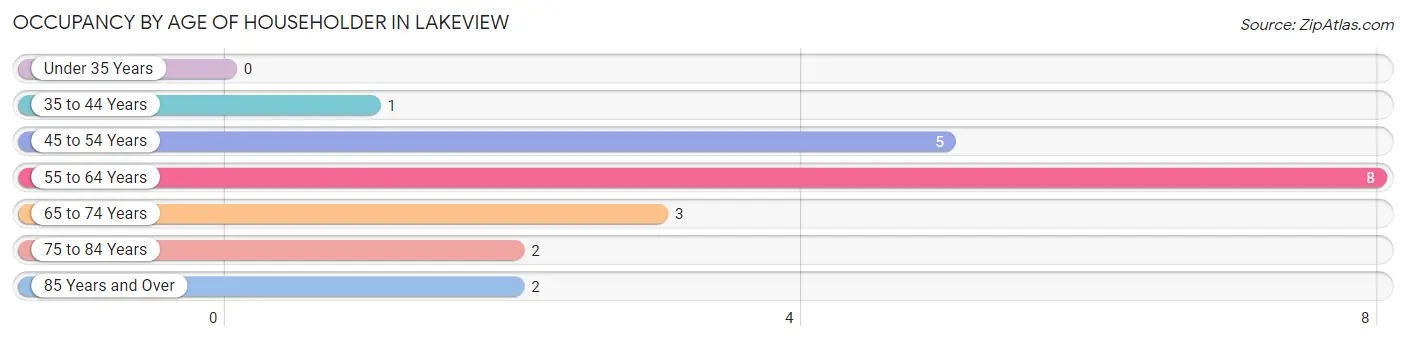
| Age Bracket | # Households | % Households |
| Under 35 Years | 0 | 0.0% |
| 35 to 44 Years | 1 | 4.8% |
| 45 to 54 Years | 5 | 23.8% |
| 55 to 64 Years | 8 | 38.1% |
| 65 to 74 Years | 3 | 14.3% |
| 75 to 84 Years | 2 | 9.5% |
| 85 Years and Over | 2 | 9.5% |
| Total | 21 | 100.0% |
Housing Finances in Lakeview
Median Income by Occupancy in Lakeview
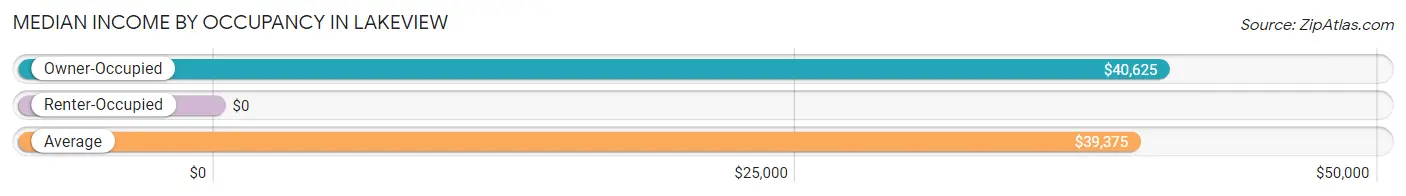
| Occupancy Type | # Households | Median Income |
| Owner-Occupied | 19 (90.5%) | $40,625 |
| Renter-Occupied | 2 (9.5%) | $0 |
| Average | 21 (100.0%) | $39,375 |
Occupancy by Householder Income Bracket in Lakeview
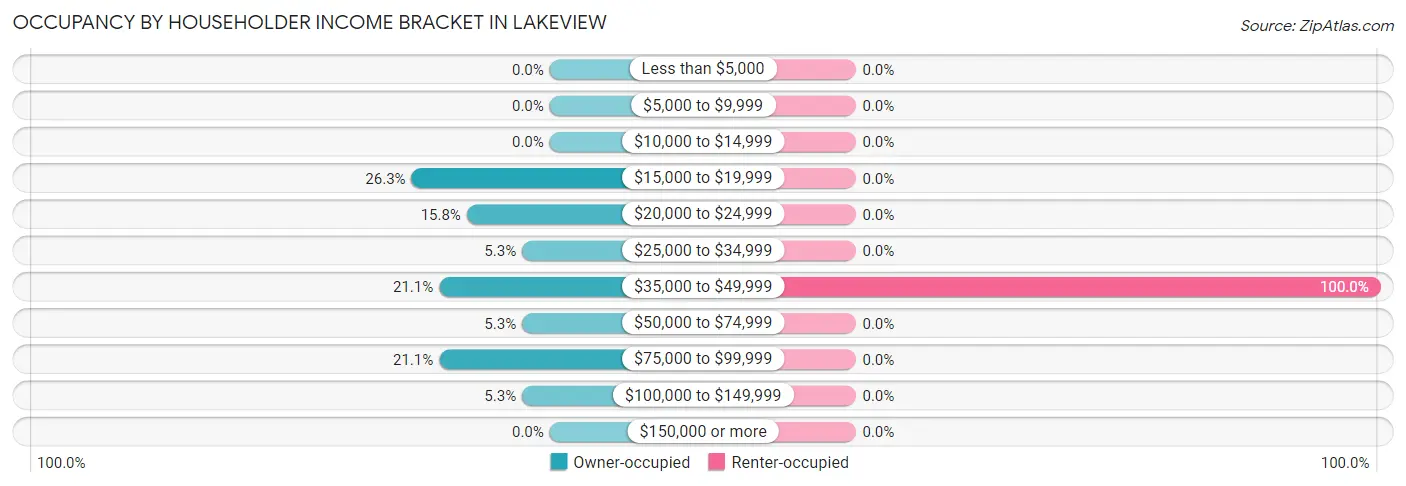
| Income Bracket | Owner-occupied | Renter-occupied |
| Less than $5,000 | 0 (0.0%) | 0 (0.0%) |
| $5,000 to $9,999 | 0 (0.0%) | 0 (0.0%) |
| $10,000 to $14,999 | 0 (0.0%) | 0 (0.0%) |
| $15,000 to $19,999 | 5 (26.3%) | 0 (0.0%) |
| $20,000 to $24,999 | 3 (15.8%) | 0 (0.0%) |
| $25,000 to $34,999 | 1 (5.3%) | 0 (0.0%) |
| $35,000 to $49,999 | 4 (21.0%) | 2 (100.0%) |
| $50,000 to $74,999 | 1 (5.3%) | 0 (0.0%) |
| $75,000 to $99,999 | 4 (21.0%) | 0 (0.0%) |
| $100,000 to $149,999 | 1 (5.3%) | 0 (0.0%) |
| $150,000 or more | 0 (0.0%) | 0 (0.0%) |
| Total | 19 (100.0%) | 2 (100.0%) |
Monthly Housing Cost Tiers in Lakeview
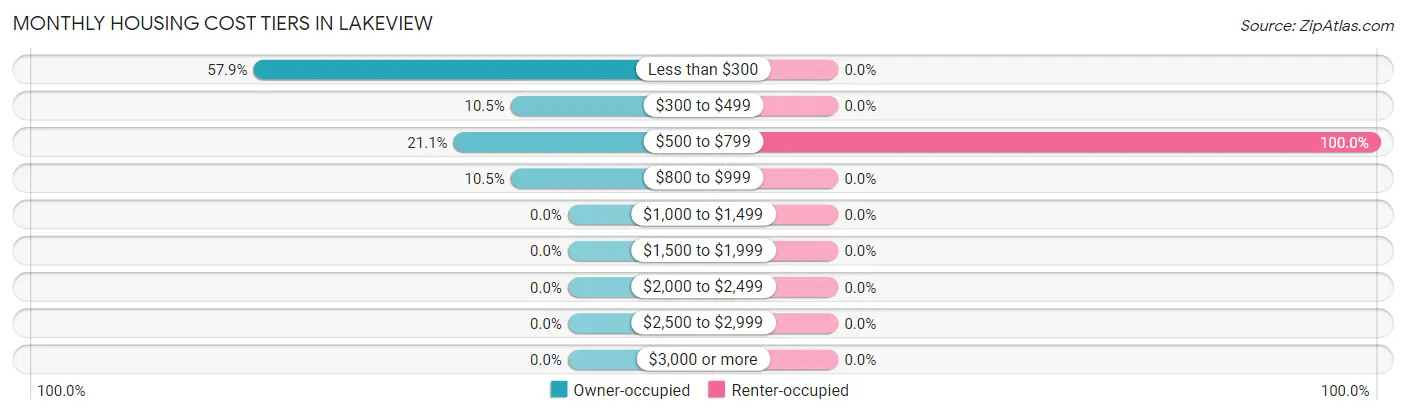
| Monthly Cost | Owner-occupied | Renter-occupied |
| Less than $300 | 11 (57.9%) | 0 (0.0%) |
| $300 to $499 | 2 (10.5%) | 0 (0.0%) |
| $500 to $799 | 4 (21.0%) | 2 (100.0%) |
| $800 to $999 | 2 (10.5%) | 0 (0.0%) |
| $1,000 to $1,499 | 0 (0.0%) | 0 (0.0%) |
| $1,500 to $1,999 | 0 (0.0%) | 0 (0.0%) |
| $2,000 to $2,499 | 0 (0.0%) | 0 (0.0%) |
| $2,500 to $2,999 | 0 (0.0%) | 0 (0.0%) |
| $3,000 or more | 0 (0.0%) | 0 (0.0%) |
| Total | 19 (100.0%) | 2 (100.0%) |
Physical Housing Characteristics in Lakeview
Housing Structures in Lakeview
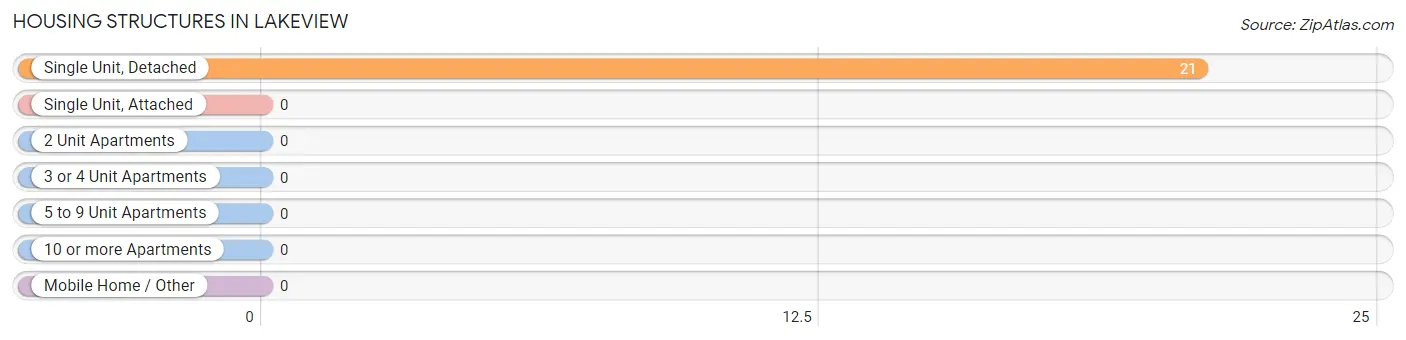
| Structure Type | # Housing Units | % Housing Units |
| Single Unit, Detached | 21 | 100.0% |
| Single Unit, Attached | 0 | 0.0% |
| 2 Unit Apartments | 0 | 0.0% |
| 3 or 4 Unit Apartments | 0 | 0.0% |
| 5 to 9 Unit Apartments | 0 | 0.0% |
| 10 or more Apartments | 0 | 0.0% |
| Mobile Home / Other | 0 | 0.0% |
| Total | 21 | 100.0% |
Housing Structures by Occupancy in Lakeview
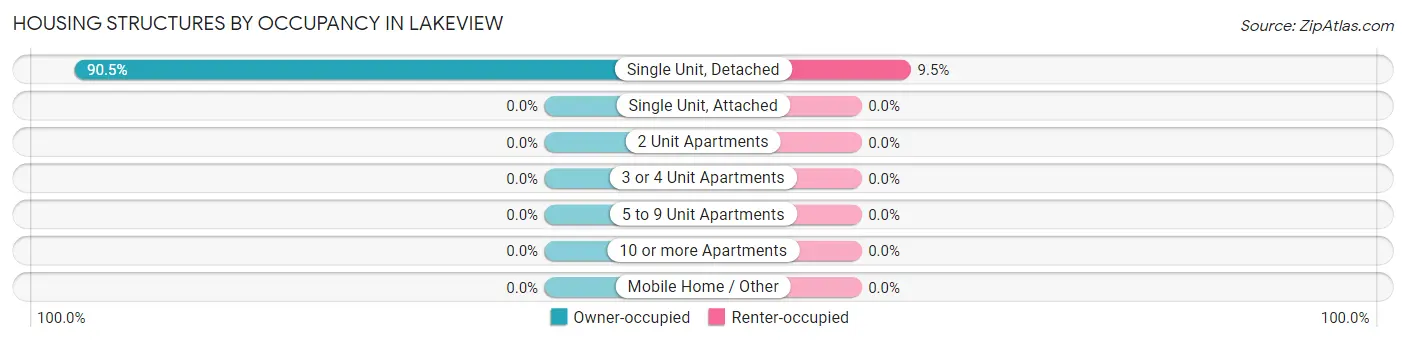
| Structure Type | Owner-occupied | Renter-occupied |
| Single Unit, Detached | 19 (90.5%) | 2 (9.5%) |
| Single Unit, Attached | 0 (0.0%) | 0 (0.0%) |
| 2 Unit Apartments | 0 (0.0%) | 0 (0.0%) |
| 3 or 4 Unit Apartments | 0 (0.0%) | 0 (0.0%) |
| 5 to 9 Unit Apartments | 0 (0.0%) | 0 (0.0%) |
| 10 or more Apartments | 0 (0.0%) | 0 (0.0%) |
| Mobile Home / Other | 0 (0.0%) | 0 (0.0%) |
| Total | 19 (90.5%) | 2 (9.5%) |
Housing Structures by Number of Rooms in Lakeview
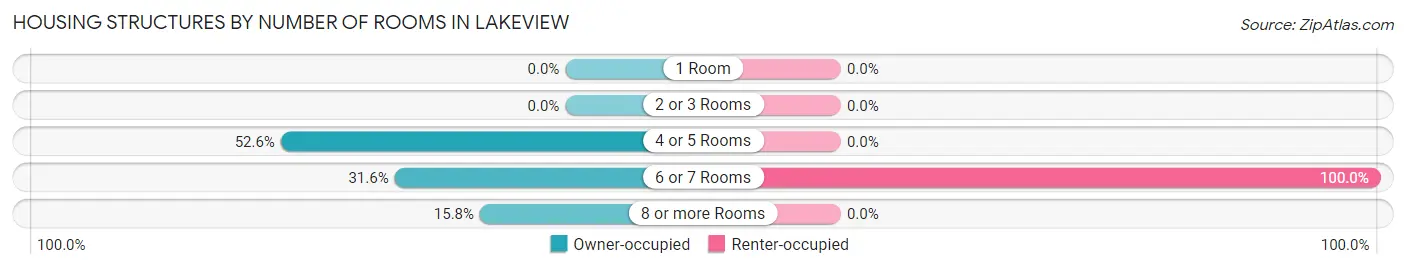
| Number of Rooms | Owner-occupied | Renter-occupied |
| 1 Room | 0 (0.0%) | 0 (0.0%) |
| 2 or 3 Rooms | 0 (0.0%) | 0 (0.0%) |
| 4 or 5 Rooms | 10 (52.6%) | 0 (0.0%) |
| 6 or 7 Rooms | 6 (31.6%) | 2 (100.0%) |
| 8 or more Rooms | 3 (15.8%) | 0 (0.0%) |
| Total | 19 (100.0%) | 2 (100.0%) |
Housing Structure by Heating Type in Lakeview
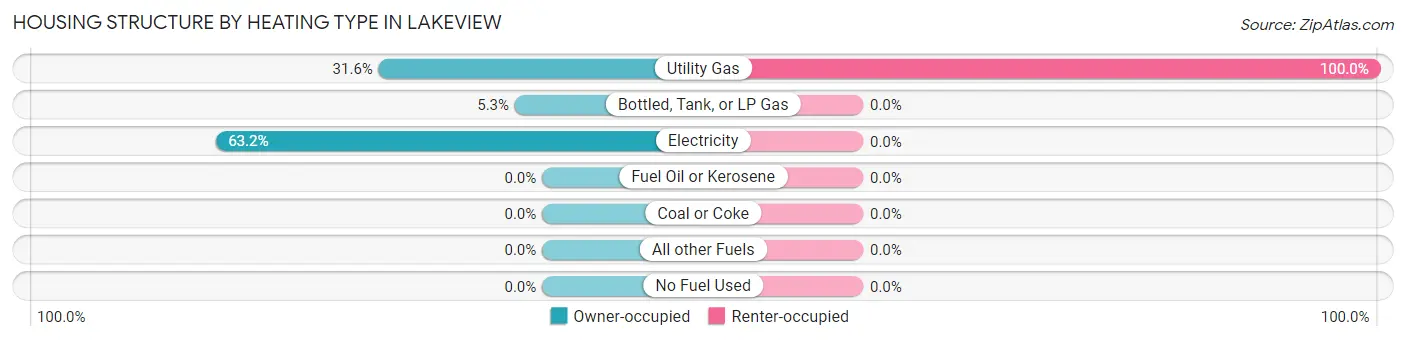
| Heating Type | Owner-occupied | Renter-occupied |
| Utility Gas | 6 (31.6%) | 2 (100.0%) |
| Bottled, Tank, or LP Gas | 1 (5.3%) | 0 (0.0%) |
| Electricity | 12 (63.2%) | 0 (0.0%) |
| Fuel Oil or Kerosene | 0 (0.0%) | 0 (0.0%) |
| Coal or Coke | 0 (0.0%) | 0 (0.0%) |
| All other Fuels | 0 (0.0%) | 0 (0.0%) |
| No Fuel Used | 0 (0.0%) | 0 (0.0%) |
| Total | 19 (100.0%) | 2 (100.0%) |
Household Vehicle Usage in Lakeview
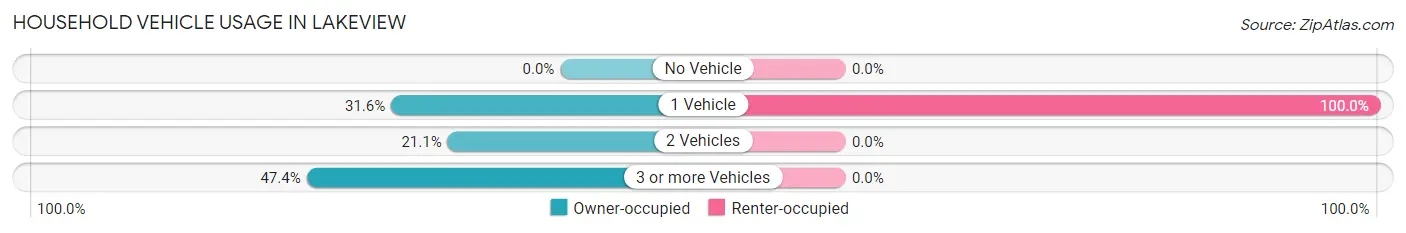
| Vehicles per Household | Owner-occupied | Renter-occupied |
| No Vehicle | 0 (0.0%) | 0 (0.0%) |
| 1 Vehicle | 6 (31.6%) | 2 (100.0%) |
| 2 Vehicles | 4 (21.0%) | 0 (0.0%) |
| 3 or more Vehicles | 9 (47.4%) | 0 (0.0%) |
| Total | 19 (100.0%) | 2 (100.0%) |
Real Estate & Mortgages in Lakeview
Real Estate and Mortgage Overview in Lakeview
| Characteristic | Without Mortgage | With Mortgage |
| Housing Units | 15 | 4 |
| Median Property Value | $18,500 | $0 |
| Median Household Income | $40,625 | $0 |
| Monthly Housing Costs | $271 | $0 |
| Real Estate Taxes | $540 | $0 |
Property Value by Mortgage Status in Lakeview
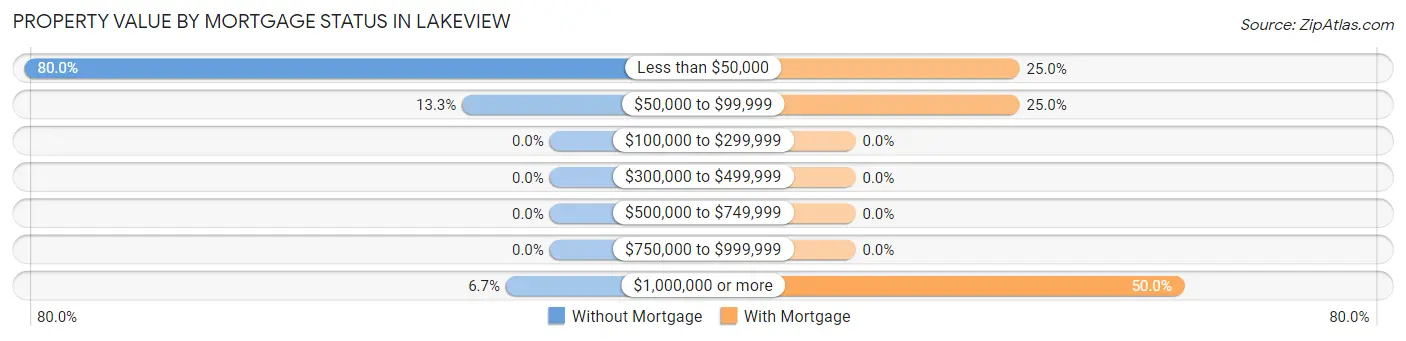
| Property Value | Without Mortgage | With Mortgage |
| Less than $50,000 | 12 (80.0%) | 1 (25.0%) |
| $50,000 to $99,999 | 2 (13.3%) | 1 (25.0%) |
| $100,000 to $299,999 | 0 (0.0%) | 0 (0.0%) |
| $300,000 to $499,999 | 0 (0.0%) | 0 (0.0%) |
| $500,000 to $749,999 | 0 (0.0%) | 0 (0.0%) |
| $750,000 to $999,999 | 0 (0.0%) | 0 (0.0%) |
| $1,000,000 or more | 1 (6.7%) | 2 (50.0%) |
| Total | 15 (100.0%) | 4 (100.0%) |
Household Income by Mortgage Status in Lakeview
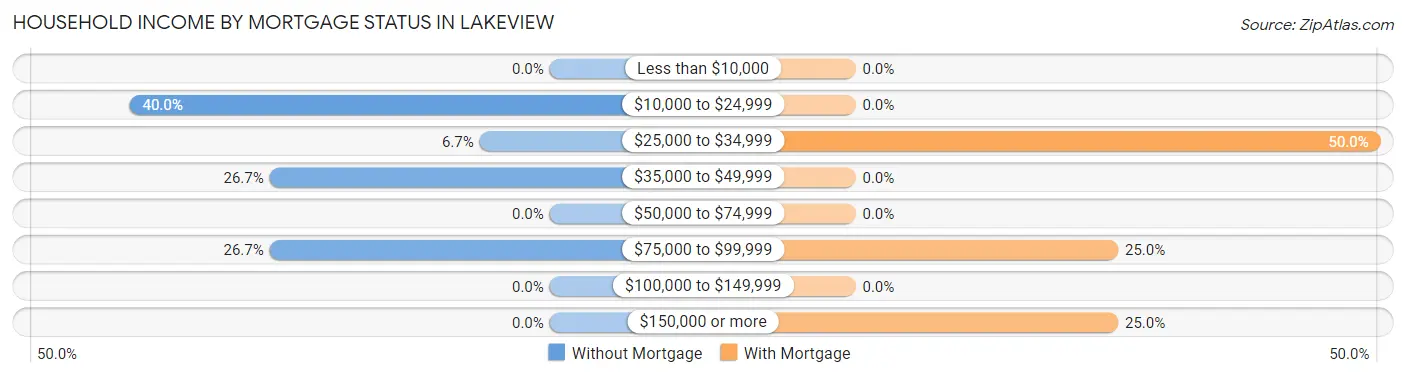
| Household Income | Without Mortgage | With Mortgage |
| Less than $10,000 | 0 (0.0%) | 0 (0.0%) |
| $10,000 to $24,999 | 6 (40.0%) | 0 (0.0%) |
| $25,000 to $34,999 | 1 (6.7%) | 2 (50.0%) |
| $35,000 to $49,999 | 4 (26.7%) | 0 (0.0%) |
| $50,000 to $74,999 | 0 (0.0%) | 0 (0.0%) |
| $75,000 to $99,999 | 4 (26.7%) | 1 (25.0%) |
| $100,000 to $149,999 | 0 (0.0%) | 0 (0.0%) |
| $150,000 or more | 0 (0.0%) | 1 (25.0%) |
| Total | 15 (100.0%) | 4 (100.0%) |
Property Value to Household Income Ratio in Lakeview
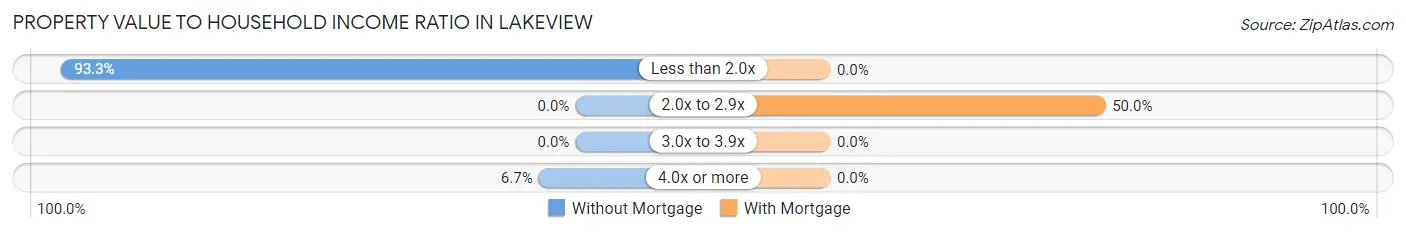
| Value-to-Income Ratio | Without Mortgage | With Mortgage |
| Less than 2.0x | 14 (93.3%) | 0 (0.0%) |
| 2.0x to 2.9x | 0 (0.0%) | 2 (50.0%) |
| 3.0x to 3.9x | 0 (0.0%) | 0 (0.0%) |
| 4.0x or more | 1 (6.7%) | 0 (0.0%) |
| Total | 15 (100.0%) | 4 (100.0%) |
Real Estate Taxes by Mortgage Status in Lakeview
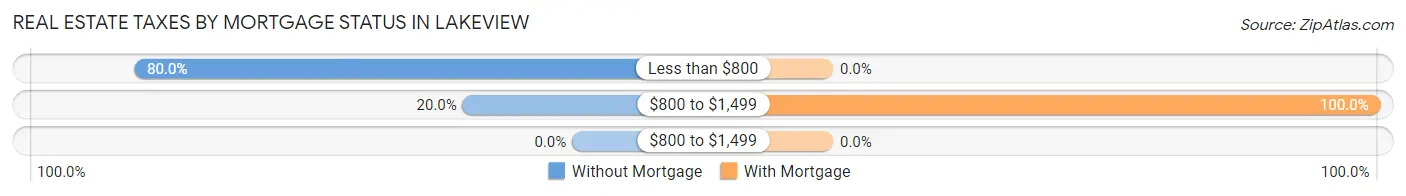
| Property Taxes | Without Mortgage | With Mortgage |
| Less than $800 | 12 (80.0%) | 0 (0.0%) |
| $800 to $1,499 | 3 (20.0%) | 4 (100.0%) |
| $800 to $1,499 | 0 (0.0%) | 0 (0.0%) |
| Total | 15 (100.0%) | 4 (100.0%) |
Health & Disability in Lakeview
Health Insurance Coverage by Age in Lakeview
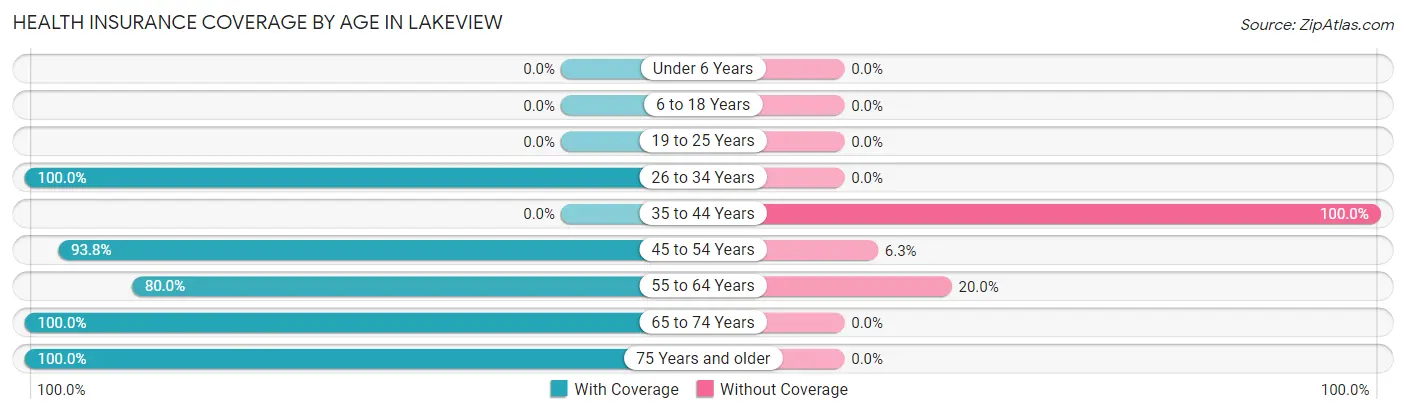
| Age Bracket | With Coverage | Without Coverage |
| Under 6 Years | 0 (0.0%) | 0 (0.0%) |
| 6 to 18 Years | 0 (0.0%) | 0 (0.0%) |
| 19 to 25 Years | 0 (0.0%) | 0 (0.0%) |
| 26 to 34 Years | 2 (100.0%) | 0 (0.0%) |
| 35 to 44 Years | 0 (0.0%) | 1 (100.0%) |
| 45 to 54 Years | 15 (93.8%) | 1 (6.2%) |
| 55 to 64 Years | 8 (80.0%) | 2 (20.0%) |
| 65 to 74 Years | 4 (100.0%) | 0 (0.0%) |
| 75 Years and older | 5 (100.0%) | 0 (0.0%) |
| Total | 34 (89.5%) | 4 (10.5%) |
Health Insurance Coverage by Citizenship Status in Lakeview

| Citizenship Status | With Coverage | Without Coverage |
| Native Born | 0 (0.0%) | 0 (0.0%) |
| Foreign Born, Citizen | 0 (0.0%) | 0 (0.0%) |
| Foreign Born, not a Citizen | 0 (0.0%) | 0 (0.0%) |
Health Insurance Coverage by Household Income in Lakeview
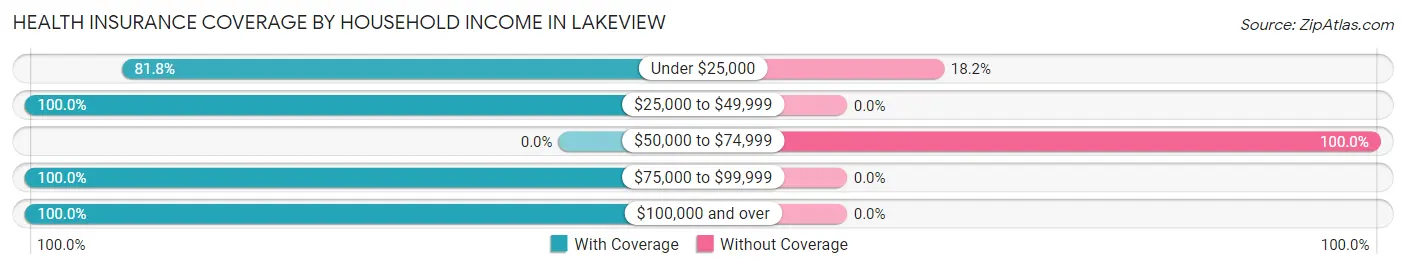
| Household Income | With Coverage | Without Coverage |
| Under $25,000 | 9 (81.8%) | 2 (18.2%) |
| $25,000 to $49,999 | 8 (100.0%) | 0 (0.0%) |
| $50,000 to $74,999 | 0 (0.0%) | 2 (100.0%) |
| $75,000 to $99,999 | 13 (100.0%) | 0 (0.0%) |
| $100,000 and over | 4 (100.0%) | 0 (0.0%) |
Public vs Private Health Insurance Coverage by Age in Lakeview
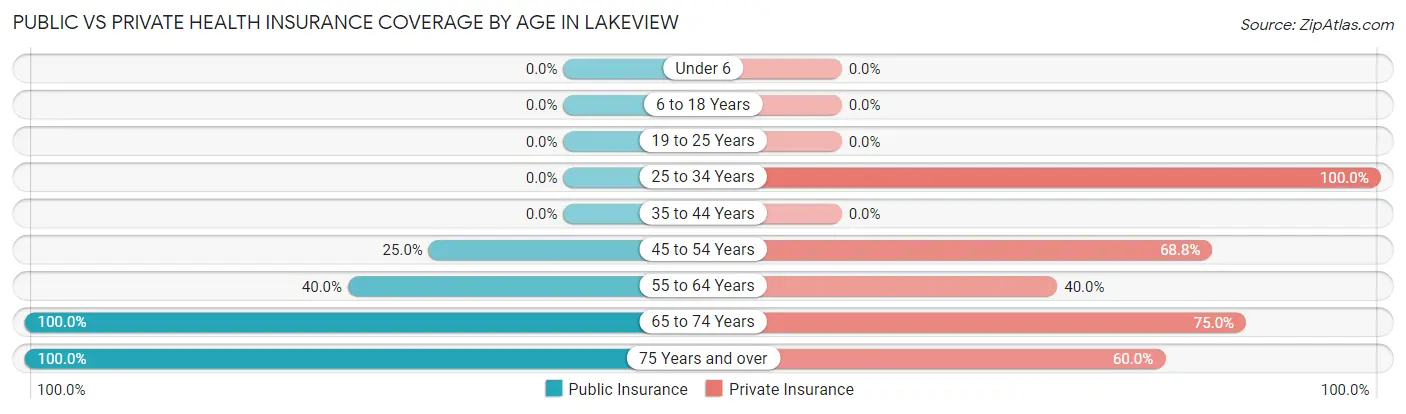
| Age Bracket | Public Insurance | Private Insurance |
| Under 6 | 0 (0.0%) | 0 (0.0%) |
| 6 to 18 Years | 0 (0.0%) | 0 (0.0%) |
| 19 to 25 Years | 0 (0.0%) | 0 (0.0%) |
| 25 to 34 Years | 0 (0.0%) | 2 (100.0%) |
| 35 to 44 Years | 0 (0.0%) | 0 (0.0%) |
| 45 to 54 Years | 4 (25.0%) | 11 (68.8%) |
| 55 to 64 Years | 4 (40.0%) | 4 (40.0%) |
| 65 to 74 Years | 4 (100.0%) | 3 (75.0%) |
| 75 Years and over | 5 (100.0%) | 3 (60.0%) |
| Total | 17 (44.7%) | 23 (60.5%) |
Disability Status by Sex by Age in Lakeview
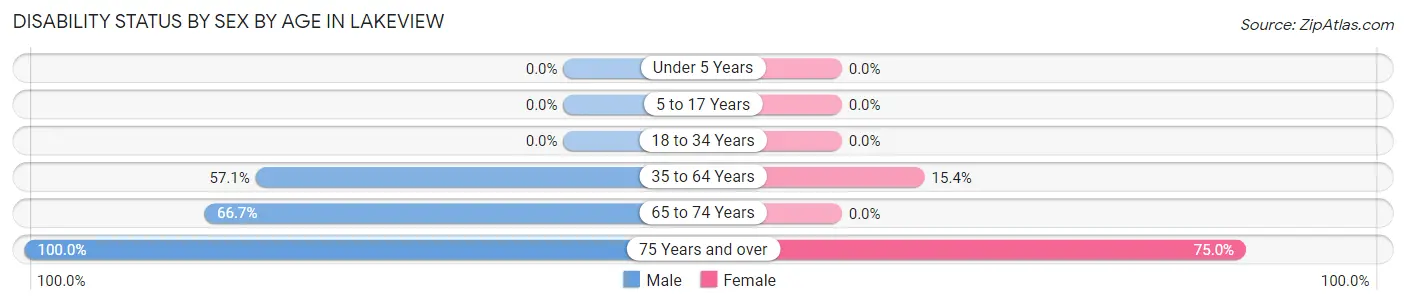
| Age Bracket | Male | Female |
| Under 5 Years | 0 (0.0%) | 0 (0.0%) |
| 5 to 17 Years | 0 (0.0%) | 0 (0.0%) |
| 18 to 34 Years | 0 (0.0%) | 0 (0.0%) |
| 35 to 64 Years | 8 (57.1%) | 2 (15.4%) |
| 65 to 74 Years | 2 (66.7%) | 0 (0.0%) |
| 75 Years and over | 1 (100.0%) | 3 (75.0%) |
Disability Class by Sex by Age in Lakeview
Disability Class: Hearing Difficulty
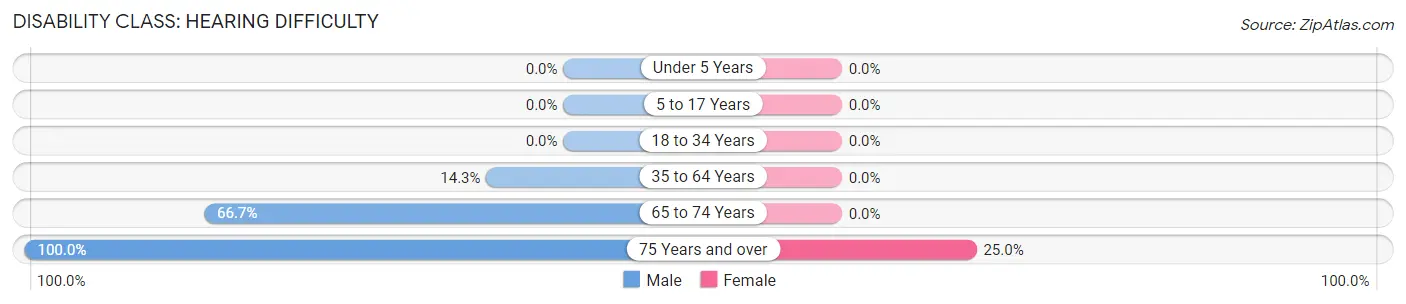
| Age Bracket | Male | Female |
| Under 5 Years | 0 (0.0%) | 0 (0.0%) |
| 5 to 17 Years | 0 (0.0%) | 0 (0.0%) |
| 18 to 34 Years | 0 (0.0%) | 0 (0.0%) |
| 35 to 64 Years | 2 (14.3%) | 0 (0.0%) |
| 65 to 74 Years | 2 (66.7%) | 0 (0.0%) |
| 75 Years and over | 1 (100.0%) | 1 (25.0%) |
Disability Class: Vision Difficulty
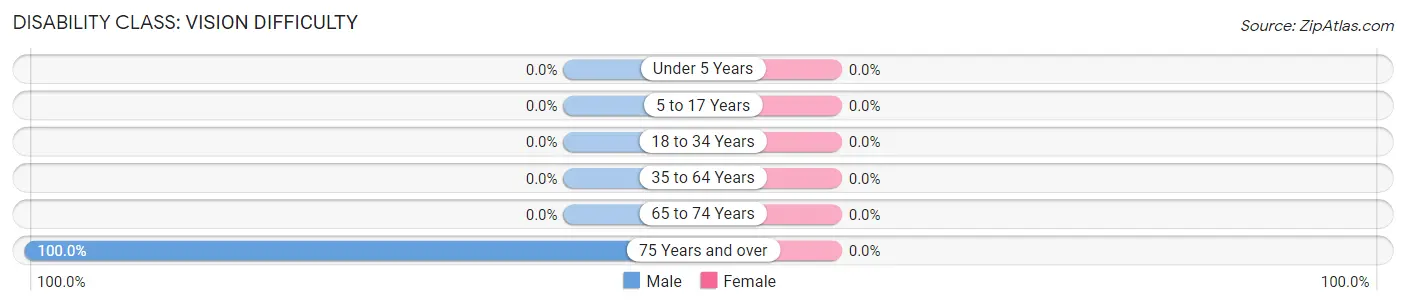
| Age Bracket | Male | Female |
| Under 5 Years | 0 (0.0%) | 0 (0.0%) |
| 5 to 17 Years | 0 (0.0%) | 0 (0.0%) |
| 18 to 34 Years | 0 (0.0%) | 0 (0.0%) |
| 35 to 64 Years | 0 (0.0%) | 0 (0.0%) |
| 65 to 74 Years | 0 (0.0%) | 0 (0.0%) |
| 75 Years and over | 1 (100.0%) | 0 (0.0%) |
Disability Class: Cognitive Difficulty

| Age Bracket | Male | Female |
| 5 to 17 Years | 0 (0.0%) | 0 (0.0%) |
| 18 to 34 Years | 0 (0.0%) | 0 (0.0%) |
| 35 to 64 Years | 0 (0.0%) | 0 (0.0%) |
| 65 to 74 Years | 0 (0.0%) | 0 (0.0%) |
| 75 Years and over | 1 (100.0%) | 0 (0.0%) |
Disability Class: Ambulatory Difficulty
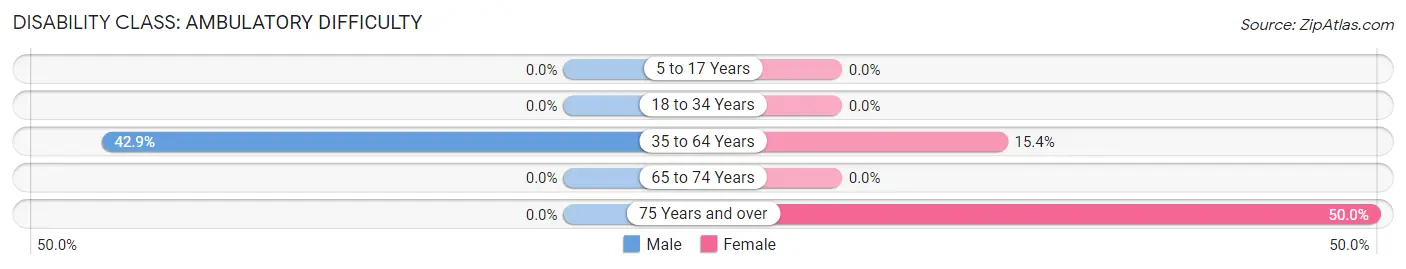
| Age Bracket | Male | Female |
| 5 to 17 Years | 0 (0.0%) | 0 (0.0%) |
| 18 to 34 Years | 0 (0.0%) | 0 (0.0%) |
| 35 to 64 Years | 6 (42.9%) | 2 (15.4%) |
| 65 to 74 Years | 0 (0.0%) | 0 (0.0%) |
| 75 Years and over | 0 (0.0%) | 2 (50.0%) |
Disability Class: Self-Care Difficulty

| Age Bracket | Male | Female |
| 5 to 17 Years | 0 (0.0%) | 0 (0.0%) |
| 18 to 34 Years | 0 (0.0%) | 0 (0.0%) |
| 35 to 64 Years | 0 (0.0%) | 0 (0.0%) |
| 65 to 74 Years | 0 (0.0%) | 0 (0.0%) |
| 75 Years and over | 1 (100.0%) | 0 (0.0%) |
Technology Access in Lakeview
Computing Device Access in Lakeview
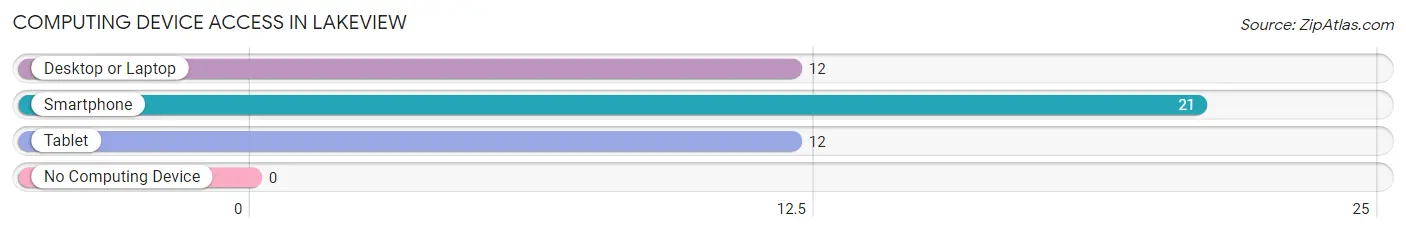
| Device Type | # Households | % Households |
| Desktop or Laptop | 12 | 57.1% |
| Smartphone | 21 | 100.0% |
| Tablet | 12 | 57.1% |
| No Computing Device | 0 | 0.0% |
| Total | 21 | 100.0% |
Internet Access in Lakeview
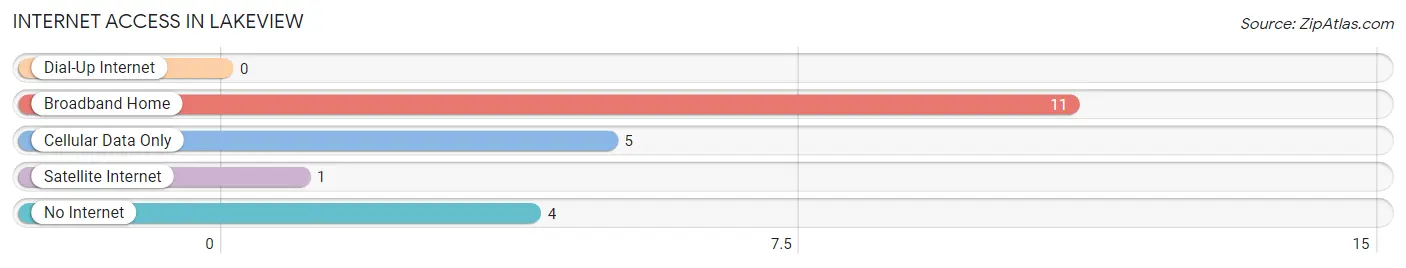
| Internet Type | # Households | % Households |
| Dial-Up Internet | 0 | 0.0% |
| Broadband Home | 11 | 52.4% |
| Cellular Data Only | 5 | 23.8% |
| Satellite Internet | 1 | 4.8% |
| No Internet | 4 | 19.1% |
| Total | 21 | 100.0% |
Lakeview Summary
History
The small town of Lakeview, Texas is located in the southeastern corner of the state, just north of the Gulf of Mexico. It is part of the Houston-The Woodlands-Sugar Land metropolitan area and is situated in the county of Liberty. The town was founded in 1845 by a group of settlers from the nearby town of Liberty. The settlers were looking for a place to settle and raise their families, and they found the perfect spot in the area that is now Lakeview.
The town was originally called Liberty Hill, but the name was changed to Lakeview in 1876 when the first post office was established. The name was chosen to reflect the beautiful views of the lake that the town was situated on. The lake was originally called Lake Liberty, but it was later renamed Lake Livingston.
The town of Lakeview has a rich history that dates back to the early days of the Republic of Texas. During the Civil War, the town was a major supply center for the Confederate Army. After the war, the town was a major center for cotton production and was home to several large cotton plantations.
In the early 1900s, the town began to experience a period of growth and development. The population increased and the town began to attract new businesses and industries. The town was also home to several schools, churches, and other organizations.
In the 1950s, the town experienced a period of decline as the cotton industry began to decline and the population began to move away. However, in the late 1970s, the town began to experience a period of revitalization as new businesses and industries began to move into the area.
Today, Lakeview is a small town with a population of just over 1,000 people. The town is home to several businesses, including a grocery store, a hardware store, and a few restaurants. The town is also home to several churches, a library, and a museum.
Geography
Lakeview is located in the southeastern corner of Texas, just north of the Gulf of Mexico. It is part of the Houston-The Woodlands-Sugar Land metropolitan area and is situated in the county of Liberty. The town is situated on the banks of Lake Livingston, which is a large lake that is part of the Trinity River system.
The town is located in a humid subtropical climate zone, which means that it experiences hot and humid summers and mild winters. The average temperature in the summer is around 90 degrees Fahrenheit, while the average temperature in the winter is around 50 degrees Fahrenheit.
The town is located in an area that is known for its natural beauty. The area is home to several parks and nature preserves, including the Sam Houston National Forest and the Big Thicket National Preserve. The area is also home to several rivers and lakes, including the Trinity River and Lake Livingston.
Economy
The economy of Lakeview is largely based on the oil and gas industry. The town is home to several oil and gas companies, including Chevron, ExxonMobil, and Shell. The town is also home to several other businesses, including a grocery store, a hardware store, and a few restaurants.
The town is also home to several schools, churches, and other organizations. The town is served by the Liberty County School District, which operates several elementary, middle, and high schools in the area.
Demographics
As of the 2010 census, the population of Lakeview was 1,072. The racial makeup of the town was 94.3% White, 0.9% African American, 0.3% Native American, 0.3% Asian, 0.1% Pacific Islander, 2.2% from other races, and 1.9% from two or more races. Hispanic or Latino of any race were 4.7% of the population.
The median household income in Lakeview was $37,917, and the median family income was $45,313. The per capita income for the town was $19,945. About 11.2% of families and 14.2% of the population were below the poverty line, including 18.2% of those under age 18 and 8.3% of those age 65 or over.
Common Questions
What is Per Capita Income in Lakeview?
Per Capita income in Lakeview is $26,505.
What is the Median Family Income in Lakeview?
Median Family Income in Lakeview is $77,813.
What is the Median Household income in Lakeview?
Median Household Income in Lakeview is $39,375.
What is Income or Wage Gap in Lakeview?
Income or Wage Gap in Lakeview is 42.7%.
Women in Lakeview earn 57.3 cents for every dollar earned by a man.
What is Inequality or Gini Index in Lakeview?
Inequality or Gini Index in Lakeview is 0.32.
What is the Total Population of Lakeview?
Total Population of Lakeview is 38.
What is the Total Male Population of Lakeview?
Total Male Population of Lakeview is 20.
What is the Total Female Population of Lakeview?
Total Female Population of Lakeview is 18.
What is the Ratio of Males per 100 Females in Lakeview?
There are 111.11 Males per 100 Females in Lakeview.
What is the Ratio of Females per 100 Males in Lakeview?
There are 90.00 Females per 100 Males in Lakeview.
What is the Median Population Age in Lakeview?
Median Population Age in Lakeview is 56.0 Years.
What is the Average Family Size in Lakeview
Average Family Size in Lakeview is 2.6 People.
What is the Average Household Size in Lakeview
Average Household Size in Lakeview is 1.8 People.
How Large is the Labor Force in Lakeview?
There are 26 People in the Labor Forcein in Lakeview.
What is the Percentage of People in the Labor Force in Lakeview?
68.4% of People are in the Labor Force in Lakeview.