Western Lake, TX Map & Demographics
Western Lake Map
Western Lake Overview
$21,607
PER CAPITA INCOME
$69,722
AVG FAMILY INCOME
$32,225
AVG HOUSEHOLD INCOME
0.33
INEQUALITY / GINI INDEX
1,207
TOTAL POPULATION
736
MALE POPULATION
471
FEMALE POPULATION
156.26
MALES / 100 FEMALES
63.99
FEMALES / 100 MALES
43.5
MEDIAN AGE
5.9
AVG FAMILY SIZE
2.9
AVG HOUSEHOLD SIZE
668
LABOR FORCE [ PEOPLE ]
63.1%
PERCENT IN LABOR FORCE
27.2%
UNEMPLOYMENT RATE
Income in Western Lake
Income Overview in Western Lake
Per Capita Income in Western Lake is $21,607, while median incomes of families and households are $69,722 and $32,225 respectively.
| Characteristic | Number | Measure |
| Per Capita Income | 1,207 | $21,607 |
| Median Family Income | 158 | $69,722 |
| Mean Family Income | 158 | $76,995 |
| Median Household Income | 422 | $32,225 |
| Mean Household Income | 422 | $53,495 |
| Income Deficit | 158 | $0 |
| Wage / Income Gap (%) | 1,207 | 0.00% |
| Wage / Income Gap ($) | 1,207 | 100.00¢ per $1 |
| Gini / Inequality Index | 1,207 | 0.33 |
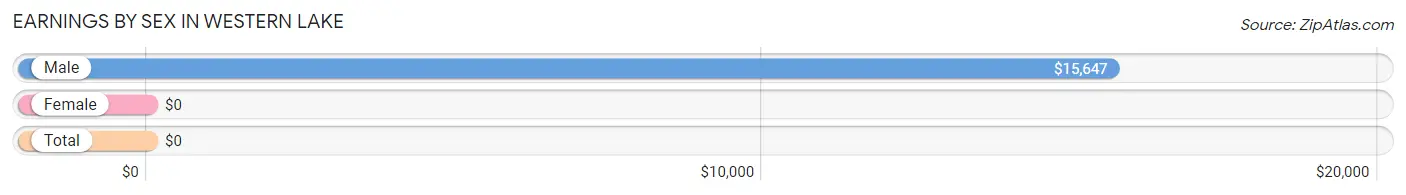
Earnings by Sex in Western Lake
| Sex | Number | Average Earnings |
| Male | 415 (59.5%) | $15,647 |
| Female | 283 (40.5%) | $0 |
| Total | 698 (100.0%) | $0 |
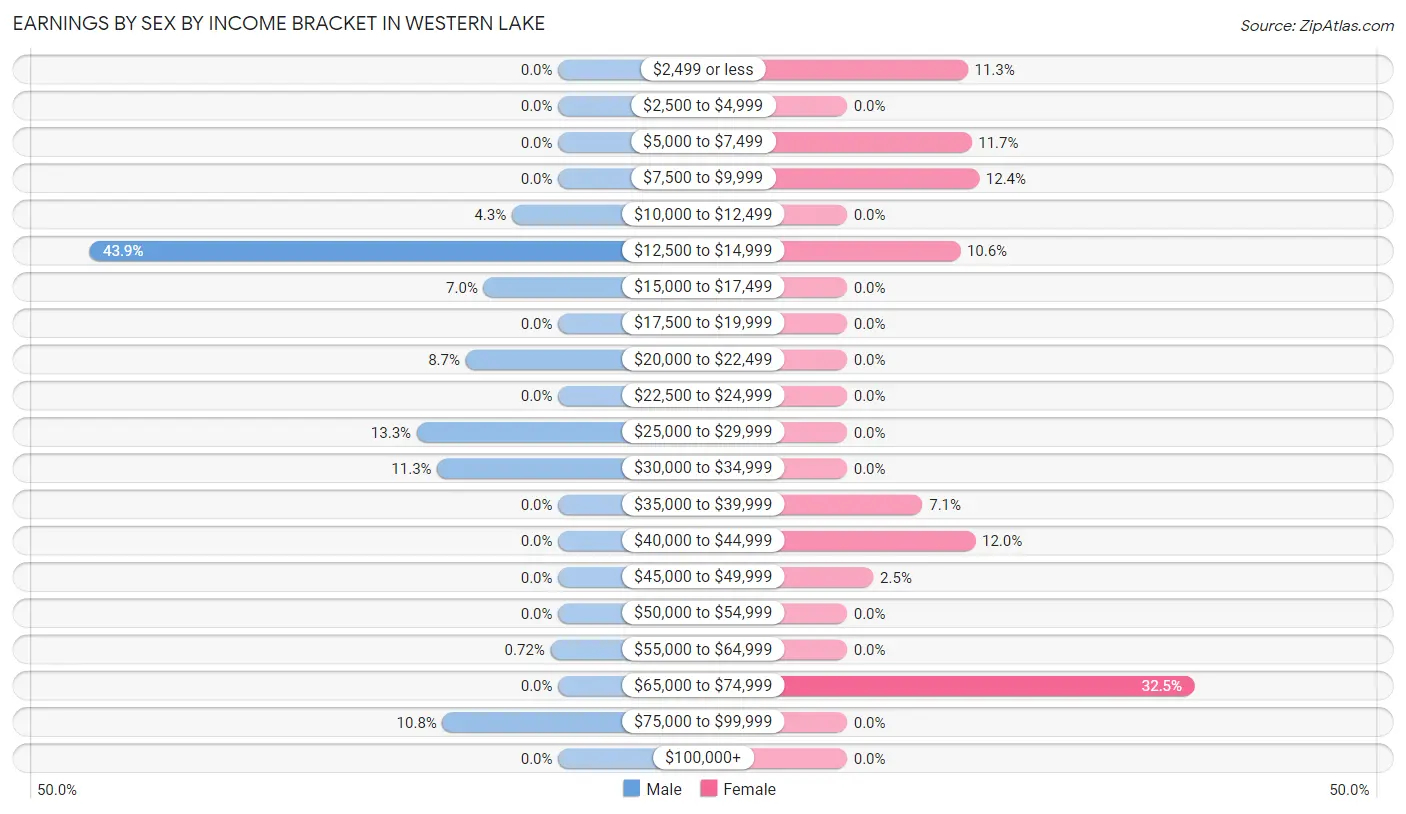
Earnings by Sex by Income Bracket in Western Lake
The most common earnings brackets in Western Lake are $12,500 to $14,999 for men (182 | 43.9%) and $65,000 to $74,999 for women (92 | 32.5%).
| Income | Male | Female |
| $2,499 or less | 0 (0.0%) | 32 (11.3%) |
| $2,500 to $4,999 | 0 (0.0%) | 0 (0.0%) |
| $5,000 to $7,499 | 0 (0.0%) | 33 (11.7%) |
| $7,500 to $9,999 | 0 (0.0%) | 35 (12.4%) |
| $10,000 to $12,499 | 18 (4.3%) | 0 (0.0%) |
| $12,500 to $14,999 | 182 (43.9%) | 30 (10.6%) |
| $15,000 to $17,499 | 29 (7.0%) | 0 (0.0%) |
| $17,500 to $19,999 | 0 (0.0%) | 0 (0.0%) |
| $20,000 to $22,499 | 36 (8.7%) | 0 (0.0%) |
| $22,500 to $24,999 | 0 (0.0%) | 0 (0.0%) |
| $25,000 to $29,999 | 55 (13.3%) | 0 (0.0%) |
| $30,000 to $34,999 | 47 (11.3%) | 0 (0.0%) |
| $35,000 to $39,999 | 0 (0.0%) | 20 (7.1%) |
| $40,000 to $44,999 | 0 (0.0%) | 34 (12.0%) |
| $45,000 to $49,999 | 0 (0.0%) | 7 (2.5%) |
| $50,000 to $54,999 | 0 (0.0%) | 0 (0.0%) |
| $55,000 to $64,999 | 3 (0.7%) | 0 (0.0%) |
| $65,000 to $74,999 | 0 (0.0%) | 92 (32.5%) |
| $75,000 to $99,999 | 45 (10.8%) | 0 (0.0%) |
| $100,000+ | 0 (0.0%) | 0 (0.0%) |
| Total | 415 (100.0%) | 283 (100.0%) |
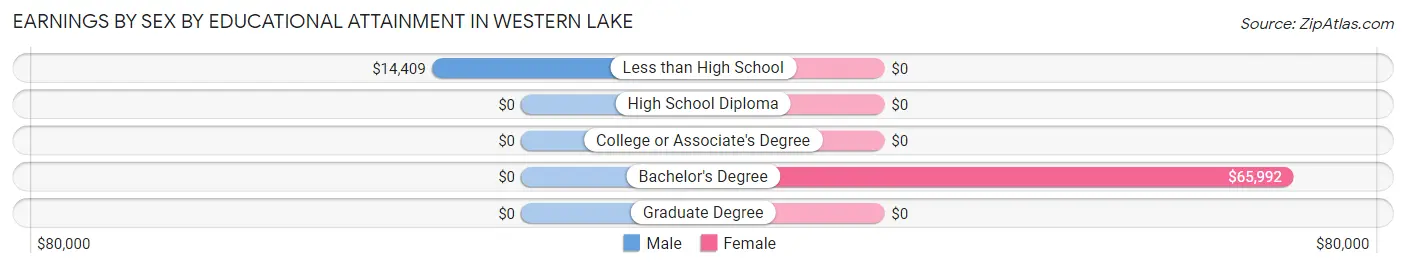
Earnings by Sex by Educational Attainment in Western Lake
| Educational Attainment | Male Income | Female Income |
| Less than High School | $14,409 | $0 |
| High School Diploma | - | - |
| College or Associate's Degree | - | - |
| Bachelor's Degree | - | - |
| Graduate Degree | - | - |
| Total | $14,780 | $0 |
Family Income in Western Lake
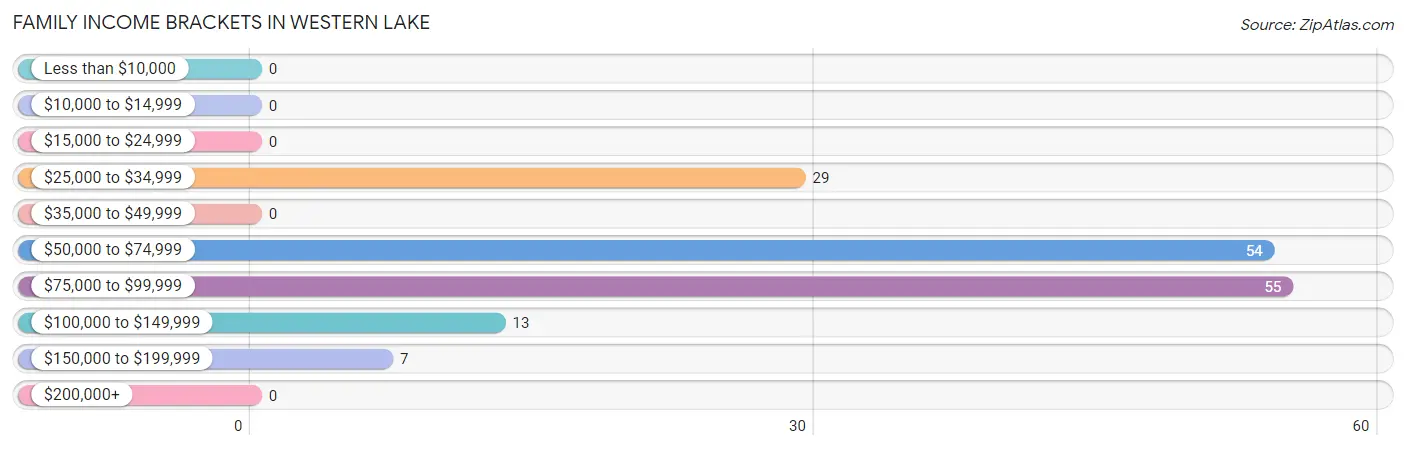
Family Income Brackets in Western Lake
According to the Western Lake family income data, there are 55 families falling into the $75,000 to $99,999 income range, which is the most common income bracket and makes up 34.8% of all families.
| Income Bracket | # Families | % Families |
| Less than $10,000 | 0 | 0.0% |
| $10,000 to $14,999 | 0 | 0.0% |
| $15,000 to $24,999 | 0 | 0.0% |
| $25,000 to $34,999 | 29 | 18.4% |
| $35,000 to $49,999 | 0 | 0.0% |
| $50,000 to $74,999 | 54 | 34.2% |
| $75,000 to $99,999 | 55 | 34.8% |
| $100,000 to $149,999 | 13 | 8.2% |
| $150,000 to $199,999 | 7 | 4.4% |
| $200,000+ | 0 | 0.0% |
Family Income by Famaliy Size in Western Lake
| Income Bracket | # Families | Median Income |
| 2-Person Families | 0 (0.0%) | $0 |
| 3-Person Families | 49 (31.0%) | $0 |
| 4-Person Families | 18 (11.4%) | $0 |
| 5-Person Families | 36 (22.8%) | $0 |
| 6-Person Families | 0 (0.0%) | $0 |
| 7+ Person Families | 55 (34.8%) | $0 |
| Total | 158 (100.0%) | $69,722 |
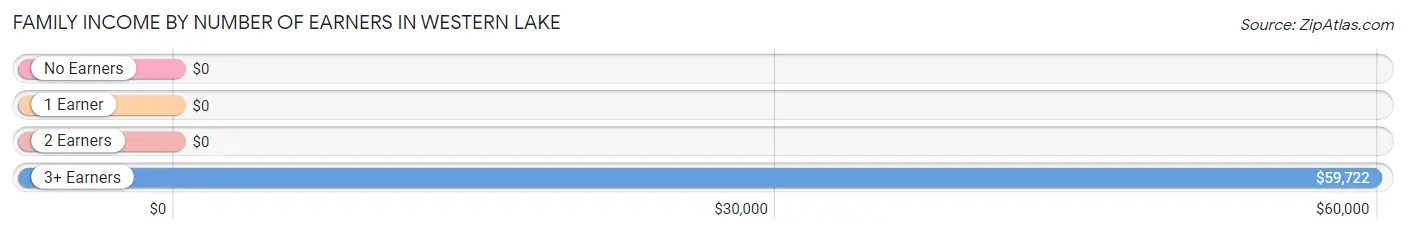
Family Income by Number of Earners in Western Lake
| Number of Earners | # Families | Median Income |
| No Earners | 13 (8.2%) | $0 |
| 1 Earner | 0 (0.0%) | $0 |
| 2 Earners | 55 (34.8%) | $0 |
| 3+ Earners | 90 (57.0%) | $59,722 |
| Total | 158 (100.0%) | $69,722 |
Household Income in Western Lake
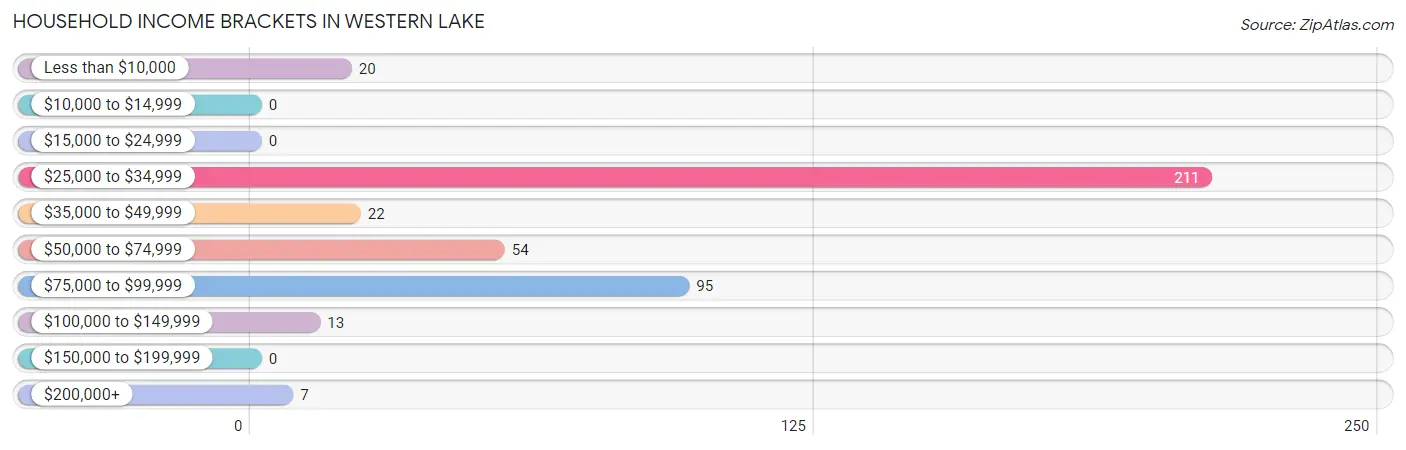
Household Income Brackets in Western Lake
With 211 households falling in the category, the $25,000 to $34,999 income range is the most frequent in Western Lake, accounting for 50.0% of all households.
| Income Bracket | # Households | % Households |
| Less than $10,000 | 20 | 4.7% |
| $10,000 to $14,999 | 0 | 0.0% |
| $15,000 to $24,999 | 0 | 0.0% |
| $25,000 to $34,999 | 211 | 50.0% |
| $35,000 to $49,999 | 22 | 5.2% |
| $50,000 to $74,999 | 54 | 12.8% |
| $75,000 to $99,999 | 95 | 22.5% |
| $100,000 to $149,999 | 13 | 3.1% |
| $150,000 to $199,999 | 0 | 0.0% |
| $200,000+ | 7 | 1.7% |
Household Income by Householder Age in Western Lake
The median household income in Western Lake is $32,225, with the highest median household income of $31,841 found in the 45 to 64 years age bracket for the primary householder. A total of 366 households (86.7%) fall into this category.
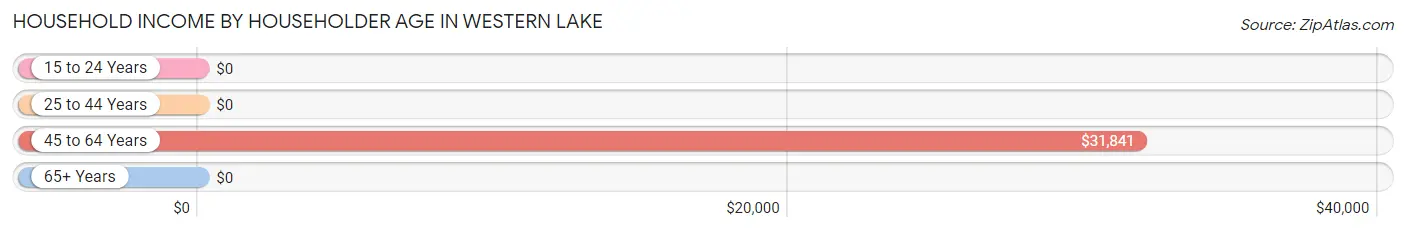
| Income Bracket | # Households | Median Income |
| 15 to 24 Years | 0 (0.0%) | $0 |
| 25 to 44 Years | 43 (10.2%) | $0 |
| 45 to 64 Years | 366 (86.7%) | $31,841 |
| 65+ Years | 13 (3.1%) | $0 |
| Total | 422 (100.0%) | $32,225 |
Poverty in Western Lake
Income Below Poverty by Sex and Age in Western Lake
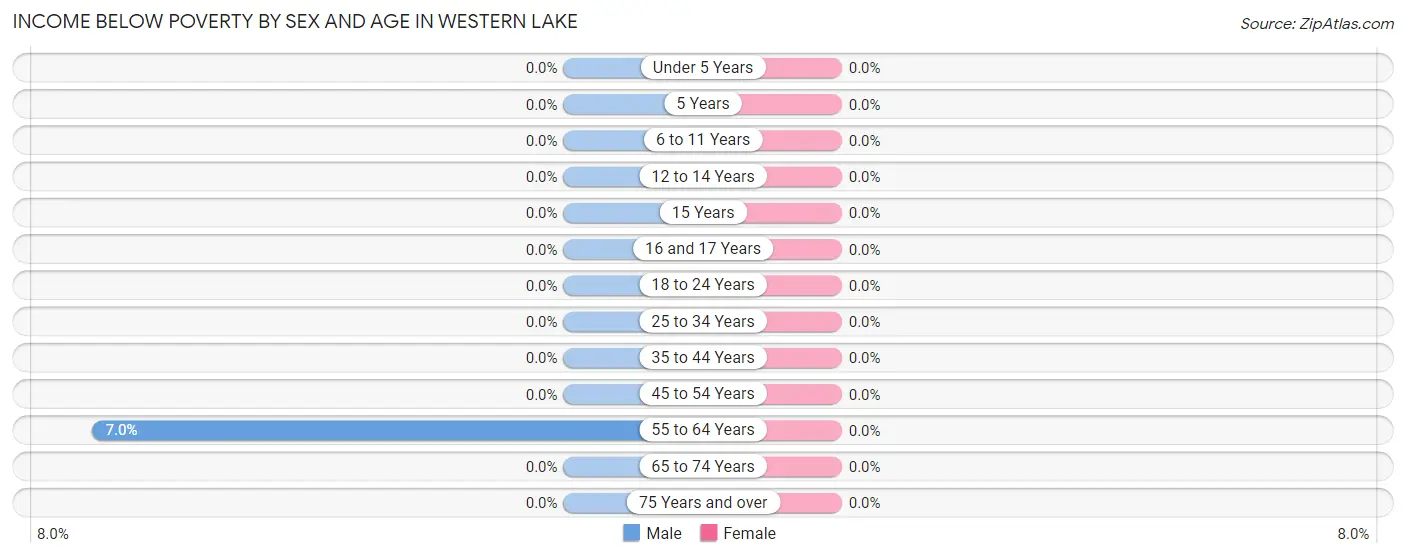
| Age Bracket | Male | Female |
| Under 5 Years | 0 (0.0%) | 0 (0.0%) |
| 5 Years | 0 (0.0%) | 0 (0.0%) |
| 6 to 11 Years | 0 (0.0%) | 0 (0.0%) |
| 12 to 14 Years | 0 (0.0%) | 0 (0.0%) |
| 15 Years | 0 (0.0%) | 0 (0.0%) |
| 16 and 17 Years | 0 (0.0%) | 0 (0.0%) |
| 18 to 24 Years | 0 (0.0%) | 0 (0.0%) |
| 25 to 34 Years | 0 (0.0%) | 0 (0.0%) |
| 35 to 44 Years | 0 (0.0%) | 0 (0.0%) |
| 45 to 54 Years | 0 (0.0%) | 0 (0.0%) |
| 55 to 64 Years | 20 (7.0%) | 0 (0.0%) |
| 65 to 74 Years | 0 (0.0%) | 0 (0.0%) |
| 75 Years and over | 0 (0.0%) | 0 (0.0%) |
| Total | 20 (2.7%) | 0 (0.0%) |
Income Above Poverty by Sex and Age in Western Lake
According to the poverty statistics in Western Lake, males aged 15 years and females aged under 5 years are the age groups that are most secure financially, with 100.0% of males and 100.0% of females in these age groups living above the poverty line.
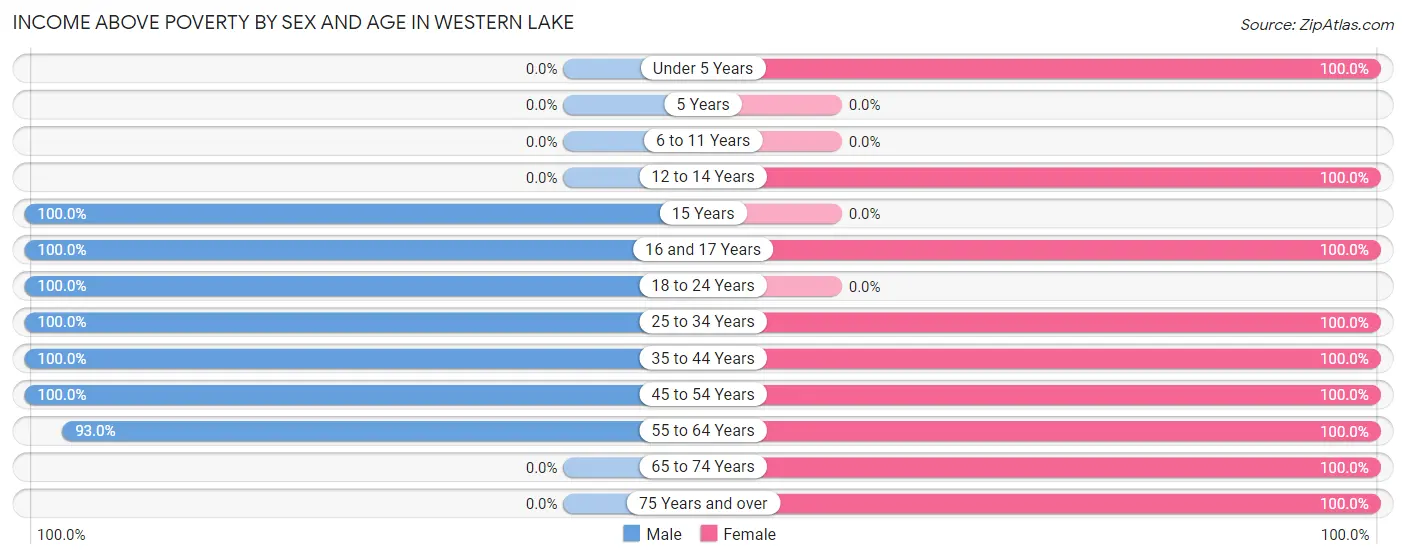
| Age Bracket | Male | Female |
| Under 5 Years | 0 (0.0%) | 49 (100.0%) |
| 5 Years | 0 (0.0%) | 0 (0.0%) |
| 6 to 11 Years | 0 (0.0%) | 0 (0.0%) |
| 12 to 14 Years | 0 (0.0%) | 41 (100.0%) |
| 15 Years | 58 (100.0%) | 0 (0.0%) |
| 16 and 17 Years | 81 (100.0%) | 32 (100.0%) |
| 18 to 24 Years | 47 (100.0%) | 0 (0.0%) |
| 25 to 34 Years | 139 (100.0%) | 92 (100.0%) |
| 35 to 44 Years | 67 (100.0%) | 69 (100.0%) |
| 45 to 54 Years | 58 (100.0%) | 120 (100.0%) |
| 55 to 64 Years | 266 (93.0%) | 33 (100.0%) |
| 65 to 74 Years | 0 (0.0%) | 22 (100.0%) |
| 75 Years and over | 0 (0.0%) | 13 (100.0%) |
| Total | 716 (97.3%) | 471 (100.0%) |
Income Below Poverty Among Married-Couple Families in Western Lake
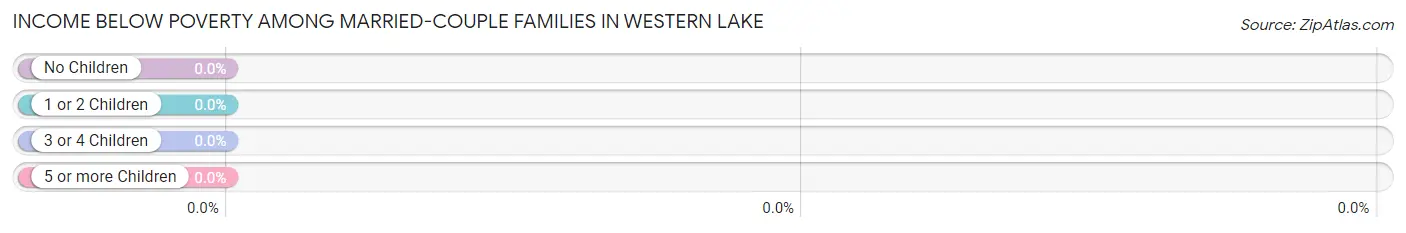
| Children | Above Poverty | Below Poverty |
| No Children | 25 (100.0%) | 0 (0.0%) |
| 1 or 2 Children | 65 (100.0%) | 0 (0.0%) |
| 3 or 4 Children | 55 (100.0%) | 0 (0.0%) |
| 5 or more Children | 0 (0.0%) | 0 (0.0%) |
| Total | 145 (100.0%) | 0 (0.0%) |
Income Below Poverty Among Single-Parent Households in Western Lake
| Children | Single Father | Single Mother |
| No Children | 0 (0.0%) | 0 (0.0%) |
| 1 or 2 Children | 0 (0.0%) | 0 (0.0%) |
| 3 or 4 Children | 0 (0.0%) | 0 (0.0%) |
| 5 or more Children | 0 (0.0%) | 0 (0.0%) |
| Total | 0 (0.0%) | 0 (0.0%) |
Income Below Poverty Among Married-Couple vs Single-Parent Households in Western Lake
| Children | Married-Couple Families | Single-Parent Households |
| No Children | 0 (0.0%) | 0 (0.0%) |
| 1 or 2 Children | 0 (0.0%) | 0 (0.0%) |
| 3 or 4 Children | 0 (0.0%) | 0 (0.0%) |
| 5 or more Children | 0 (0.0%) | 0 (0.0%) |
| Total | 0 (0.0%) | 0 (0.0%) |
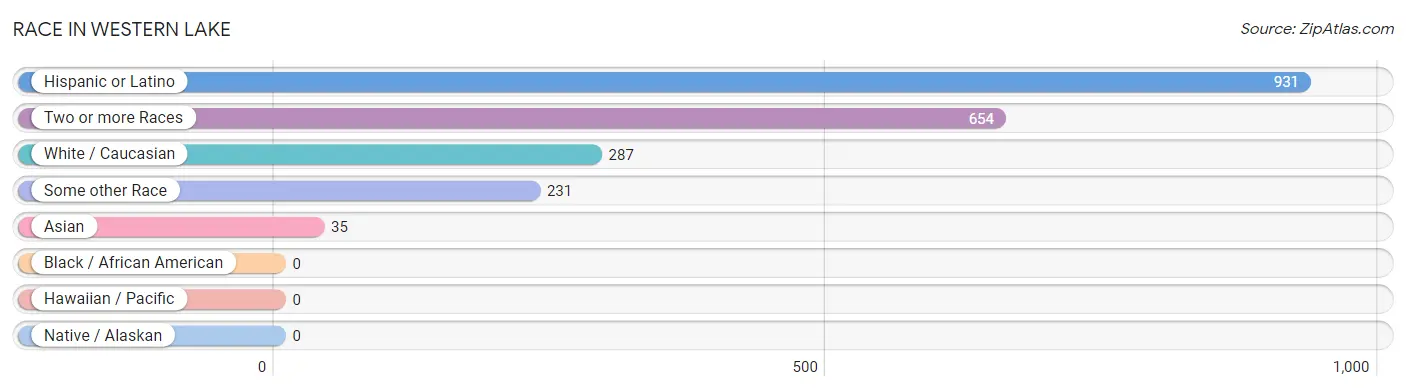
Race in Western Lake
The most populous races in Western Lake are Hispanic or Latino (931 | 77.1%), Two or more Races (654 | 54.2%), and White / Caucasian (287 | 23.8%).
| Race | # Population | % Population |
| Asian | 35 | 2.9% |
| Black / African American | 0 | 0.0% |
| Hawaiian / Pacific | 0 | 0.0% |
| Hispanic or Latino | 931 | 77.1% |
| Native / Alaskan | 0 | 0.0% |
| White / Caucasian | 287 | 23.8% |
| Two or more Races | 654 | 54.2% |
| Some other Race | 231 | 19.1% |
| Total | 1,207 | 100.0% |
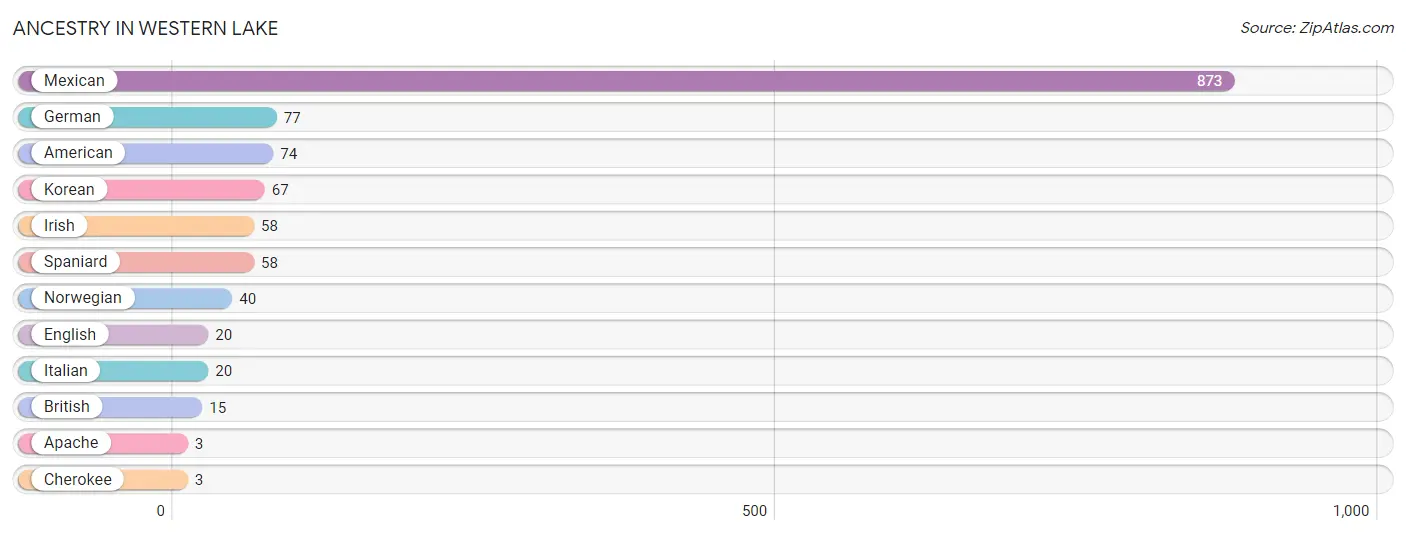
Ancestry in Western Lake
The most populous ancestries reported in Western Lake are Mexican (873 | 72.3%), German (77 | 6.4%), American (74 | 6.1%), Korean (67 | 5.6%), and Irish (58 | 4.8%), together accounting for 95.2% of all Western Lake residents.
| Ancestry | # Population | % Population |
| American | 74 | 6.1% |
| Apache | 3 | 0.3% |
| British | 15 | 1.2% |
| Cherokee | 3 | 0.3% |
| English | 20 | 1.7% |
| German | 77 | 6.4% |
| Irish | 58 | 4.8% |
| Italian | 20 | 1.7% |
| Korean | 67 | 5.6% |
| Mexican | 873 | 72.3% |
| Norwegian | 40 | 3.3% |
| Spaniard | 58 | 4.8% | View All 12 Rows |
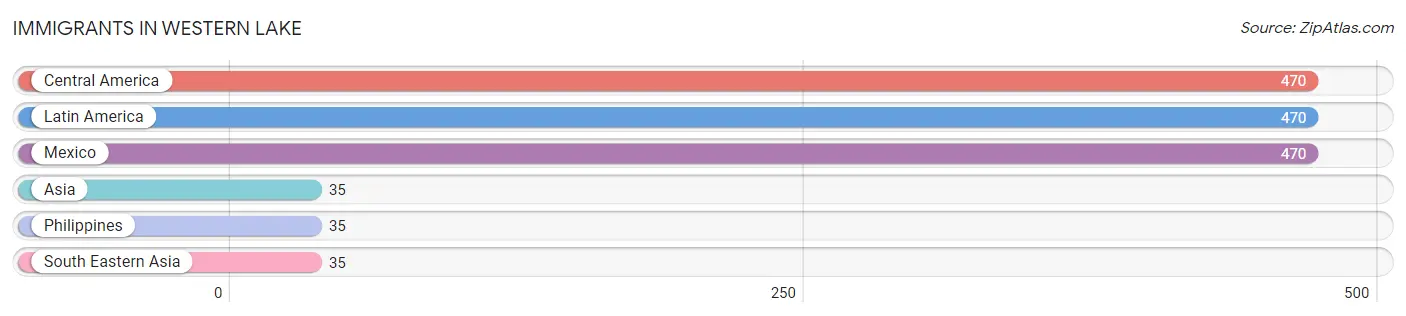
Immigrants in Western Lake
The most numerous immigrant groups reported in Western Lake came from Central America (470 | 38.9%), Latin America (470 | 38.9%), Mexico (470 | 38.9%), Asia (35 | 2.9%), and Philippines (35 | 2.9%), together accounting for 122.6% of all Western Lake residents.
| Immigration Origin | # Population | % Population |
| Asia | 35 | 2.9% |
| Central America | 470 | 38.9% |
| Latin America | 470 | 38.9% |
| Mexico | 470 | 38.9% |
| Philippines | 35 | 2.9% |
| South Eastern Asia | 35 | 2.9% | View All 6 Rows |
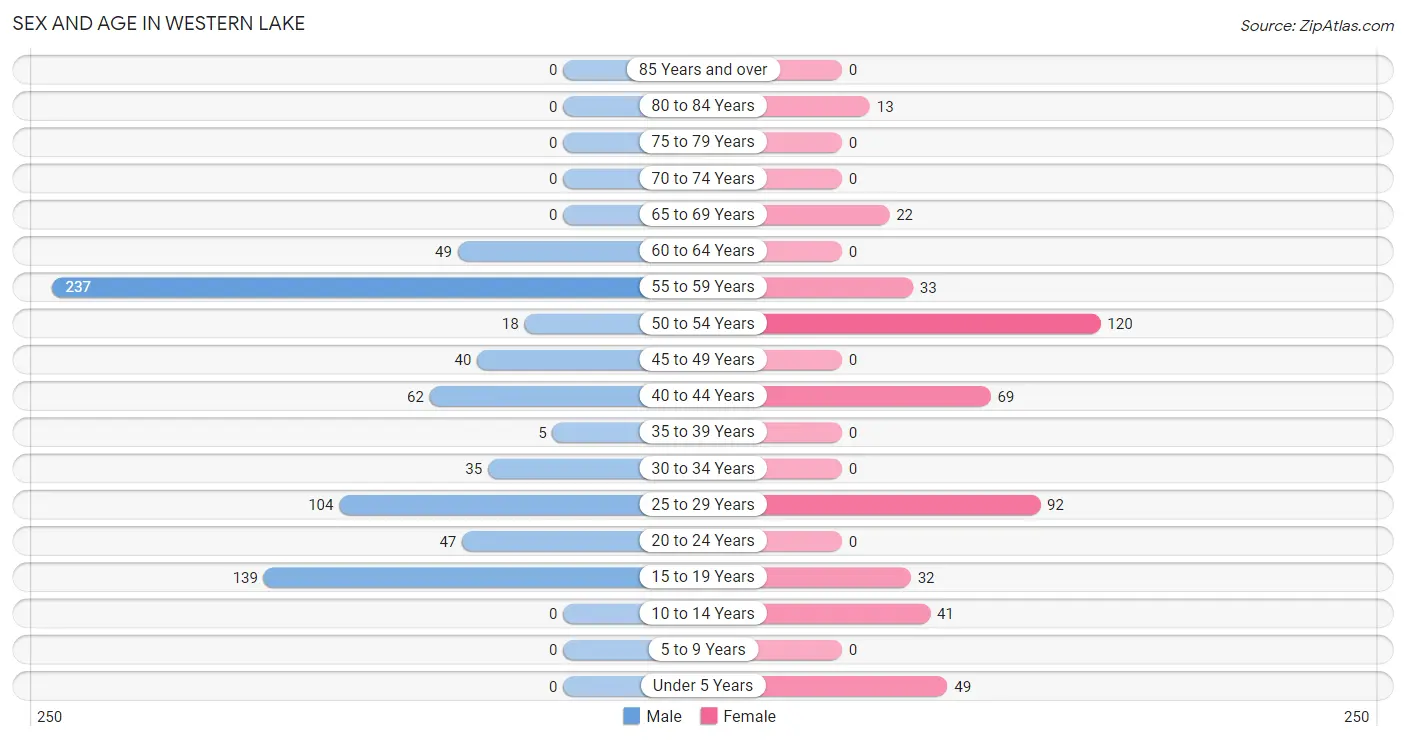
Sex and Age in Western Lake
Sex and Age in Western Lake
The most populous age groups in Western Lake are 55 to 59 Years (237 | 32.2%) for men and 50 to 54 Years (120 | 25.5%) for women.
| Age Bracket | Male | Female |
| Under 5 Years | 0 (0.0%) | 49 (10.4%) |
| 5 to 9 Years | 0 (0.0%) | 0 (0.0%) |
| 10 to 14 Years | 0 (0.0%) | 41 (8.7%) |
| 15 to 19 Years | 139 (18.9%) | 32 (6.8%) |
| 20 to 24 Years | 47 (6.4%) | 0 (0.0%) |
| 25 to 29 Years | 104 (14.1%) | 92 (19.5%) |
| 30 to 34 Years | 35 (4.8%) | 0 (0.0%) |
| 35 to 39 Years | 5 (0.7%) | 0 (0.0%) |
| 40 to 44 Years | 62 (8.4%) | 69 (14.6%) |
| 45 to 49 Years | 40 (5.4%) | 0 (0.0%) |
| 50 to 54 Years | 18 (2.5%) | 120 (25.5%) |
| 55 to 59 Years | 237 (32.2%) | 33 (7.0%) |
| 60 to 64 Years | 49 (6.7%) | 0 (0.0%) |
| 65 to 69 Years | 0 (0.0%) | 22 (4.7%) |
| 70 to 74 Years | 0 (0.0%) | 0 (0.0%) |
| 75 to 79 Years | 0 (0.0%) | 0 (0.0%) |
| 80 to 84 Years | 0 (0.0%) | 13 (2.8%) |
| 85 Years and over | 0 (0.0%) | 0 (0.0%) |
| Total | 736 (100.0%) | 471 (100.0%) |
Families and Households in Western Lake
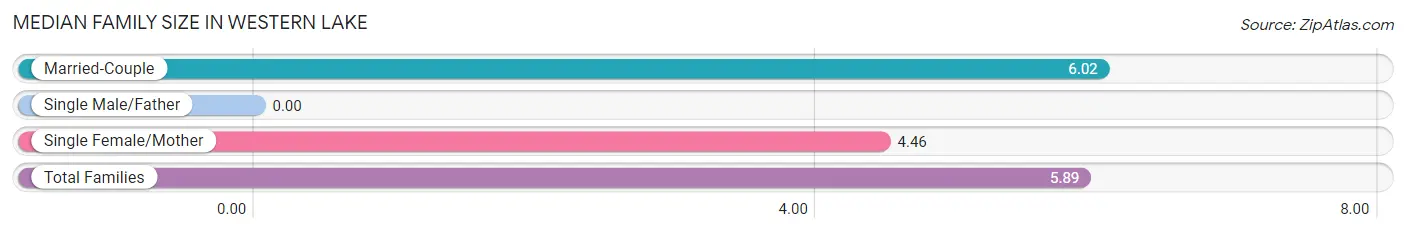
Median Family Size in Western Lake
| Family Type | # Families | Family Size |
| Married-Couple | 145 (91.8%) | 6.02 |
| Single Male/Father | 0 (0.0%) | - |
| Single Female/Mother | 13 (8.2%) | 4.46 |
| Total Families | 158 (100.0%) | 5.89 |
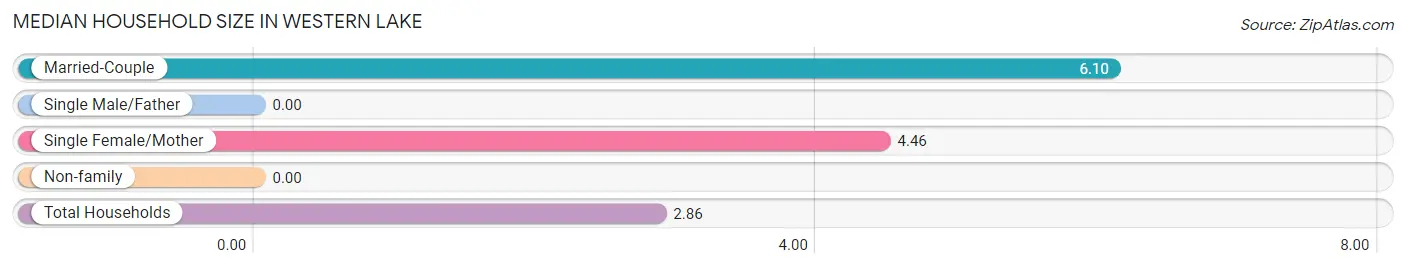
Median Household Size in Western Lake
| Household Type | # Households | Household Size |
| Married-Couple | 145 (34.4%) | 6.10 |
| Single Male/Father | 0 (0.0%) | - |
| Single Female/Mother | 13 (3.1%) | 4.46 |
| Non-family | 264 (62.6%) | - |
| Total Households | 422 (100.0%) | 2.86 |
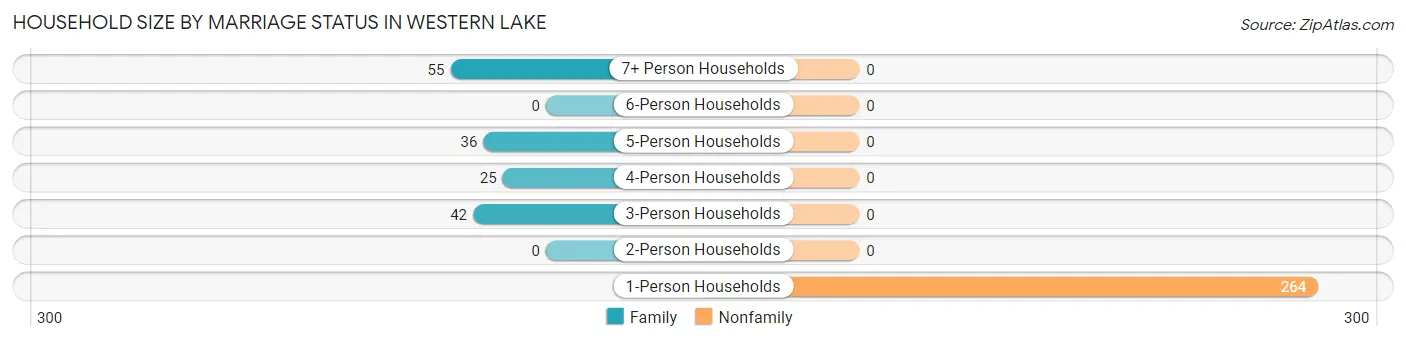
Household Size by Marriage Status in Western Lake
Out of a total of 422 households in Western Lake, 158 (37.4%) are family households, while 264 (62.6%) are nonfamily households. The most numerous type of family households are 7+ person households, comprising 55, and the most common type of nonfamily households are 1-person households, comprising 264.
| Household Size | Family Households | Nonfamily Households |
| 1-Person Households | - | 264 (62.6%) |
| 2-Person Households | 0 (0.0%) | 0 (0.0%) |
| 3-Person Households | 42 (10.0%) | 0 (0.0%) |
| 4-Person Households | 25 (5.9%) | 0 (0.0%) |
| 5-Person Households | 36 (8.5%) | 0 (0.0%) |
| 6-Person Households | 0 (0.0%) | 0 (0.0%) |
| 7+ Person Households | 55 (13.0%) | 0 (0.0%) |
| Total | 158 (37.4%) | 264 (62.6%) |
Female Fertility in Western Lake
Fertility by Age in Western Lake
| Age Bracket | Women with Births | Births / 1,000 Women |
| 15 to 19 years | 0 (0.0%) | 0.0 |
| 20 to 34 years | 0 (0.0%) | 0.0 |
| 35 to 50 years | 0 (0.0%) | 0.0 |
| Total | 0 (0.0%) | 0.0 |
Fertility by Age by Marriage Status in Western Lake
| Age Bracket | Married | Unmarried |
| 15 to 19 years | 0 (0.0%) | 0 (0.0%) |
| 20 to 34 years | 0 (0.0%) | 0 (0.0%) |
| 35 to 50 years | 0 (0.0%) | 0 (0.0%) |
| Total | 0 (0.0%) | 0 (0.0%) |
Fertility by Education in Western Lake
| Educational Attainment | Women with Births | Births / 1,000 Women |
| Less than High School | 0 (0.0%) | 0.0 |
| High School Diploma | 0 (0.0%) | 0.0 |
| College or Associate's Degree | 0 (0.0%) | 0.0 |
| Bachelor's Degree | 0 (0.0%) | 0.0 |
| Graduate Degree | 0 (0.0%) | 0.0 |
| Total | 0 (0.0%) | 0.0 |
Fertility by Education by Marriage Status in Western Lake
| Educational Attainment | Married | Unmarried |
| Less than High School | 0 (0.0%) | 0 (0.0%) |
| High School Diploma | 0 (0.0%) | 0 (0.0%) |
| College or Associate's Degree | 0 (0.0%) | 0 (0.0%) |
| Bachelor's Degree | 0 (0.0%) | 0 (0.0%) |
| Graduate Degree | 0 (0.0%) | 0 (0.0%) |
| Total | 0 (0.0%) | 0 (0.0%) |
Employment Characteristics in Western Lake
Employment by Class of Employer in Western Lake
Among the 450 employed individuals in Western Lake, private company employees (225 | 50.0%), local government employees (95 | 21.1%), and self-employed (not incorporated) (90 | 20.0%) make up the most common classes of employment.
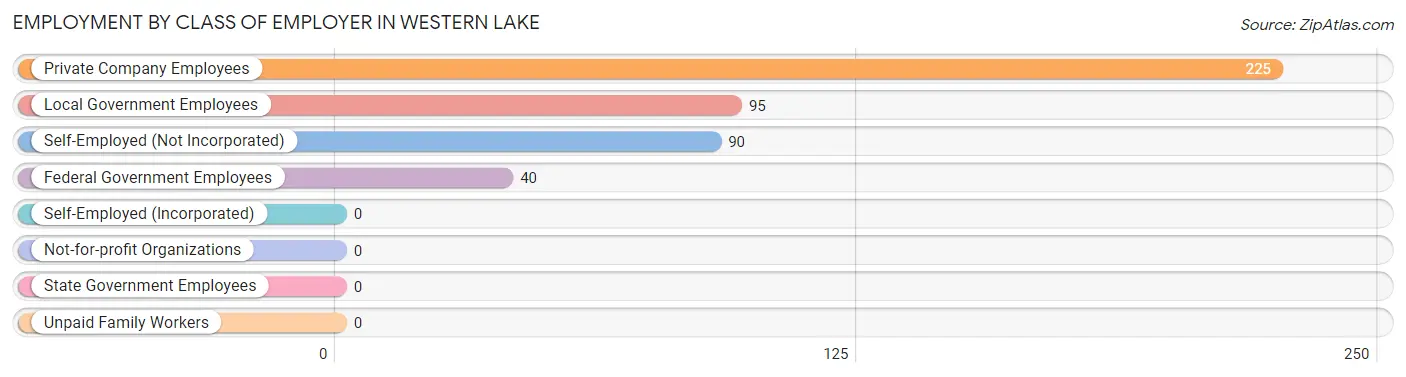
| Employer Class | # Employees | % Employees |
| Private Company Employees | 225 | 50.0% |
| Self-Employed (Incorporated) | 0 | 0.0% |
| Self-Employed (Not Incorporated) | 90 | 20.0% |
| Not-for-profit Organizations | 0 | 0.0% |
| Local Government Employees | 95 | 21.1% |
| State Government Employees | 0 | 0.0% |
| Federal Government Employees | 40 | 8.9% |
| Unpaid Family Workers | 0 | 0.0% |
| Total | 450 | 100.0% |
Employment Status by Age in Western Lake
According to the labor force statistics for Western Lake, out of the total population over 16 years of age (1,059), 63.1% or 668 individuals are in the labor force, with 27.2% or 182 of them unemployed. The age group with the highest labor force participation rate is 20 to 24 years, with 100.0% or 47 individuals in the labor force. Within the labor force, the 55 to 59 years age range has the highest percentage of unemployed individuals, with 67.4% or 182 of them being unemployed.
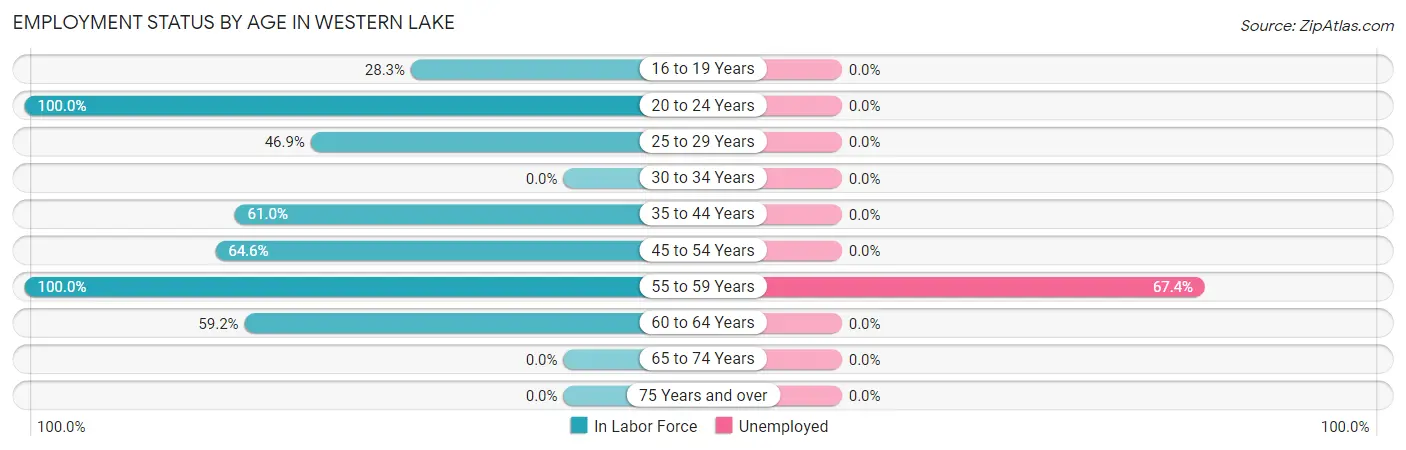
| Age Bracket | In Labor Force | Unemployed |
| 16 to 19 Years | 32 (28.3%) | 0 (0.0%) |
| 20 to 24 Years | 47 (100.0%) | 0 (0.0%) |
| 25 to 29 Years | 92 (46.9%) | 0 (0.0%) |
| 30 to 34 Years | 0 (0.0%) | 0 (0.0%) |
| 35 to 44 Years | 83 (61.0%) | 0 (0.0%) |
| 45 to 54 Years | 115 (64.6%) | 0 (0.0%) |
| 55 to 59 Years | 270 (100.0%) | 182 (67.4%) |
| 60 to 64 Years | 29 (59.2%) | 0 (0.0%) |
| 65 to 74 Years | 0 (0.0%) | 0 (0.0%) |
| 75 Years and over | 0 (0.0%) | 0 (0.0%) |
| Total | 668 (63.1%) | 182 (27.2%) |
Employment Status by Educational Attainment in Western Lake
According to labor force statistics for Western Lake, 68.2% of individuals (589) out of the total population between 25 and 64 years of age (864) are in the labor force, with 30.9% or 182 of them being unemployed. The group with the highest labor force participation rate are those with the educational attainment of bachelor's degree or higher, with 100.0% or 140 individuals in the labor force. Within the labor force, individuals with less than high school education have the highest percentage of unemployment, with 58.1% or 182 of them being unemployed.
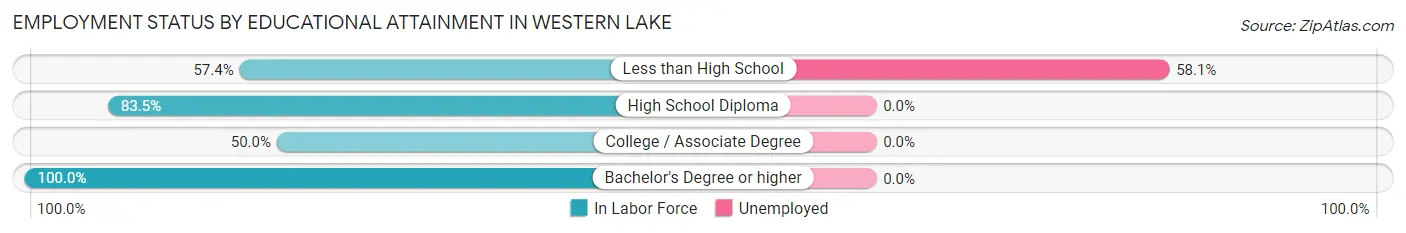
| Educational Attainment | In Labor Force | Unemployed |
| Less than High School | 313 (57.4%) | 317 (58.1%) |
| High School Diploma | 116 (83.5%) | 0 (0.0%) |
| College / Associate Degree | 20 (50.0%) | 0 (0.0%) |
| Bachelor's Degree or higher | 140 (100.0%) | 0 (0.0%) |
| Total | 589 (68.2%) | 267 (30.9%) |
Employment Occupations by Sex in Western Lake
Management, Business, Science and Arts Occupations
The most common Management, Business, Science and Arts occupations in Western Lake are Community & Social Service (92 | 18.9%), and Education Instruction & Library (92 | 18.9%).
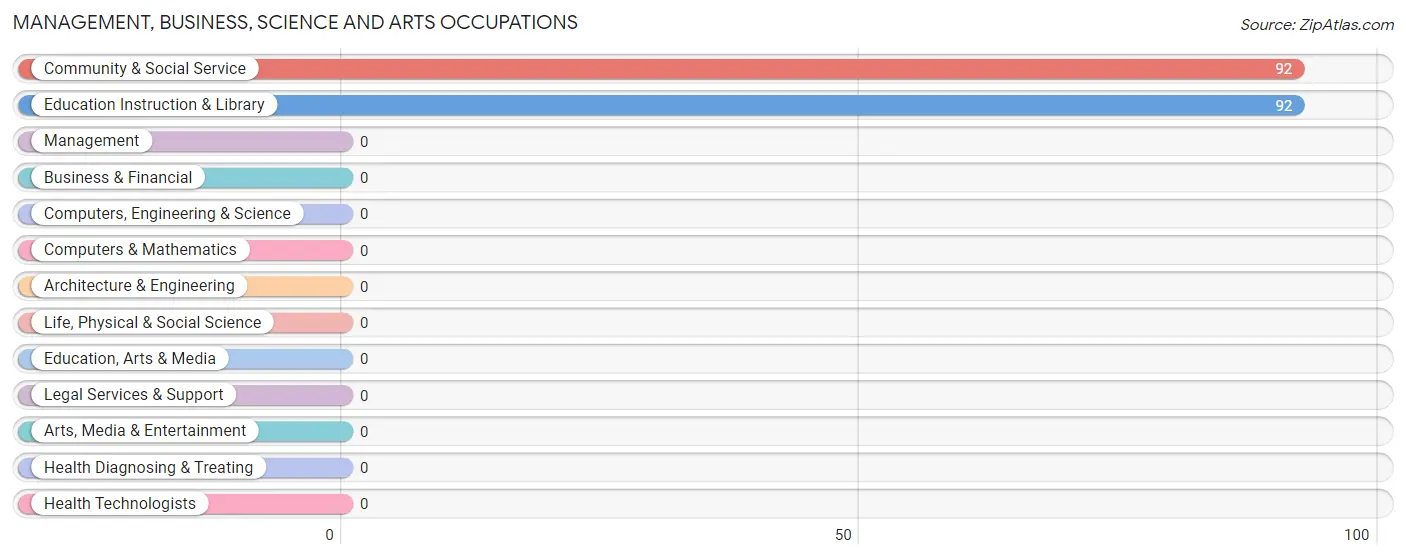
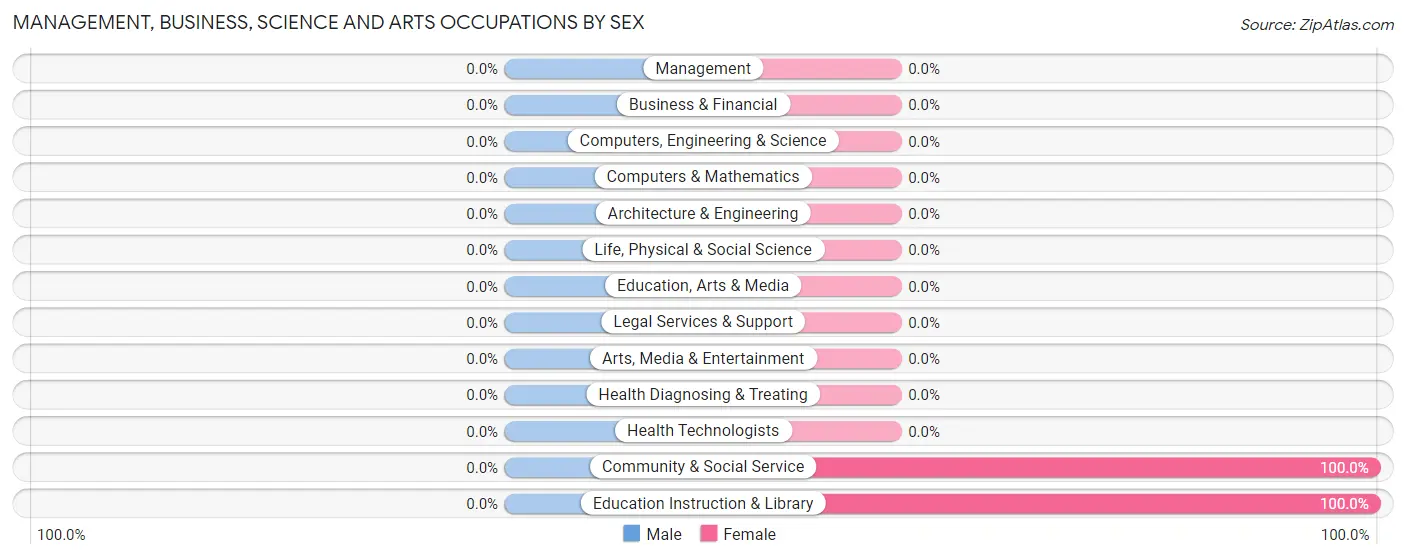
Management, Business, Science and Arts Occupations by Sex
| Occupation | Male | Female |
| Management | 0 (0.0%) | 0 (0.0%) |
| Business & Financial | 0 (0.0%) | 0 (0.0%) |
| Computers, Engineering & Science | 0 (0.0%) | 0 (0.0%) |
| Computers & Mathematics | 0 (0.0%) | 0 (0.0%) |
| Architecture & Engineering | 0 (0.0%) | 0 (0.0%) |
| Life, Physical & Social Science | 0 (0.0%) | 0 (0.0%) |
| Community & Social Service | 0 (0.0%) | 92 (100.0%) |
| Education, Arts & Media | 0 (0.0%) | 0 (0.0%) |
| Legal Services & Support | 0 (0.0%) | 0 (0.0%) |
| Education Instruction & Library | 0 (0.0%) | 92 (100.0%) |
| Arts, Media & Entertainment | 0 (0.0%) | 0 (0.0%) |
| Health Diagnosing & Treating | 0 (0.0%) | 0 (0.0%) |
| Health Technologists | 0 (0.0%) | 0 (0.0%) |
| Total (Category) | 0 (0.0%) | 92 (100.0%) |
| Total (Overall) | 233 (47.9%) | 253 (52.1%) |
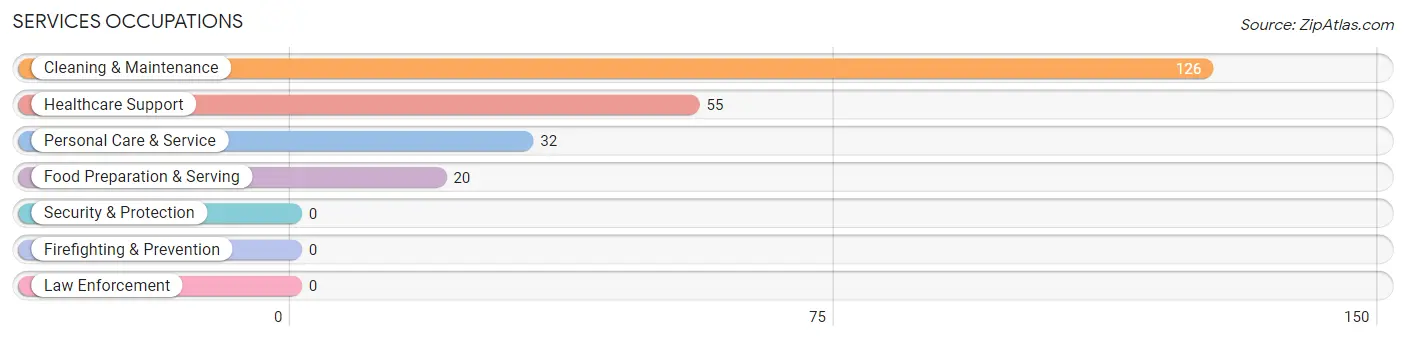
Services Occupations
The most common Services occupations in Western Lake are Cleaning & Maintenance (126 | 25.9%), Healthcare Support (55 | 11.3%), Personal Care & Service (32 | 6.6%), and Food Preparation & Serving (20 | 4.1%).
Services Occupations by Sex
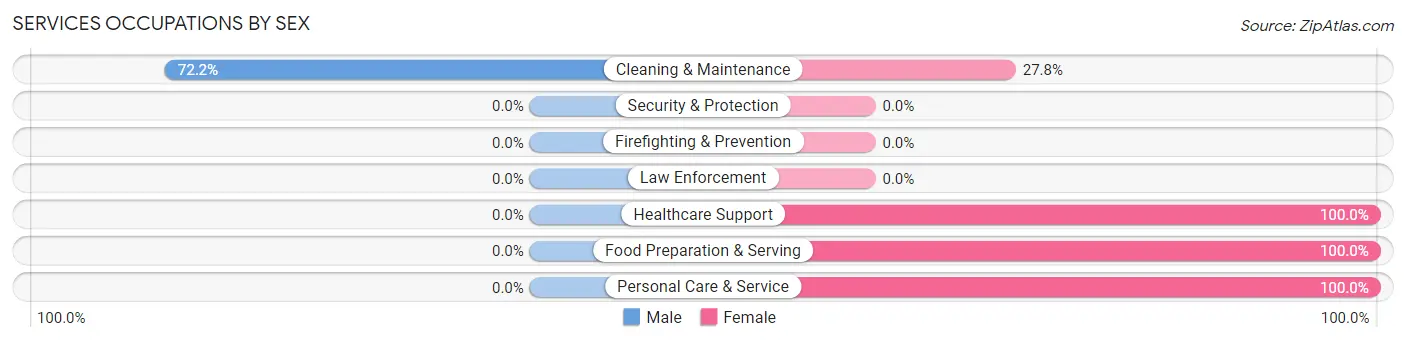
| Occupation | Male | Female |
| Healthcare Support | 0 (0.0%) | 55 (100.0%) |
| Security & Protection | 0 (0.0%) | 0 (0.0%) |
| Firefighting & Prevention | 0 (0.0%) | 0 (0.0%) |
| Law Enforcement | 0 (0.0%) | 0 (0.0%) |
| Food Preparation & Serving | 0 (0.0%) | 20 (100.0%) |
| Cleaning & Maintenance | 91 (72.2%) | 35 (27.8%) |
| Personal Care & Service | 0 (0.0%) | 32 (100.0%) |
| Total (Category) | 91 (39.1%) | 142 (60.9%) |
| Total (Overall) | 233 (47.9%) | 253 (52.1%) |
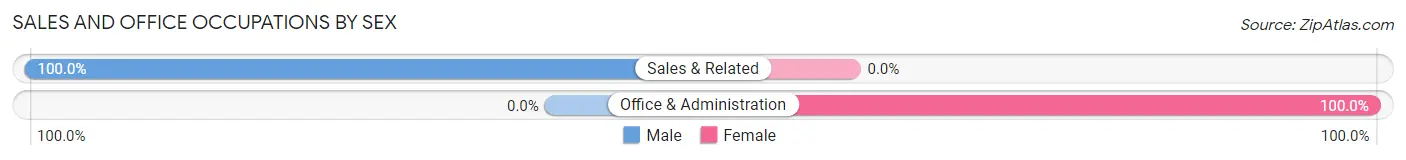
Sales and Office Occupations
The most common Sales and Office occupations in Western Lake are Sales & Related (47 | 9.7%), and Office & Administration (19 | 3.9%).
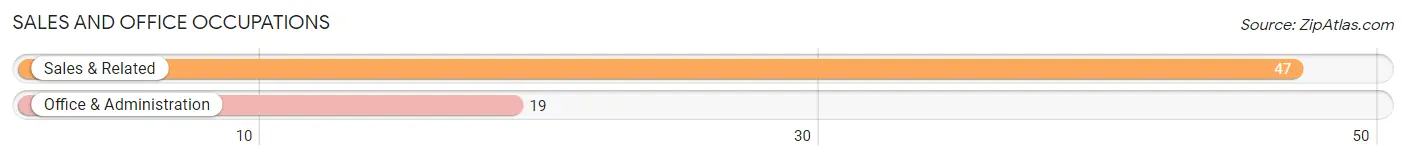
Sales and Office Occupations by Sex
| Occupation | Male | Female |
| Sales & Related | 47 (100.0%) | 0 (0.0%) |
| Office & Administration | 0 (0.0%) | 19 (100.0%) |
| Total (Category) | 47 (71.2%) | 19 (28.8%) |
| Total (Overall) | 233 (47.9%) | 253 (52.1%) |
Natural Resources, Construction and Maintenance Occupations
The most common Natural Resources, Construction and Maintenance occupations in Western Lake are , and Construction & Extraction (43 | 8.8%).
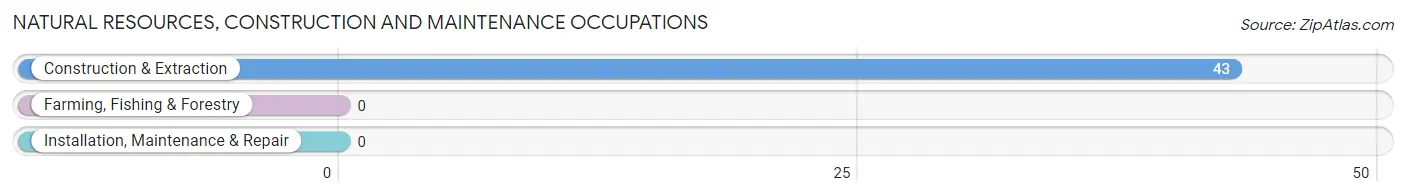
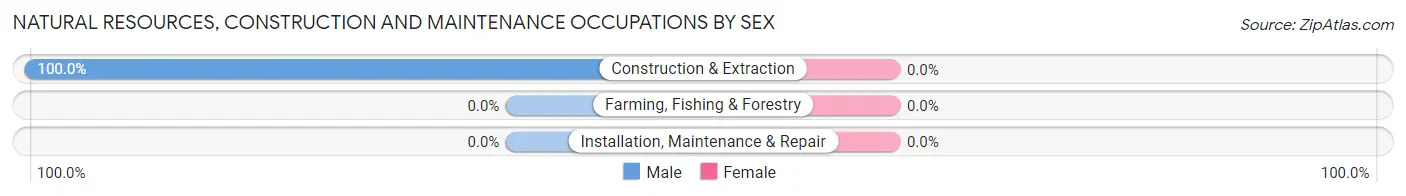
Natural Resources, Construction and Maintenance Occupations by Sex
| Occupation | Male | Female |
| Farming, Fishing & Forestry | 0 (0.0%) | 0 (0.0%) |
| Construction & Extraction | 43 (100.0%) | 0 (0.0%) |
| Installation, Maintenance & Repair | 0 (0.0%) | 0 (0.0%) |
| Total (Category) | 43 (100.0%) | 0 (0.0%) |
| Total (Overall) | 233 (47.9%) | 253 (52.1%) |
Production, Transportation and Moving Occupations
The most common Production, Transportation and Moving occupations in Western Lake are Material Moving (47 | 9.7%), and Transportation (5 | 1.0%).
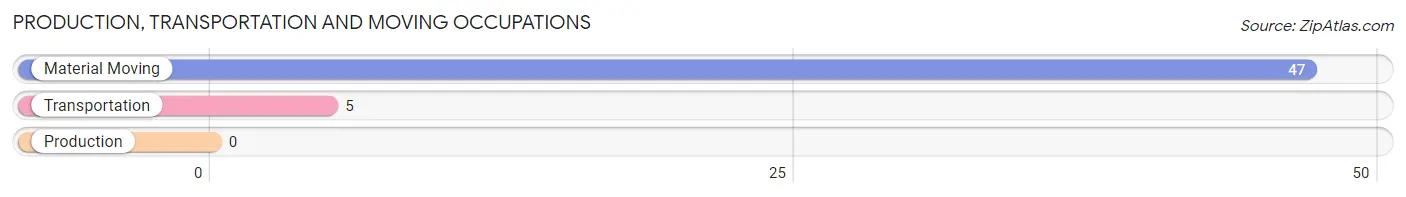
Production, Transportation and Moving Occupations by Sex
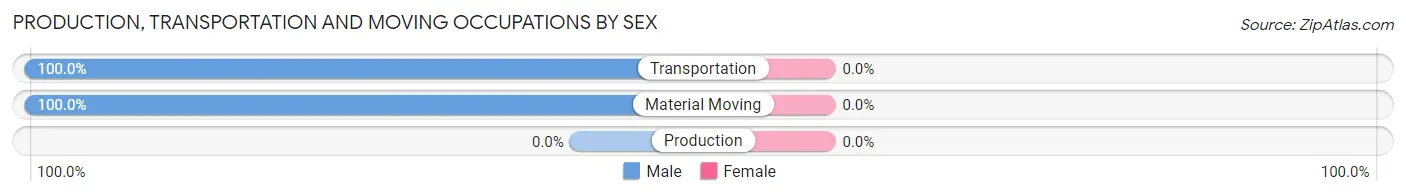
| Occupation | Male | Female |
| Production | 0 (0.0%) | 0 (0.0%) |
| Transportation | 5 (100.0%) | 0 (0.0%) |
| Material Moving | 47 (100.0%) | 0 (0.0%) |
| Total (Category) | 52 (100.0%) | 0 (0.0%) |
| Total (Overall) | 233 (47.9%) | 253 (52.1%) |
Employment Industries by Sex in Western Lake
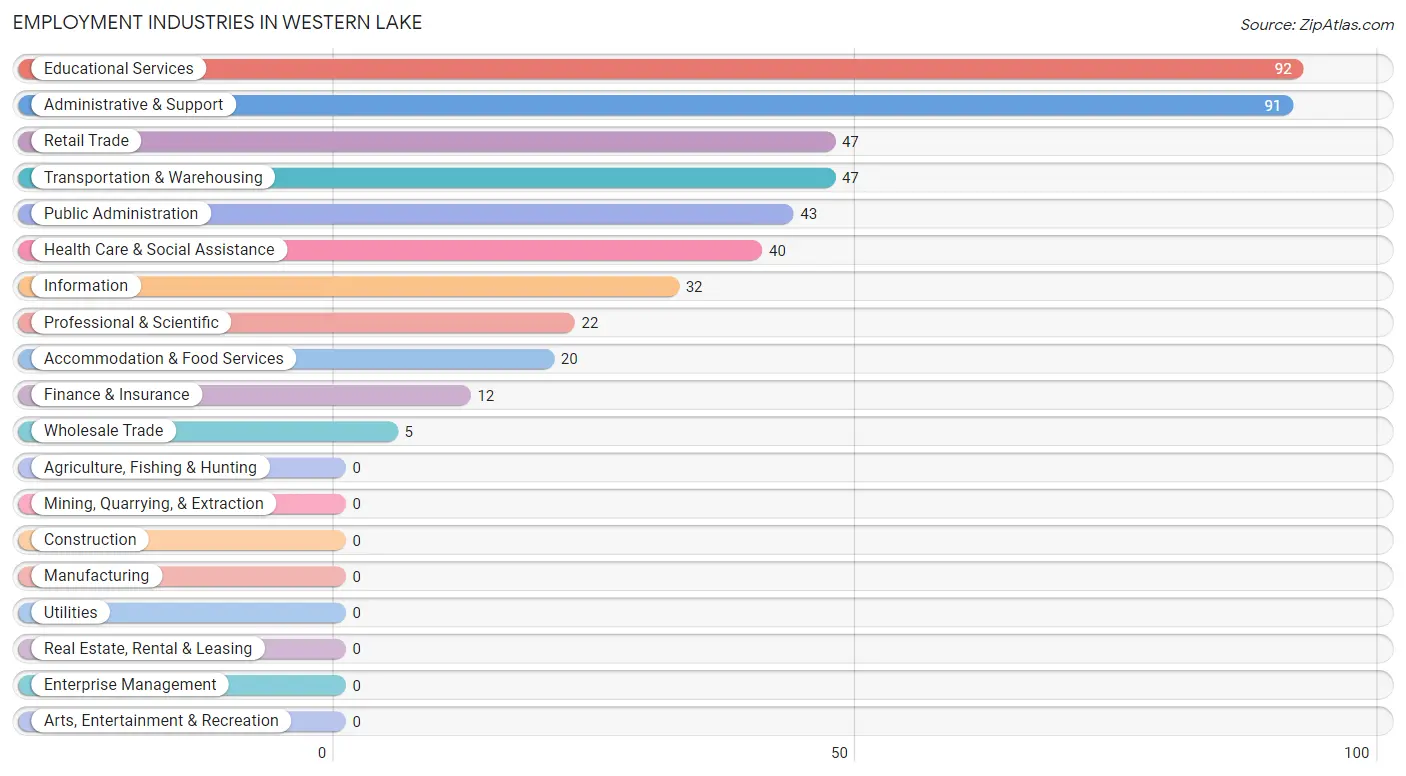
Employment Industries in Western Lake
The major employment industries in Western Lake include Educational Services (92 | 18.9%), Administrative & Support (91 | 18.7%), Retail Trade (47 | 9.7%), Transportation & Warehousing (47 | 9.7%), and Public Administration (43 | 8.8%).
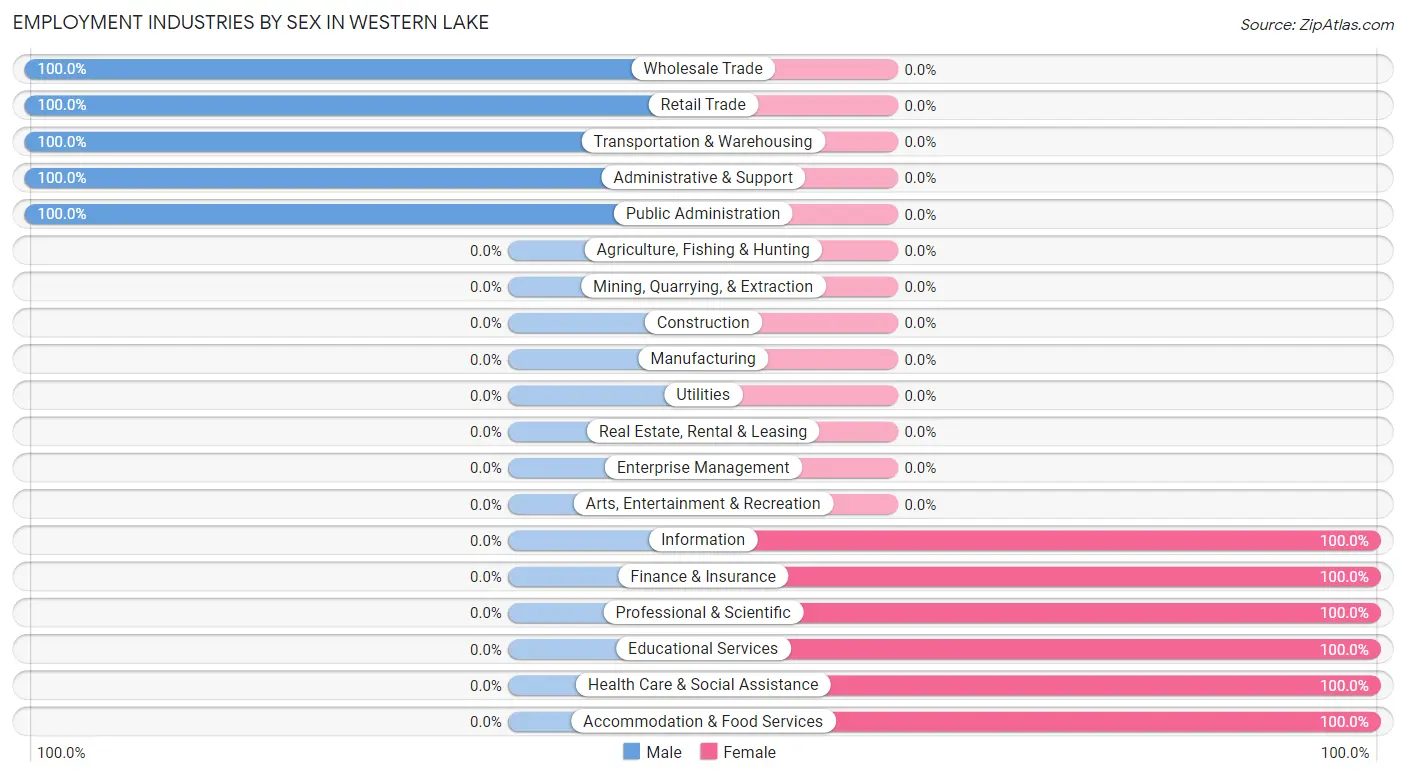
Employment Industries by Sex in Western Lake
The Western Lake industries that see more men than women are Wholesale Trade (100.0%), Retail Trade (100.0%), and Transportation & Warehousing (100.0%), whereas the industries that tend to have a higher number of women are Information (100.0%), Finance & Insurance (100.0%), and Professional & Scientific (100.0%).
| Industry | Male | Female |
| Agriculture, Fishing & Hunting | 0 (0.0%) | 0 (0.0%) |
| Mining, Quarrying, & Extraction | 0 (0.0%) | 0 (0.0%) |
| Construction | 0 (0.0%) | 0 (0.0%) |
| Manufacturing | 0 (0.0%) | 0 (0.0%) |
| Wholesale Trade | 5 (100.0%) | 0 (0.0%) |
| Retail Trade | 47 (100.0%) | 0 (0.0%) |
| Transportation & Warehousing | 47 (100.0%) | 0 (0.0%) |
| Utilities | 0 (0.0%) | 0 (0.0%) |
| Information | 0 (0.0%) | 32 (100.0%) |
| Finance & Insurance | 0 (0.0%) | 12 (100.0%) |
| Real Estate, Rental & Leasing | 0 (0.0%) | 0 (0.0%) |
| Professional & Scientific | 0 (0.0%) | 22 (100.0%) |
| Enterprise Management | 0 (0.0%) | 0 (0.0%) |
| Administrative & Support | 91 (100.0%) | 0 (0.0%) |
| Educational Services | 0 (0.0%) | 92 (100.0%) |
| Health Care & Social Assistance | 0 (0.0%) | 40 (100.0%) |
| Arts, Entertainment & Recreation | 0 (0.0%) | 0 (0.0%) |
| Accommodation & Food Services | 0 (0.0%) | 20 (100.0%) |
| Public Administration | 43 (100.0%) | 0 (0.0%) |
| Total | 233 (47.9%) | 253 (52.1%) |
Education in Western Lake
School Enrollment in Western Lake
The most common levels of schooling among the 266 students in Western Lake are high school (171 | 64.3%), college / undergraduate (54 | 20.3%), and middle school (41 | 15.4%).
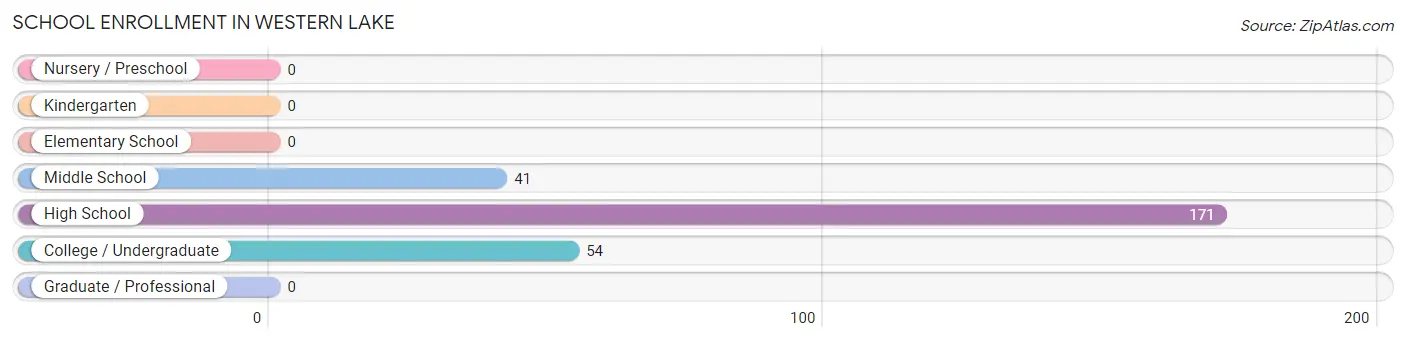
| School Level | # Students | % Students |
| Nursery / Preschool | 0 | 0.0% |
| Kindergarten | 0 | 0.0% |
| Elementary School | 0 | 0.0% |
| Middle School | 41 | 15.4% |
| High School | 171 | 64.3% |
| College / Undergraduate | 54 | 20.3% |
| Graduate / Professional | 0 | 0.0% |
| Total | 266 | 100.0% |
School Enrollment by Age by Funding Source in Western Lake
Out of a total of 266 students who are enrolled in schools in Western Lake, 7 (2.6%) attend a private institution, while the remaining 259 (97.4%) are enrolled in public schools. The age group of 35 years and over has the highest likelihood of being enrolled in private schools, with 7 (100.0% in the age bracket) enrolled. Conversely, the age group of 10 to 14 year olds has the lowest likelihood of being enrolled in a private school, with 41 (100.0% in the age bracket) attending a public institution.
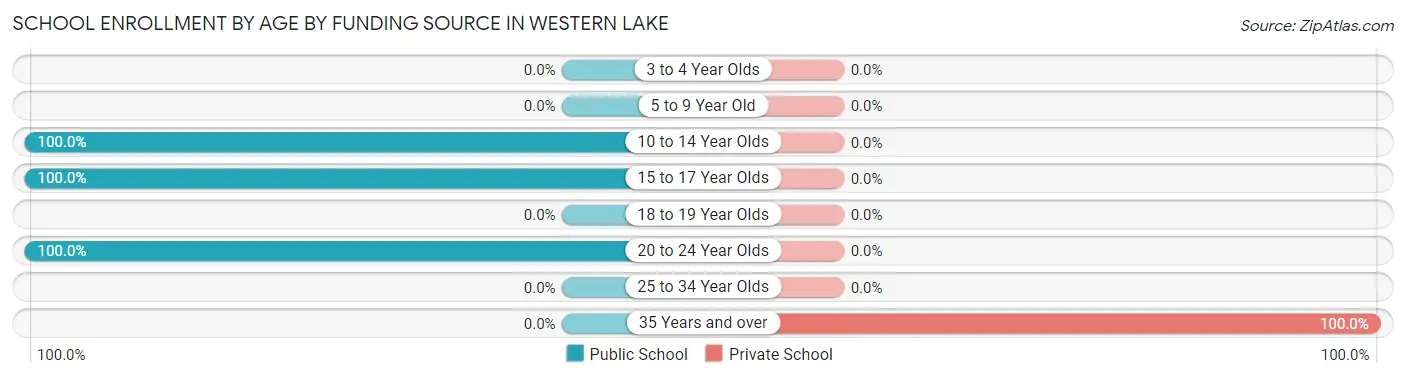
| Age Bracket | Public School | Private School |
| 3 to 4 Year Olds | 0 (0.0%) | 0 (0.0%) |
| 5 to 9 Year Old | 0 (0.0%) | 0 (0.0%) |
| 10 to 14 Year Olds | 41 (100.0%) | 0 (0.0%) |
| 15 to 17 Year Olds | 171 (100.0%) | 0 (0.0%) |
| 18 to 19 Year Olds | 0 (0.0%) | 0 (0.0%) |
| 20 to 24 Year Olds | 47 (100.0%) | 0 (0.0%) |
| 25 to 34 Year Olds | 0 (0.0%) | 0 (0.0%) |
| 35 Years and over | 0 (0.0%) | 7 (100.0%) |
| Total | 259 (97.4%) | 7 (2.6%) |
Educational Attainment by Field of Study in Western Lake
Multidisciplinary studies (92 | 65.7%), physical & health sciences (29 | 20.7%), arts & humanities (12 | 8.6%), and business (7 | 5.0%) are the most common fields of study among 140 individuals in Western Lake who have obtained a bachelor's degree or higher.
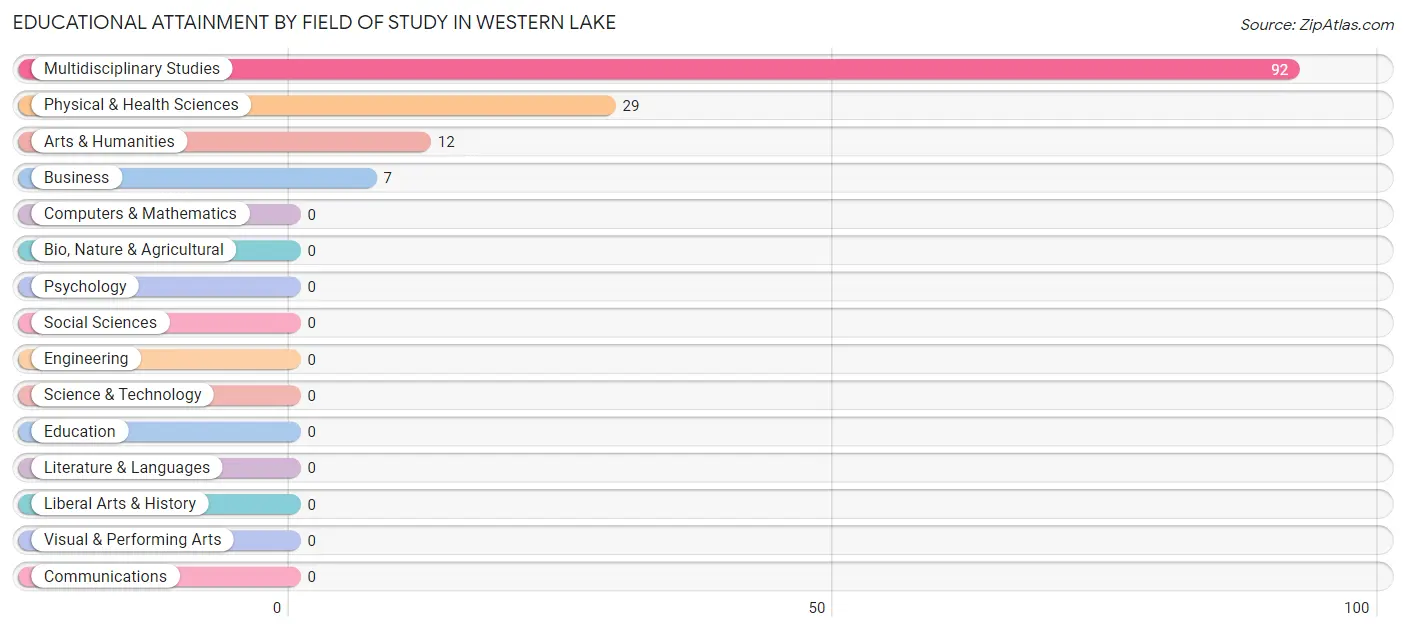
| Field of Study | # Graduates | % Graduates |
| Computers & Mathematics | 0 | 0.0% |
| Bio, Nature & Agricultural | 0 | 0.0% |
| Physical & Health Sciences | 29 | 20.7% |
| Psychology | 0 | 0.0% |
| Social Sciences | 0 | 0.0% |
| Engineering | 0 | 0.0% |
| Multidisciplinary Studies | 92 | 65.7% |
| Science & Technology | 0 | 0.0% |
| Business | 7 | 5.0% |
| Education | 0 | 0.0% |
| Literature & Languages | 0 | 0.0% |
| Liberal Arts & History | 0 | 0.0% |
| Visual & Performing Arts | 0 | 0.0% |
| Communications | 0 | 0.0% |
| Arts & Humanities | 12 | 8.6% |
| Total | 140 | 100.0% |
Transportation & Commute in Western Lake
Vehicle Availability by Sex in Western Lake
The most prevalent vehicle ownership categories in Western Lake are males with 5 or more vehicles (81, accounting for 41.1%) and females with 5 or more vehicles (164, making up 32.0%).
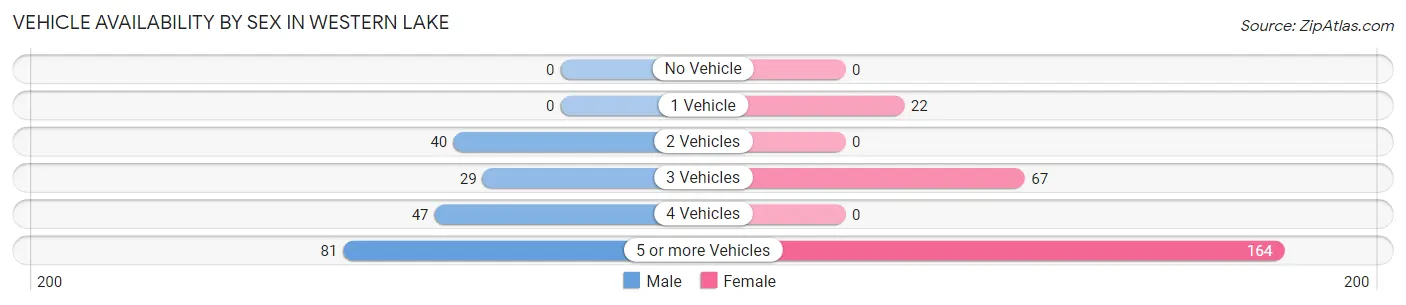
| Vehicles Available | Male | Female |
| No Vehicle | 0 (0.0%) | 0 (0.0%) |
| 1 Vehicle | 0 (0.0%) | 22 (8.7%) |
| 2 Vehicles | 40 (20.3%) | 0 (0.0%) |
| 3 Vehicles | 29 (14.7%) | 67 (26.5%) |
| 4 Vehicles | 47 (23.9%) | 0 (0.0%) |
| 5 or more Vehicles | 81 (41.1%) | 164 (64.8%) |
| Total | 197 (100.0%) | 253 (100.0%) |
Commute Time in Western Lake
The most frequently occuring commute durations in Western Lake are 25 to 29 minutes (132 commuters, 29.3%), 20 to 24 minutes (103 commuters, 22.9%), and 15 to 19 minutes (84 commuters, 18.7%).
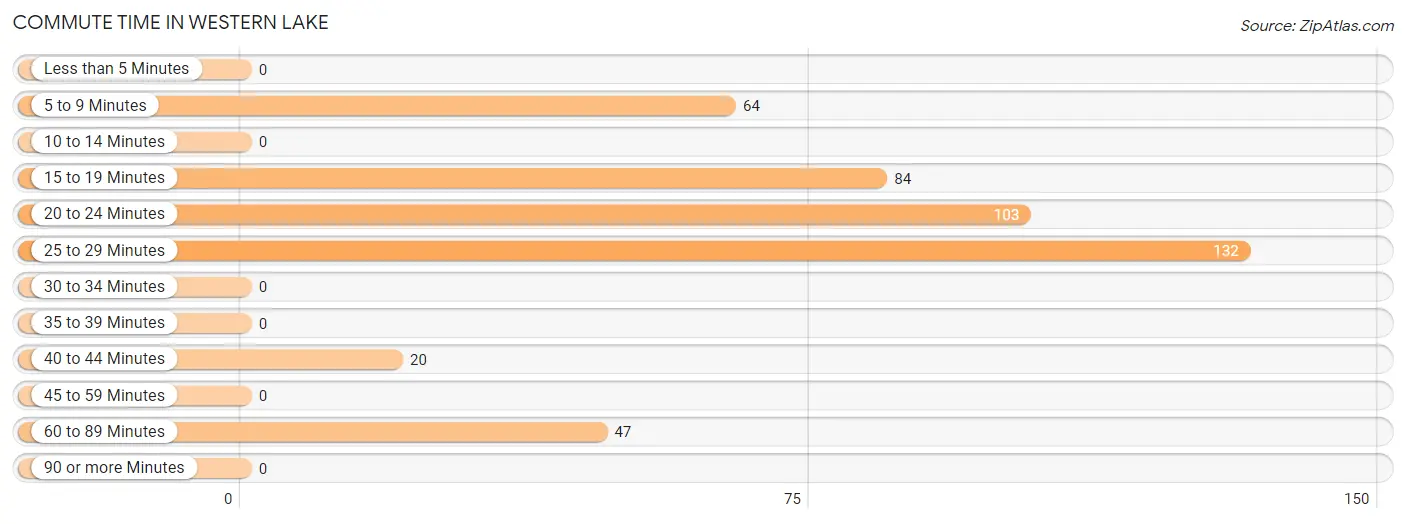
| Commute Time | # Commuters | % Commuters |
| Less than 5 Minutes | 0 | 0.0% |
| 5 to 9 Minutes | 64 | 14.2% |
| 10 to 14 Minutes | 0 | 0.0% |
| 15 to 19 Minutes | 84 | 18.7% |
| 20 to 24 Minutes | 103 | 22.9% |
| 25 to 29 Minutes | 132 | 29.3% |
| 30 to 34 Minutes | 0 | 0.0% |
| 35 to 39 Minutes | 0 | 0.0% |
| 40 to 44 Minutes | 20 | 4.4% |
| 45 to 59 Minutes | 0 | 0.0% |
| 60 to 89 Minutes | 47 | 10.4% |
| 90 or more Minutes | 0 | 0.0% |
Commute Time by Sex in Western Lake
The most common commute times in Western Lake are 15 to 19 minutes (55 commuters, 27.9%) for males and 25 to 29 minutes (92 commuters, 36.4%) for females.
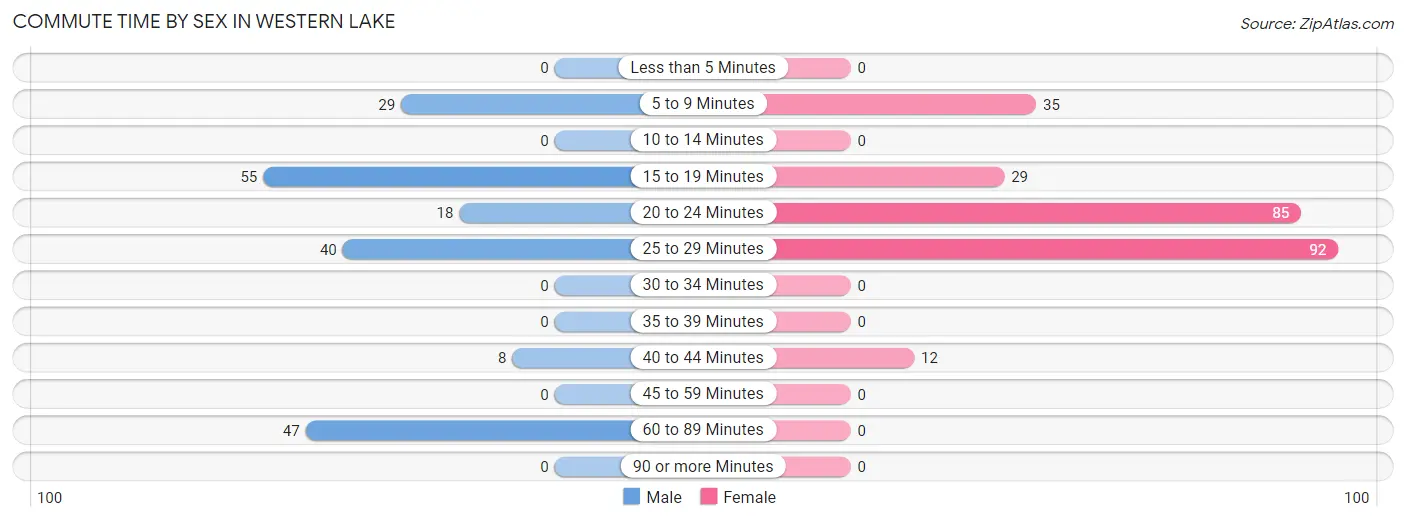
| Commute Time | Male | Female |
| Less than 5 Minutes | 0 (0.0%) | 0 (0.0%) |
| 5 to 9 Minutes | 29 (14.7%) | 35 (13.8%) |
| 10 to 14 Minutes | 0 (0.0%) | 0 (0.0%) |
| 15 to 19 Minutes | 55 (27.9%) | 29 (11.5%) |
| 20 to 24 Minutes | 18 (9.1%) | 85 (33.6%) |
| 25 to 29 Minutes | 40 (20.3%) | 92 (36.4%) |
| 30 to 34 Minutes | 0 (0.0%) | 0 (0.0%) |
| 35 to 39 Minutes | 0 (0.0%) | 0 (0.0%) |
| 40 to 44 Minutes | 8 (4.1%) | 12 (4.7%) |
| 45 to 59 Minutes | 0 (0.0%) | 0 (0.0%) |
| 60 to 89 Minutes | 47 (23.9%) | 0 (0.0%) |
| 90 or more Minutes | 0 (0.0%) | 0 (0.0%) |
Time of Departure to Work by Sex in Western Lake
The most frequent times of departure to work in Western Lake are 9:00 AM to 9:59 AM (73, 37.1%) for males and 7:00 AM to 7:29 AM (92, 36.4%) for females.
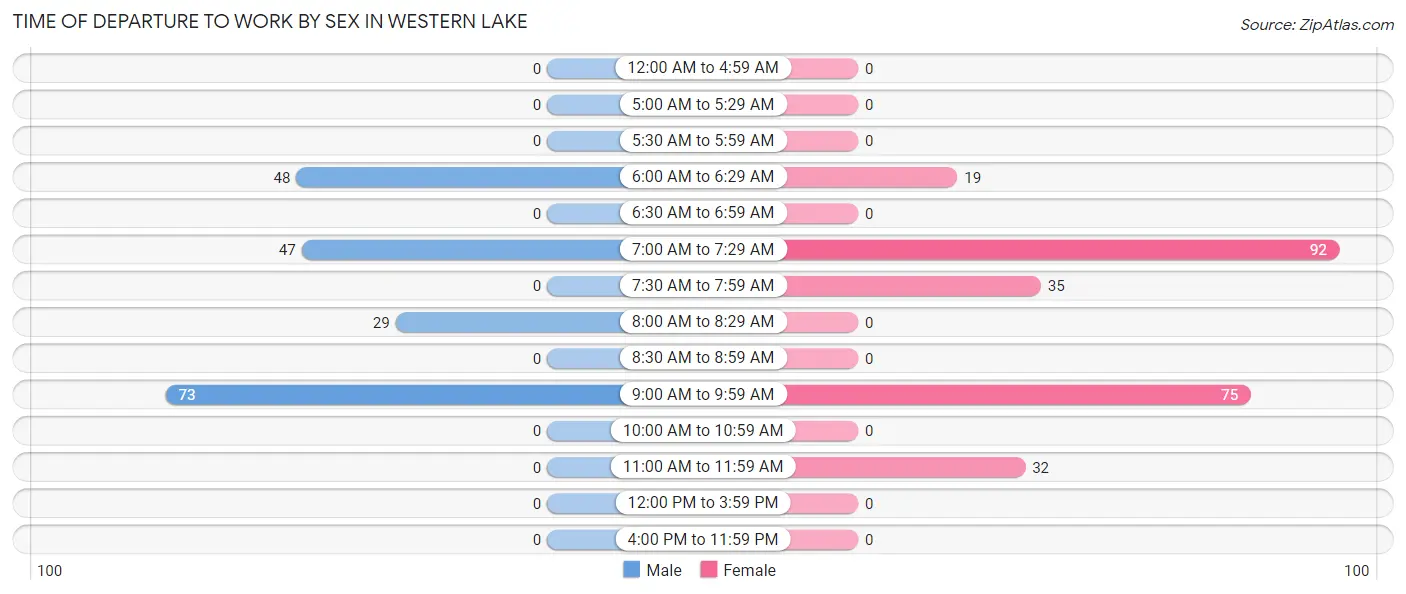
| Time of Departure | Male | Female |
| 12:00 AM to 4:59 AM | 0 (0.0%) | 0 (0.0%) |
| 5:00 AM to 5:29 AM | 0 (0.0%) | 0 (0.0%) |
| 5:30 AM to 5:59 AM | 0 (0.0%) | 0 (0.0%) |
| 6:00 AM to 6:29 AM | 48 (24.4%) | 19 (7.5%) |
| 6:30 AM to 6:59 AM | 0 (0.0%) | 0 (0.0%) |
| 7:00 AM to 7:29 AM | 47 (23.9%) | 92 (36.4%) |
| 7:30 AM to 7:59 AM | 0 (0.0%) | 35 (13.8%) |
| 8:00 AM to 8:29 AM | 29 (14.7%) | 0 (0.0%) |
| 8:30 AM to 8:59 AM | 0 (0.0%) | 0 (0.0%) |
| 9:00 AM to 9:59 AM | 73 (37.1%) | 75 (29.6%) |
| 10:00 AM to 10:59 AM | 0 (0.0%) | 0 (0.0%) |
| 11:00 AM to 11:59 AM | 0 (0.0%) | 32 (12.7%) |
| 12:00 PM to 3:59 PM | 0 (0.0%) | 0 (0.0%) |
| 4:00 PM to 11:59 PM | 0 (0.0%) | 0 (0.0%) |
| Total | 197 (100.0%) | 253 (100.0%) |
Housing Occupancy in Western Lake
Occupancy by Ownership in Western Lake
Of the total 422 dwellings in Western Lake, owner-occupied units account for 422 (100.0%), while renter-occupied units make up 0 (0.0%).
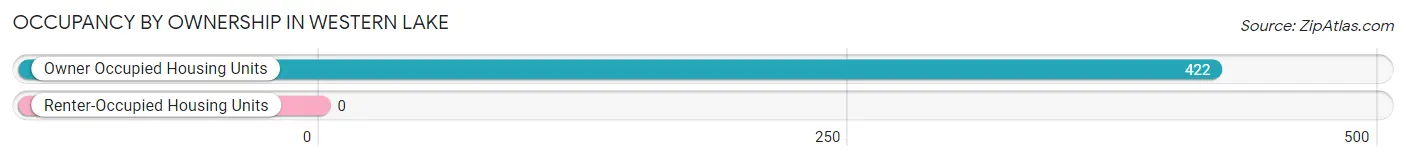
| Occupancy | # Housing Units | % Housing Units |
| Owner Occupied Housing Units | 422 | 100.0% |
| Renter-Occupied Housing Units | 0 | 0.0% |
| Total Occupied Housing Units | 422 | 100.0% |
Occupancy by Household Size in Western Lake
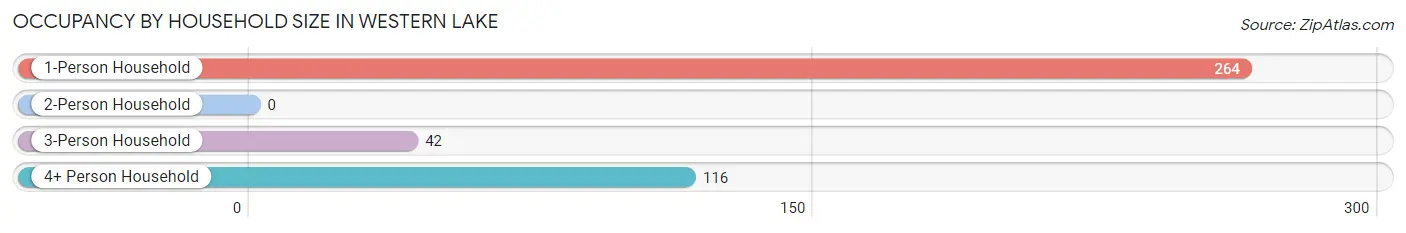
| Household Size | # Housing Units | % Housing Units |
| 1-Person Household | 264 | 62.6% |
| 2-Person Household | 0 | 0.0% |
| 3-Person Household | 42 | 10.0% |
| 4+ Person Household | 116 | 27.5% |
| Total Housing Units | 422 | 100.0% |
Occupancy by Ownership by Household Size in Western Lake
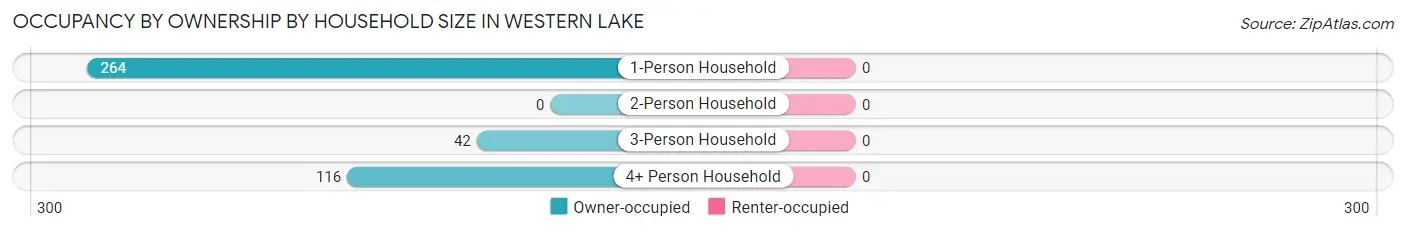
| Household Size | Owner-occupied | Renter-occupied |
| 1-Person Household | 264 (100.0%) | 0 (0.0%) |
| 2-Person Household | 0 (0.0%) | 0 (0.0%) |
| 3-Person Household | 42 (100.0%) | 0 (0.0%) |
| 4+ Person Household | 116 (100.0%) | 0 (0.0%) |
| Total Housing Units | 422 (100.0%) | 0 (0.0%) |
Occupancy by Educational Attainment in Western Lake
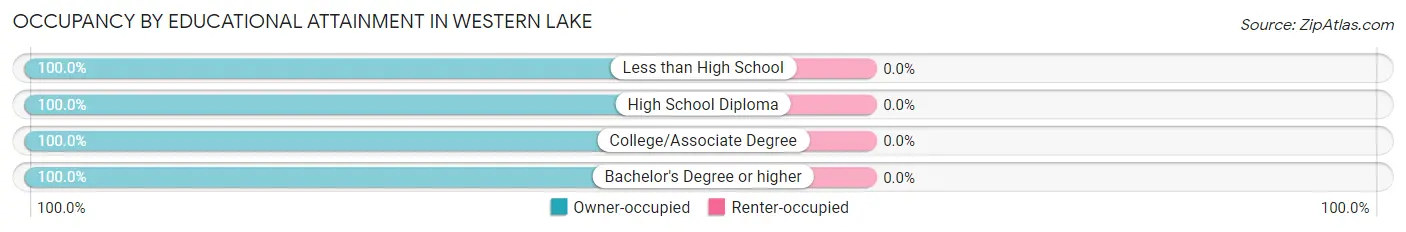
| Household Size | Owner-occupied | Renter-occupied |
| Less than High School | 286 (100.0%) | 0 (0.0%) |
| High School Diploma | 80 (100.0%) | 0 (0.0%) |
| College/Associate Degree | 20 (100.0%) | 0 (0.0%) |
| Bachelor's Degree or higher | 36 (100.0%) | 0 (0.0%) |
Occupancy by Age of Householder in Western Lake
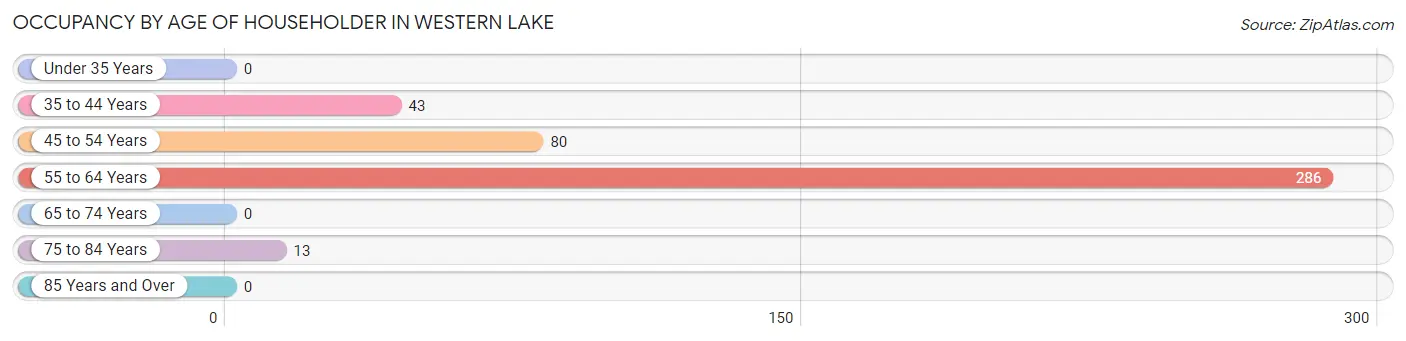
| Age Bracket | # Households | % Households |
| Under 35 Years | 0 | 0.0% |
| 35 to 44 Years | 43 | 10.2% |
| 45 to 54 Years | 80 | 19.0% |
| 55 to 64 Years | 286 | 67.8% |
| 65 to 74 Years | 0 | 0.0% |
| 75 to 84 Years | 13 | 3.1% |
| 85 Years and Over | 0 | 0.0% |
| Total | 422 | 100.0% |
Housing Finances in Western Lake
Median Income by Occupancy in Western Lake
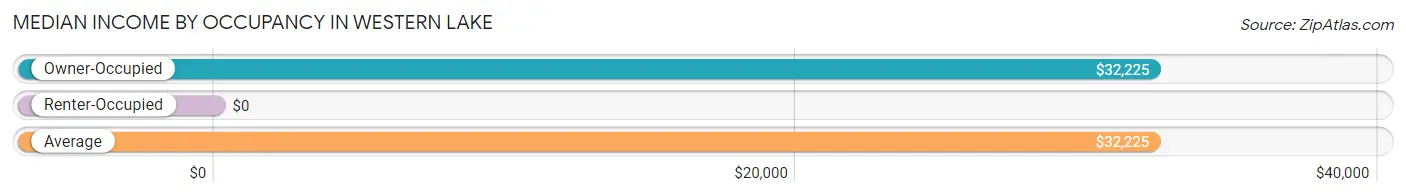
| Occupancy Type | # Households | Median Income |
| Owner-Occupied | 422 (100.0%) | $32,225 |
| Renter-Occupied | 0 (0.0%) | $0 |
| Average | 422 (100.0%) | $32,225 |
Occupancy by Householder Income Bracket in Western Lake
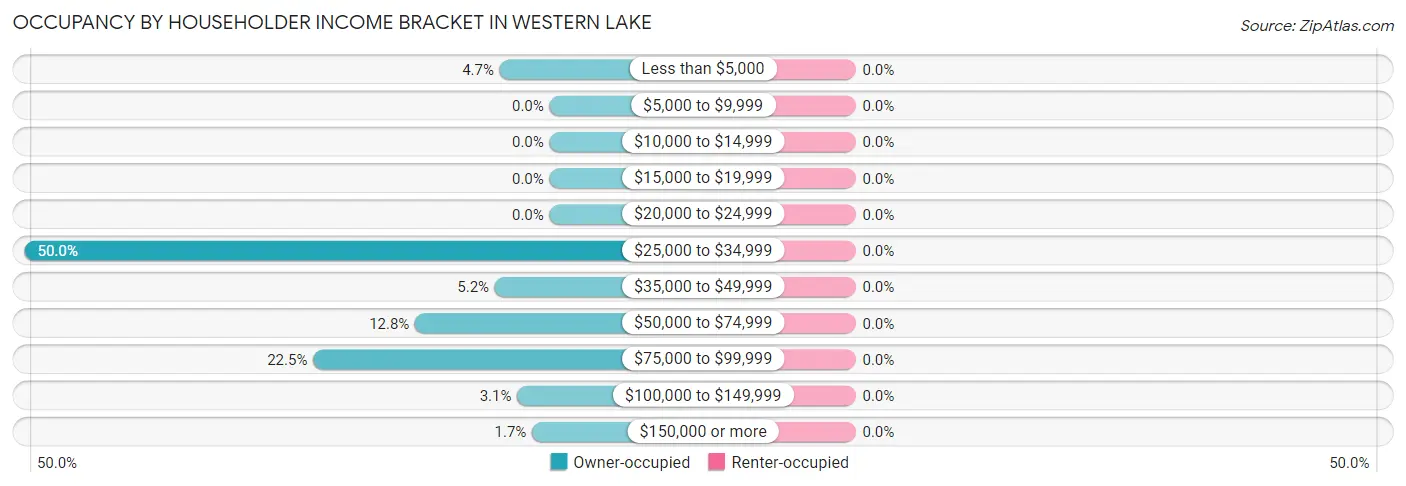
| Income Bracket | Owner-occupied | Renter-occupied |
| Less than $5,000 | 20 (4.7%) | 0 (0.0%) |
| $5,000 to $9,999 | 0 (0.0%) | 0 (0.0%) |
| $10,000 to $14,999 | 0 (0.0%) | 0 (0.0%) |
| $15,000 to $19,999 | 0 (0.0%) | 0 (0.0%) |
| $20,000 to $24,999 | 0 (0.0%) | 0 (0.0%) |
| $25,000 to $34,999 | 211 (50.0%) | 0 (0.0%) |
| $35,000 to $49,999 | 22 (5.2%) | 0 (0.0%) |
| $50,000 to $74,999 | 54 (12.8%) | 0 (0.0%) |
| $75,000 to $99,999 | 95 (22.5%) | 0 (0.0%) |
| $100,000 to $149,999 | 13 (3.1%) | 0 (0.0%) |
| $150,000 or more | 7 (1.7%) | 0 (0.0%) |
| Total | 422 (100.0%) | 0 (0.0%) |
Monthly Housing Cost Tiers in Western Lake
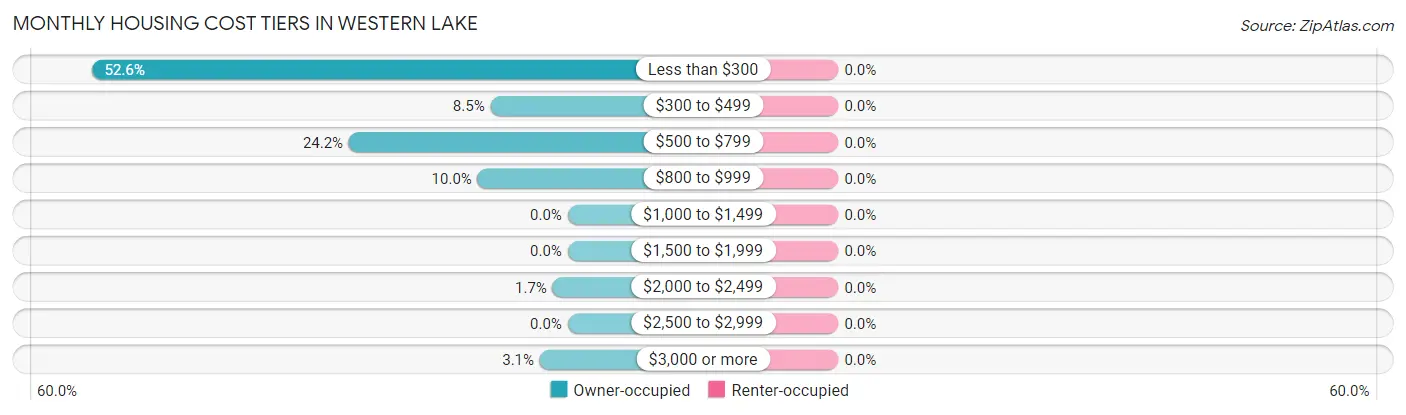
| Monthly Cost | Owner-occupied | Renter-occupied |
| Less than $300 | 222 (52.6%) | 0 (0.0%) |
| $300 to $499 | 36 (8.5%) | 0 (0.0%) |
| $500 to $799 | 102 (24.2%) | 0 (0.0%) |
| $800 to $999 | 42 (10.0%) | 0 (0.0%) |
| $1,000 to $1,499 | 0 (0.0%) | 0 (0.0%) |
| $1,500 to $1,999 | 0 (0.0%) | 0 (0.0%) |
| $2,000 to $2,499 | 7 (1.7%) | 0 (0.0%) |
| $2,500 to $2,999 | 0 (0.0%) | 0 (0.0%) |
| $3,000 or more | 13 (3.1%) | 0 (0.0%) |
| Total | 422 (100.0%) | 0 (0.0%) |
Physical Housing Characteristics in Western Lake
Housing Structures in Western Lake
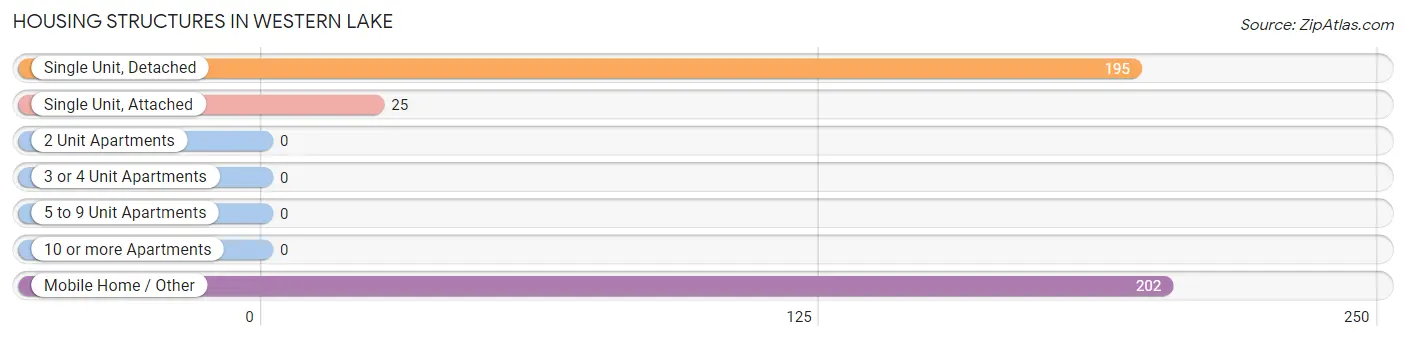
| Structure Type | # Housing Units | % Housing Units |
| Single Unit, Detached | 195 | 46.2% |
| Single Unit, Attached | 25 | 5.9% |
| 2 Unit Apartments | 0 | 0.0% |
| 3 or 4 Unit Apartments | 0 | 0.0% |
| 5 to 9 Unit Apartments | 0 | 0.0% |
| 10 or more Apartments | 0 | 0.0% |
| Mobile Home / Other | 202 | 47.9% |
| Total | 422 | 100.0% |
Housing Structures by Occupancy in Western Lake
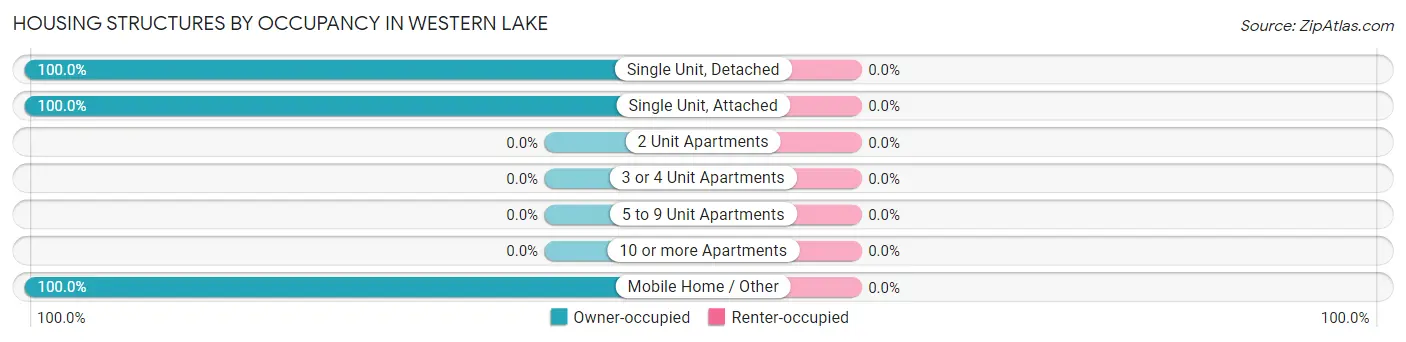
| Structure Type | Owner-occupied | Renter-occupied |
| Single Unit, Detached | 195 (100.0%) | 0 (0.0%) |
| Single Unit, Attached | 25 (100.0%) | 0 (0.0%) |
| 2 Unit Apartments | 0 (0.0%) | 0 (0.0%) |
| 3 or 4 Unit Apartments | 0 (0.0%) | 0 (0.0%) |
| 5 to 9 Unit Apartments | 0 (0.0%) | 0 (0.0%) |
| 10 or more Apartments | 0 (0.0%) | 0 (0.0%) |
| Mobile Home / Other | 202 (100.0%) | 0 (0.0%) |
| Total | 422 (100.0%) | 0 (0.0%) |
Housing Structures by Number of Rooms in Western Lake
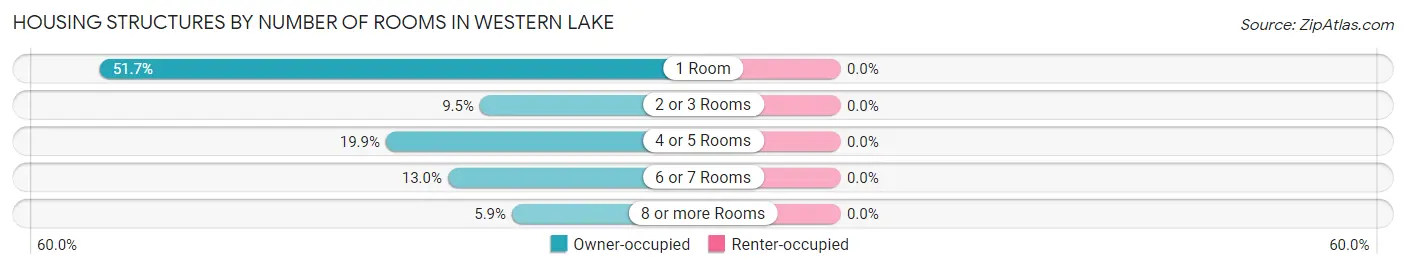
| Number of Rooms | Owner-occupied | Renter-occupied |
| 1 Room | 218 (51.7%) | 0 (0.0%) |
| 2 or 3 Rooms | 40 (9.5%) | 0 (0.0%) |
| 4 or 5 Rooms | 84 (19.9%) | 0 (0.0%) |
| 6 or 7 Rooms | 55 (13.0%) | 0 (0.0%) |
| 8 or more Rooms | 25 (5.9%) | 0 (0.0%) |
| Total | 422 (100.0%) | 0 (0.0%) |
Housing Structure by Heating Type in Western Lake
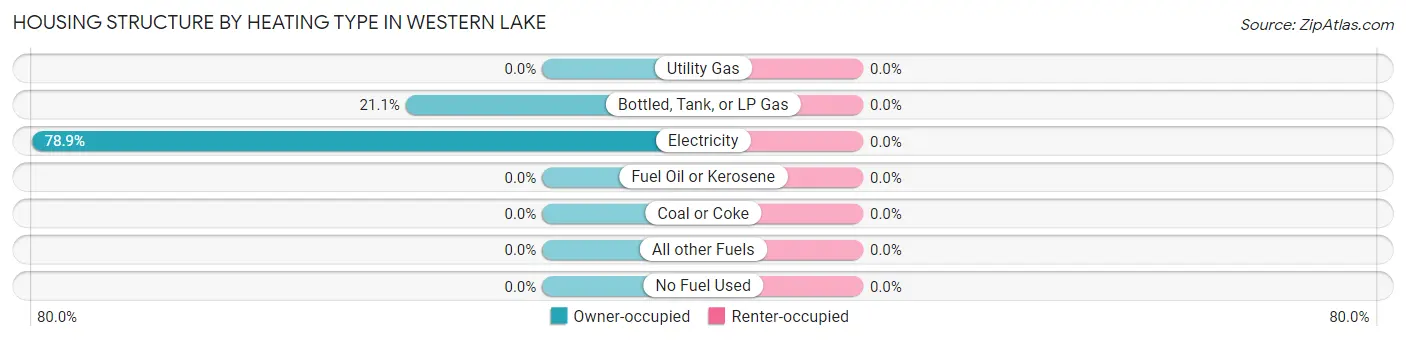
| Heating Type | Owner-occupied | Renter-occupied |
| Utility Gas | 0 (0.0%) | 0 (0.0%) |
| Bottled, Tank, or LP Gas | 89 (21.1%) | 0 (0.0%) |
| Electricity | 333 (78.9%) | 0 (0.0%) |
| Fuel Oil or Kerosene | 0 (0.0%) | 0 (0.0%) |
| Coal or Coke | 0 (0.0%) | 0 (0.0%) |
| All other Fuels | 0 (0.0%) | 0 (0.0%) |
| No Fuel Used | 0 (0.0%) | 0 (0.0%) |
| Total | 422 (100.0%) | 0 (0.0%) |
Household Vehicle Usage in Western Lake
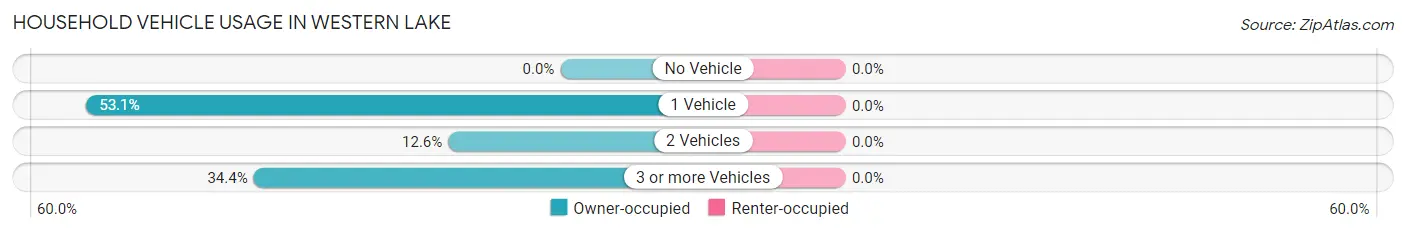
| Vehicles per Household | Owner-occupied | Renter-occupied |
| No Vehicle | 0 (0.0%) | 0 (0.0%) |
| 1 Vehicle | 224 (53.1%) | 0 (0.0%) |
| 2 Vehicles | 53 (12.6%) | 0 (0.0%) |
| 3 or more Vehicles | 145 (34.4%) | 0 (0.0%) |
| Total | 422 (100.0%) | 0 (0.0%) |
Real Estate & Mortgages in Western Lake
Real Estate and Mortgage Overview in Western Lake
| Characteristic | Without Mortgage | With Mortgage |
| Housing Units | 415 | 7 |
| Median Property Value | - | - |
| Median Household Income | $32,177 | $7 |
| Monthly Housing Costs | - | - |
| Real Estate Taxes | $199 | $0 |
Property Value by Mortgage Status in Western Lake
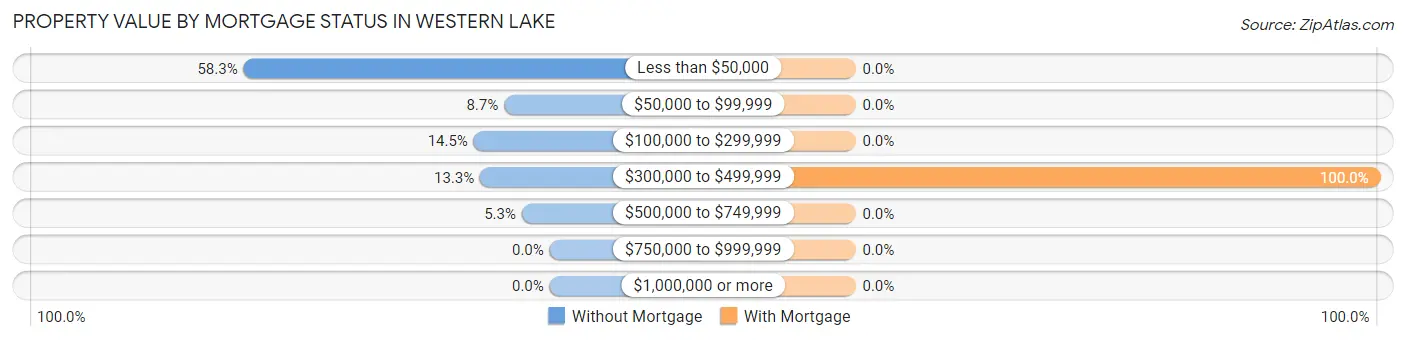
| Property Value | Without Mortgage | With Mortgage |
| Less than $50,000 | 242 (58.3%) | 0 (0.0%) |
| $50,000 to $99,999 | 36 (8.7%) | 0 (0.0%) |
| $100,000 to $299,999 | 60 (14.5%) | 0 (0.0%) |
| $300,000 to $499,999 | 55 (13.3%) | 7 (100.0%) |
| $500,000 to $749,999 | 22 (5.3%) | 0 (0.0%) |
| $750,000 to $999,999 | 0 (0.0%) | 0 (0.0%) |
| $1,000,000 or more | 0 (0.0%) | 0 (0.0%) |
| Total | 415 (100.0%) | 7 (100.0%) |
Household Income by Mortgage Status in Western Lake
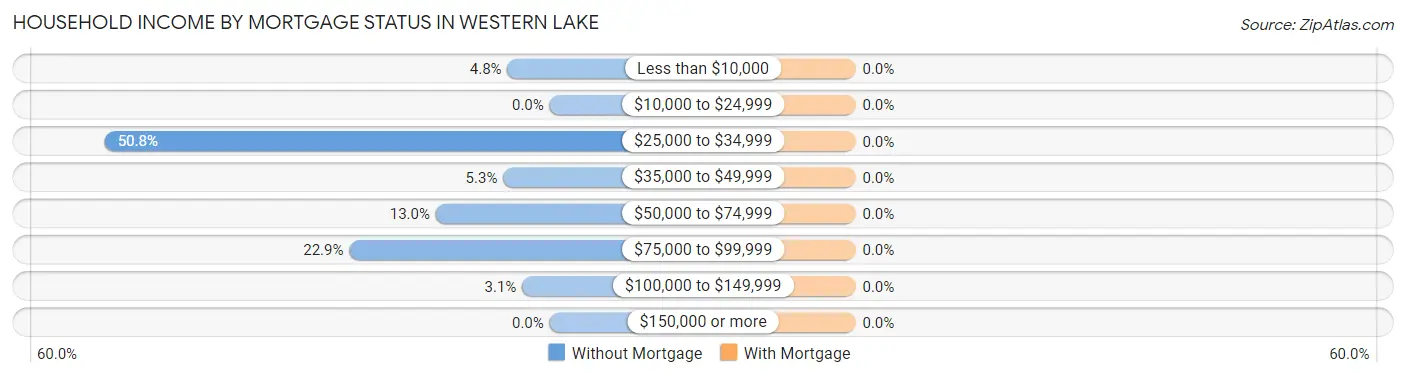
| Household Income | Without Mortgage | With Mortgage |
| Less than $10,000 | 20 (4.8%) | 0 (0.0%) |
| $10,000 to $24,999 | 0 (0.0%) | 0 (0.0%) |
| $25,000 to $34,999 | 211 (50.8%) | 0 (0.0%) |
| $35,000 to $49,999 | 22 (5.3%) | 0 (0.0%) |
| $50,000 to $74,999 | 54 (13.0%) | 0 (0.0%) |
| $75,000 to $99,999 | 95 (22.9%) | 0 (0.0%) |
| $100,000 to $149,999 | 13 (3.1%) | 0 (0.0%) |
| $150,000 or more | 0 (0.0%) | 0 (0.0%) |
| Total | 415 (100.0%) | 7 (100.0%) |
Property Value to Household Income Ratio in Western Lake
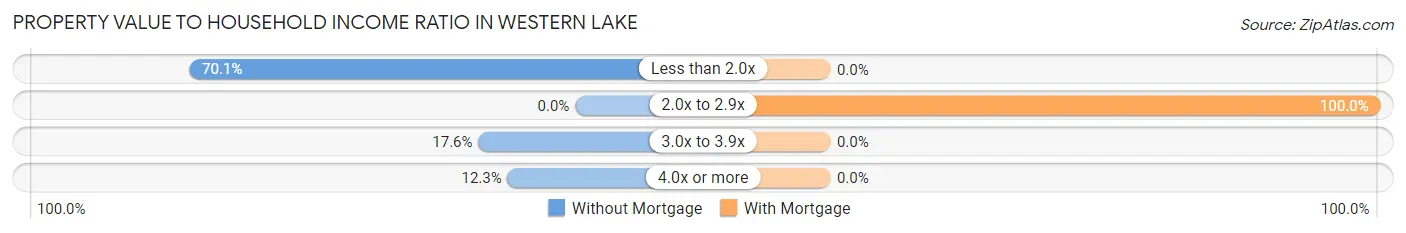
| Value-to-Income Ratio | Without Mortgage | With Mortgage |
| Less than 2.0x | 291 (70.1%) | 0 (0.0%) |
| 2.0x to 2.9x | 0 (0.0%) | 7 (100.0%) |
| 3.0x to 3.9x | 73 (17.6%) | 0 (0.0%) |
| 4.0x or more | 51 (12.3%) | 0 (0.0%) |
| Total | 415 (100.0%) | 7 (100.0%) |
Real Estate Taxes by Mortgage Status in Western Lake
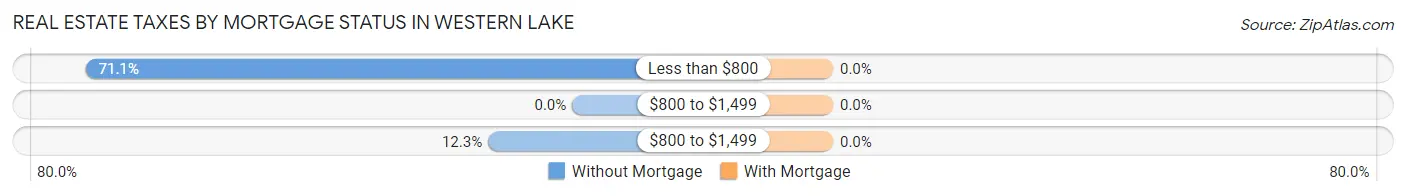
| Property Taxes | Without Mortgage | With Mortgage |
| Less than $800 | 295 (71.1%) | 0 (0.0%) |
| $800 to $1,499 | 0 (0.0%) | 0 (0.0%) |
| $800 to $1,499 | 51 (12.3%) | 0 (0.0%) |
| Total | 415 (100.0%) | 7 (100.0%) |
Health & Disability in Western Lake
Health Insurance Coverage by Age in Western Lake
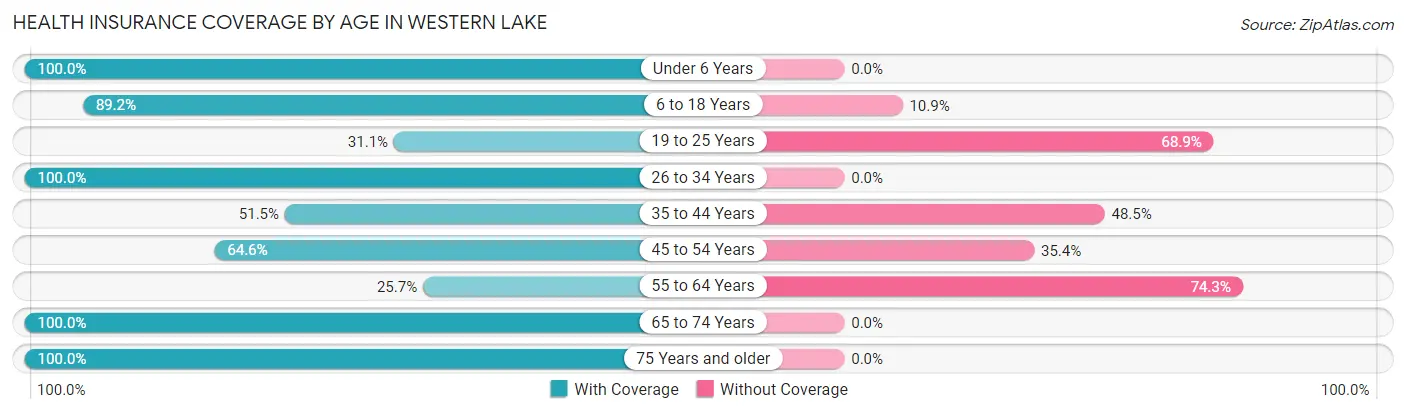
| Age Bracket | With Coverage | Without Coverage |
| Under 6 Years | 49 (100.0%) | 0 (0.0%) |
| 6 to 18 Years | 189 (89.1%) | 23 (10.8%) |
| 19 to 25 Years | 47 (31.1%) | 104 (68.9%) |
| 26 to 34 Years | 127 (100.0%) | 0 (0.0%) |
| 35 to 44 Years | 70 (51.5%) | 66 (48.5%) |
| 45 to 54 Years | 115 (64.6%) | 63 (35.4%) |
| 55 to 64 Years | 82 (25.7%) | 237 (74.3%) |
| 65 to 74 Years | 22 (100.0%) | 0 (0.0%) |
| 75 Years and older | 13 (100.0%) | 0 (0.0%) |
| Total | 714 (59.2%) | 493 (40.8%) |
Health Insurance Coverage by Citizenship Status in Western Lake
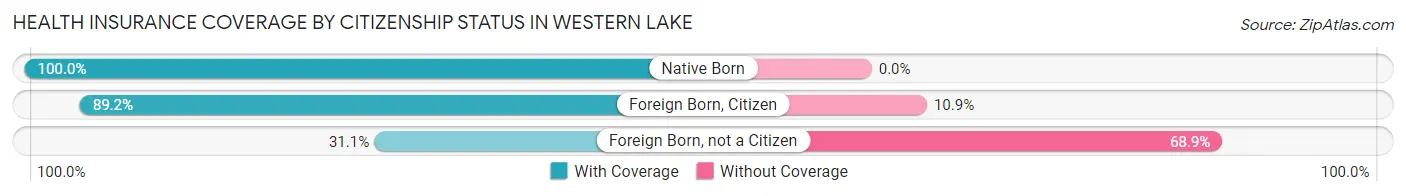
| Citizenship Status | With Coverage | Without Coverage |
| Native Born | 49 (100.0%) | 0 (0.0%) |
| Foreign Born, Citizen | 189 (89.1%) | 23 (10.8%) |
| Foreign Born, not a Citizen | 47 (31.1%) | 104 (68.9%) |
Health Insurance Coverage by Household Income in Western Lake
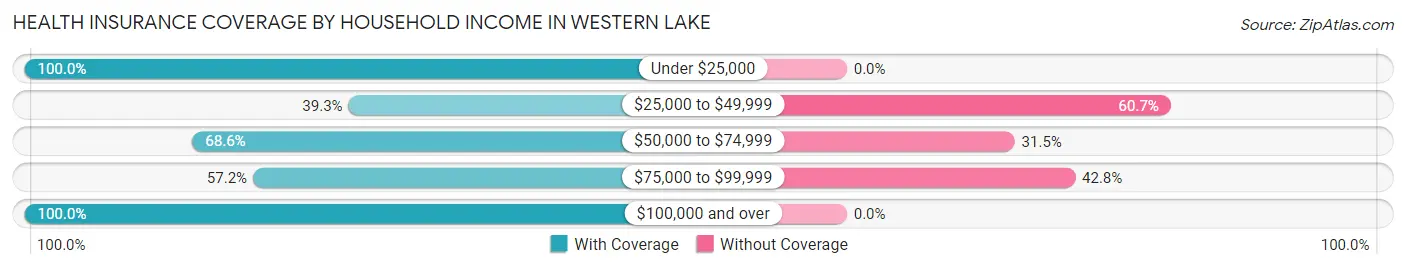
| Household Income | With Coverage | Without Coverage |
| Under $25,000 | 20 (100.0%) | 0 (0.0%) |
| $25,000 to $49,999 | 118 (39.3%) | 182 (60.7%) |
| $50,000 to $74,999 | 194 (68.5%) | 89 (31.5%) |
| $75,000 to $99,999 | 297 (57.2%) | 222 (42.8%) |
| $100,000 and over | 85 (100.0%) | 0 (0.0%) |
Public vs Private Health Insurance Coverage by Age in Western Lake
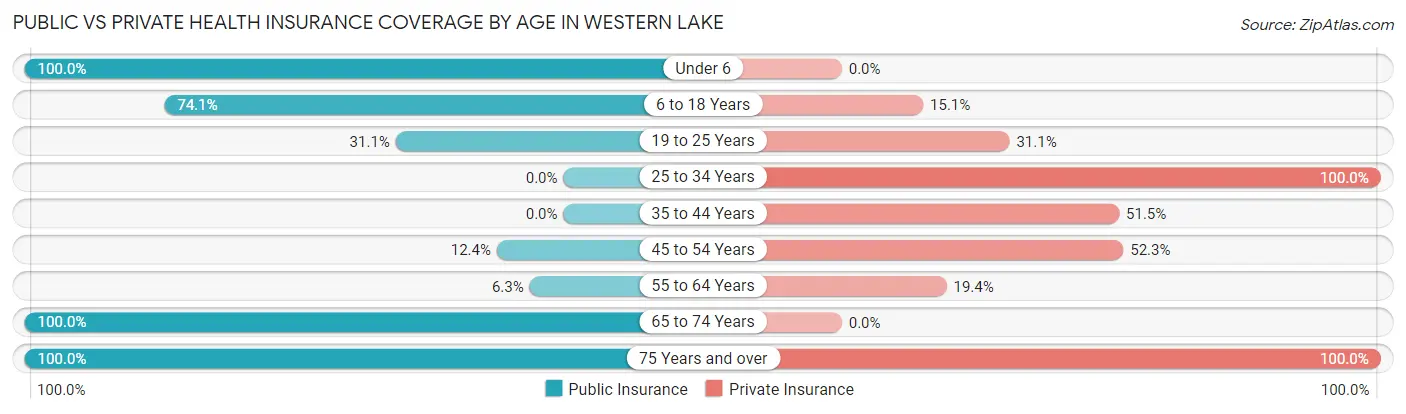
| Age Bracket | Public Insurance | Private Insurance |
| Under 6 | 49 (100.0%) | 0 (0.0%) |
| 6 to 18 Years | 157 (74.1%) | 32 (15.1%) |
| 19 to 25 Years | 47 (31.1%) | 47 (31.1%) |
| 25 to 34 Years | 0 (0.0%) | 127 (100.0%) |
| 35 to 44 Years | 0 (0.0%) | 70 (51.5%) |
| 45 to 54 Years | 22 (12.4%) | 93 (52.2%) |
| 55 to 64 Years | 20 (6.3%) | 62 (19.4%) |
| 65 to 74 Years | 22 (100.0%) | 0 (0.0%) |
| 75 Years and over | 13 (100.0%) | 13 (100.0%) |
| Total | 330 (27.3%) | 444 (36.8%) |
Disability Status by Sex by Age in Western Lake
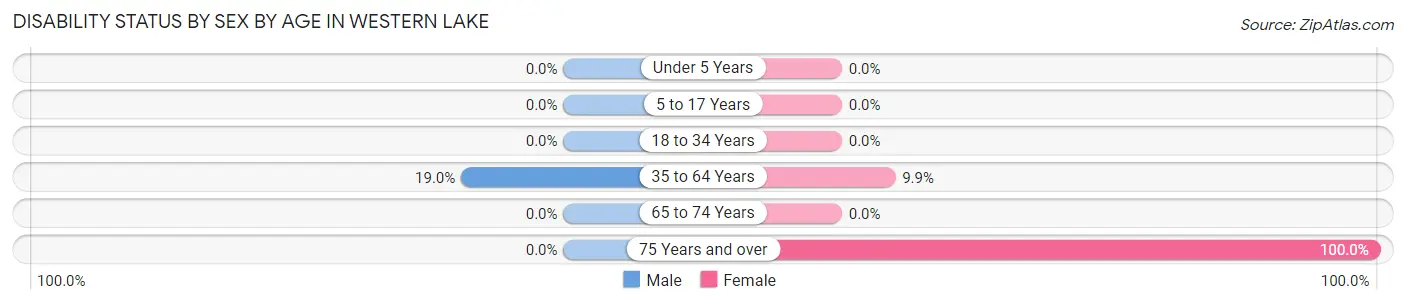
| Age Bracket | Male | Female |
| Under 5 Years | 0 (0.0%) | 0 (0.0%) |
| 5 to 17 Years | 0 (0.0%) | 0 (0.0%) |
| 18 to 34 Years | 0 (0.0%) | 0 (0.0%) |
| 35 to 64 Years | 78 (19.0%) | 22 (9.9%) |
| 65 to 74 Years | 0 (0.0%) | 0 (0.0%) |
| 75 Years and over | 0 (0.0%) | 13 (100.0%) |
Disability Class by Sex by Age in Western Lake
Disability Class: Hearing Difficulty
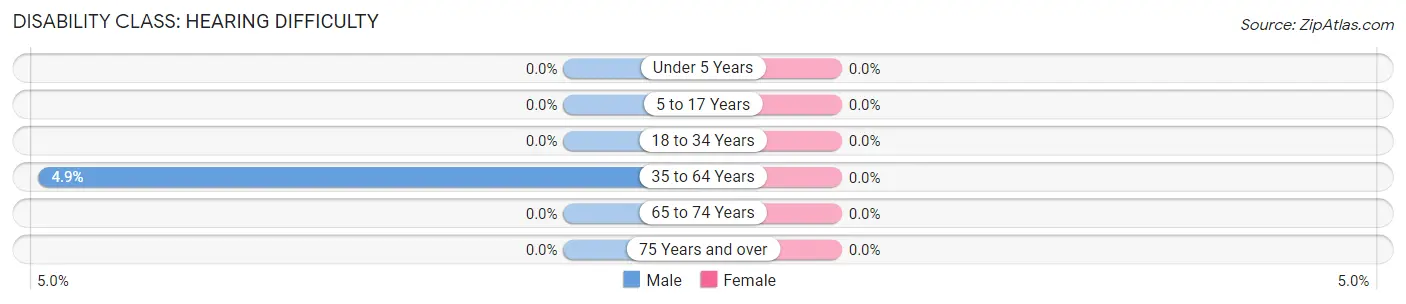
| Age Bracket | Male | Female |
| Under 5 Years | 0 (0.0%) | 0 (0.0%) |
| 5 to 17 Years | 0 (0.0%) | 0 (0.0%) |
| 18 to 34 Years | 0 (0.0%) | 0 (0.0%) |
| 35 to 64 Years | 20 (4.9%) | 0 (0.0%) |
| 65 to 74 Years | 0 (0.0%) | 0 (0.0%) |
| 75 Years and over | 0 (0.0%) | 0 (0.0%) |
Disability Class: Vision Difficulty

| Age Bracket | Male | Female |
| Under 5 Years | 0 (0.0%) | 0 (0.0%) |
| 5 to 17 Years | 0 (0.0%) | 0 (0.0%) |
| 18 to 34 Years | 0 (0.0%) | 0 (0.0%) |
| 35 to 64 Years | 40 (9.7%) | 0 (0.0%) |
| 65 to 74 Years | 0 (0.0%) | 0 (0.0%) |
| 75 Years and over | 0 (0.0%) | 0 (0.0%) |
Disability Class: Cognitive Difficulty
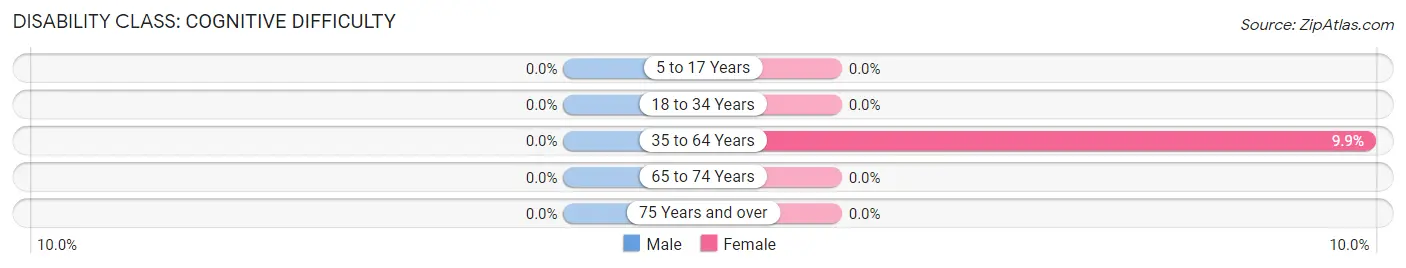
| Age Bracket | Male | Female |
| 5 to 17 Years | 0 (0.0%) | 0 (0.0%) |
| 18 to 34 Years | 0 (0.0%) | 0 (0.0%) |
| 35 to 64 Years | 0 (0.0%) | 22 (9.9%) |
| 65 to 74 Years | 0 (0.0%) | 0 (0.0%) |
| 75 Years and over | 0 (0.0%) | 0 (0.0%) |
Disability Class: Ambulatory Difficulty
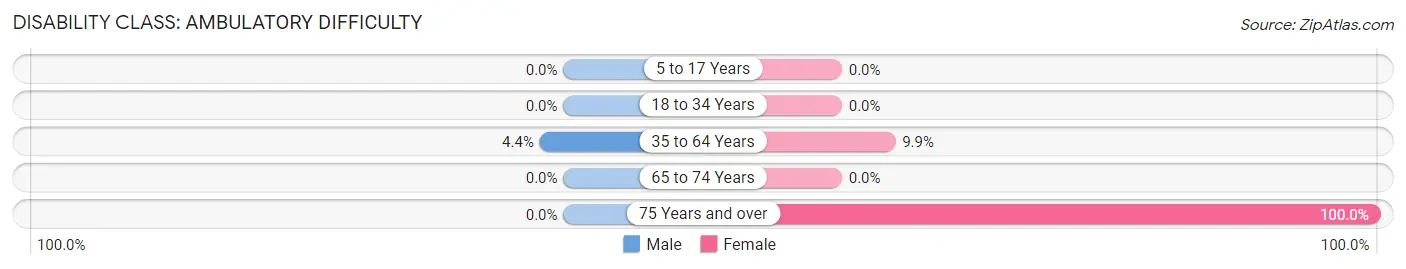
| Age Bracket | Male | Female |
| 5 to 17 Years | 0 (0.0%) | 0 (0.0%) |
| 18 to 34 Years | 0 (0.0%) | 0 (0.0%) |
| 35 to 64 Years | 18 (4.4%) | 22 (9.9%) |
| 65 to 74 Years | 0 (0.0%) | 0 (0.0%) |
| 75 Years and over | 0 (0.0%) | 13 (100.0%) |
Disability Class: Self-Care Difficulty
| Age Bracket | Male | Female |
| 5 to 17 Years | 0 (0.0%) | 0 (0.0%) |
| 18 to 34 Years | 0 (0.0%) | 0 (0.0%) |
| 35 to 64 Years | 0 (0.0%) | 0 (0.0%) |
| 65 to 74 Years | 0 (0.0%) | 0 (0.0%) |
| 75 Years and over | 0 (0.0%) | 0 (0.0%) |
Technology Access in Western Lake
Computing Device Access in Western Lake
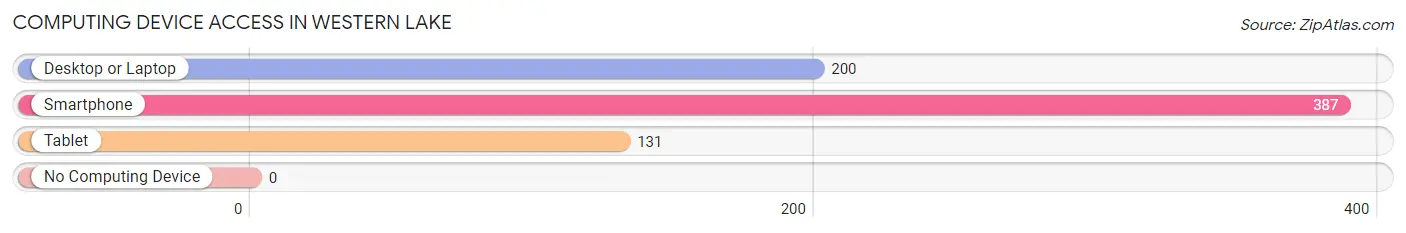
| Device Type | # Households | % Households |
| Desktop or Laptop | 200 | 47.4% |
| Smartphone | 387 | 91.7% |
| Tablet | 131 | 31.0% |
| No Computing Device | 0 | 0.0% |
| Total | 422 | 100.0% |
Internet Access in Western Lake
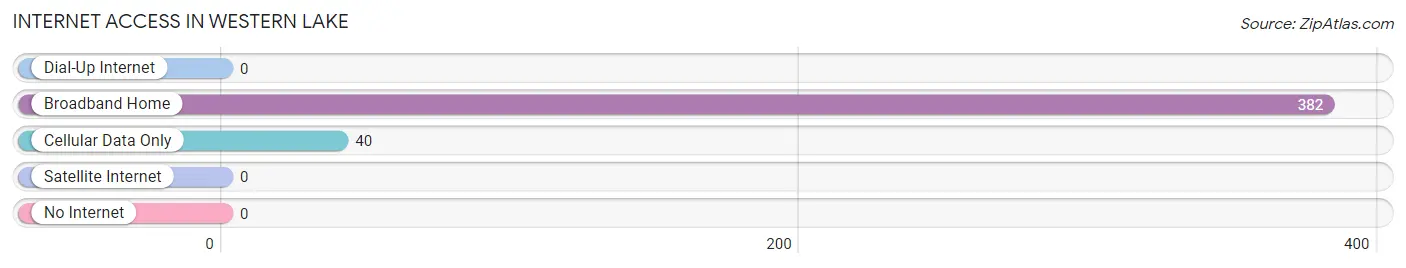
| Internet Type | # Households | % Households |
| Dial-Up Internet | 0 | 0.0% |
| Broadband Home | 382 | 90.5% |
| Cellular Data Only | 40 | 9.5% |
| Satellite Internet | 0 | 0.0% |
| No Internet | 0 | 0.0% |
| Total | 422 | 100.0% |
Western Lake Summary
Lake Western is a small town located in the state of Texas, United States. It is situated in the western part of the state, near the border with New Mexico. The town has a population of approximately 1,000 people and is part of the larger metropolitan area of El Paso.
History
The area that is now Lake Western was first settled in the late 19th century by ranchers and farmers. The town was officially founded in 1891 and was named after the nearby lake. The lake was named after the Western Union Telegraph Company, which had a station in the area.
The town grew slowly over the years, but it was not until the 1950s that it began to experience significant growth. This was due to the construction of a dam on the lake, which created a large reservoir. This reservoir provided the town with a reliable source of water and allowed for the development of a number of recreational activities, such as fishing and boating.
In the late 1960s, the town experienced a period of rapid growth due to the construction of a number of new homes and businesses. This growth continued until the early 1980s, when the town began to experience a decline in population. This decline was due to the closure of several businesses and the relocation of many of the town’s residents to other parts of the state.
Geography
Lake Western is located in the western part of Texas, near the border with New Mexico. The town is situated in a valley, surrounded by hills and mountains. The nearby lake is the source of the town’s water supply and is also a popular recreational area.
The climate in Lake Western is generally mild, with temperatures ranging from the low 40s in the winter to the high 80s in the summer. The town receives an average of 18 inches of rain per year.
Economy
The economy of Lake Western is largely based on tourism and recreation. The town is home to a number of small businesses, including restaurants, shops, and hotels. The nearby lake is a popular destination for fishing, boating, and other outdoor activities.
The town also has a number of manufacturing and industrial businesses, including a paper mill and a plastics factory. These businesses provide employment for many of the town’s residents.
Demographics
As of the 2010 census, the population of Lake Western was 1,000. The town is predominantly white, with a small Hispanic population. The median household income is $35,000, and the median home value is $100,000.
The town has a high rate of poverty, with nearly one-third of the population living below the poverty line. The town also has a high rate of unemployment, with nearly one-quarter of the population unemployed.
Conclusion
Lake Western is a small town located in the western part of Texas. The town has a population of approximately 1,000 people and is part of the larger metropolitan area of El Paso. The town’s economy is largely based on tourism and recreation, and it has a number of small businesses, including restaurants, shops, and hotels. The town has a predominantly white population, with a small Hispanic population. The median household income is $35,000, and the median home value is $100,000. The town has a high rate of poverty and unemployment.
Common Questions
What is Per Capita Income in Western Lake?
Per Capita income in Western Lake is $21,607.
What is the Median Family Income in Western Lake?
Median Family Income in Western Lake is $69,722.
What is the Median Household income in Western Lake?
Median Household Income in Western Lake is $32,225.
What is Inequality or Gini Index in Western Lake?
Inequality or Gini Index in Western Lake is 0.33.
What is the Total Population of Western Lake?
Total Population of Western Lake is 1,207.
What is the Total Male Population of Western Lake?
Total Male Population of Western Lake is 736.
What is the Total Female Population of Western Lake?
Total Female Population of Western Lake is 471.
What is the Ratio of Males per 100 Females in Western Lake?
There are 156.26 Males per 100 Females in Western Lake.
What is the Ratio of Females per 100 Males in Western Lake?
There are 63.99 Females per 100 Males in Western Lake.
What is the Median Population Age in Western Lake?
Median Population Age in Western Lake is 43.5 Years.
What is the Average Family Size in Western Lake
Average Family Size in Western Lake is 5.9 People.
What is the Average Household Size in Western Lake
Average Household Size in Western Lake is 2.9 People.
How Large is the Labor Force in Western Lake?
There are 668 People in the Labor Forcein in Western Lake.
What is the Percentage of People in the Labor Force in Western Lake?
63.1% of People are in the Labor Force in Western Lake.
What is the Unemployment Rate in Western Lake?
Unemployment Rate in Western Lake is 27.2%.