Wilmer, TX Map & Demographics
Wilmer Map
Wilmer Overview
$22,714
PER CAPITA INCOME
$65,037
AVG FAMILY INCOME
$63,003
AVG HOUSEHOLD INCOME
35.0%
WAGE / INCOME GAP [ % ]
65.0¢/ $1
WAGE / INCOME GAP [ $ ]
0.37
INEQUALITY / GINI INDEX
5,370
TOTAL POPULATION
2,588
MALE POPULATION
2,782
FEMALE POPULATION
93.03
MALES / 100 FEMALES
107.50
FEMALES / 100 MALES
34.8
MEDIAN AGE
3.1
AVG FAMILY SIZE
2.8
AVG HOUSEHOLD SIZE
2,653
LABOR FORCE [ PEOPLE ]
63.8%
PERCENT IN LABOR FORCE
6.3%
UNEMPLOYMENT RATE
Wilmer Zip Codes
Wilmer Area Codes
Income in Wilmer
Income Overview in Wilmer
Per Capita Income in Wilmer is $22,714, while median incomes of families and households are $65,037 and $63,003 respectively.
| Characteristic | Number | Measure |
| Per Capita Income | 5,370 | $22,714 |
| Median Family Income | 1,421 | $65,037 |
| Mean Family Income | 1,421 | $70,405 |
| Median Household Income | 1,766 | $63,003 |
| Mean Household Income | 1,766 | $65,199 |
| Income Deficit | 1,421 | $0 |
| Wage / Income Gap (%) | 5,370 | 34.96% |
| Wage / Income Gap ($) | 5,370 | 65.04¢ per $1 |
| Gini / Inequality Index | 5,370 | 0.37 |
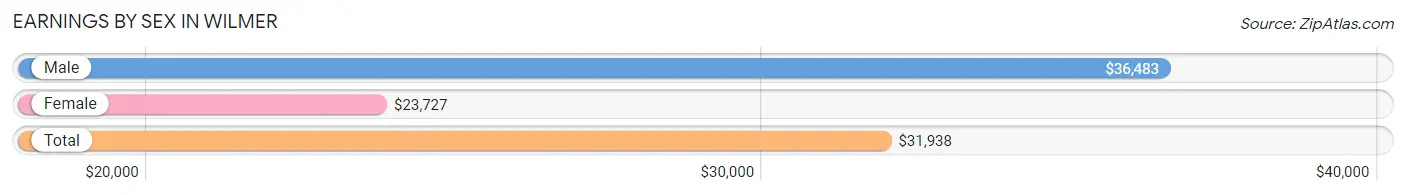
Earnings by Sex in Wilmer
Average Earnings in Wilmer are $31,938, $36,483 for men and $23,727 for women, a difference of 35.0%.
| Sex | Number | Average Earnings |
| Male | 1,332 (44.4%) | $36,483 |
| Female | 1,665 (55.6%) | $23,727 |
| Total | 2,997 (100.0%) | $31,938 |
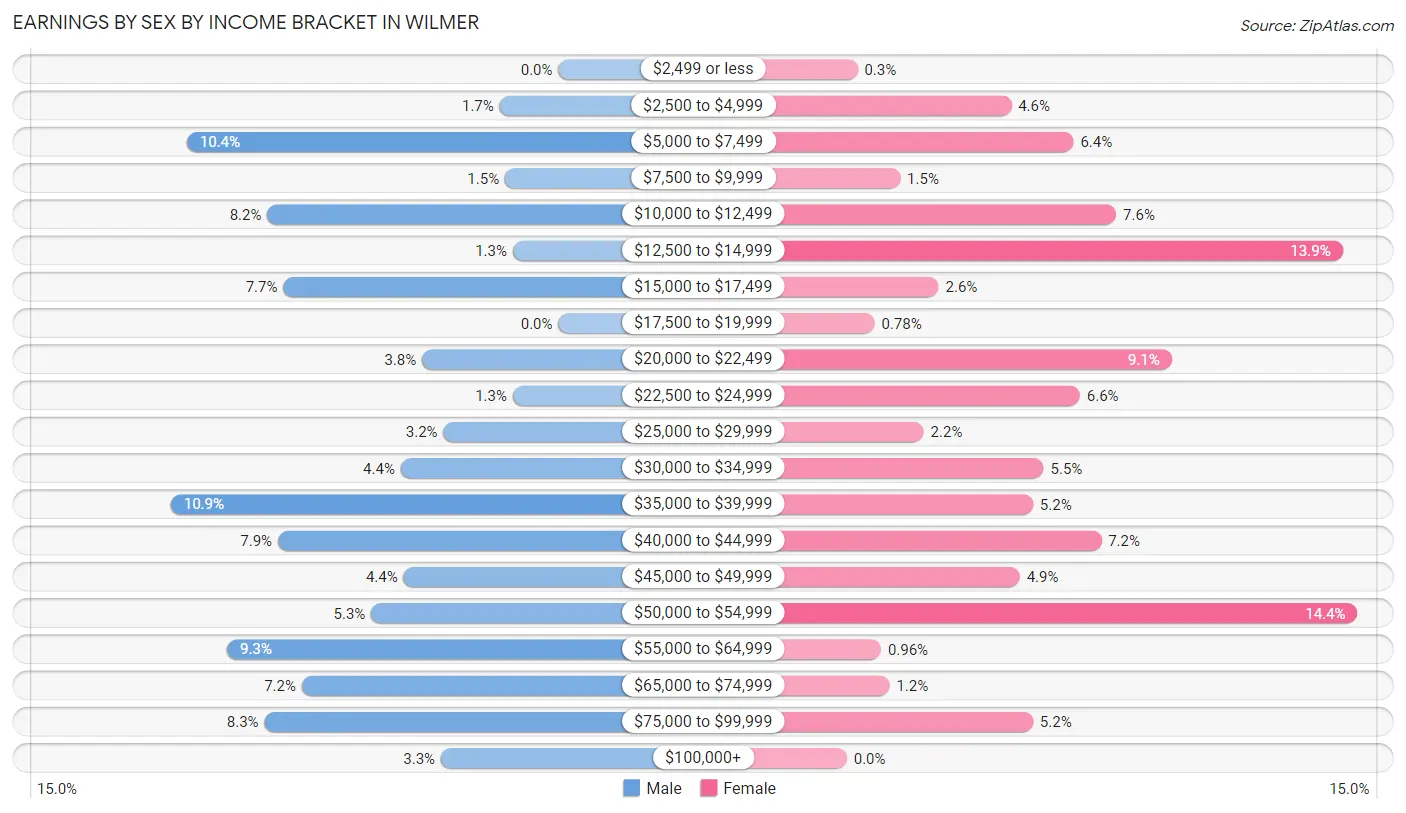
Earnings by Sex by Income Bracket in Wilmer
The most common earnings brackets in Wilmer are $35,000 to $39,999 for men (145 | 10.9%) and $50,000 to $54,999 for women (239 | 14.3%).
| Income | Male | Female |
| $2,499 or less | 0 (0.0%) | 5 (0.3%) |
| $2,500 to $4,999 | 22 (1.7%) | 77 (4.6%) |
| $5,000 to $7,499 | 139 (10.4%) | 106 (6.4%) |
| $7,500 to $9,999 | 20 (1.5%) | 25 (1.5%) |
| $10,000 to $12,499 | 109 (8.2%) | 126 (7.6%) |
| $12,500 to $14,999 | 17 (1.3%) | 232 (13.9%) |
| $15,000 to $17,499 | 103 (7.7%) | 43 (2.6%) |
| $17,500 to $19,999 | 0 (0.0%) | 13 (0.8%) |
| $20,000 to $22,499 | 51 (3.8%) | 152 (9.1%) |
| $22,500 to $24,999 | 17 (1.3%) | 109 (6.6%) |
| $25,000 to $29,999 | 43 (3.2%) | 36 (2.2%) |
| $30,000 to $34,999 | 59 (4.4%) | 92 (5.5%) |
| $35,000 to $39,999 | 145 (10.9%) | 87 (5.2%) |
| $40,000 to $44,999 | 105 (7.9%) | 119 (7.1%) |
| $45,000 to $49,999 | 58 (4.3%) | 81 (4.9%) |
| $50,000 to $54,999 | 70 (5.3%) | 239 (14.3%) |
| $55,000 to $64,999 | 124 (9.3%) | 16 (1.0%) |
| $65,000 to $74,999 | 96 (7.2%) | 20 (1.2%) |
| $75,000 to $99,999 | 110 (8.3%) | 87 (5.2%) |
| $100,000+ | 44 (3.3%) | 0 (0.0%) |
| Total | 1,332 (100.0%) | 1,665 (100.0%) |
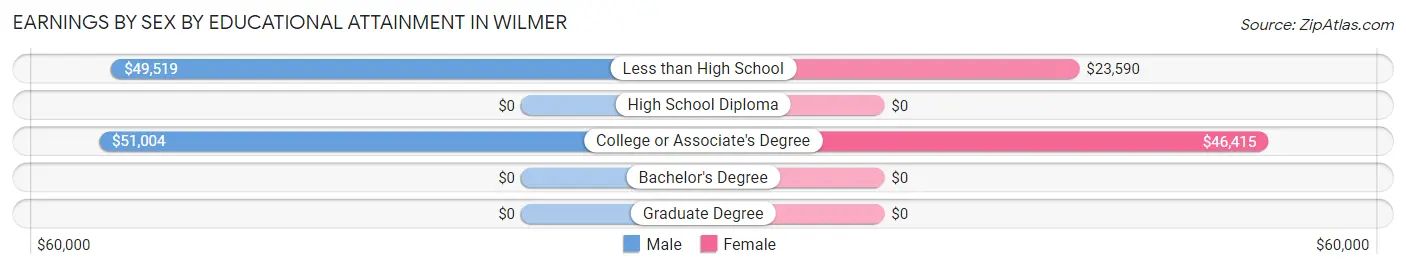
Earnings by Sex by Educational Attainment in Wilmer
Average earnings in Wilmer are $37,216 for men and $33,125 for women, a difference of 11.0%. Men with an educational attainment of college or associate's degree enjoy the highest average annual earnings of $51,004, while those with less than high school education earn the least with $49,519. Women with an educational attainment of college or associate's degree earn the most with the average annual earnings of $46,415, while those with less than high school education have the smallest earnings of $23,590.
| Educational Attainment | Male Income | Female Income |
| Less than High School | $49,519 | $23,590 |
| High School Diploma | - | - |
| College or Associate's Degree | $51,004 | $46,415 |
| Bachelor's Degree | - | - |
| Graduate Degree | - | - |
| Total | $37,216 | $33,125 |
Family Income in Wilmer
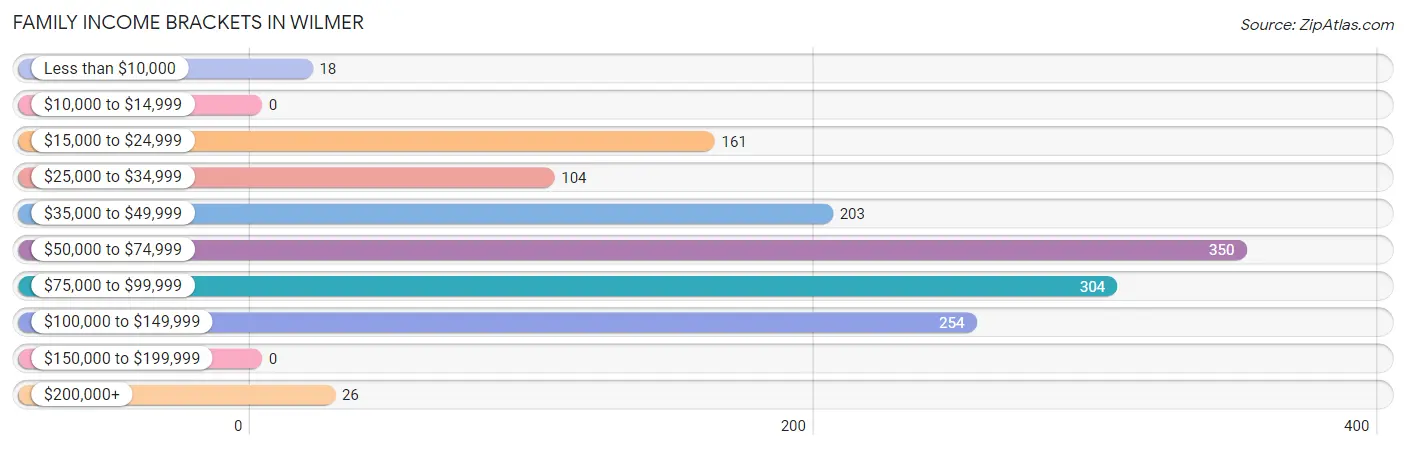
Family Income Brackets in Wilmer
According to the Wilmer family income data, there are 350 families falling into the $50,000 to $74,999 income range, which is the most common income bracket and makes up 24.6% of all families.
| Income Bracket | # Families | % Families |
| Less than $10,000 | 18 | 1.3% |
| $10,000 to $14,999 | 0 | 0.0% |
| $15,000 to $24,999 | 161 | 11.3% |
| $25,000 to $34,999 | 104 | 7.3% |
| $35,000 to $49,999 | 203 | 14.3% |
| $50,000 to $74,999 | 350 | 24.6% |
| $75,000 to $99,999 | 304 | 21.4% |
| $100,000 to $149,999 | 254 | 17.9% |
| $150,000 to $199,999 | 0 | 0.0% |
| $200,000+ | 26 | 1.8% |
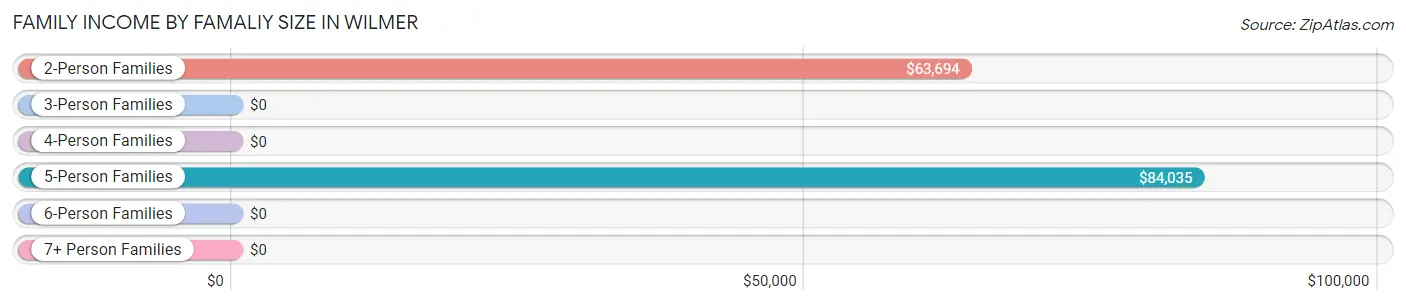
Family Income by Famaliy Size in Wilmer
5-person families (151 | 10.6%) account for the highest median family income in Wilmer with $84,035 per family, while 2-person families (777 | 54.7%) have the highest median income of $31,847 per family member.
| Income Bracket | # Families | Median Income |
| 2-Person Families | 777 (54.7%) | $63,694 |
| 3-Person Families | 244 (17.2%) | $0 |
| 4-Person Families | 175 (12.3%) | $0 |
| 5-Person Families | 151 (10.6%) | $84,035 |
| 6-Person Families | 61 (4.3%) | $0 |
| 7+ Person Families | 13 (0.9%) | $0 |
| Total | 1,421 (100.0%) | $65,037 |
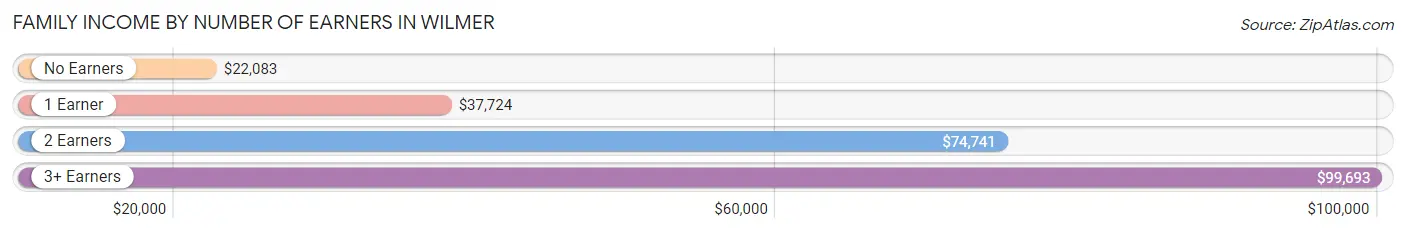
Family Income by Number of Earners in Wilmer
The median family income in Wilmer is $65,037, with families comprising 3+ earners (147) having the highest median family income of $99,693, while families with no earners (179) have the lowest median family income of $22,083, accounting for 10.3% and 12.6% of families, respectively.
| Number of Earners | # Families | Median Income |
| No Earners | 179 (12.6%) | $22,083 |
| 1 Earner | 361 (25.4%) | $37,724 |
| 2 Earners | 734 (51.6%) | $74,741 |
| 3+ Earners | 147 (10.3%) | $99,693 |
| Total | 1,421 (100.0%) | $65,037 |
Household Income in Wilmer
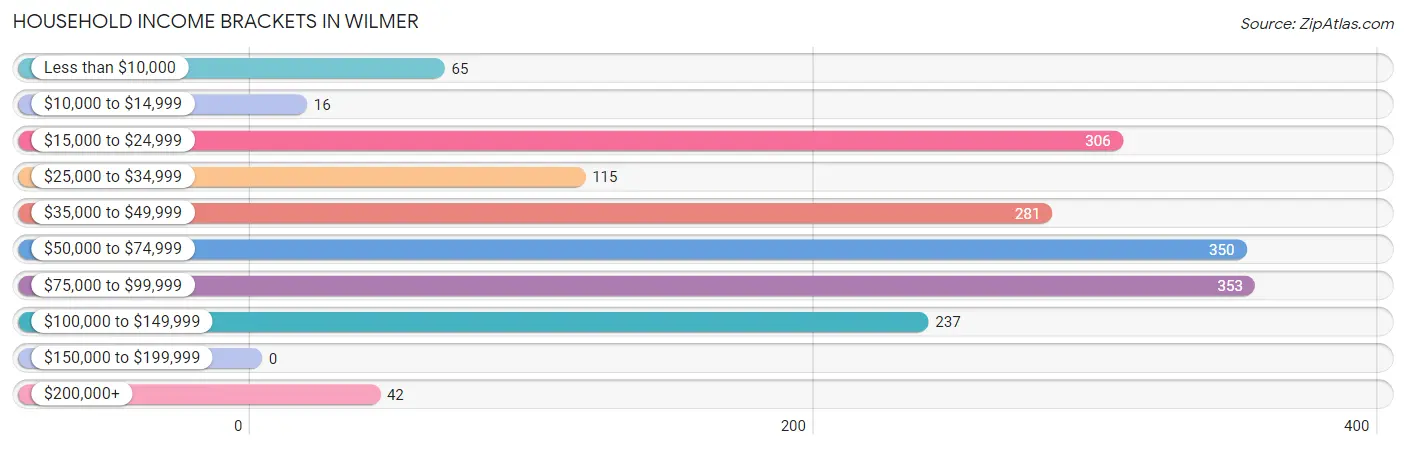
Household Income Brackets in Wilmer
With 353 households falling in the category, the $75,000 to $99,999 income range is the most frequent in Wilmer, accounting for 20.0% of all households.
| Income Bracket | # Households | % Households |
| Less than $10,000 | 65 | 3.7% |
| $10,000 to $14,999 | 16 | 0.9% |
| $15,000 to $24,999 | 306 | 17.3% |
| $25,000 to $34,999 | 115 | 6.5% |
| $35,000 to $49,999 | 281 | 15.9% |
| $50,000 to $74,999 | 350 | 19.8% |
| $75,000 to $99,999 | 353 | 20.0% |
| $100,000 to $149,999 | 237 | 13.4% |
| $150,000 to $199,999 | 0 | 0.0% |
| $200,000+ | 42 | 2.4% |
Household Income by Householder Age in Wilmer
The median household income in Wilmer is $63,003, with the highest median household income of $86,192 found in the 45 to 64 years age bracket for the primary householder. A total of 611 households (34.6%) fall into this category.
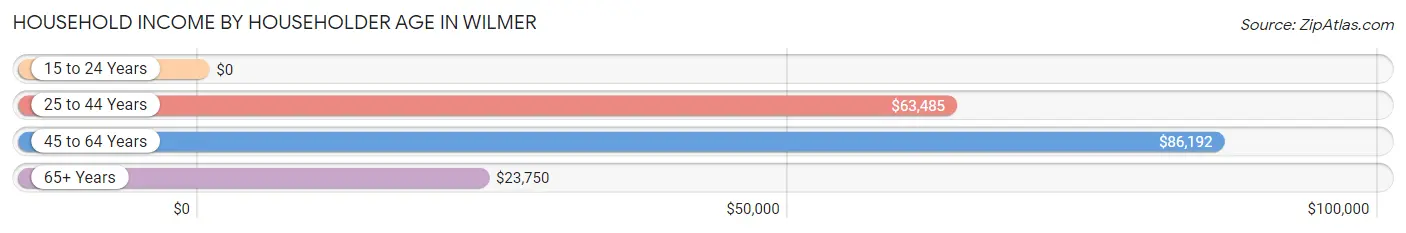
| Income Bracket | # Households | Median Income |
| 15 to 24 Years | 0 (0.0%) | $0 |
| 25 to 44 Years | 767 (43.4%) | $63,485 |
| 45 to 64 Years | 611 (34.6%) | $86,192 |
| 65+ Years | 388 (22.0%) | $23,750 |
| Total | 1,766 (100.0%) | $63,003 |
Poverty in Wilmer
Income Below Poverty by Sex and Age in Wilmer
With 24.5% poverty level for males and 12.0% for females among the residents of Wilmer, 12 to 14 year old males and 6 to 11 year old females are the most vulnerable to poverty, with 75 males (65.2%) and 50 females (52.6%) in their respective age groups living below the poverty level.
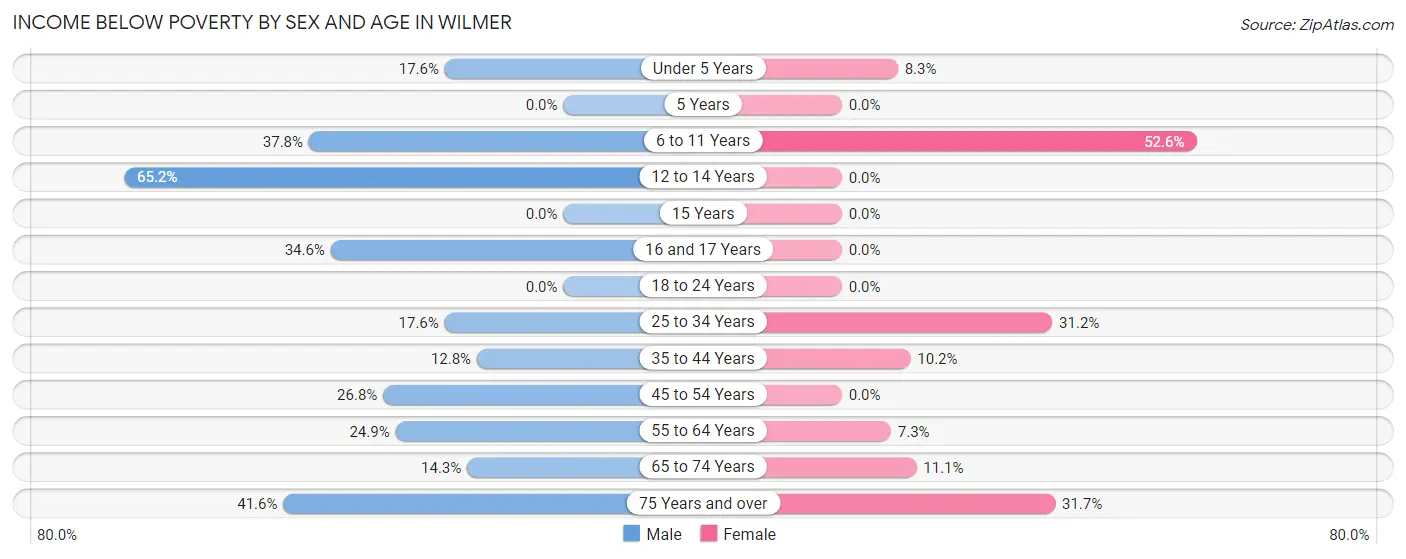
| Age Bracket | Male | Female |
| Under 5 Years | 62 (17.6%) | 19 (8.3%) |
| 5 Years | 0 (0.0%) | 0 (0.0%) |
| 6 to 11 Years | 113 (37.8%) | 50 (52.6%) |
| 12 to 14 Years | 75 (65.2%) | 0 (0.0%) |
| 15 Years | 0 (0.0%) | 0 (0.0%) |
| 16 and 17 Years | 38 (34.5%) | 0 (0.0%) |
| 18 to 24 Years | 0 (0.0%) | 0 (0.0%) |
| 25 to 34 Years | 55 (17.6%) | 144 (31.2%) |
| 35 to 44 Years | 34 (12.8%) | 39 (10.2%) |
| 45 to 54 Years | 38 (26.8%) | 0 (0.0%) |
| 55 to 64 Years | 92 (24.9%) | 22 (7.3%) |
| 65 to 74 Years | 34 (14.3%) | 29 (11.1%) |
| 75 Years and over | 47 (41.6%) | 19 (31.7%) |
| Total | 588 (24.5%) | 322 (12.0%) |
Income Above Poverty by Sex and Age in Wilmer
According to the poverty statistics in Wilmer, males aged 18 to 24 years and females aged 12 to 14 years are the age groups that are most secure financially, with 100.0% of males and 100.0% of females in these age groups living above the poverty line.
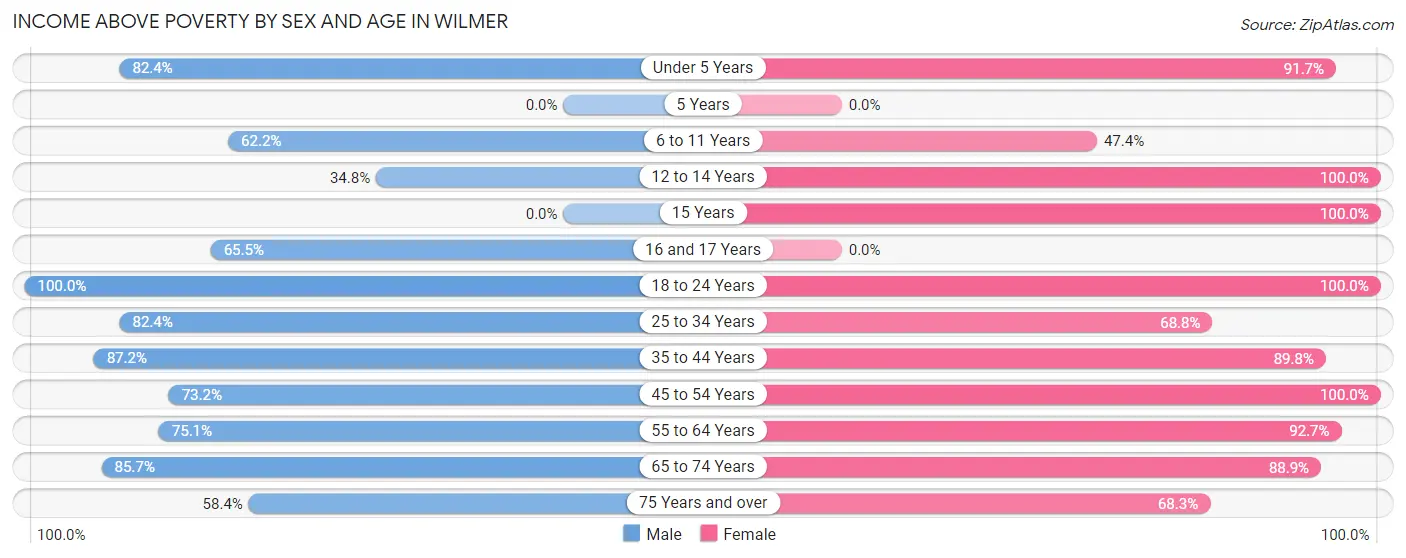
| Age Bracket | Male | Female |
| Under 5 Years | 290 (82.4%) | 210 (91.7%) |
| 5 Years | 0 (0.0%) | 0 (0.0%) |
| 6 to 11 Years | 186 (62.2%) | 45 (47.4%) |
| 12 to 14 Years | 40 (34.8%) | 103 (100.0%) |
| 15 Years | 0 (0.0%) | 19 (100.0%) |
| 16 and 17 Years | 72 (65.4%) | 0 (0.0%) |
| 18 to 24 Years | 85 (100.0%) | 411 (100.0%) |
| 25 to 34 Years | 257 (82.4%) | 317 (68.8%) |
| 35 to 44 Years | 231 (87.2%) | 344 (89.8%) |
| 45 to 54 Years | 104 (73.2%) | 354 (100.0%) |
| 55 to 64 Years | 277 (75.1%) | 280 (92.7%) |
| 65 to 74 Years | 204 (85.7%) | 233 (88.9%) |
| 75 Years and over | 66 (58.4%) | 41 (68.3%) |
| Total | 1,812 (75.5%) | 2,357 (88.0%) |
Income Below Poverty Among Married-Couple Families in Wilmer
The poverty statistics for married-couple families in Wilmer show that 11.3% or 83 of the total 733 families live below the poverty line. Families with 1 or 2 children have the highest poverty rate of 21.2%, comprising of 48 families. On the other hand, families with 3 or 4 children have the lowest poverty rate of 0.0%, which includes 0 families.
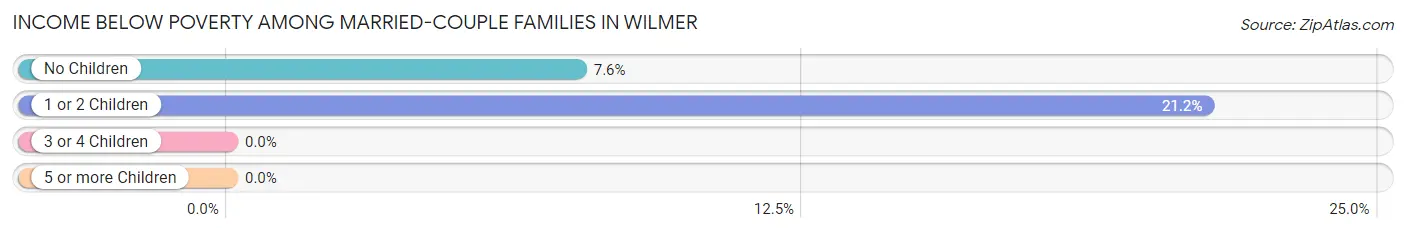
| Children | Above Poverty | Below Poverty |
| No Children | 426 (92.4%) | 35 (7.6%) |
| 1 or 2 Children | 178 (78.8%) | 48 (21.2%) |
| 3 or 4 Children | 46 (100.0%) | 0 (0.0%) |
| 5 or more Children | 0 (0.0%) | 0 (0.0%) |
| Total | 650 (88.7%) | 83 (11.3%) |
Income Below Poverty Among Single-Parent Households in Wilmer
According to the poverty data in Wilmer, 15.8% or 19 single-father households and 14.6% or 83 single-mother households are living below the poverty line. Among single-father households, those with no children have the highest poverty rate, with 19 households (35.8%) experiencing poverty. Likewise, among single-mother households, those with 5 or more children have the highest poverty rate, with 39 households (100.0%) falling below the poverty line.
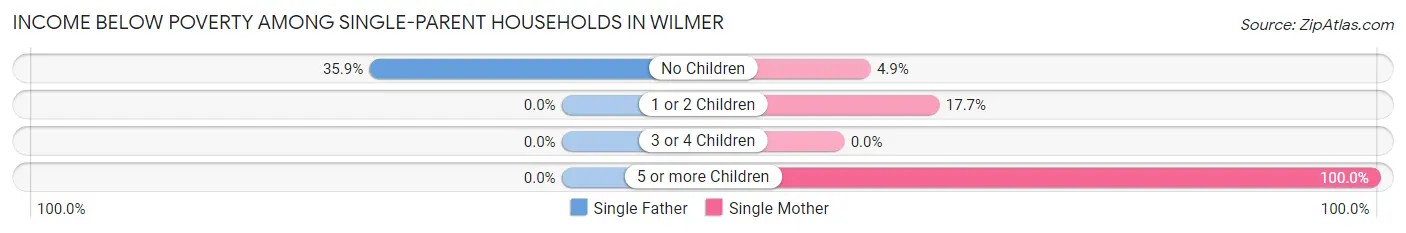
| Children | Single Father | Single Mother |
| No Children | 19 (35.8%) | 19 (4.9%) |
| 1 or 2 Children | 0 (0.0%) | 25 (17.7%) |
| 3 or 4 Children | 0 (0.0%) | 0 (0.0%) |
| 5 or more Children | 0 (0.0%) | 39 (100.0%) |
| Total | 19 (15.8%) | 83 (14.6%) |
Income Below Poverty Among Married-Couple vs Single-Parent Households in Wilmer
The poverty data for Wilmer shows that 83 of the married-couple family households (11.3%) and 102 of the single-parent households (14.8%) are living below the poverty level. Within the married-couple family households, those with 1 or 2 children have the highest poverty rate, with 48 households (21.2%) falling below the poverty line. Among the single-parent households, those with 5 or more children have the highest poverty rate, with 39 household (100.0%) living below poverty.
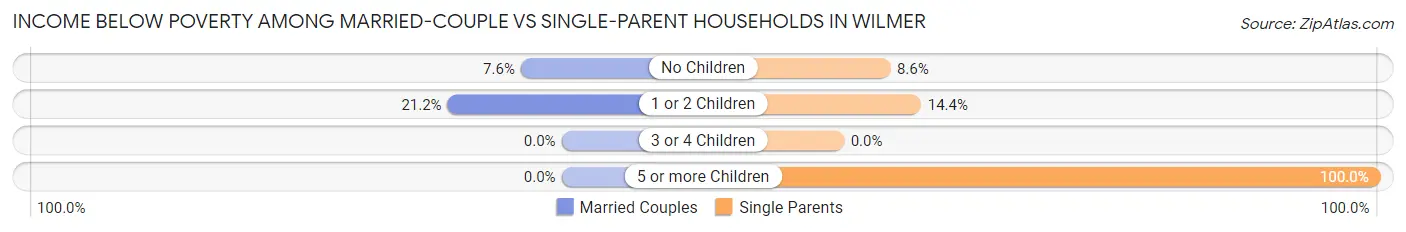
| Children | Married-Couple Families | Single-Parent Households |
| No Children | 35 (7.6%) | 38 (8.6%) |
| 1 or 2 Children | 48 (21.2%) | 25 (14.4%) |
| 3 or 4 Children | 0 (0.0%) | 0 (0.0%) |
| 5 or more Children | 0 (0.0%) | 39 (100.0%) |
| Total | 83 (11.3%) | 102 (14.8%) |
Race in Wilmer
The most populous races in Wilmer are Hispanic or Latino (2,542 | 47.3%), White / Caucasian (2,138 | 39.8%), and Black / African American (1,597 | 29.7%).
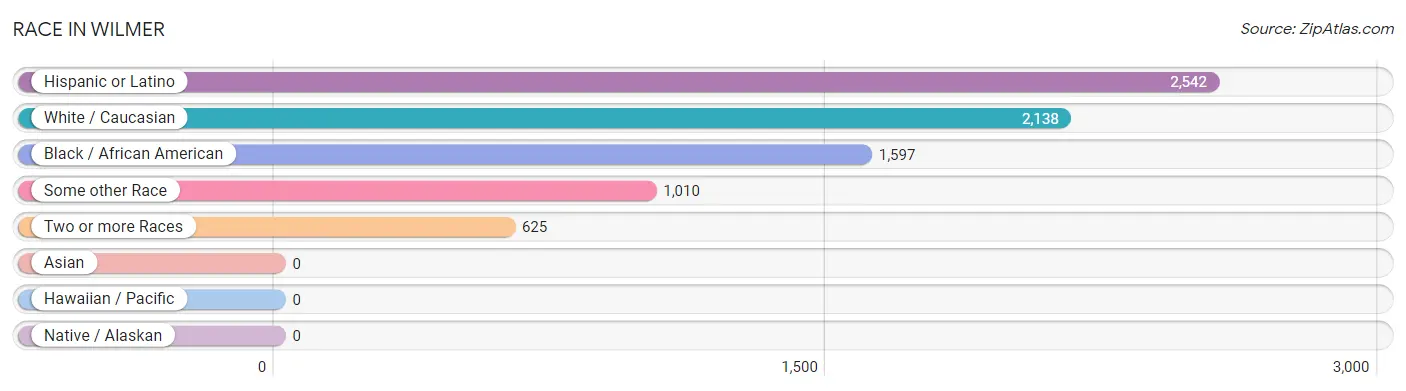
| Race | # Population | % Population |
| Asian | 0 | 0.0% |
| Black / African American | 1,597 | 29.7% |
| Hawaiian / Pacific | 0 | 0.0% |
| Hispanic or Latino | 2,542 | 47.3% |
| Native / Alaskan | 0 | 0.0% |
| White / Caucasian | 2,138 | 39.8% |
| Two or more Races | 625 | 11.6% |
| Some other Race | 1,010 | 18.8% |
| Total | 5,370 | 100.0% |
Ancestry in Wilmer
The most populous ancestries reported in Wilmer are Mexican (2,070 | 38.6%), Central American (435 | 8.1%), German (285 | 5.3%), American (264 | 4.9%), and Irish (237 | 4.4%), together accounting for 61.3% of all Wilmer residents.
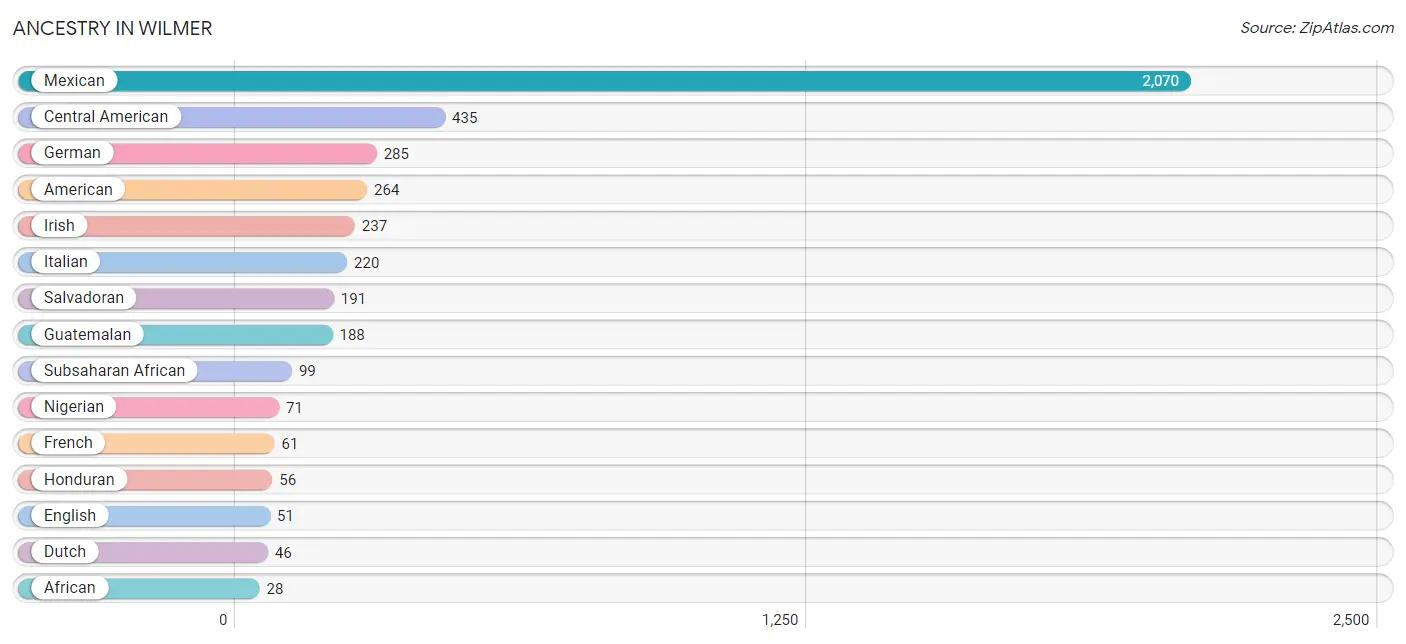
| Ancestry | # Population | % Population |
| African | 28 | 0.5% |
| American | 264 | 4.9% |
| Central American | 435 | 8.1% |
| Cherokee | 14 | 0.3% |
| Czech | 15 | 0.3% |
| Czechoslovakian | 14 | 0.3% |
| Danish | 12 | 0.2% |
| Dutch | 46 | 0.9% |
| Eastern European | 17 | 0.3% |
| English | 51 | 0.9% |
| French | 61 | 1.1% |
| German | 285 | 5.3% |
| Guatemalan | 188 | 3.5% |
| Honduran | 56 | 1.0% |
| Irish | 237 | 4.4% |
| Italian | 220 | 4.1% |
| Japanese | 9 | 0.2% |
| Mexican | 2,070 | 38.6% |
| Navajo | 2 | 0.0% |
| Nigerian | 71 | 1.3% |
| Norwegian | 13 | 0.2% |
| Polish | 13 | 0.2% |
| Puerto Rican | 2 | 0.0% |
| Salvadoran | 191 | 3.6% |
| Subsaharan African | 99 | 1.8% | View All 25 Rows |
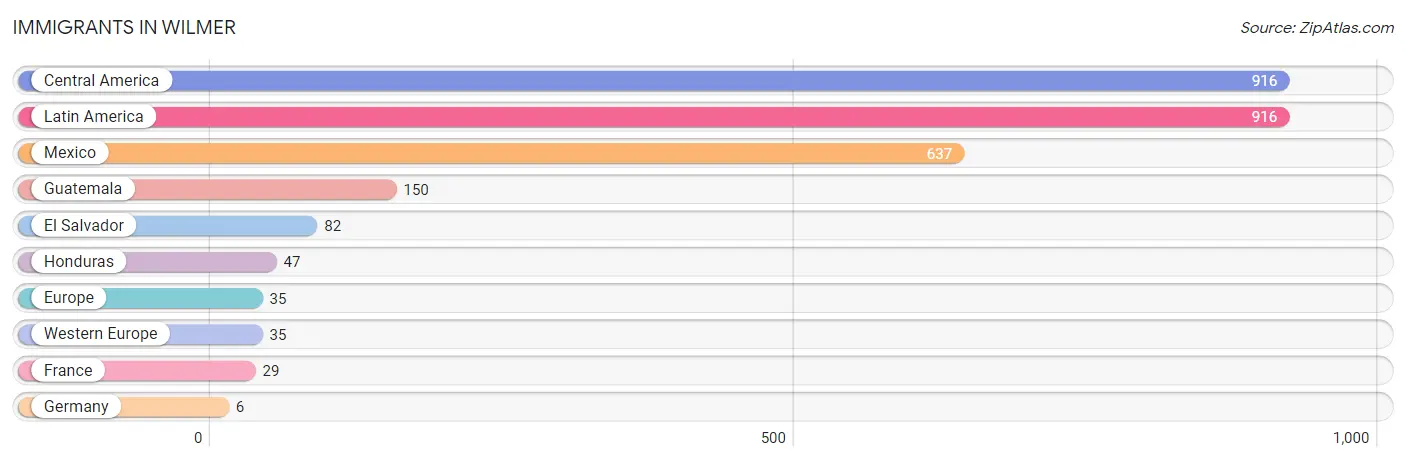
Immigrants in Wilmer
The most numerous immigrant groups reported in Wilmer came from Central America (916 | 17.1%), Latin America (916 | 17.1%), Mexico (637 | 11.9%), Guatemala (150 | 2.8%), and El Salvador (82 | 1.5%), together accounting for 50.3% of all Wilmer residents.
| Immigration Origin | # Population | % Population |
| Central America | 916 | 17.1% |
| El Salvador | 82 | 1.5% |
| Europe | 35 | 0.6% |
| France | 29 | 0.5% |
| Germany | 6 | 0.1% |
| Guatemala | 150 | 2.8% |
| Honduras | 47 | 0.9% |
| Latin America | 916 | 17.1% |
| Mexico | 637 | 11.9% |
| Western Europe | 35 | 0.6% | View All 10 Rows |
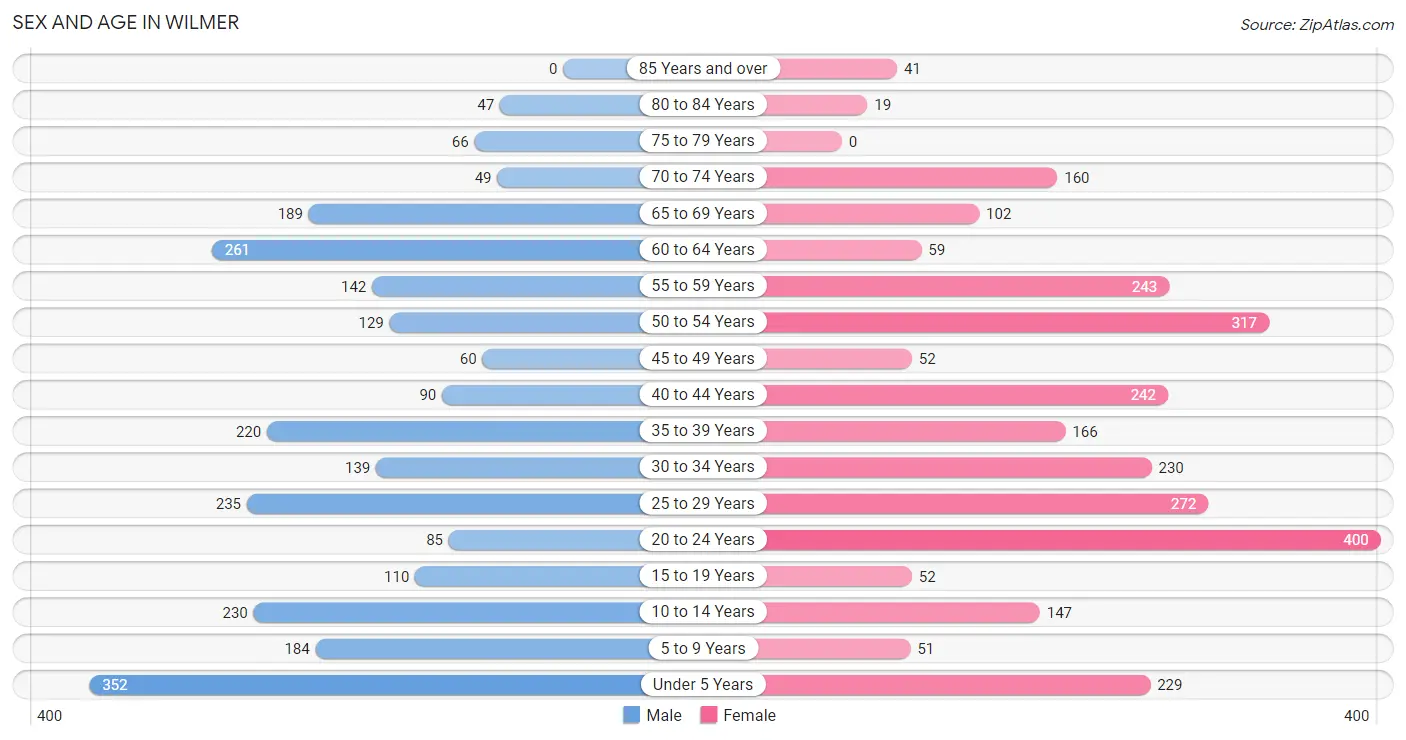
Sex and Age in Wilmer
Sex and Age in Wilmer
The most populous age groups in Wilmer are Under 5 Years (352 | 13.6%) for men and 20 to 24 Years (400 | 14.4%) for women.
| Age Bracket | Male | Female |
| Under 5 Years | 352 (13.6%) | 229 (8.2%) |
| 5 to 9 Years | 184 (7.1%) | 51 (1.8%) |
| 10 to 14 Years | 230 (8.9%) | 147 (5.3%) |
| 15 to 19 Years | 110 (4.3%) | 52 (1.9%) |
| 20 to 24 Years | 85 (3.3%) | 400 (14.4%) |
| 25 to 29 Years | 235 (9.1%) | 272 (9.8%) |
| 30 to 34 Years | 139 (5.4%) | 230 (8.3%) |
| 35 to 39 Years | 220 (8.5%) | 166 (6.0%) |
| 40 to 44 Years | 90 (3.5%) | 242 (8.7%) |
| 45 to 49 Years | 60 (2.3%) | 52 (1.9%) |
| 50 to 54 Years | 129 (5.0%) | 317 (11.4%) |
| 55 to 59 Years | 142 (5.5%) | 243 (8.7%) |
| 60 to 64 Years | 261 (10.1%) | 59 (2.1%) |
| 65 to 69 Years | 189 (7.3%) | 102 (3.7%) |
| 70 to 74 Years | 49 (1.9%) | 160 (5.8%) |
| 75 to 79 Years | 66 (2.5%) | 0 (0.0%) |
| 80 to 84 Years | 47 (1.8%) | 19 (0.7%) |
| 85 Years and over | 0 (0.0%) | 41 (1.5%) |
| Total | 2,588 (100.0%) | 2,782 (100.0%) |
Families and Households in Wilmer
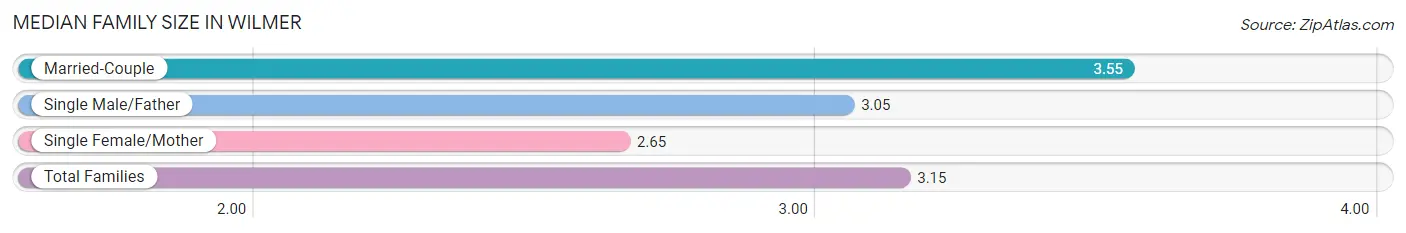
Median Family Size in Wilmer
The median family size in Wilmer is 3.15 persons per family, with married-couple families (733 | 51.6%) accounting for the largest median family size of 3.55 persons per family. On the other hand, single female/mother families (568 | 40.0%) represent the smallest median family size with 2.65 persons per family.
| Family Type | # Families | Family Size |
| Married-Couple | 733 (51.6%) | 3.55 |
| Single Male/Father | 120 (8.4%) | 3.05 |
| Single Female/Mother | 568 (40.0%) | 2.65 |
| Total Families | 1,421 (100.0%) | 3.15 |
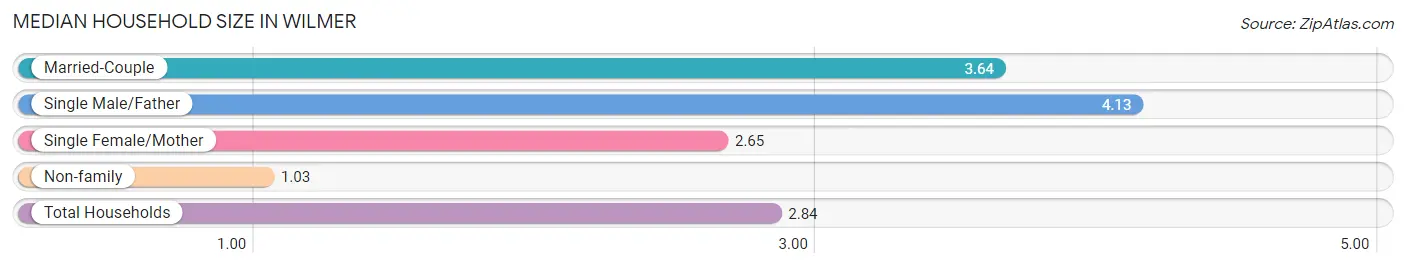
Median Household Size in Wilmer
The median household size in Wilmer is 2.84 persons per household, with single male/father households (120 | 6.8%) accounting for the largest median household size of 4.13 persons per household. non-family households (345 | 19.5%) represent the smallest median household size with 1.03 persons per household.
| Household Type | # Households | Household Size |
| Married-Couple | 733 (41.5%) | 3.64 |
| Single Male/Father | 120 (6.8%) | 4.13 |
| Single Female/Mother | 568 (32.2%) | 2.65 |
| Non-family | 345 (19.5%) | 1.03 |
| Total Households | 1,766 (100.0%) | 2.84 |
Household Size by Marriage Status in Wilmer
Out of a total of 1,766 households in Wilmer, 1,421 (80.5%) are family households, while 345 (19.5%) are nonfamily households. The most numerous type of family households are 2-person households, comprising 757, and the most common type of nonfamily households are 1-person households, comprising 333.
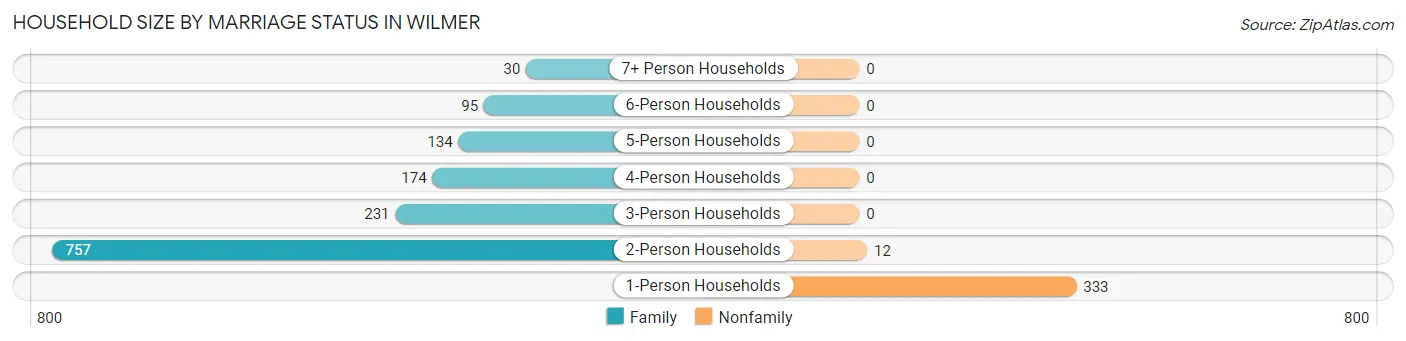
| Household Size | Family Households | Nonfamily Households |
| 1-Person Households | - | 333 (18.9%) |
| 2-Person Households | 757 (42.9%) | 12 (0.7%) |
| 3-Person Households | 231 (13.1%) | 0 (0.0%) |
| 4-Person Households | 174 (9.9%) | 0 (0.0%) |
| 5-Person Households | 134 (7.6%) | 0 (0.0%) |
| 6-Person Households | 95 (5.4%) | 0 (0.0%) |
| 7+ Person Households | 30 (1.7%) | 0 (0.0%) |
| Total | 1,421 (80.5%) | 345 (19.5%) |
Female Fertility in Wilmer
Fertility by Age in Wilmer
Average fertility rate in Wilmer is 64.0 births per 1,000 women. Women in the age bracket of 20 to 34 years have the highest fertility rate with 103.0 births per 1,000 women. Women in the age bracket of 20 to 34 years acount for 100.0% of all women with births.
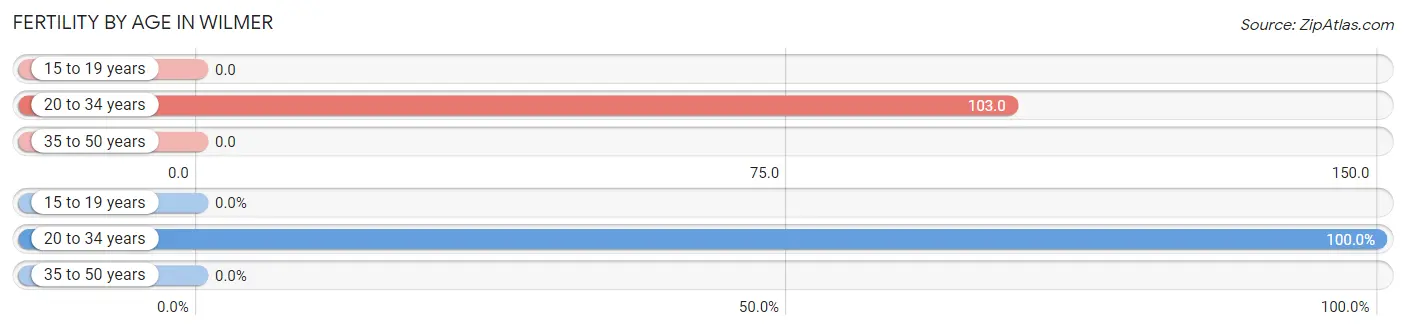
| Age Bracket | Women with Births | Births / 1,000 Women |
| 15 to 19 years | 0 (0.0%) | 0.0 |
| 20 to 34 years | 93 (100.0%) | 103.0 |
| 35 to 50 years | 0 (0.0%) | 0.0 |
| Total | 93 (100.0%) | 64.0 |
Fertility by Age by Marriage Status in Wilmer
64.5% of women with births (93) in Wilmer are married. The highest percentage of unmarried women with births falls into 20 to 34 years age bracket with 35.5% of them unmarried at the time of birth, while the lowest percentage of unmarried women with births belong to 20 to 34 years age bracket with 35.5% of them unmarried.
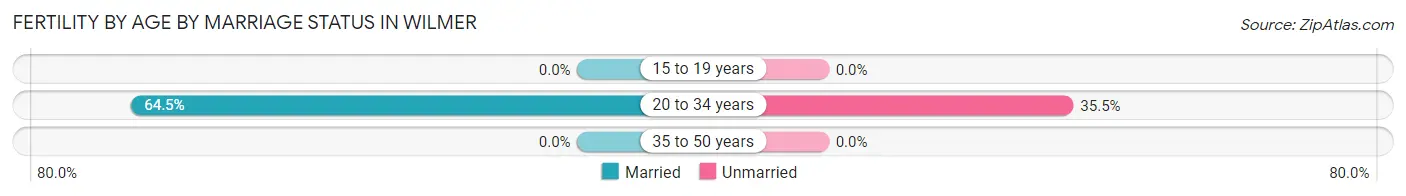
| Age Bracket | Married | Unmarried |
| 15 to 19 years | 0 (0.0%) | 0 (0.0%) |
| 20 to 34 years | 60 (64.5%) | 33 (35.5%) |
| 35 to 50 years | 0 (0.0%) | 0 (0.0%) |
| Total | 60 (64.5%) | 33 (35.5%) |
Fertility by Education in Wilmer
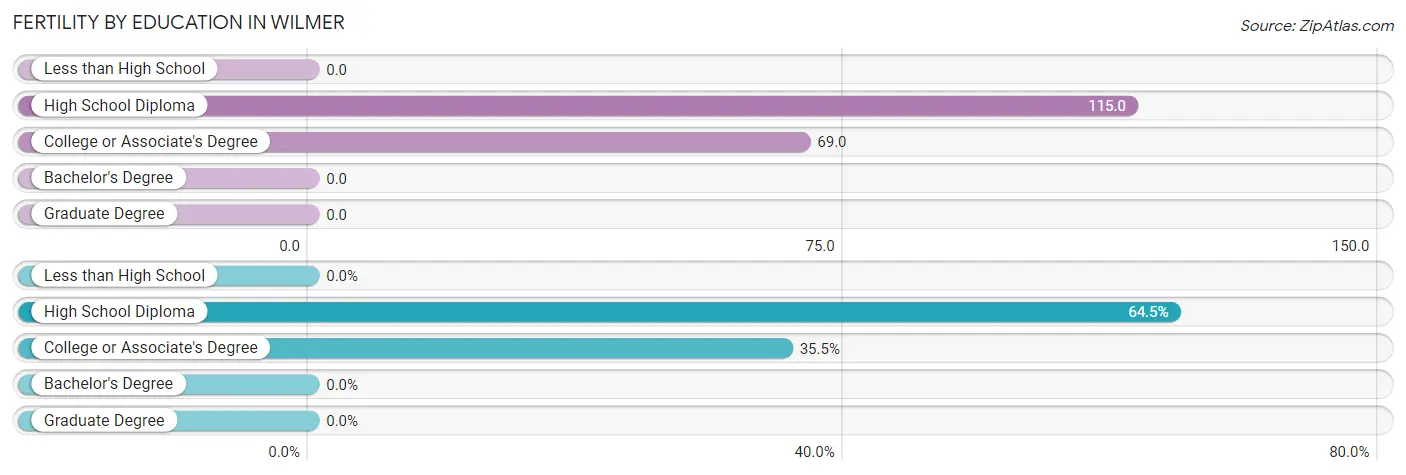
| Educational Attainment | Women with Births | Births / 1,000 Women |
| Less than High School | 0 (0.0%) | 0.0 |
| High School Diploma | 60 (64.5%) | 115.0 |
| College or Associate's Degree | 33 (35.5%) | 69.0 |
| Bachelor's Degree | 0 (0.0%) | 0.0 |
| Graduate Degree | 0 (0.0%) | 0.0 |
| Total | 93 (100.0%) | 64.0 |
Fertility by Education by Marriage Status in Wilmer
35.5% of women with births in Wilmer are unmarried. Women with the educational attainment of high school diploma are most likely to be married with 100.0% of them married at childbirth, while women with the educational attainment of college or associate's degree are least likely to be married with 100.0% of them unmarried at childbirth.
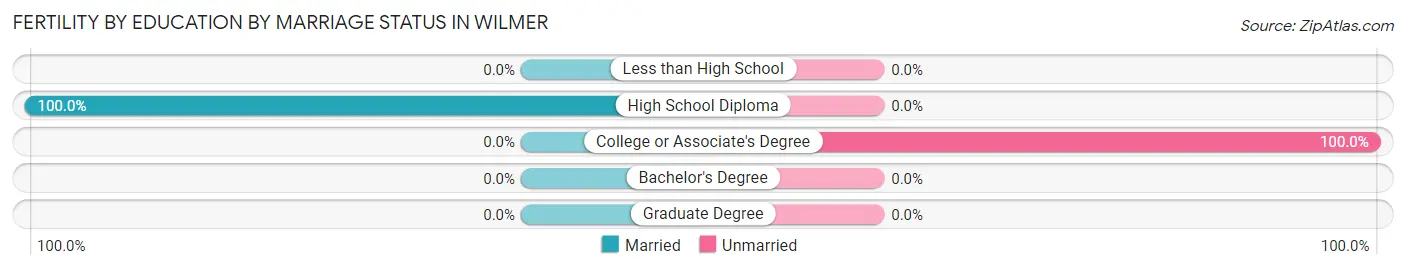
| Educational Attainment | Married | Unmarried |
| Less than High School | 0 (0.0%) | 0 (0.0%) |
| High School Diploma | 60 (100.0%) | 0 (0.0%) |
| College or Associate's Degree | 0 (0.0%) | 33 (100.0%) |
| Bachelor's Degree | 0 (0.0%) | 0 (0.0%) |
| Graduate Degree | 0 (0.0%) | 0 (0.0%) |
| Total | 60 (64.5%) | 33 (35.5%) |
Employment Characteristics in Wilmer
Employment by Class of Employer in Wilmer
Among the 2,389 employed individuals in Wilmer, private company employees (2,006 | 84.0%), local government employees (215 | 9.0%), and self-employed (not incorporated) (78 | 3.3%) make up the most common classes of employment.
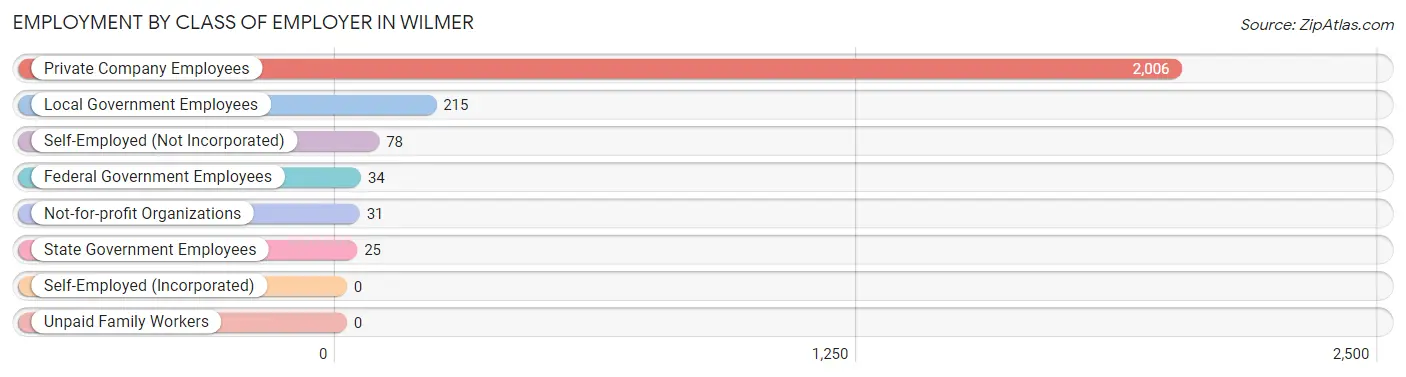
| Employer Class | # Employees | % Employees |
| Private Company Employees | 2,006 | 84.0% |
| Self-Employed (Incorporated) | 0 | 0.0% |
| Self-Employed (Not Incorporated) | 78 | 3.3% |
| Not-for-profit Organizations | 31 | 1.3% |
| Local Government Employees | 215 | 9.0% |
| State Government Employees | 25 | 1.1% |
| Federal Government Employees | 34 | 1.4% |
| Unpaid Family Workers | 0 | 0.0% |
| Total | 2,389 | 100.0% |
Employment Status by Age in Wilmer
According to the labor force statistics for Wilmer, out of the total population over 16 years of age (4,158), 63.8% or 2,653 individuals are in the labor force, with 6.3% or 167 of them unemployed. The age group with the highest labor force participation rate is 20 to 24 years, with 91.3% or 443 individuals in the labor force. Within the labor force, the 16 to 19 years age range has the highest percentage of unemployed individuals, with 74.5% or 38 of them being unemployed.
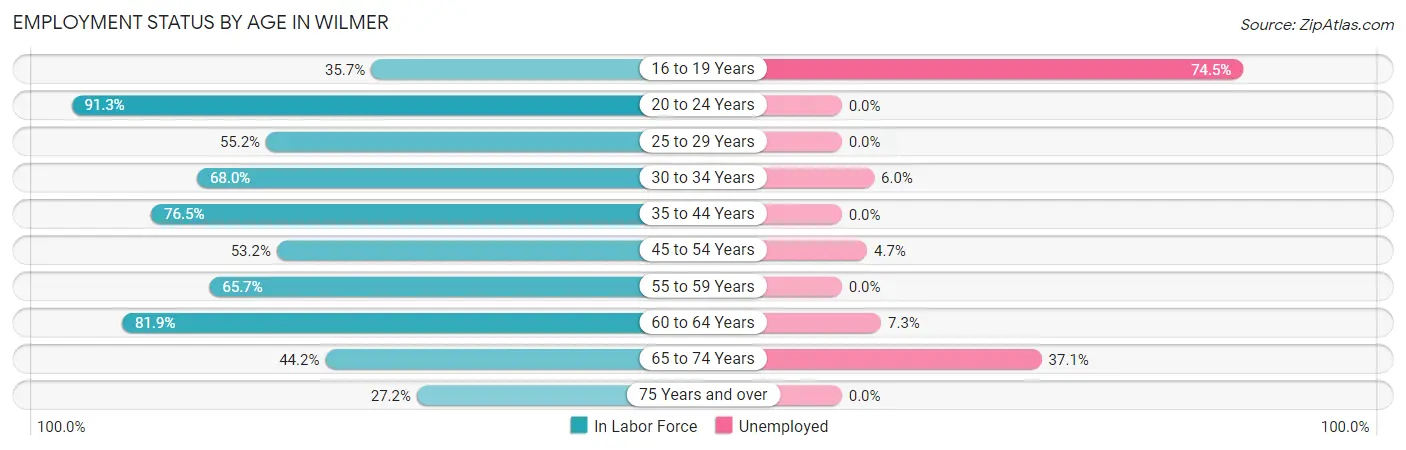
| Age Bracket | In Labor Force | Unemployed |
| 16 to 19 Years | 51 (35.7%) | 38 (74.5%) |
| 20 to 24 Years | 443 (91.3%) | 0 (0.0%) |
| 25 to 29 Years | 280 (55.2%) | 0 (0.0%) |
| 30 to 34 Years | 251 (68.0%) | 15 (6.0%) |
| 35 to 44 Years | 549 (76.5%) | 0 (0.0%) |
| 45 to 54 Years | 297 (53.2%) | 14 (4.7%) |
| 55 to 59 Years | 253 (65.7%) | 0 (0.0%) |
| 60 to 64 Years | 262 (81.9%) | 19 (7.3%) |
| 65 to 74 Years | 221 (44.2%) | 82 (37.1%) |
| 75 Years and over | 47 (27.2%) | 0 (0.0%) |
| Total | 2,653 (63.8%) | 167 (6.3%) |
Employment Status by Educational Attainment in Wilmer
According to labor force statistics for Wilmer, 66.2% of individuals (1,891) out of the total population between 25 and 64 years of age (2,857) are in the labor force, with 2.5% or 47 of them being unemployed. The group with the highest labor force participation rate are those with the educational attainment of college / associate degree, with 90.0% or 780 individuals in the labor force. Within the labor force, individuals with high school diploma education have the highest percentage of unemployment, with 8.1% or 29 of them being unemployed.
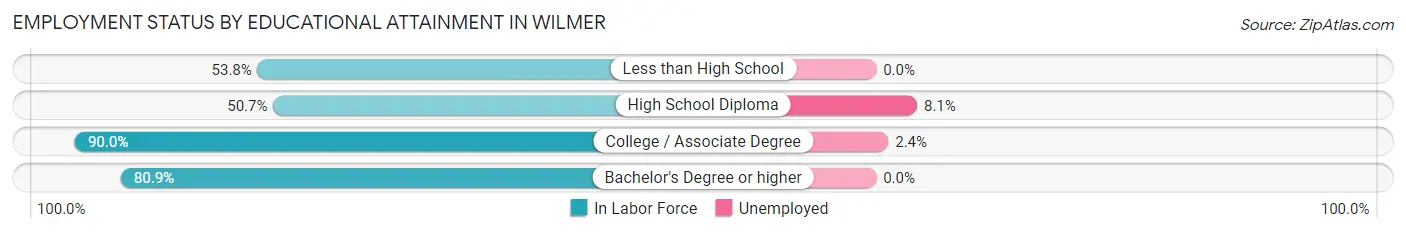
| Educational Attainment | In Labor Force | Unemployed |
| Less than High School | 564 (53.8%) | 0 (0.0%) |
| High School Diploma | 358 (50.7%) | 57 (8.1%) |
| College / Associate Degree | 780 (90.0%) | 21 (2.4%) |
| Bachelor's Degree or higher | 190 (80.9%) | 0 (0.0%) |
| Total | 1,891 (66.2%) | 71 (2.5%) |
Employment Occupations by Sex in Wilmer
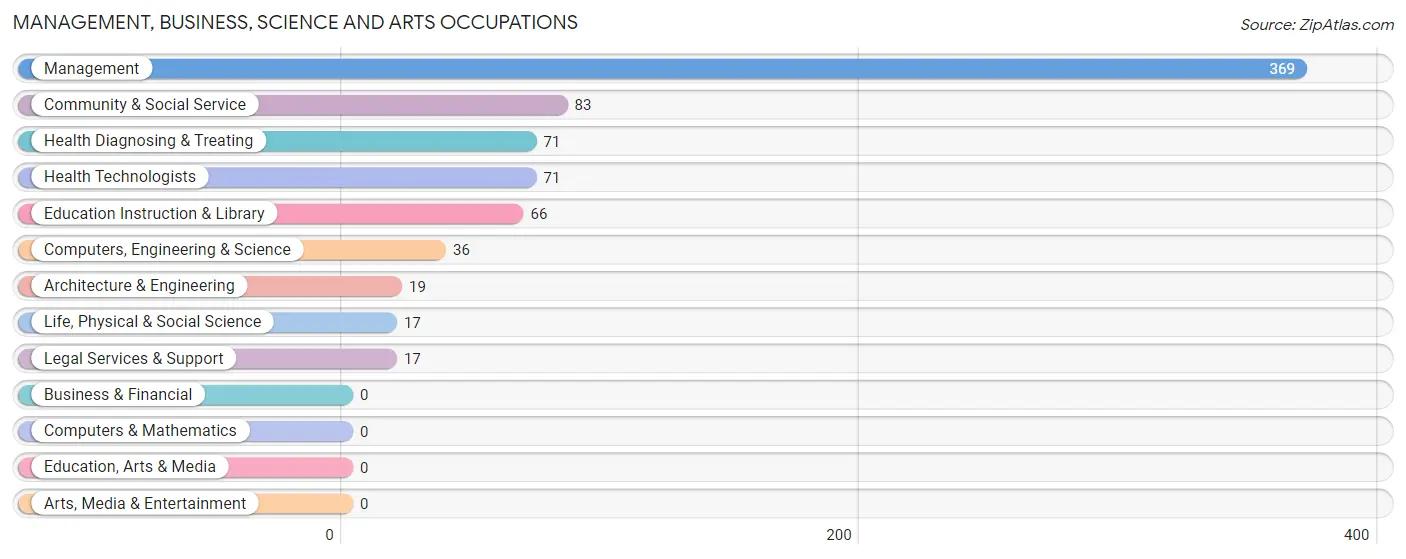
Management, Business, Science and Arts Occupations
The most common Management, Business, Science and Arts occupations in Wilmer are Management (369 | 14.8%), Community & Social Service (83 | 3.3%), Health Diagnosing & Treating (71 | 2.9%), Health Technologists (71 | 2.9%), and Education Instruction & Library (66 | 2.6%).
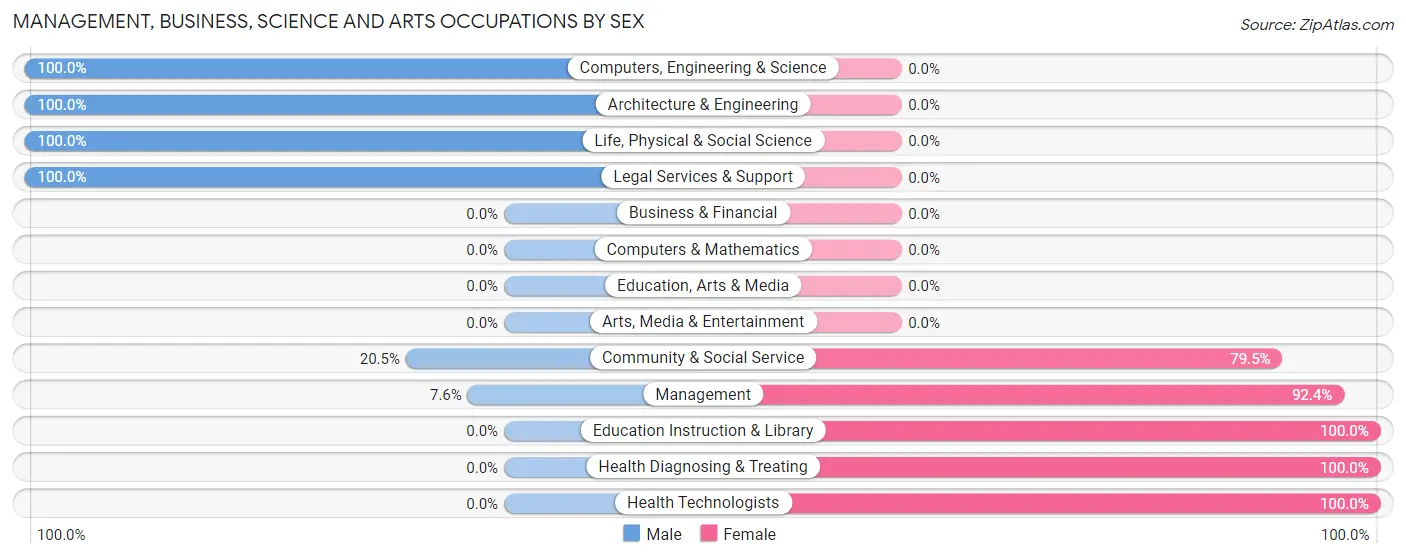
Management, Business, Science and Arts Occupations by Sex
Within the Management, Business, Science and Arts occupations in Wilmer, the most male-oriented occupations are Computers, Engineering & Science (100.0%), Architecture & Engineering (100.0%), and Life, Physical & Social Science (100.0%), while the most female-oriented occupations are Education Instruction & Library (100.0%), Health Diagnosing & Treating (100.0%), and Health Technologists (100.0%).
| Occupation | Male | Female |
| Management | 28 (7.6%) | 341 (92.4%) |
| Business & Financial | 0 (0.0%) | 0 (0.0%) |
| Computers, Engineering & Science | 36 (100.0%) | 0 (0.0%) |
| Computers & Mathematics | 0 (0.0%) | 0 (0.0%) |
| Architecture & Engineering | 19 (100.0%) | 0 (0.0%) |
| Life, Physical & Social Science | 17 (100.0%) | 0 (0.0%) |
| Community & Social Service | 17 (20.5%) | 66 (79.5%) |
| Education, Arts & Media | 0 (0.0%) | 0 (0.0%) |
| Legal Services & Support | 17 (100.0%) | 0 (0.0%) |
| Education Instruction & Library | 0 (0.0%) | 66 (100.0%) |
| Arts, Media & Entertainment | 0 (0.0%) | 0 (0.0%) |
| Health Diagnosing & Treating | 0 (0.0%) | 71 (100.0%) |
| Health Technologists | 0 (0.0%) | 71 (100.0%) |
| Total (Category) | 81 (14.5%) | 478 (85.5%) |
| Total (Overall) | 1,080 (43.4%) | 1,406 (56.6%) |
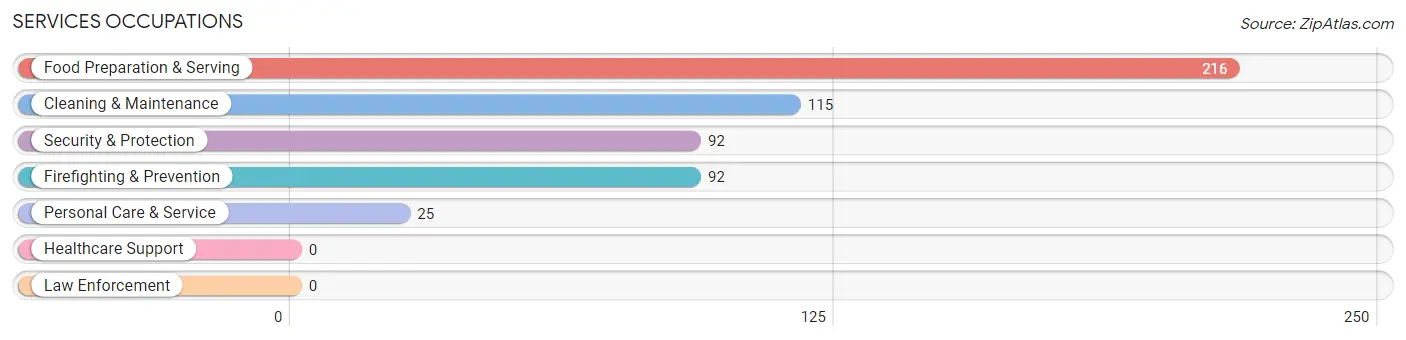
Services Occupations
The most common Services occupations in Wilmer are Food Preparation & Serving (216 | 8.7%), Cleaning & Maintenance (115 | 4.6%), Security & Protection (92 | 3.7%), Firefighting & Prevention (92 | 3.7%), and Personal Care & Service (25 | 1.0%).
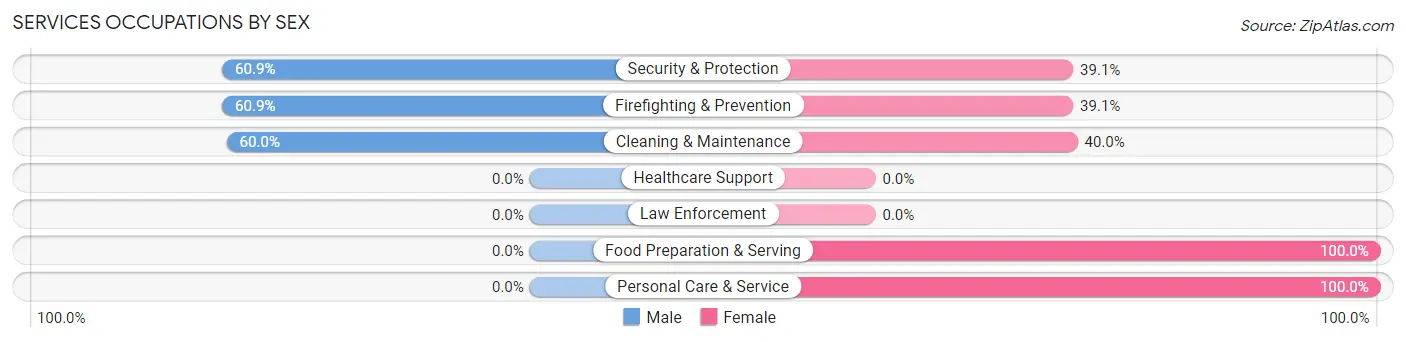
Services Occupations by Sex
Within the Services occupations in Wilmer, the most male-oriented occupations are Security & Protection (60.9%), Firefighting & Prevention (60.9%), and Cleaning & Maintenance (60.0%), while the most female-oriented occupations are Food Preparation & Serving (100.0%), Personal Care & Service (100.0%), and Cleaning & Maintenance (40.0%).
| Occupation | Male | Female |
| Healthcare Support | 0 (0.0%) | 0 (0.0%) |
| Security & Protection | 56 (60.9%) | 36 (39.1%) |
| Firefighting & Prevention | 56 (60.9%) | 36 (39.1%) |
| Law Enforcement | 0 (0.0%) | 0 (0.0%) |
| Food Preparation & Serving | 0 (0.0%) | 216 (100.0%) |
| Cleaning & Maintenance | 69 (60.0%) | 46 (40.0%) |
| Personal Care & Service | 0 (0.0%) | 25 (100.0%) |
| Total (Category) | 125 (27.9%) | 323 (72.1%) |
| Total (Overall) | 1,080 (43.4%) | 1,406 (56.6%) |
Sales and Office Occupations
The most common Sales and Office occupations in Wilmer are Office & Administration (411 | 16.5%), and Sales & Related (203 | 8.2%).
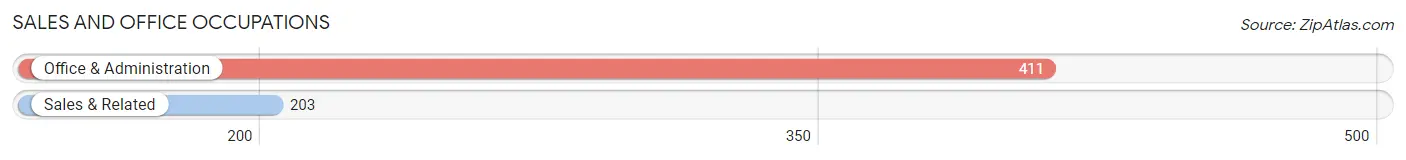
Sales and Office Occupations by Sex

| Occupation | Male | Female |
| Sales & Related | 51 (25.1%) | 152 (74.9%) |
| Office & Administration | 72 (17.5%) | 339 (82.5%) |
| Total (Category) | 123 (20.0%) | 491 (80.0%) |
| Total (Overall) | 1,080 (43.4%) | 1,406 (56.6%) |
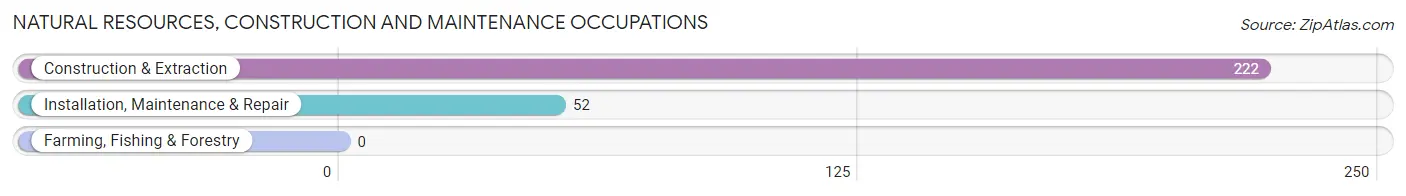
Natural Resources, Construction and Maintenance Occupations
The most common Natural Resources, Construction and Maintenance occupations in Wilmer are Construction & Extraction (222 | 8.9%), and Installation, Maintenance & Repair (52 | 2.1%).
Natural Resources, Construction and Maintenance Occupations by Sex
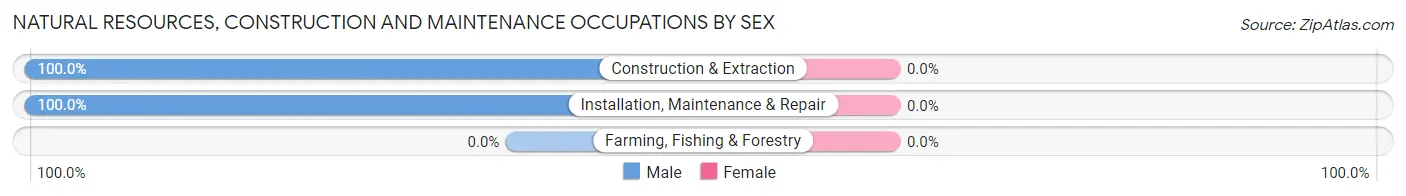
| Occupation | Male | Female |
| Farming, Fishing & Forestry | 0 (0.0%) | 0 (0.0%) |
| Construction & Extraction | 222 (100.0%) | 0 (0.0%) |
| Installation, Maintenance & Repair | 52 (100.0%) | 0 (0.0%) |
| Total (Category) | 274 (100.0%) | 0 (0.0%) |
| Total (Overall) | 1,080 (43.4%) | 1,406 (56.6%) |
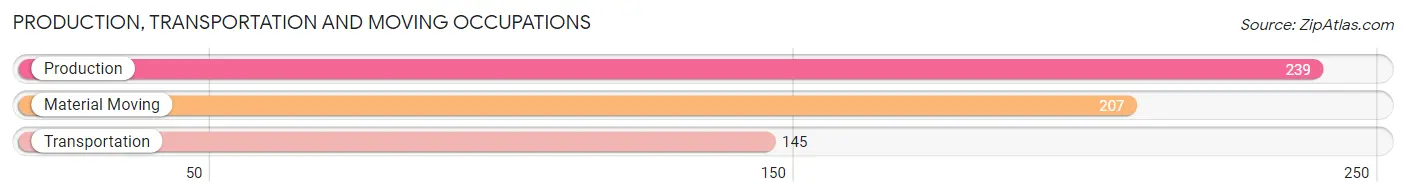
Production, Transportation and Moving Occupations
The most common Production, Transportation and Moving occupations in Wilmer are Production (239 | 9.6%), Material Moving (207 | 8.3%), and Transportation (145 | 5.8%).
Production, Transportation and Moving Occupations by Sex
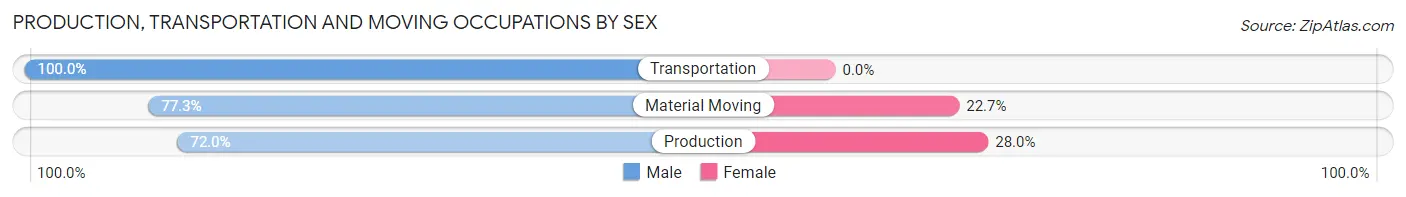
| Occupation | Male | Female |
| Production | 172 (72.0%) | 67 (28.0%) |
| Transportation | 145 (100.0%) | 0 (0.0%) |
| Material Moving | 160 (77.3%) | 47 (22.7%) |
| Total (Category) | 477 (80.7%) | 114 (19.3%) |
| Total (Overall) | 1,080 (43.4%) | 1,406 (56.6%) |
Employment Industries by Sex in Wilmer
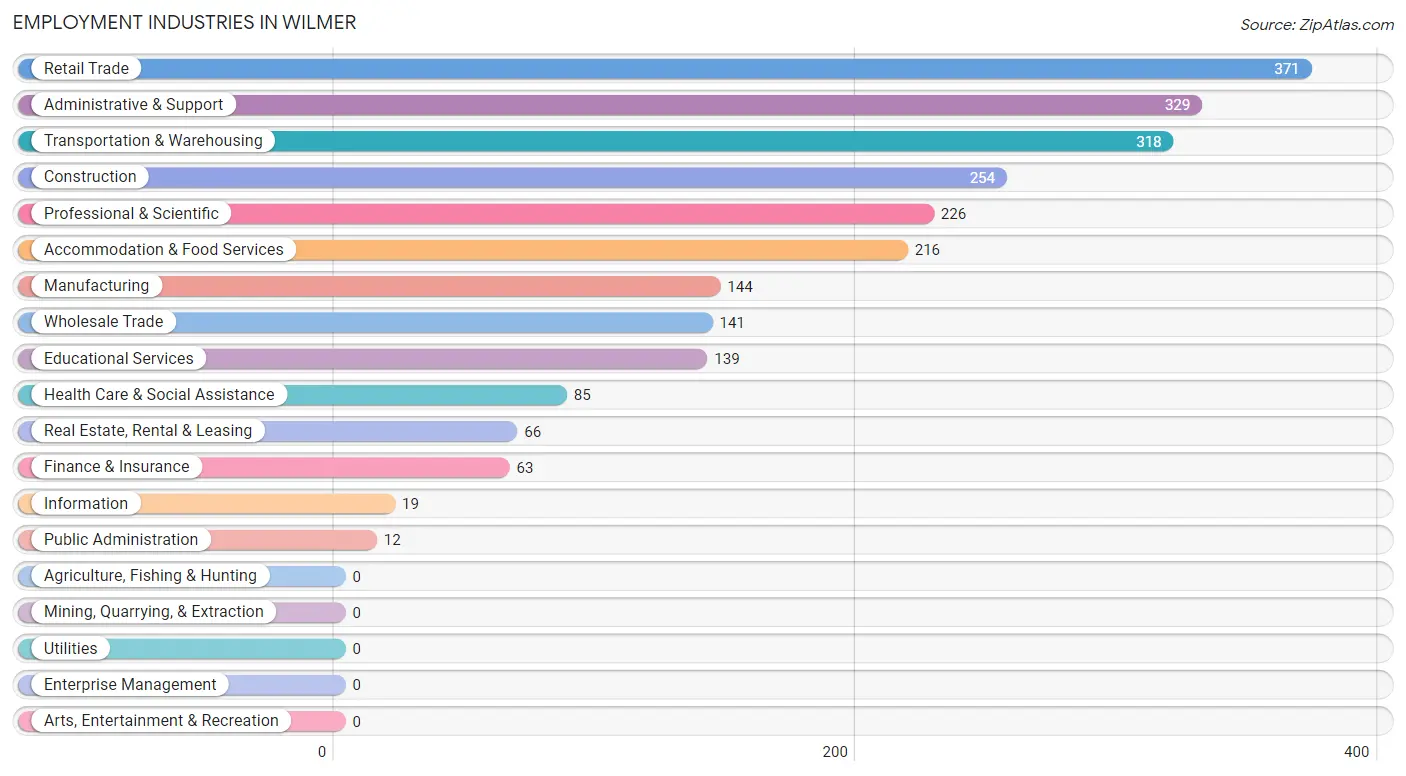
Employment Industries in Wilmer
The major employment industries in Wilmer include Retail Trade (371 | 14.9%), Administrative & Support (329 | 13.2%), Transportation & Warehousing (318 | 12.8%), Construction (254 | 10.2%), and Professional & Scientific (226 | 9.1%).
Employment Industries by Sex in Wilmer
The Wilmer industries that see more men than women are Construction (100.0%), Public Administration (100.0%), and Manufacturing (83.3%), whereas the industries that tend to have a higher number of women are Information (100.0%), Finance & Insurance (100.0%), and Educational Services (100.0%).
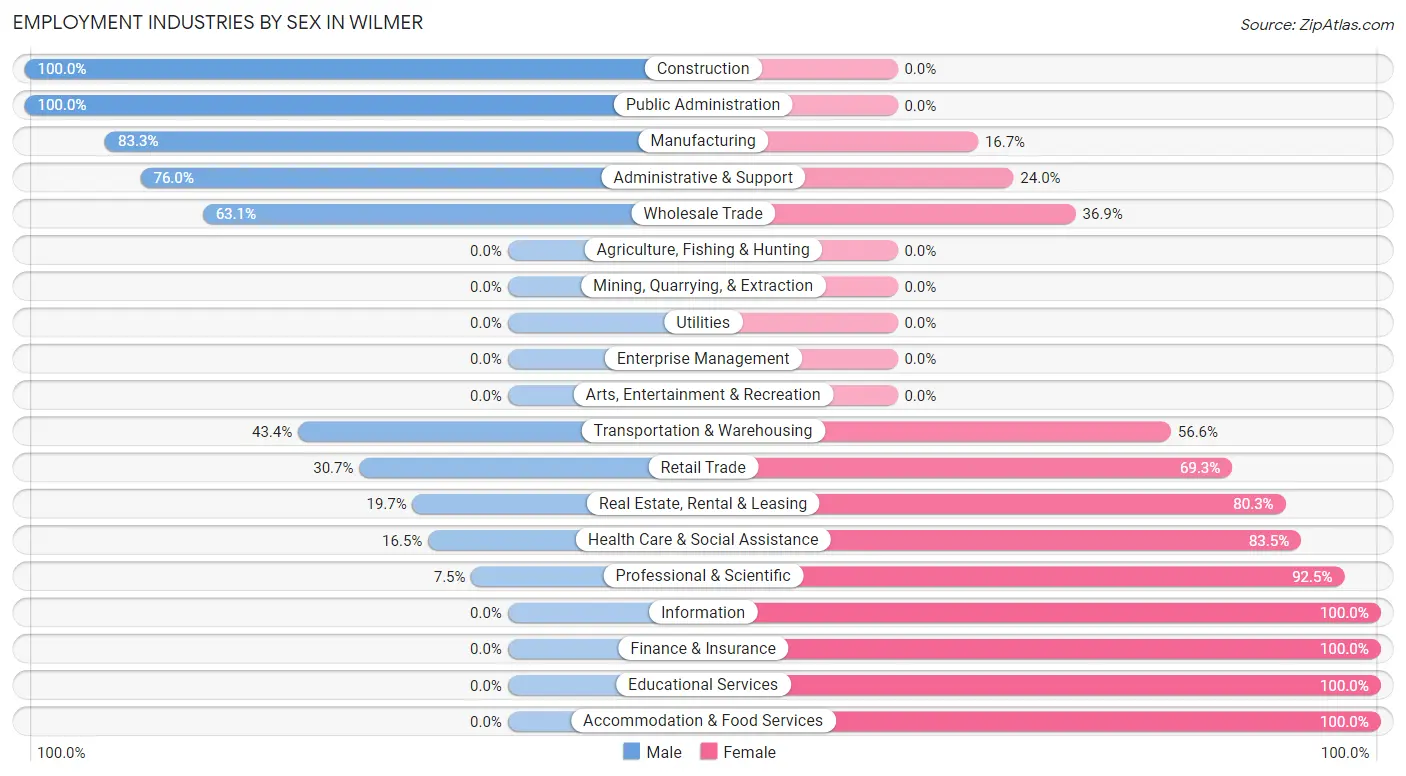
| Industry | Male | Female |
| Agriculture, Fishing & Hunting | 0 (0.0%) | 0 (0.0%) |
| Mining, Quarrying, & Extraction | 0 (0.0%) | 0 (0.0%) |
| Construction | 254 (100.0%) | 0 (0.0%) |
| Manufacturing | 120 (83.3%) | 24 (16.7%) |
| Wholesale Trade | 89 (63.1%) | 52 (36.9%) |
| Retail Trade | 114 (30.7%) | 257 (69.3%) |
| Transportation & Warehousing | 138 (43.4%) | 180 (56.6%) |
| Utilities | 0 (0.0%) | 0 (0.0%) |
| Information | 0 (0.0%) | 19 (100.0%) |
| Finance & Insurance | 0 (0.0%) | 63 (100.0%) |
| Real Estate, Rental & Leasing | 13 (19.7%) | 53 (80.3%) |
| Professional & Scientific | 17 (7.5%) | 209 (92.5%) |
| Enterprise Management | 0 (0.0%) | 0 (0.0%) |
| Administrative & Support | 250 (76.0%) | 79 (24.0%) |
| Educational Services | 0 (0.0%) | 139 (100.0%) |
| Health Care & Social Assistance | 14 (16.5%) | 71 (83.5%) |
| Arts, Entertainment & Recreation | 0 (0.0%) | 0 (0.0%) |
| Accommodation & Food Services | 0 (0.0%) | 216 (100.0%) |
| Public Administration | 12 (100.0%) | 0 (0.0%) |
| Total | 1,080 (43.4%) | 1,406 (56.6%) |
Education in Wilmer
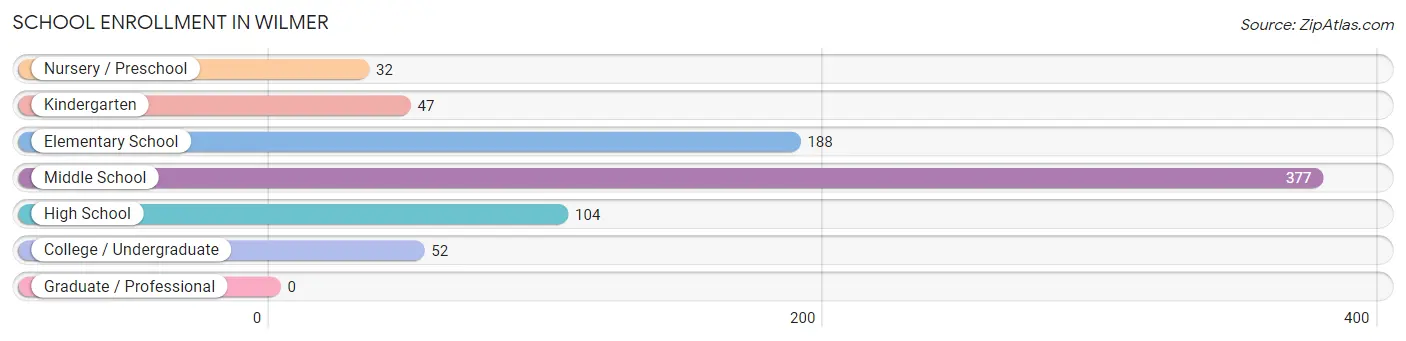
School Enrollment in Wilmer
The most common levels of schooling among the 800 students in Wilmer are middle school (377 | 47.1%), elementary school (188 | 23.5%), and high school (104 | 13.0%).
| School Level | # Students | % Students |
| Nursery / Preschool | 32 | 4.0% |
| Kindergarten | 47 | 5.9% |
| Elementary School | 188 | 23.5% |
| Middle School | 377 | 47.1% |
| High School | 104 | 13.0% |
| College / Undergraduate | 52 | 6.5% |
| Graduate / Professional | 0 | 0.0% |
| Total | 800 | 100.0% |
School Enrollment by Age by Funding Source in Wilmer
Out of a total of 800 students who are enrolled in schools in Wilmer, 43 (5.4%) attend a private institution, while the remaining 757 (94.6%) are enrolled in public schools. The age group of 25 to 34 year olds has the highest likelihood of being enrolled in private schools, with 3 (100.0% in the age bracket) enrolled. Conversely, the age group of 3 to 4 year olds has the lowest likelihood of being enrolled in a private school, with 32 (100.0% in the age bracket) attending a public institution.
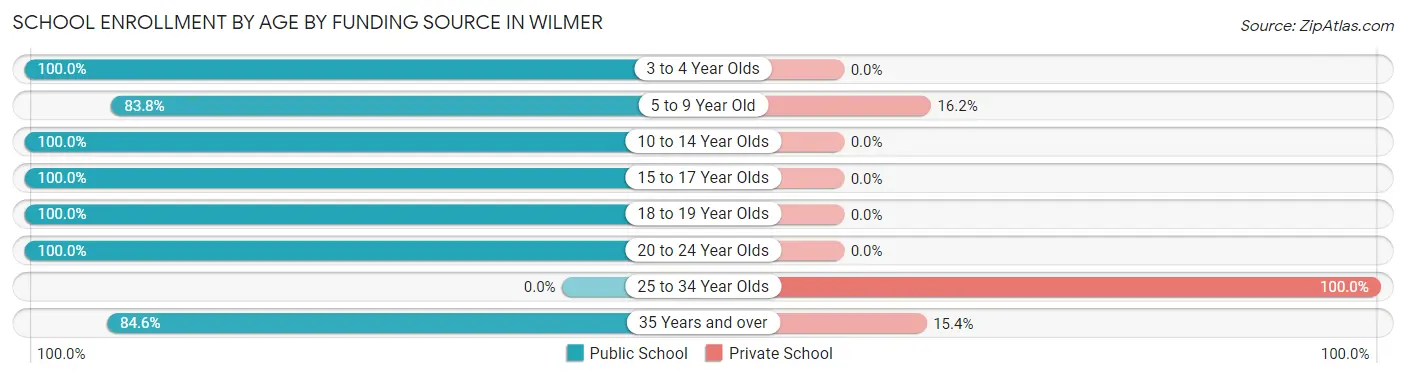
| Age Bracket | Public School | Private School |
| 3 to 4 Year Olds | 32 (100.0%) | 0 (0.0%) |
| 5 to 9 Year Old | 197 (83.8%) | 38 (16.2%) |
| 10 to 14 Year Olds | 377 (100.0%) | 0 (0.0%) |
| 15 to 17 Year Olds | 91 (100.0%) | 0 (0.0%) |
| 18 to 19 Year Olds | 13 (100.0%) | 0 (0.0%) |
| 20 to 24 Year Olds | 36 (100.0%) | 0 (0.0%) |
| 25 to 34 Year Olds | 0 (0.0%) | 3 (100.0%) |
| 35 Years and over | 11 (84.6%) | 2 (15.4%) |
| Total | 757 (94.6%) | 43 (5.4%) |
Educational Attainment by Field of Study in Wilmer
Business (73 | 29.5%), education (47 | 19.0%), arts & humanities (46 | 18.6%), computers & mathematics (34 | 13.8%), and engineering (20 | 8.1%) are the most common fields of study among 247 individuals in Wilmer who have obtained a bachelor's degree or higher.
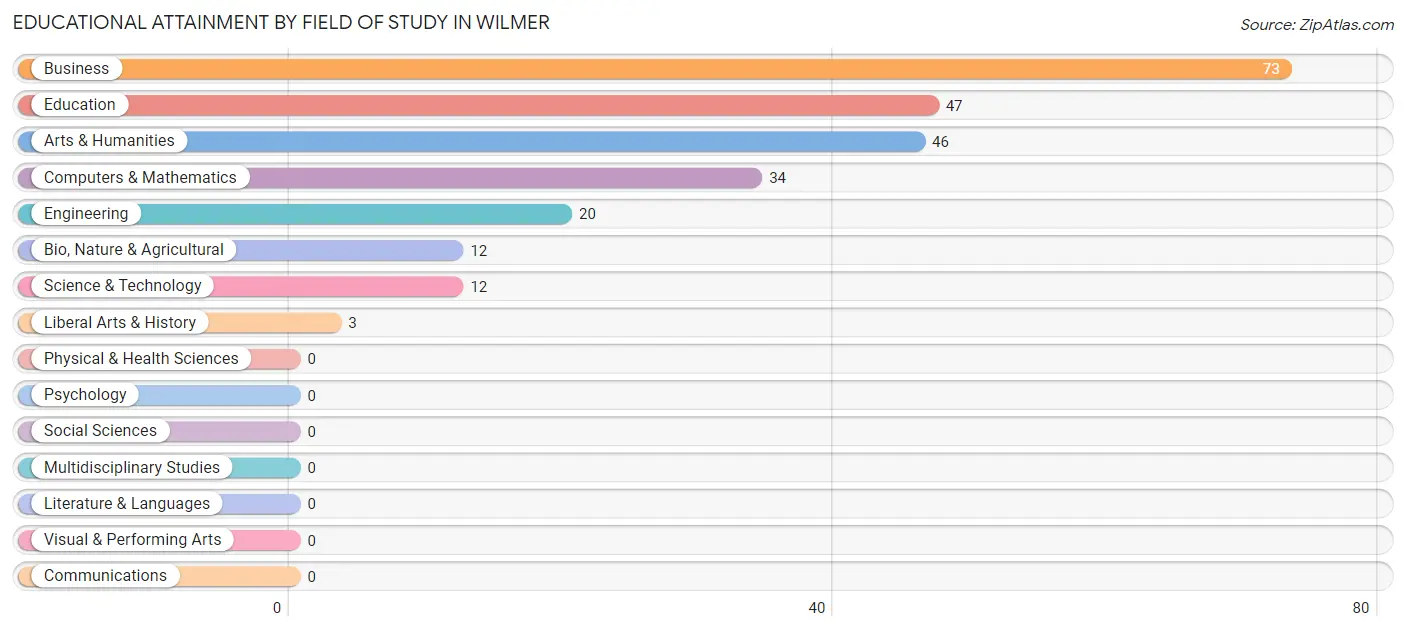
| Field of Study | # Graduates | % Graduates |
| Computers & Mathematics | 34 | 13.8% |
| Bio, Nature & Agricultural | 12 | 4.9% |
| Physical & Health Sciences | 0 | 0.0% |
| Psychology | 0 | 0.0% |
| Social Sciences | 0 | 0.0% |
| Engineering | 20 | 8.1% |
| Multidisciplinary Studies | 0 | 0.0% |
| Science & Technology | 12 | 4.9% |
| Business | 73 | 29.5% |
| Education | 47 | 19.0% |
| Literature & Languages | 0 | 0.0% |
| Liberal Arts & History | 3 | 1.2% |
| Visual & Performing Arts | 0 | 0.0% |
| Communications | 0 | 0.0% |
| Arts & Humanities | 46 | 18.6% |
| Total | 247 | 100.0% |
Transportation & Commute in Wilmer
Vehicle Availability by Sex in Wilmer
The most prevalent vehicle ownership categories in Wilmer are males with 2 vehicles (517, accounting for 48.6%) and females with 2 vehicles (858, making up 39.5%).
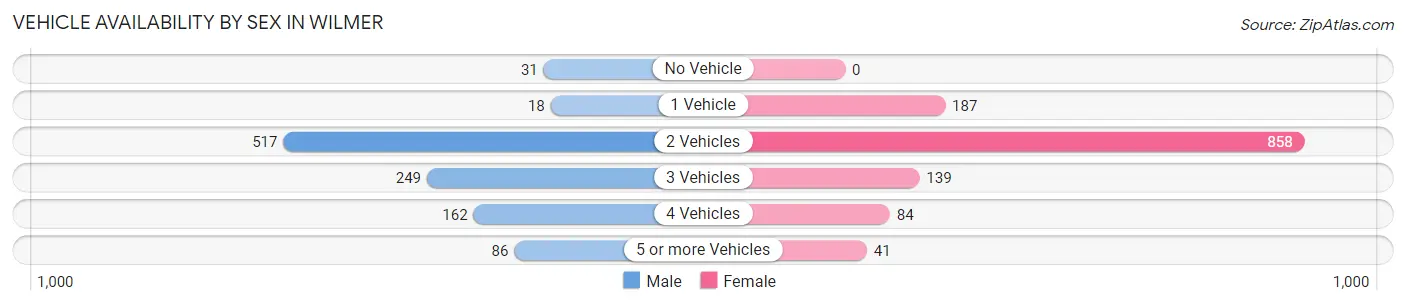
| Vehicles Available | Male | Female |
| No Vehicle | 31 (2.9%) | 0 (0.0%) |
| 1 Vehicle | 18 (1.7%) | 187 (14.3%) |
| 2 Vehicles | 517 (48.6%) | 858 (65.5%) |
| 3 Vehicles | 249 (23.4%) | 139 (10.6%) |
| 4 Vehicles | 162 (15.2%) | 84 (6.4%) |
| 5 or more Vehicles | 86 (8.1%) | 41 (3.1%) |
| Total | 1,063 (100.0%) | 1,309 (100.0%) |
Commute Time in Wilmer
The most frequently occuring commute durations in Wilmer are 45 to 59 minutes (631 commuters, 26.6%), 30 to 34 minutes (413 commuters, 17.4%), and 60 to 89 minutes (247 commuters, 10.4%).
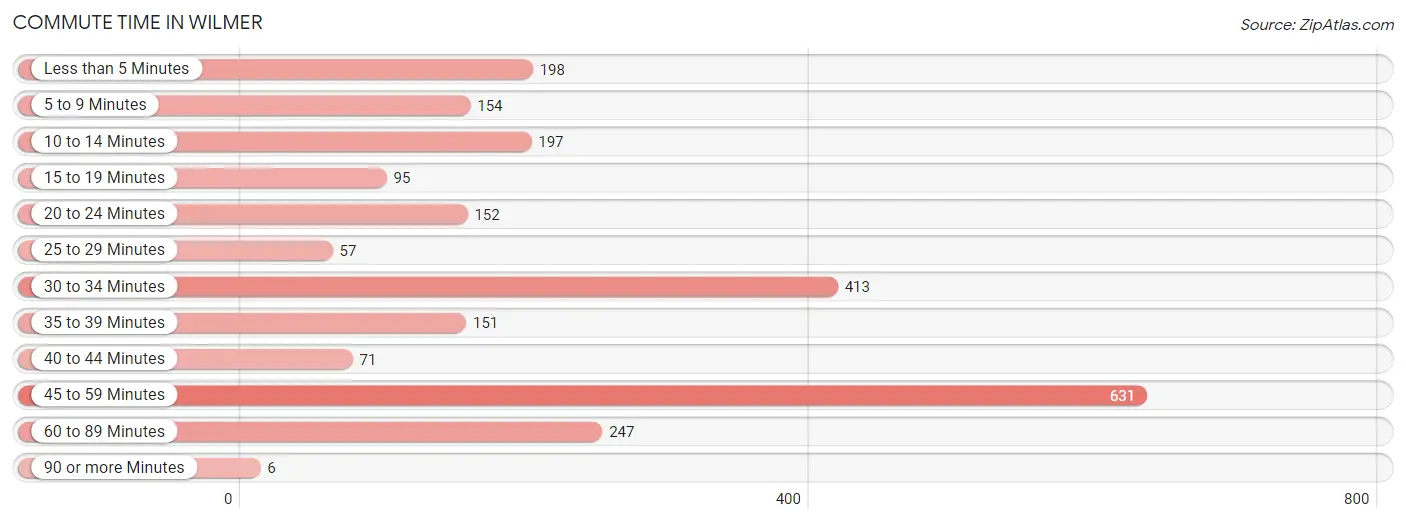
| Commute Time | # Commuters | % Commuters |
| Less than 5 Minutes | 198 | 8.4% |
| 5 to 9 Minutes | 154 | 6.5% |
| 10 to 14 Minutes | 197 | 8.3% |
| 15 to 19 Minutes | 95 | 4.0% |
| 20 to 24 Minutes | 152 | 6.4% |
| 25 to 29 Minutes | 57 | 2.4% |
| 30 to 34 Minutes | 413 | 17.4% |
| 35 to 39 Minutes | 151 | 6.4% |
| 40 to 44 Minutes | 71 | 3.0% |
| 45 to 59 Minutes | 631 | 26.6% |
| 60 to 89 Minutes | 247 | 10.4% |
| 90 or more Minutes | 6 | 0.3% |
Commute Time by Sex in Wilmer
The most common commute times in Wilmer are 30 to 34 minutes (227 commuters, 21.3%) for males and 45 to 59 minutes (551 commuters, 42.1%) for females.
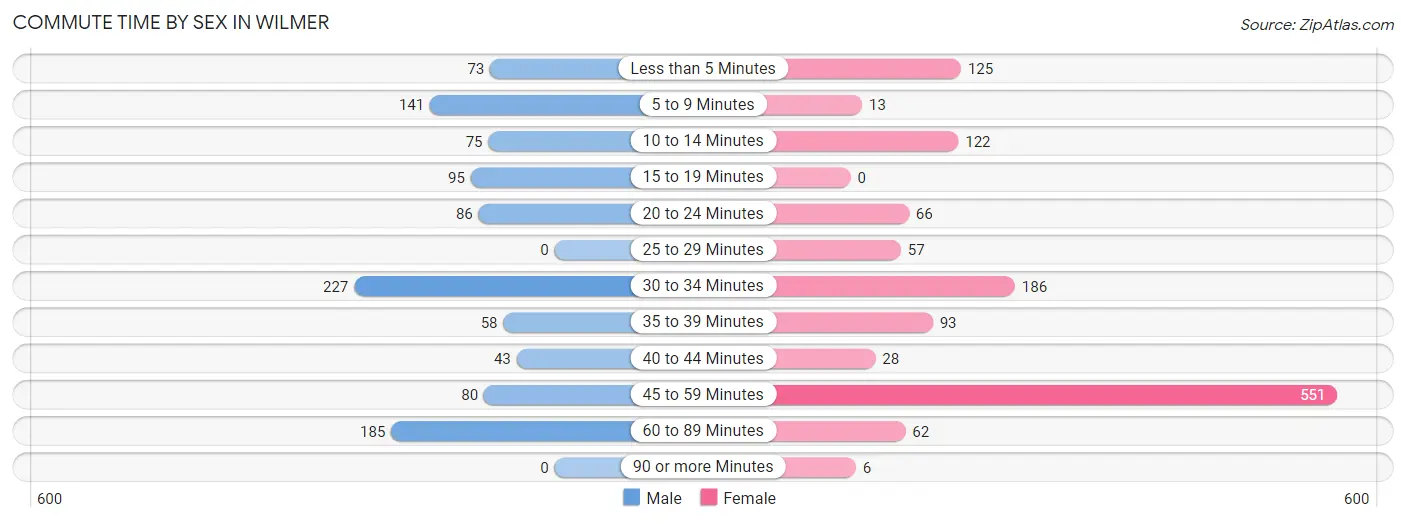
| Commute Time | Male | Female |
| Less than 5 Minutes | 73 (6.9%) | 125 (9.6%) |
| 5 to 9 Minutes | 141 (13.3%) | 13 (1.0%) |
| 10 to 14 Minutes | 75 (7.1%) | 122 (9.3%) |
| 15 to 19 Minutes | 95 (8.9%) | 0 (0.0%) |
| 20 to 24 Minutes | 86 (8.1%) | 66 (5.0%) |
| 25 to 29 Minutes | 0 (0.0%) | 57 (4.3%) |
| 30 to 34 Minutes | 227 (21.3%) | 186 (14.2%) |
| 35 to 39 Minutes | 58 (5.5%) | 93 (7.1%) |
| 40 to 44 Minutes | 43 (4.1%) | 28 (2.1%) |
| 45 to 59 Minutes | 80 (7.5%) | 551 (42.1%) |
| 60 to 89 Minutes | 185 (17.4%) | 62 (4.7%) |
| 90 or more Minutes | 0 (0.0%) | 6 (0.5%) |
Time of Departure to Work by Sex in Wilmer
The most frequent times of departure to work in Wilmer are 8:00 AM to 8:29 AM (296, 27.9%) for males and 4:00 PM to 11:59 PM (370, 28.3%) for females.
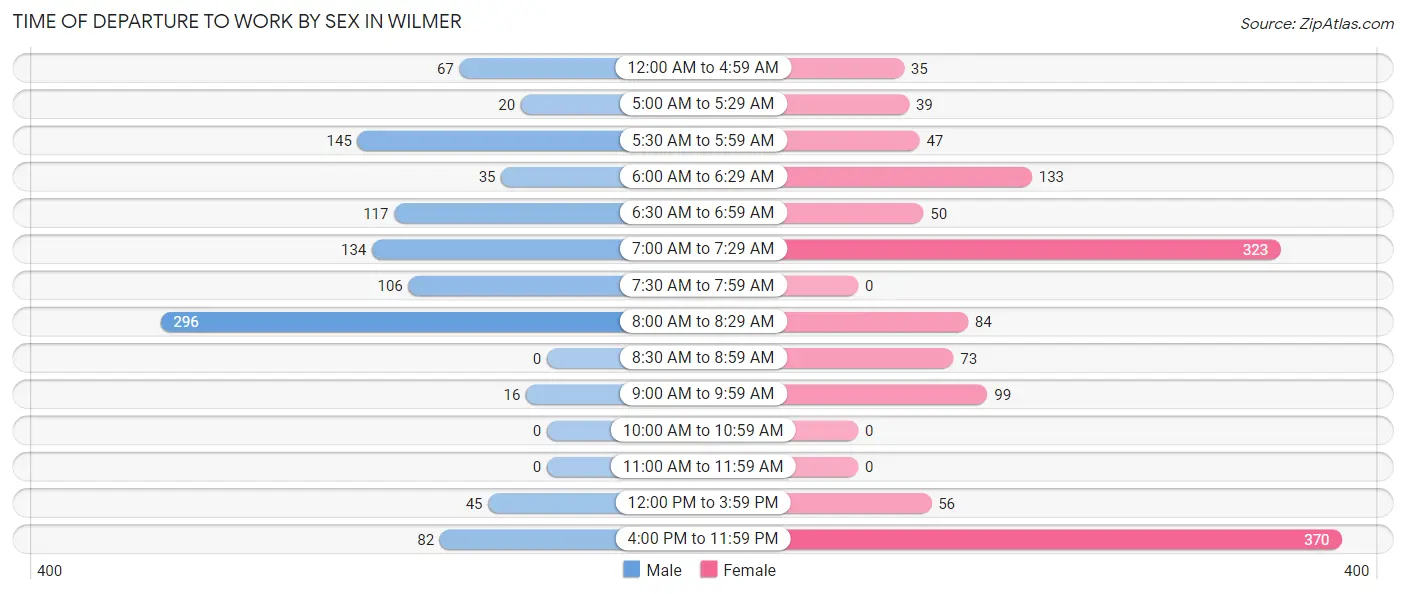
| Time of Departure | Male | Female |
| 12:00 AM to 4:59 AM | 67 (6.3%) | 35 (2.7%) |
| 5:00 AM to 5:29 AM | 20 (1.9%) | 39 (3.0%) |
| 5:30 AM to 5:59 AM | 145 (13.6%) | 47 (3.6%) |
| 6:00 AM to 6:29 AM | 35 (3.3%) | 133 (10.2%) |
| 6:30 AM to 6:59 AM | 117 (11.0%) | 50 (3.8%) |
| 7:00 AM to 7:29 AM | 134 (12.6%) | 323 (24.7%) |
| 7:30 AM to 7:59 AM | 106 (10.0%) | 0 (0.0%) |
| 8:00 AM to 8:29 AM | 296 (27.9%) | 84 (6.4%) |
| 8:30 AM to 8:59 AM | 0 (0.0%) | 73 (5.6%) |
| 9:00 AM to 9:59 AM | 16 (1.5%) | 99 (7.6%) |
| 10:00 AM to 10:59 AM | 0 (0.0%) | 0 (0.0%) |
| 11:00 AM to 11:59 AM | 0 (0.0%) | 0 (0.0%) |
| 12:00 PM to 3:59 PM | 45 (4.2%) | 56 (4.3%) |
| 4:00 PM to 11:59 PM | 82 (7.7%) | 370 (28.3%) |
| Total | 1,063 (100.0%) | 1,309 (100.0%) |
Housing Occupancy in Wilmer
Occupancy by Ownership in Wilmer
Of the total 1,766 dwellings in Wilmer, owner-occupied units account for 1,143 (64.7%), while renter-occupied units make up 623 (35.3%).
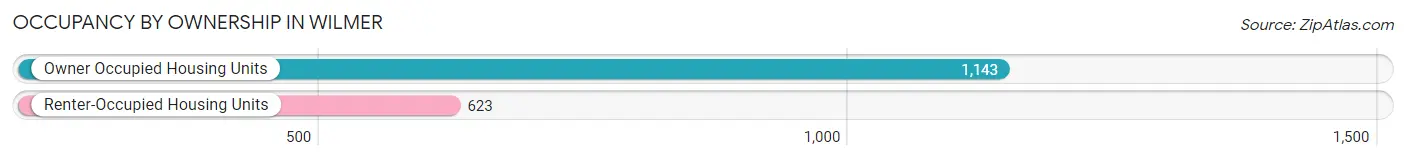
| Occupancy | # Housing Units | % Housing Units |
| Owner Occupied Housing Units | 1,143 | 64.7% |
| Renter-Occupied Housing Units | 623 | 35.3% |
| Total Occupied Housing Units | 1,766 | 100.0% |
Occupancy by Household Size in Wilmer
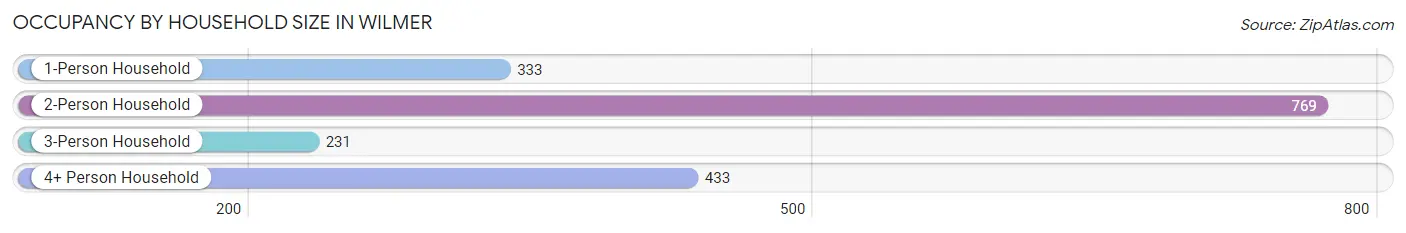
| Household Size | # Housing Units | % Housing Units |
| 1-Person Household | 333 | 18.9% |
| 2-Person Household | 769 | 43.5% |
| 3-Person Household | 231 | 13.1% |
| 4+ Person Household | 433 | 24.5% |
| Total Housing Units | 1,766 | 100.0% |
Occupancy by Ownership by Household Size in Wilmer
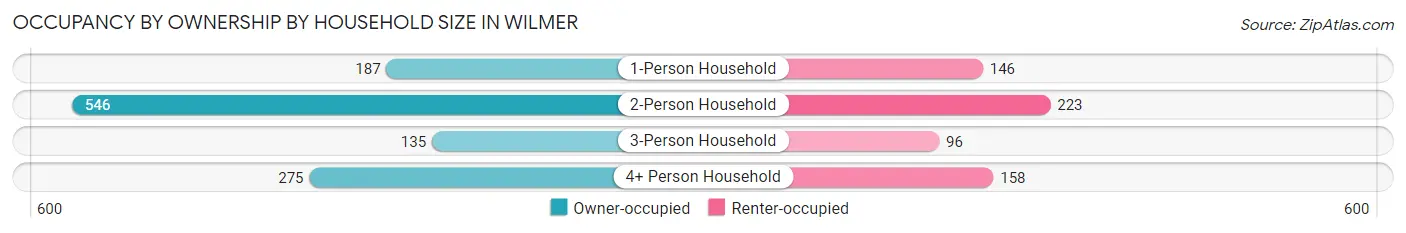
| Household Size | Owner-occupied | Renter-occupied |
| 1-Person Household | 187 (56.2%) | 146 (43.8%) |
| 2-Person Household | 546 (71.0%) | 223 (29.0%) |
| 3-Person Household | 135 (58.4%) | 96 (41.6%) |
| 4+ Person Household | 275 (63.5%) | 158 (36.5%) |
| Total Housing Units | 1,143 (64.7%) | 623 (35.3%) |
Occupancy by Educational Attainment in Wilmer
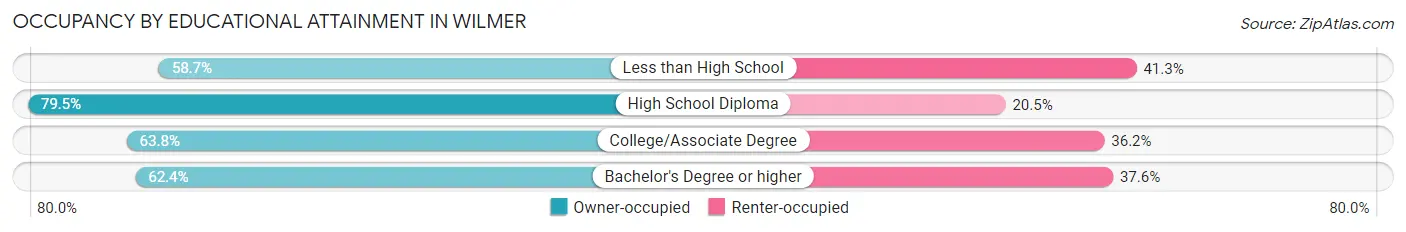
| Household Size | Owner-occupied | Renter-occupied |
| Less than High School | 347 (58.7%) | 244 (41.3%) |
| High School Diploma | 248 (79.5%) | 64 (20.5%) |
| College/Associate Degree | 425 (63.8%) | 241 (36.2%) |
| Bachelor's Degree or higher | 123 (62.4%) | 74 (37.6%) |
Occupancy by Age of Householder in Wilmer
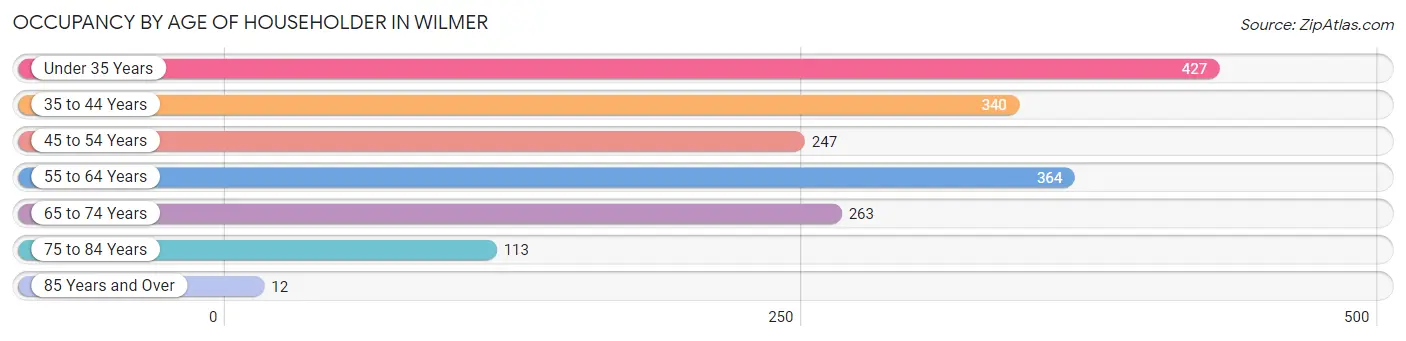
| Age Bracket | # Households | % Households |
| Under 35 Years | 427 | 24.2% |
| 35 to 44 Years | 340 | 19.3% |
| 45 to 54 Years | 247 | 14.0% |
| 55 to 64 Years | 364 | 20.6% |
| 65 to 74 Years | 263 | 14.9% |
| 75 to 84 Years | 113 | 6.4% |
| 85 Years and Over | 12 | 0.7% |
| Total | 1,766 | 100.0% |
Housing Finances in Wilmer
Median Income by Occupancy in Wilmer
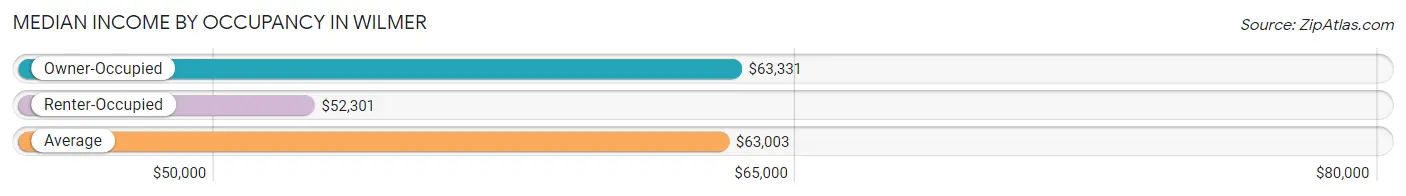
| Occupancy Type | # Households | Median Income |
| Owner-Occupied | 1,143 (64.7%) | $63,331 |
| Renter-Occupied | 623 (35.3%) | $52,301 |
| Average | 1,766 (100.0%) | $63,003 |
Occupancy by Householder Income Bracket in Wilmer
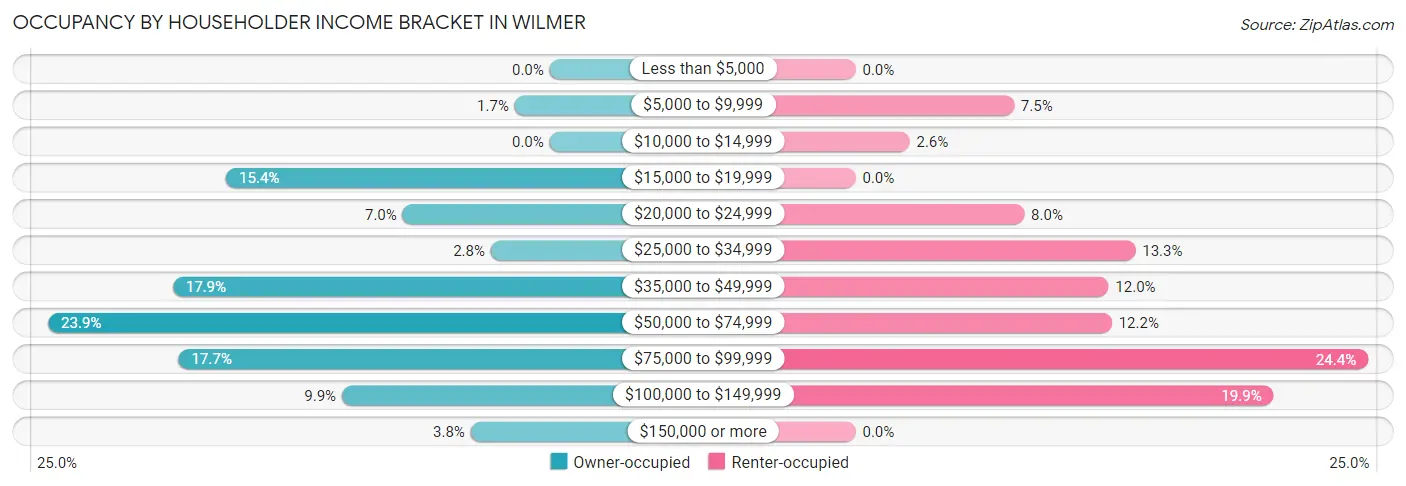
| Income Bracket | Owner-occupied | Renter-occupied |
| Less than $5,000 | 0 (0.0%) | 0 (0.0%) |
| $5,000 to $9,999 | 19 (1.7%) | 47 (7.5%) |
| $10,000 to $14,999 | 0 (0.0%) | 16 (2.6%) |
| $15,000 to $19,999 | 176 (15.4%) | 0 (0.0%) |
| $20,000 to $24,999 | 80 (7.0%) | 50 (8.0%) |
| $25,000 to $34,999 | 32 (2.8%) | 83 (13.3%) |
| $35,000 to $49,999 | 205 (17.9%) | 75 (12.0%) |
| $50,000 to $74,999 | 273 (23.9%) | 76 (12.2%) |
| $75,000 to $99,999 | 202 (17.7%) | 152 (24.4%) |
| $100,000 to $149,999 | 113 (9.9%) | 124 (19.9%) |
| $150,000 or more | 43 (3.8%) | 0 (0.0%) |
| Total | 1,143 (100.0%) | 623 (100.0%) |
Monthly Housing Cost Tiers in Wilmer
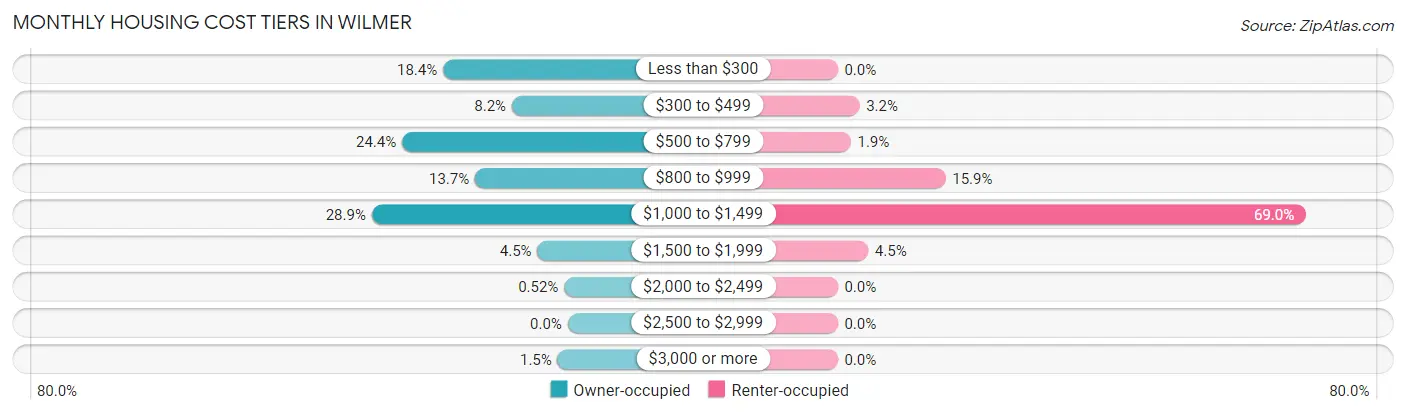
| Monthly Cost | Owner-occupied | Renter-occupied |
| Less than $300 | 210 (18.4%) | 0 (0.0%) |
| $300 to $499 | 94 (8.2%) | 20 (3.2%) |
| $500 to $799 | 279 (24.4%) | 12 (1.9%) |
| $800 to $999 | 156 (13.7%) | 99 (15.9%) |
| $1,000 to $1,499 | 330 (28.9%) | 430 (69.0%) |
| $1,500 to $1,999 | 51 (4.5%) | 28 (4.5%) |
| $2,000 to $2,499 | 6 (0.5%) | 0 (0.0%) |
| $2,500 to $2,999 | 0 (0.0%) | 0 (0.0%) |
| $3,000 or more | 17 (1.5%) | 0 (0.0%) |
| Total | 1,143 (100.0%) | 623 (100.0%) |
Physical Housing Characteristics in Wilmer
Housing Structures in Wilmer
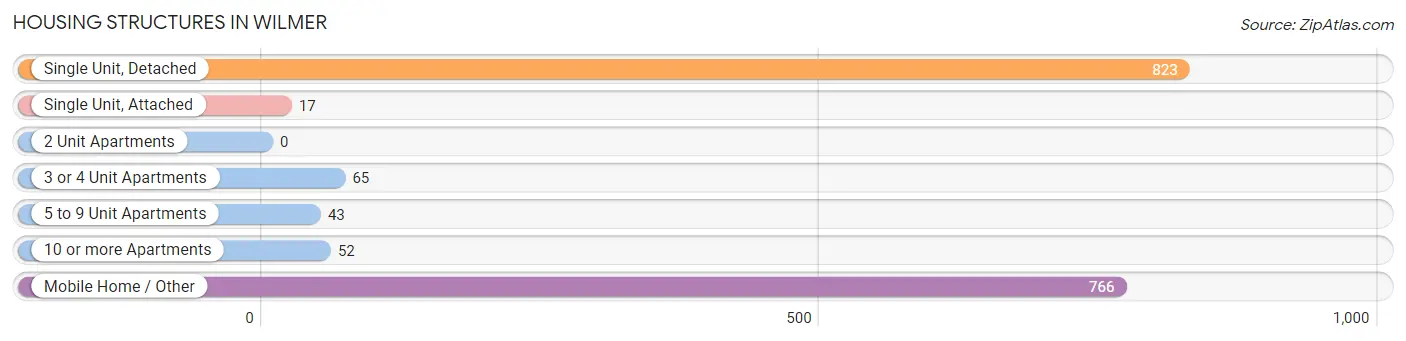
| Structure Type | # Housing Units | % Housing Units |
| Single Unit, Detached | 823 | 46.6% |
| Single Unit, Attached | 17 | 1.0% |
| 2 Unit Apartments | 0 | 0.0% |
| 3 or 4 Unit Apartments | 65 | 3.7% |
| 5 to 9 Unit Apartments | 43 | 2.4% |
| 10 or more Apartments | 52 | 2.9% |
| Mobile Home / Other | 766 | 43.4% |
| Total | 1,766 | 100.0% |
Housing Structures by Occupancy in Wilmer
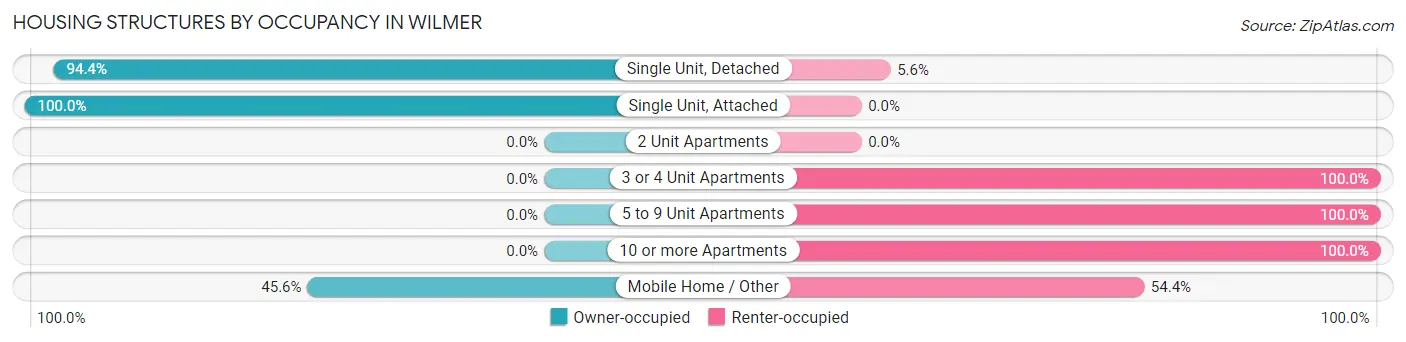
| Structure Type | Owner-occupied | Renter-occupied |
| Single Unit, Detached | 777 (94.4%) | 46 (5.6%) |
| Single Unit, Attached | 17 (100.0%) | 0 (0.0%) |
| 2 Unit Apartments | 0 (0.0%) | 0 (0.0%) |
| 3 or 4 Unit Apartments | 0 (0.0%) | 65 (100.0%) |
| 5 to 9 Unit Apartments | 0 (0.0%) | 43 (100.0%) |
| 10 or more Apartments | 0 (0.0%) | 52 (100.0%) |
| Mobile Home / Other | 349 (45.6%) | 417 (54.4%) |
| Total | 1,143 (64.7%) | 623 (35.3%) |
Housing Structures by Number of Rooms in Wilmer
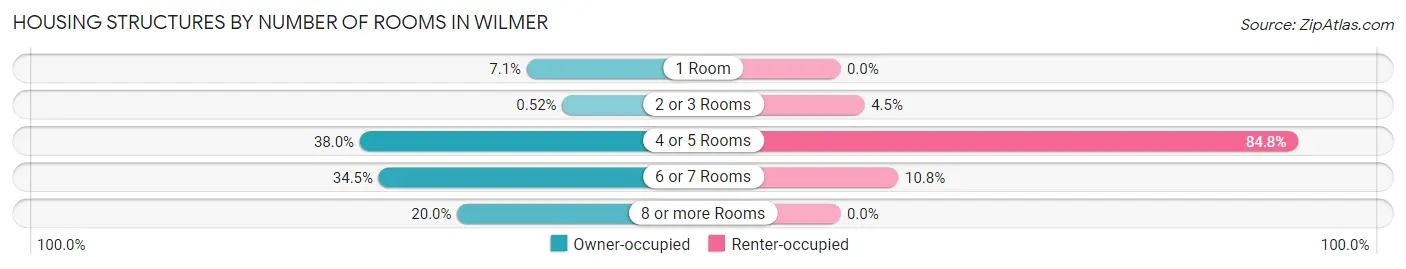
| Number of Rooms | Owner-occupied | Renter-occupied |
| 1 Room | 81 (7.1%) | 0 (0.0%) |
| 2 or 3 Rooms | 6 (0.5%) | 28 (4.5%) |
| 4 or 5 Rooms | 434 (38.0%) | 528 (84.8%) |
| 6 or 7 Rooms | 394 (34.5%) | 67 (10.7%) |
| 8 or more Rooms | 228 (20.0%) | 0 (0.0%) |
| Total | 1,143 (100.0%) | 623 (100.0%) |
Housing Structure by Heating Type in Wilmer
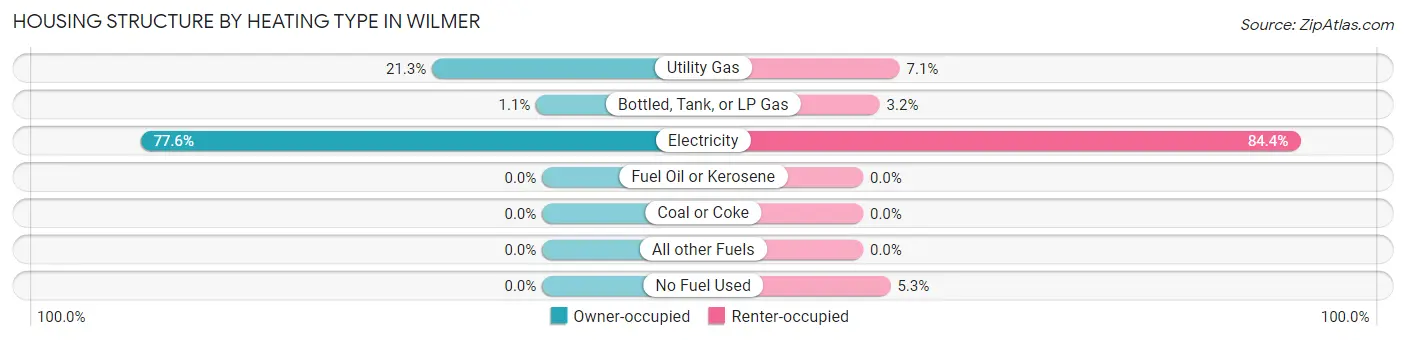
| Heating Type | Owner-occupied | Renter-occupied |
| Utility Gas | 243 (21.3%) | 44 (7.1%) |
| Bottled, Tank, or LP Gas | 13 (1.1%) | 20 (3.2%) |
| Electricity | 887 (77.6%) | 526 (84.4%) |
| Fuel Oil or Kerosene | 0 (0.0%) | 0 (0.0%) |
| Coal or Coke | 0 (0.0%) | 0 (0.0%) |
| All other Fuels | 0 (0.0%) | 0 (0.0%) |
| No Fuel Used | 0 (0.0%) | 33 (5.3%) |
| Total | 1,143 (100.0%) | 623 (100.0%) |
Household Vehicle Usage in Wilmer
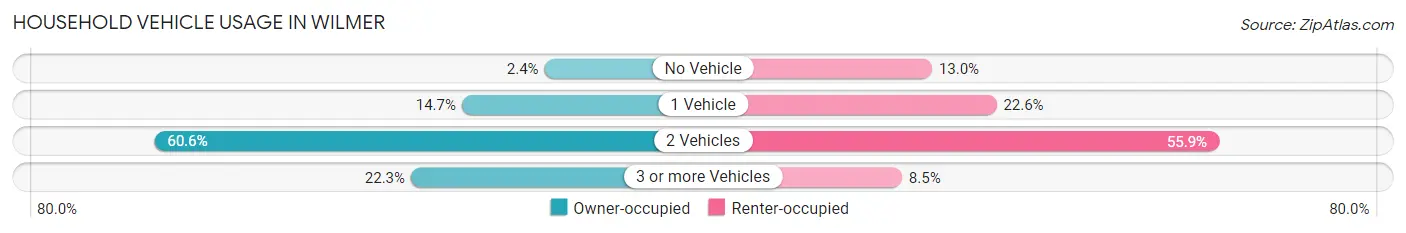
| Vehicles per Household | Owner-occupied | Renter-occupied |
| No Vehicle | 27 (2.4%) | 81 (13.0%) |
| 1 Vehicle | 168 (14.7%) | 141 (22.6%) |
| 2 Vehicles | 693 (60.6%) | 348 (55.9%) |
| 3 or more Vehicles | 255 (22.3%) | 53 (8.5%) |
| Total | 1,143 (100.0%) | 623 (100.0%) |
Real Estate & Mortgages in Wilmer
Real Estate and Mortgage Overview in Wilmer
| Characteristic | Without Mortgage | With Mortgage |
| Housing Units | 627 | 516 |
| Median Property Value | $76,200 | $173,700 |
| Median Household Income | $42,517 | $43 |
| Monthly Housing Costs | $511 | $17 |
| Real Estate Taxes | - | - |
Property Value by Mortgage Status in Wilmer
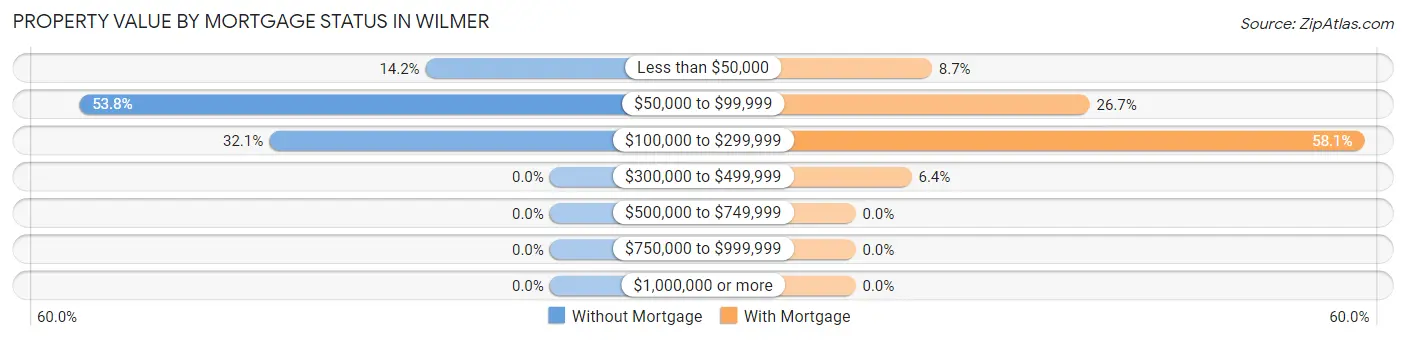
| Property Value | Without Mortgage | With Mortgage |
| Less than $50,000 | 89 (14.2%) | 45 (8.7%) |
| $50,000 to $99,999 | 337 (53.7%) | 138 (26.7%) |
| $100,000 to $299,999 | 201 (32.1%) | 300 (58.1%) |
| $300,000 to $499,999 | 0 (0.0%) | 33 (6.4%) |
| $500,000 to $749,999 | 0 (0.0%) | 0 (0.0%) |
| $750,000 to $999,999 | 0 (0.0%) | 0 (0.0%) |
| $1,000,000 or more | 0 (0.0%) | 0 (0.0%) |
| Total | 627 (100.0%) | 516 (100.0%) |
Household Income by Mortgage Status in Wilmer
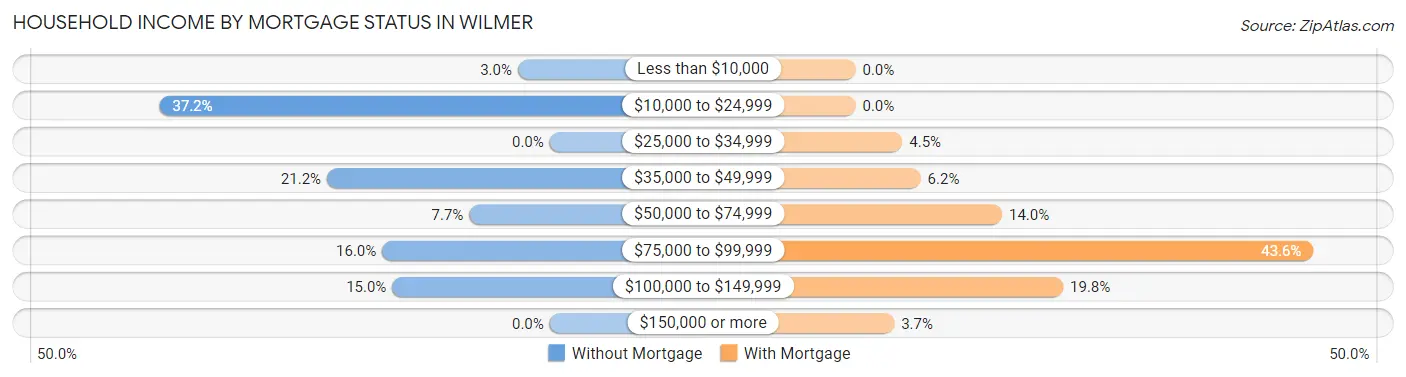
| Household Income | Without Mortgage | With Mortgage |
| Less than $10,000 | 19 (3.0%) | 0 (0.0%) |
| $10,000 to $24,999 | 233 (37.2%) | 0 (0.0%) |
| $25,000 to $34,999 | 0 (0.0%) | 23 (4.5%) |
| $35,000 to $49,999 | 133 (21.2%) | 32 (6.2%) |
| $50,000 to $74,999 | 48 (7.7%) | 72 (14.0%) |
| $75,000 to $99,999 | 100 (16.0%) | 225 (43.6%) |
| $100,000 to $149,999 | 94 (15.0%) | 102 (19.8%) |
| $150,000 or more | 0 (0.0%) | 19 (3.7%) |
| Total | 627 (100.0%) | 516 (100.0%) |
Property Value to Household Income Ratio in Wilmer
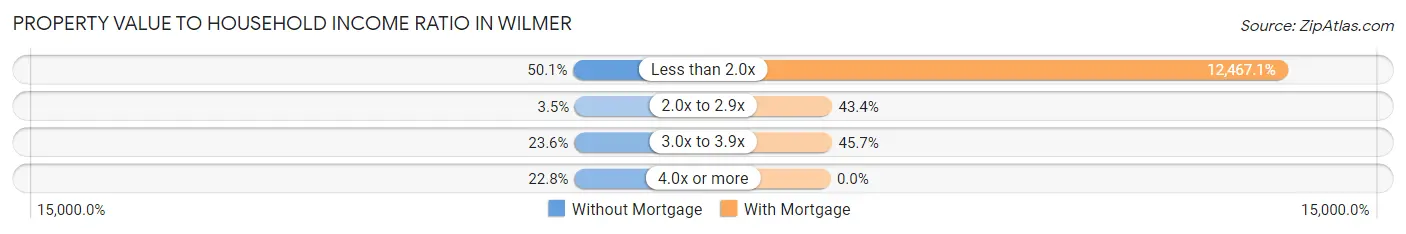
| Value-to-Income Ratio | Without Mortgage | With Mortgage |
| Less than 2.0x | 314 (50.1%) | 64,330 (12,467.1%) |
| 2.0x to 2.9x | 22 (3.5%) | 224 (43.4%) |
| 3.0x to 3.9x | 148 (23.6%) | 236 (45.7%) |
| 4.0x or more | 143 (22.8%) | 0 (0.0%) |
| Total | 627 (100.0%) | 516 (100.0%) |
Real Estate Taxes by Mortgage Status in Wilmer
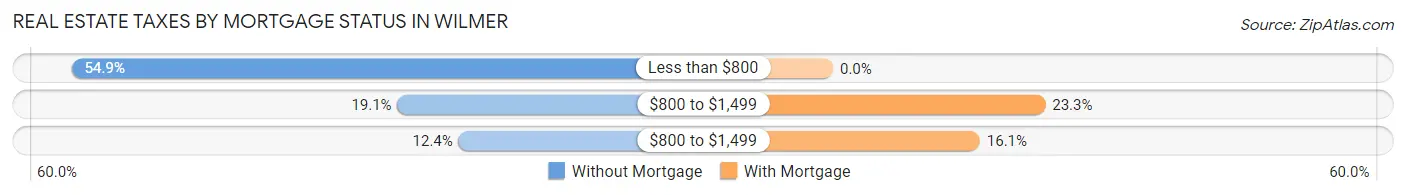
| Property Taxes | Without Mortgage | With Mortgage |
| Less than $800 | 344 (54.9%) | 0 (0.0%) |
| $800 to $1,499 | 120 (19.1%) | 120 (23.3%) |
| $800 to $1,499 | 78 (12.4%) | 83 (16.1%) |
| Total | 627 (100.0%) | 516 (100.0%) |
Health & Disability in Wilmer
Health Insurance Coverage by Age in Wilmer
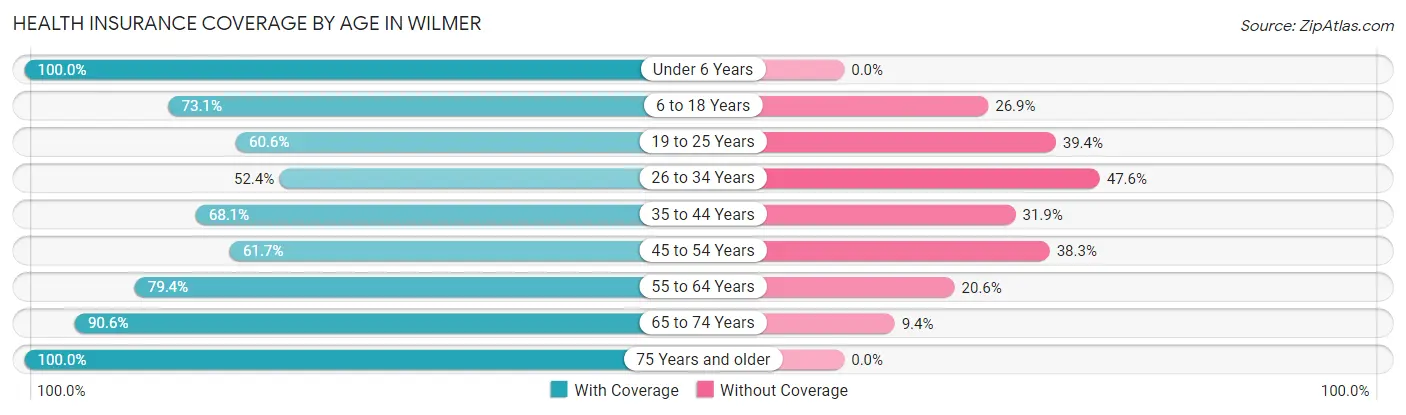
| Age Bracket | With Coverage | Without Coverage |
| Under 6 Years | 581 (100.0%) | 0 (0.0%) |
| 6 to 18 Years | 542 (73.1%) | 199 (26.9%) |
| 19 to 25 Years | 410 (60.6%) | 267 (39.4%) |
| 26 to 34 Years | 310 (52.4%) | 282 (47.6%) |
| 35 to 44 Years | 441 (68.1%) | 207 (31.9%) |
| 45 to 54 Years | 306 (61.7%) | 190 (38.3%) |
| 55 to 64 Years | 533 (79.4%) | 138 (20.6%) |
| 65 to 74 Years | 453 (90.6%) | 47 (9.4%) |
| 75 Years and older | 173 (100.0%) | 0 (0.0%) |
| Total | 3,749 (73.8%) | 1,330 (26.2%) |
Health Insurance Coverage by Citizenship Status in Wilmer
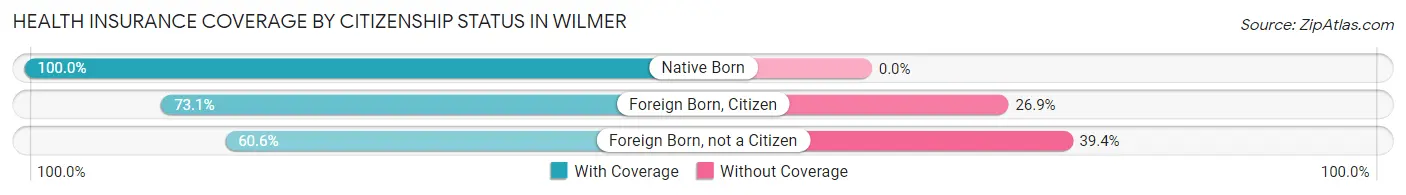
| Citizenship Status | With Coverage | Without Coverage |
| Native Born | 581 (100.0%) | 0 (0.0%) |
| Foreign Born, Citizen | 542 (73.1%) | 199 (26.9%) |
| Foreign Born, not a Citizen | 410 (60.6%) | 267 (39.4%) |
Health Insurance Coverage by Household Income in Wilmer
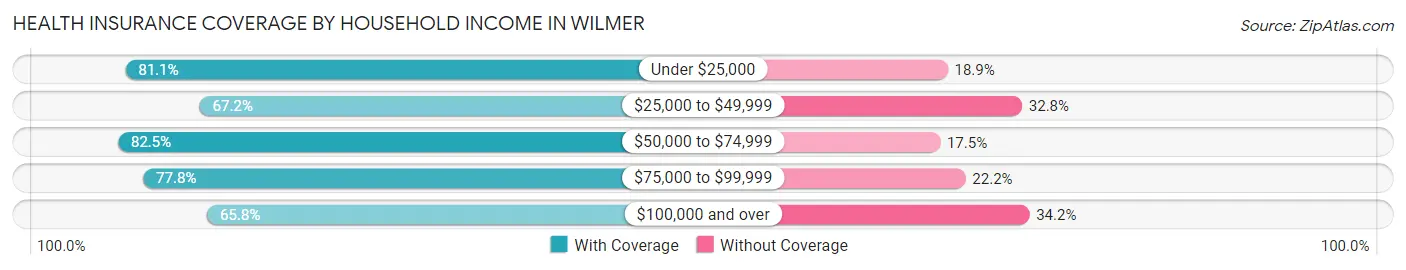
| Household Income | With Coverage | Without Coverage |
| Under $25,000 | 529 (81.1%) | 123 (18.9%) |
| $25,000 to $49,999 | 750 (67.2%) | 366 (32.8%) |
| $50,000 to $74,999 | 785 (82.5%) | 166 (17.5%) |
| $75,000 to $99,999 | 1,092 (77.8%) | 312 (22.2%) |
| $100,000 and over | 593 (65.8%) | 308 (34.2%) |
Public vs Private Health Insurance Coverage by Age in Wilmer
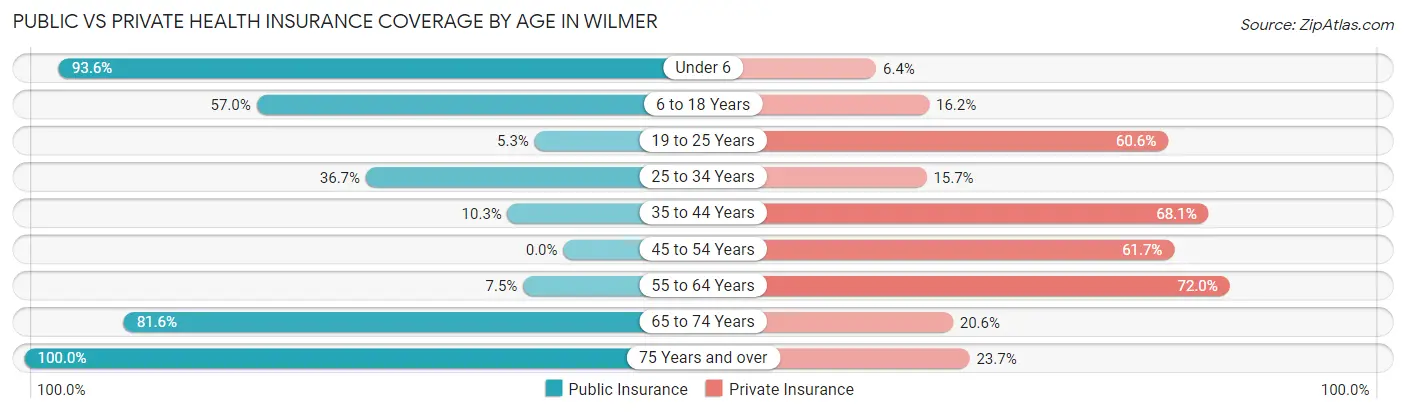
| Age Bracket | Public Insurance | Private Insurance |
| Under 6 | 544 (93.6%) | 37 (6.4%) |
| 6 to 18 Years | 422 (57.0%) | 120 (16.2%) |
| 19 to 25 Years | 36 (5.3%) | 410 (60.6%) |
| 25 to 34 Years | 217 (36.7%) | 93 (15.7%) |
| 35 to 44 Years | 67 (10.3%) | 441 (68.1%) |
| 45 to 54 Years | 0 (0.0%) | 306 (61.7%) |
| 55 to 64 Years | 50 (7.4%) | 483 (72.0%) |
| 65 to 74 Years | 408 (81.6%) | 103 (20.6%) |
| 75 Years and over | 173 (100.0%) | 41 (23.7%) |
| Total | 1,917 (37.7%) | 2,034 (40.1%) |
Disability Status by Sex by Age in Wilmer
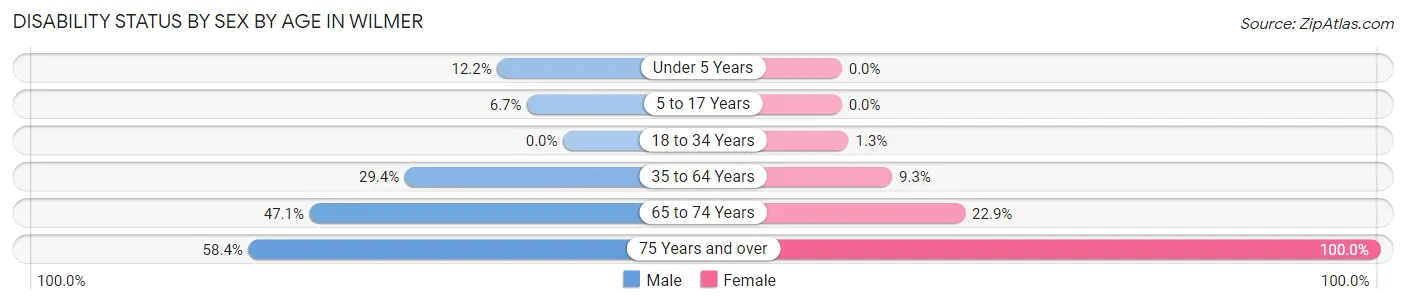
| Age Bracket | Male | Female |
| Under 5 Years | 43 (12.2%) | 0 (0.0%) |
| 5 to 17 Years | 35 (6.7%) | 0 (0.0%) |
| 18 to 34 Years | 0 (0.0%) | 11 (1.3%) |
| 35 to 64 Years | 228 (29.4%) | 97 (9.3%) |
| 65 to 74 Years | 112 (47.1%) | 60 (22.9%) |
| 75 Years and over | 66 (58.4%) | 60 (100.0%) |
Disability Class by Sex by Age in Wilmer
Disability Class: Hearing Difficulty
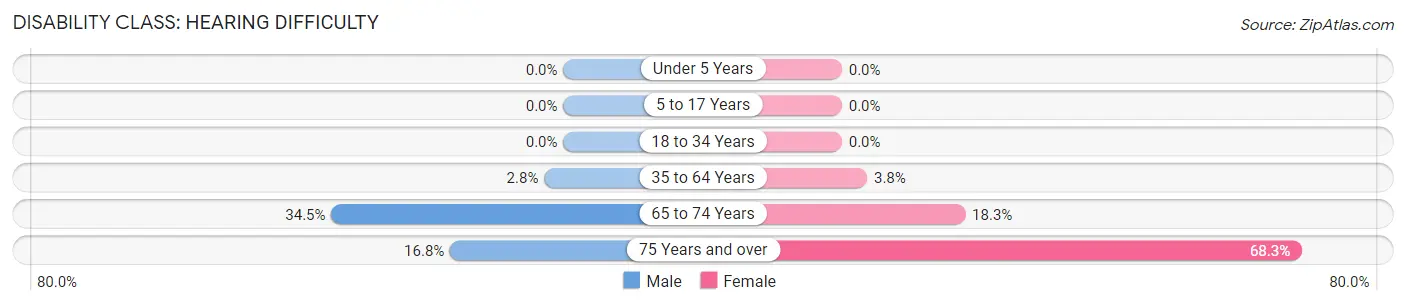
| Age Bracket | Male | Female |
| Under 5 Years | 0 (0.0%) | 0 (0.0%) |
| 5 to 17 Years | 0 (0.0%) | 0 (0.0%) |
| 18 to 34 Years | 0 (0.0%) | 0 (0.0%) |
| 35 to 64 Years | 22 (2.8%) | 39 (3.7%) |
| 65 to 74 Years | 82 (34.4%) | 48 (18.3%) |
| 75 Years and over | 19 (16.8%) | 41 (68.3%) |
Disability Class: Vision Difficulty
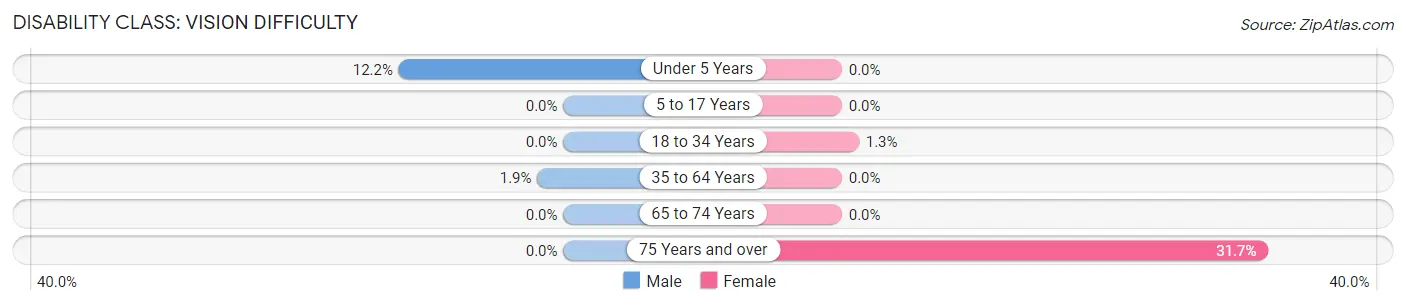
| Age Bracket | Male | Female |
| Under 5 Years | 43 (12.2%) | 0 (0.0%) |
| 5 to 17 Years | 0 (0.0%) | 0 (0.0%) |
| 18 to 34 Years | 0 (0.0%) | 11 (1.3%) |
| 35 to 64 Years | 15 (1.9%) | 0 (0.0%) |
| 65 to 74 Years | 0 (0.0%) | 0 (0.0%) |
| 75 Years and over | 0 (0.0%) | 19 (31.7%) |
Disability Class: Cognitive Difficulty
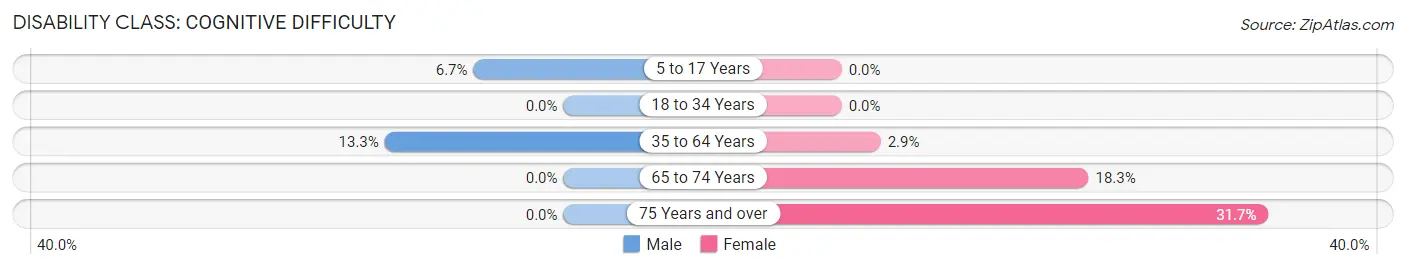
| Age Bracket | Male | Female |
| 5 to 17 Years | 35 (6.7%) | 0 (0.0%) |
| 18 to 34 Years | 0 (0.0%) | 0 (0.0%) |
| 35 to 64 Years | 103 (13.3%) | 30 (2.9%) |
| 65 to 74 Years | 0 (0.0%) | 48 (18.3%) |
| 75 Years and over | 0 (0.0%) | 19 (31.7%) |
Disability Class: Ambulatory Difficulty
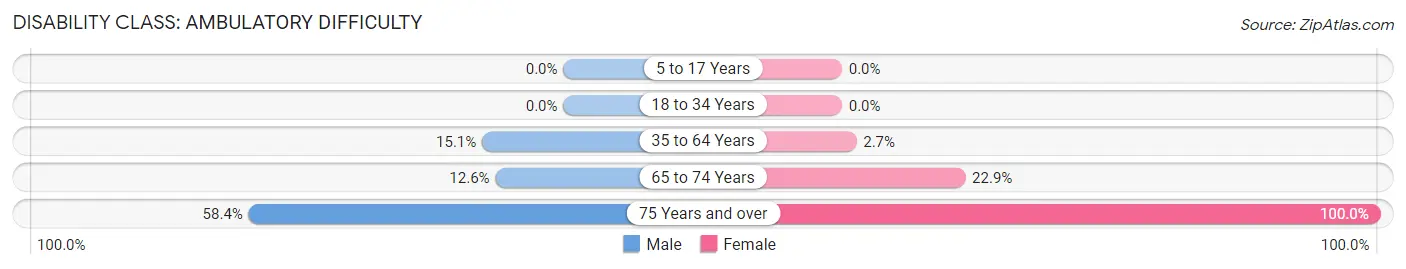
| Age Bracket | Male | Female |
| 5 to 17 Years | 0 (0.0%) | 0 (0.0%) |
| 18 to 34 Years | 0 (0.0%) | 0 (0.0%) |
| 35 to 64 Years | 117 (15.1%) | 28 (2.7%) |
| 65 to 74 Years | 30 (12.6%) | 60 (22.9%) |
| 75 Years and over | 66 (58.4%) | 60 (100.0%) |
Disability Class: Self-Care Difficulty
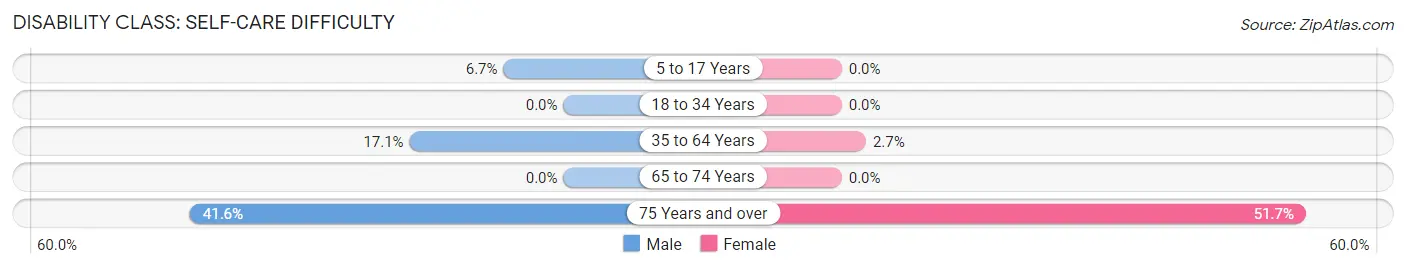
| Age Bracket | Male | Female |
| 5 to 17 Years | 35 (6.7%) | 0 (0.0%) |
| 18 to 34 Years | 0 (0.0%) | 0 (0.0%) |
| 35 to 64 Years | 133 (17.1%) | 28 (2.7%) |
| 65 to 74 Years | 0 (0.0%) | 0 (0.0%) |
| 75 Years and over | 47 (41.6%) | 31 (51.7%) |
Technology Access in Wilmer
Computing Device Access in Wilmer
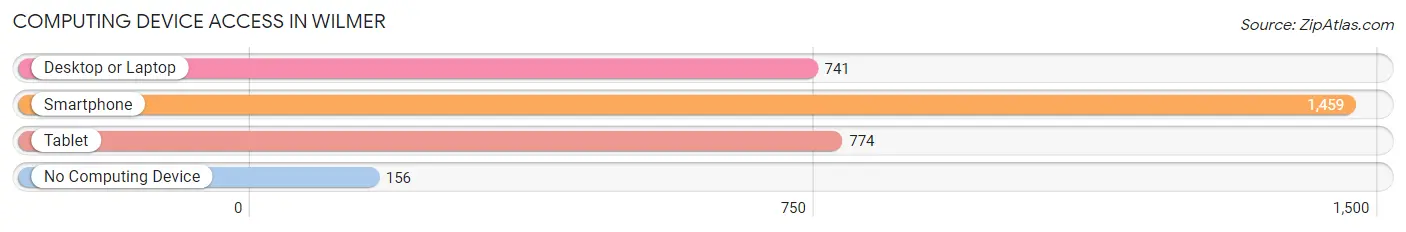
| Device Type | # Households | % Households |
| Desktop or Laptop | 741 | 42.0% |
| Smartphone | 1,459 | 82.6% |
| Tablet | 774 | 43.8% |
| No Computing Device | 156 | 8.8% |
| Total | 1,766 | 100.0% |
Internet Access in Wilmer
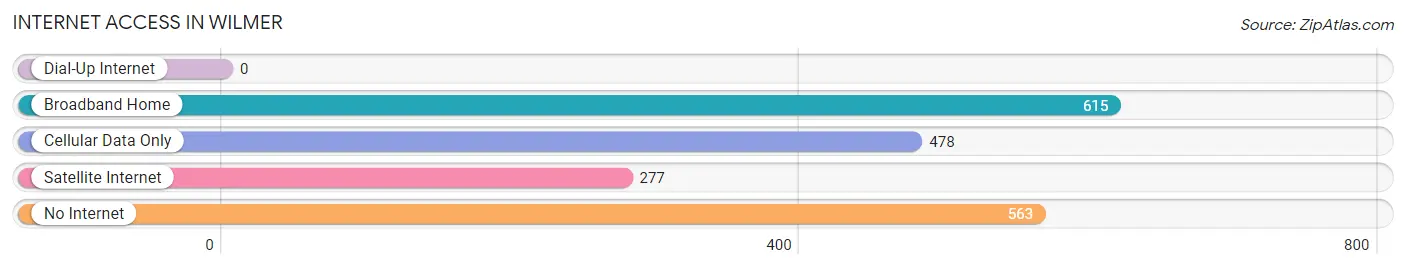
| Internet Type | # Households | % Households |
| Dial-Up Internet | 0 | 0.0% |
| Broadband Home | 615 | 34.8% |
| Cellular Data Only | 478 | 27.1% |
| Satellite Internet | 277 | 15.7% |
| No Internet | 563 | 31.9% |
| Total | 1,766 | 100.0% |
Wilmer Summary
Wilmer is a small city located in Dallas County, Texas. It is part of the Dallas-Fort Worth-Arlington metropolitan area and is situated about 15 miles southeast of downtown Dallas. The city has a population of approximately 5,000 people and covers an area of 2.3 square miles.
History
The area that is now Wilmer was first settled in the late 1800s by German and Czech immigrants. The town was originally known as “Czech Town” and was later renamed Wilmer after a local postmaster. The town was officially incorporated in 1948.
Geography
Wilmer is located in the southeastern part of Dallas County, Texas. It is situated about 15 miles southeast of downtown Dallas and is part of the Dallas-Fort Worth-Arlington metropolitan area. The city covers an area of 2.3 square miles and is bordered by the cities of Hutchins, Lancaster, and Dallas. The terrain is mostly flat with some rolling hills. The climate is humid subtropical with hot summers and mild winters.
Economy
The economy of Wilmer is largely based on agriculture and manufacturing. The city is home to several large industrial plants, including a steel mill and a paper mill. The city also has a number of small businesses, including restaurants, retail stores, and service providers.
Demographics
As of the 2010 census, the population of Wilmer was 5,000. The racial makeup of the city was 75.3% White, 17.2% African American, 0.7% Native American, 0.3% Asian, and 6.5% from other races. The median household income was $37,000 and the median family income was $45,000. The per capita income was $17,000.
Wilmer is a small city with a rich history and a diverse population. It is home to a number of businesses and industries and is part of the Dallas-Fort Worth-Arlington metropolitan area. The city has a population of approximately 5,000 people and covers an area of 2.3 square miles. The economy is largely based on agriculture and manufacturing, and the city is home to several large industrial plants. The racial makeup of the city is mostly White, with a significant African American population. The median household income is $37,000 and the median family income is $45,000.
Common Questions
What is Per Capita Income in Wilmer?
Per Capita income in Wilmer is $22,714.
What is the Median Family Income in Wilmer?
Median Family Income in Wilmer is $65,037.
What is the Median Household income in Wilmer?
Median Household Income in Wilmer is $63,003.
What is Income or Wage Gap in Wilmer?
Income or Wage Gap in Wilmer is 35.0%.
Women in Wilmer earn 65.0 cents for every dollar earned by a man.
What is Inequality or Gini Index in Wilmer?
Inequality or Gini Index in Wilmer is 0.37.
What is the Total Population of Wilmer?
Total Population of Wilmer is 5,370.
What is the Total Male Population of Wilmer?
Total Male Population of Wilmer is 2,588.
What is the Total Female Population of Wilmer?
Total Female Population of Wilmer is 2,782.
What is the Ratio of Males per 100 Females in Wilmer?
There are 93.03 Males per 100 Females in Wilmer.
What is the Ratio of Females per 100 Males in Wilmer?
There are 107.50 Females per 100 Males in Wilmer.
What is the Median Population Age in Wilmer?
Median Population Age in Wilmer is 34.8 Years.
What is the Average Family Size in Wilmer
Average Family Size in Wilmer is 3.1 People.
What is the Average Household Size in Wilmer
Average Household Size in Wilmer is 2.8 People.
How Large is the Labor Force in Wilmer?
There are 2,653 People in the Labor Forcein in Wilmer.
What is the Percentage of People in the Labor Force in Wilmer?
63.8% of People are in the Labor Force in Wilmer.
What is the Unemployment Rate in Wilmer?
Unemployment Rate in Wilmer is 6.3%.