Murillo, TX Map & Demographics
Murillo Map
Murillo Overview
$22,985
PER CAPITA INCOME
$76,165
AVG FAMILY INCOME
$68,739
AVG HOUSEHOLD INCOME
20.2%
WAGE / INCOME GAP [ % ]
79.8¢/ $1
WAGE / INCOME GAP [ $ ]
0.44
INEQUALITY / GINI INDEX
8,744
TOTAL POPULATION
4,351
MALE POPULATION
4,393
FEMALE POPULATION
99.04
MALES / 100 FEMALES
100.97
FEMALES / 100 MALES
24.5
MEDIAN AGE
4.0
AVG FAMILY SIZE
3.8
AVG HOUSEHOLD SIZE
4,056
LABOR FORCE [ PEOPLE ]
68.4%
PERCENT IN LABOR FORCE
7.4%
UNEMPLOYMENT RATE
Income in Murillo
Income Overview in Murillo
Per Capita Income in Murillo is $22,985, while median incomes of families and households are $76,165 and $68,739 respectively.
| Characteristic | Number | Measure |
| Per Capita Income | 8,744 | $22,985 |
| Median Family Income | 1,989 | $76,165 |
| Mean Family Income | 1,989 | $89,024 |
| Median Household Income | 2,328 | $68,739 |
| Mean Household Income | 2,328 | $83,576 |
| Income Deficit | 1,989 | $0 |
| Wage / Income Gap (%) | 8,744 | 20.15% |
| Wage / Income Gap ($) | 8,744 | 79.85¢ per $1 |
| Gini / Inequality Index | 8,744 | 0.44 |
Earnings by Sex in Murillo
Average Earnings in Murillo are $29,259, $32,124 for men and $25,650 for women, a difference of 20.2%.
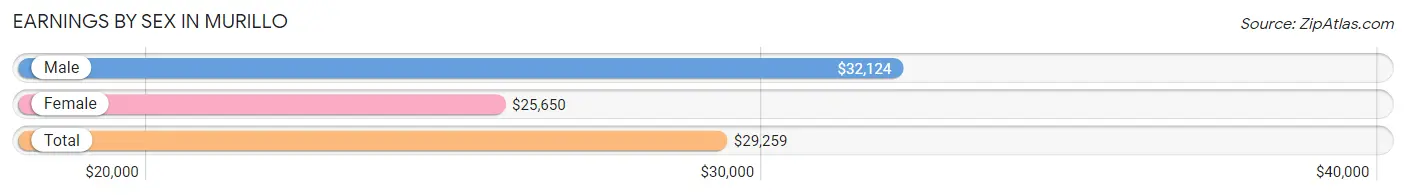
| Sex | Number | Average Earnings |
| Male | 2,391 (56.7%) | $32,124 |
| Female | 1,824 (43.3%) | $25,650 |
| Total | 4,215 (100.0%) | $29,259 |
Earnings by Sex by Income Bracket in Murillo
The most common earnings brackets in Murillo are $25,000 to $29,999 for men (292 | 12.2%) and $17,500 to $19,999 for women (327 | 17.9%).
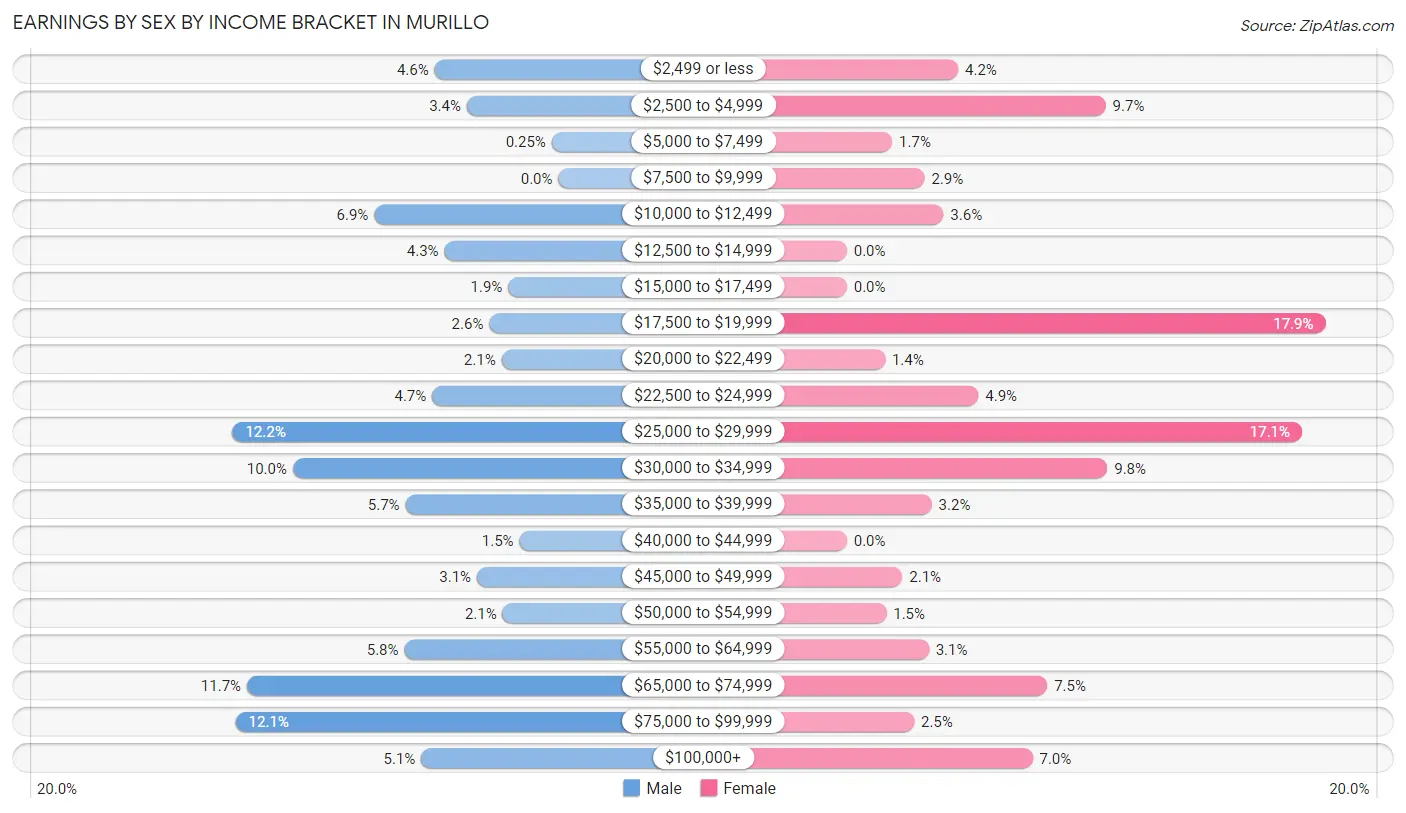
| Income | Male | Female |
| $2,499 or less | 111 (4.6%) | 76 (4.2%) |
| $2,500 to $4,999 | 82 (3.4%) | 177 (9.7%) |
| $5,000 to $7,499 | 6 (0.3%) | 31 (1.7%) |
| $7,500 to $9,999 | 0 (0.0%) | 53 (2.9%) |
| $10,000 to $12,499 | 165 (6.9%) | 66 (3.6%) |
| $12,500 to $14,999 | 102 (4.3%) | 0 (0.0%) |
| $15,000 to $17,499 | 45 (1.9%) | 0 (0.0%) |
| $17,500 to $19,999 | 62 (2.6%) | 327 (17.9%) |
| $20,000 to $22,499 | 51 (2.1%) | 26 (1.4%) |
| $22,500 to $24,999 | 113 (4.7%) | 90 (4.9%) |
| $25,000 to $29,999 | 292 (12.2%) | 311 (17.1%) |
| $30,000 to $34,999 | 238 (10.0%) | 178 (9.8%) |
| $35,000 to $39,999 | 137 (5.7%) | 58 (3.2%) |
| $40,000 to $44,999 | 35 (1.5%) | 0 (0.0%) |
| $45,000 to $49,999 | 73 (3.0%) | 38 (2.1%) |
| $50,000 to $54,999 | 50 (2.1%) | 27 (1.5%) |
| $55,000 to $64,999 | 138 (5.8%) | 56 (3.1%) |
| $65,000 to $74,999 | 279 (11.7%) | 137 (7.5%) |
| $75,000 to $99,999 | 289 (12.1%) | 46 (2.5%) |
| $100,000+ | 123 (5.1%) | 127 (7.0%) |
| Total | 2,391 (100.0%) | 1,824 (100.0%) |
Earnings by Sex by Educational Attainment in Murillo
Average earnings in Murillo are $35,063 for men and $26,324 for women, a difference of 24.9%. Men with an educational attainment of bachelor's degree enjoy the highest average annual earnings of $102,639, while those with less than high school education earn the least with $27,217. Women with an educational attainment of graduate degree earn the most with the average annual earnings of $87,639, while those with less than high school education have the smallest earnings of $24,301.
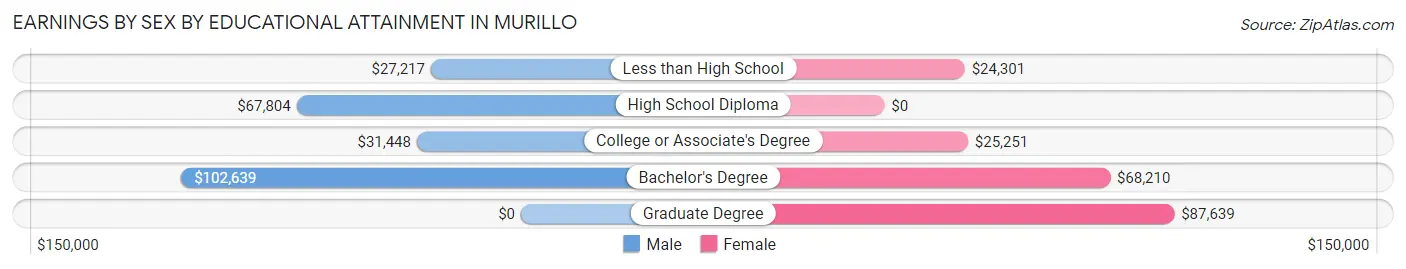
| Educational Attainment | Male Income | Female Income |
| Less than High School | $27,217 | $24,301 |
| High School Diploma | $67,804 | $0 |
| College or Associate's Degree | $31,448 | $25,251 |
| Bachelor's Degree | $102,639 | $68,210 |
| Graduate Degree | - | - |
| Total | $35,063 | $26,324 |
Family Income in Murillo
Family Income Brackets in Murillo
According to the Murillo family income data, there are 505 families falling into the $100,000 to $149,999 income range, which is the most common income bracket and makes up 25.4% of all families. Conversely, the $200,000+ income bracket is the least frequent group with only 34 families (1.7%) belonging to this category.
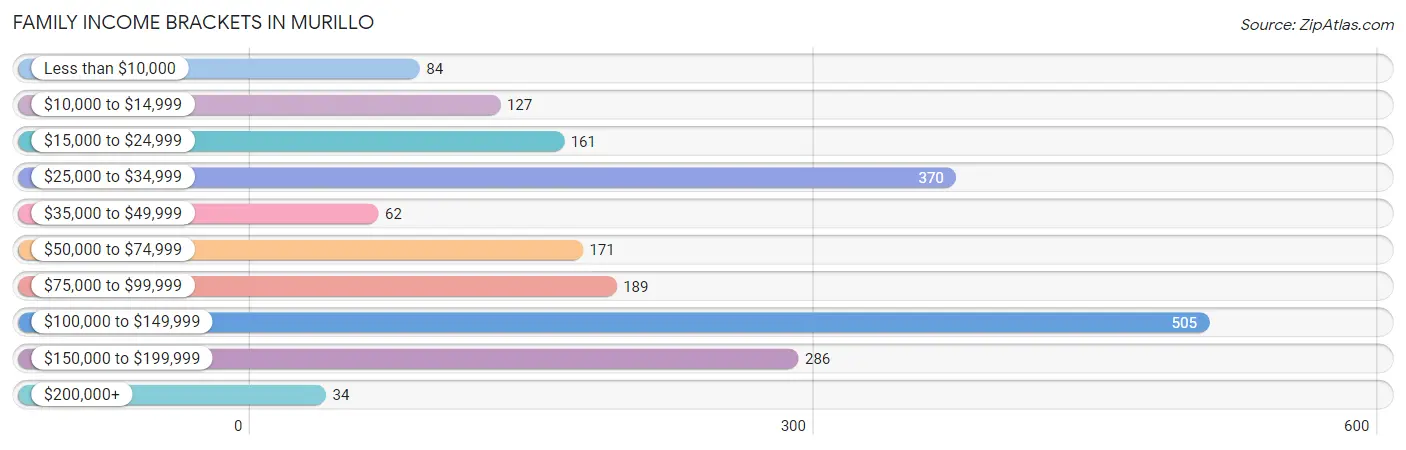
| Income Bracket | # Families | % Families |
| Less than $10,000 | 84 | 4.2% |
| $10,000 to $14,999 | 127 | 6.4% |
| $15,000 to $24,999 | 161 | 8.1% |
| $25,000 to $34,999 | 370 | 18.6% |
| $35,000 to $49,999 | 62 | 3.1% |
| $50,000 to $74,999 | 171 | 8.6% |
| $75,000 to $99,999 | 189 | 9.5% |
| $100,000 to $149,999 | 505 | 25.4% |
| $150,000 to $199,999 | 286 | 14.4% |
| $200,000+ | 34 | 1.7% |
Family Income by Famaliy Size in Murillo
4-person families (578 | 29.1%) account for the highest median family income in Murillo with $115,625 per family, while 4-person families (578 | 29.1%) have the highest median income of $28,906 per family member.
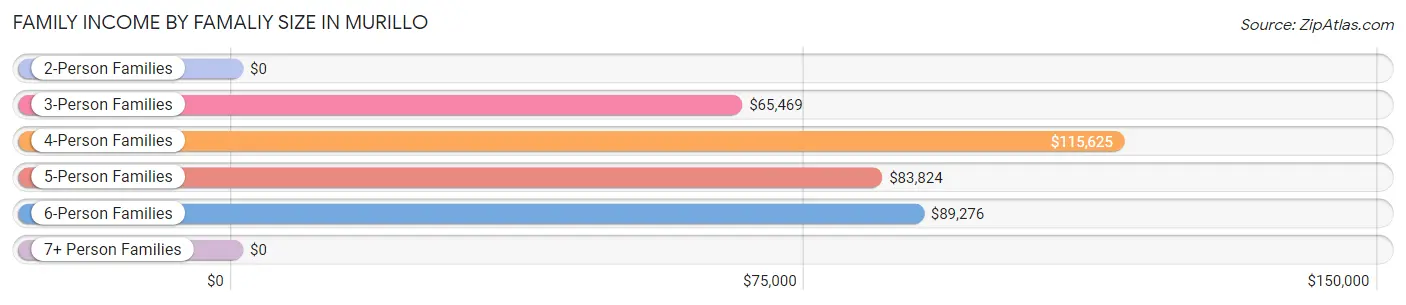
| Income Bracket | # Families | Median Income |
| 2-Person Families | 513 (25.8%) | $0 |
| 3-Person Families | 300 (15.1%) | $65,469 |
| 4-Person Families | 578 (29.1%) | $115,625 |
| 5-Person Families | 409 (20.6%) | $83,824 |
| 6-Person Families | 103 (5.2%) | $89,276 |
| 7+ Person Families | 86 (4.3%) | $0 |
| Total | 1,989 (100.0%) | $76,165 |
Family Income by Number of Earners in Murillo
The median family income in Murillo is $76,165, with families comprising 3+ earners (409) having the highest median family income of $130,772, while families with 1 earner (766) have the lowest median family income of $29,672, accounting for 20.6% and 38.5% of families, respectively.
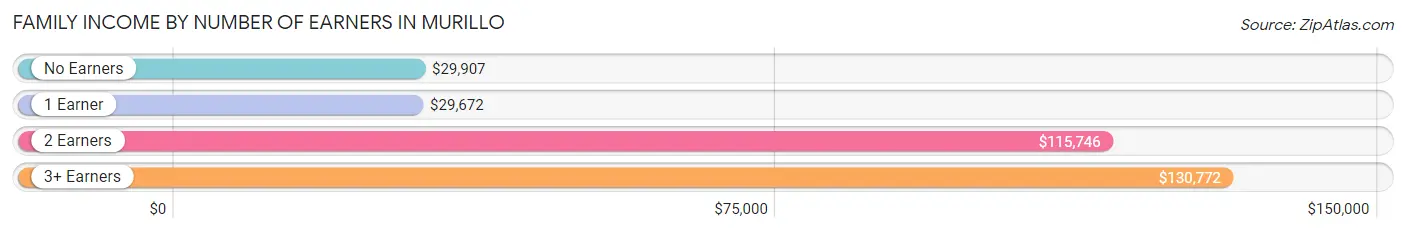
| Number of Earners | # Families | Median Income |
| No Earners | 140 (7.0%) | $29,907 |
| 1 Earner | 766 (38.5%) | $29,672 |
| 2 Earners | 674 (33.9%) | $115,746 |
| 3+ Earners | 409 (20.6%) | $130,772 |
| Total | 1,989 (100.0%) | $76,165 |
Household Income in Murillo
Household Income Brackets in Murillo
With 505 households falling in the category, the $100,000 to $149,999 income range is the most frequent in Murillo, accounting for 21.7% of all households. In contrast, only 35 households (1.5%) fall into the $200,000+ income bracket, making it the least populous group.
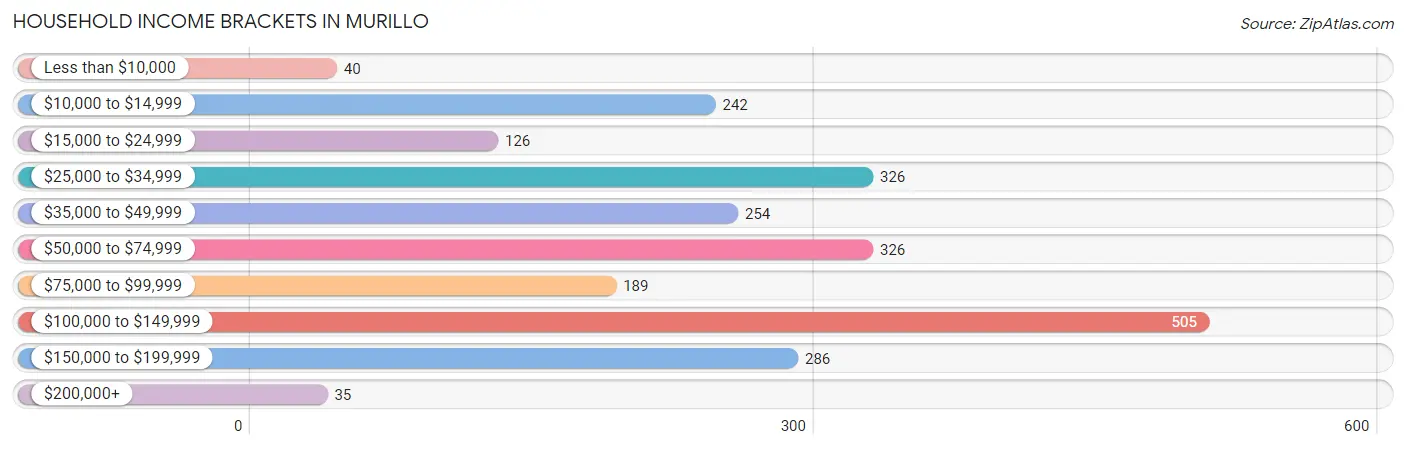
| Income Bracket | # Households | % Households |
| Less than $10,000 | 40 | 1.7% |
| $10,000 to $14,999 | 242 | 10.4% |
| $15,000 to $24,999 | 126 | 5.4% |
| $25,000 to $34,999 | 326 | 14.0% |
| $35,000 to $49,999 | 254 | 10.9% |
| $50,000 to $74,999 | 326 | 14.0% |
| $75,000 to $99,999 | 189 | 8.1% |
| $100,000 to $149,999 | 505 | 21.7% |
| $150,000 to $199,999 | 286 | 12.3% |
| $200,000+ | 35 | 1.5% |
Household Income by Householder Age in Murillo
The median household income in Murillo is $68,739, with the highest median household income of $82,677 found in the 45 to 64 years age bracket for the primary householder. A total of 803 households (34.5%) fall into this category. Meanwhile, the 15 to 24 years age bracket for the primary householder has the lowest median household income of $0, with 191 households (8.2%) in this group.
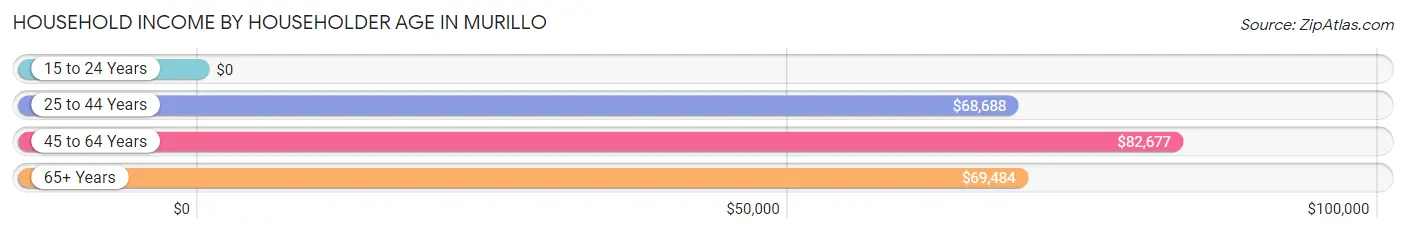
| Income Bracket | # Households | Median Income |
| 15 to 24 Years | 191 (8.2%) | $0 |
| 25 to 44 Years | 1,065 (45.8%) | $68,688 |
| 45 to 64 Years | 803 (34.5%) | $82,677 |
| 65+ Years | 269 (11.6%) | $69,484 |
| Total | 2,328 (100.0%) | $68,739 |
Poverty in Murillo
Income Below Poverty by Sex and Age in Murillo
With 22.3% poverty level for males and 32.5% for females among the residents of Murillo, 5 year old males and 16 and 17 year old females are the most vulnerable to poverty, with 46 males (95.8%) and 190 females (59.0%) in their respective age groups living below the poverty level.
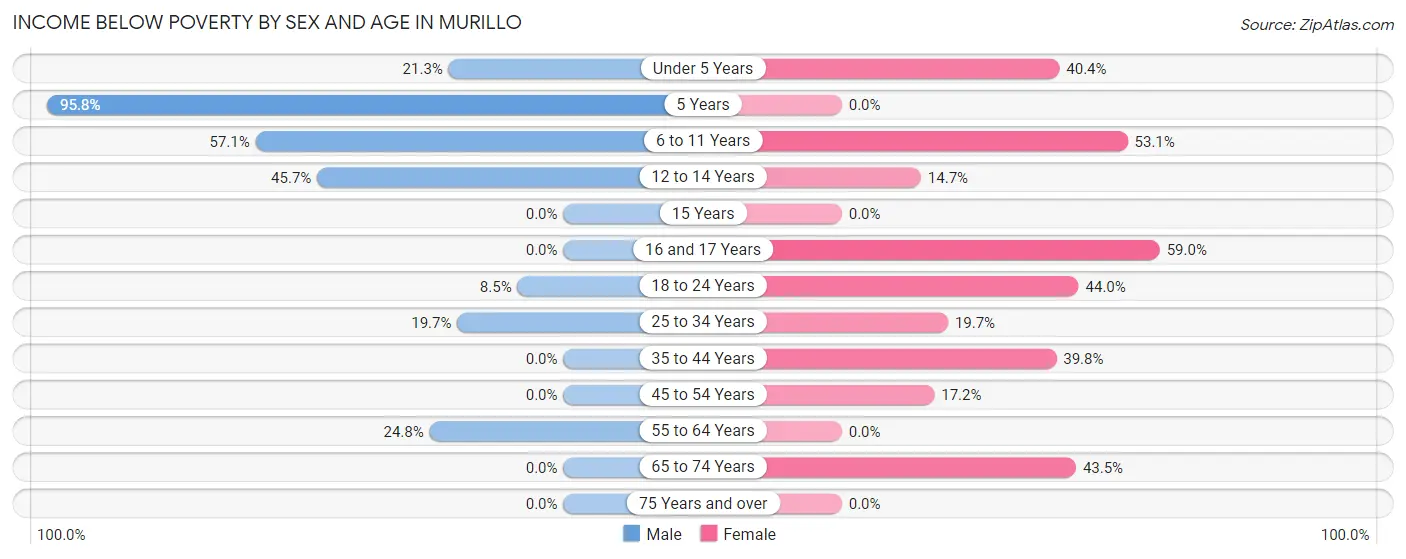
| Age Bracket | Male | Female |
| Under 5 Years | 79 (21.3%) | 168 (40.4%) |
| 5 Years | 46 (95.8%) | 0 (0.0%) |
| 6 to 11 Years | 296 (57.1%) | 261 (53.0%) |
| 12 to 14 Years | 207 (45.7%) | 43 (14.7%) |
| 15 Years | 0 (0.0%) | 0 (0.0%) |
| 16 and 17 Years | 0 (0.0%) | 190 (59.0%) |
| 18 to 24 Years | 65 (8.5%) | 222 (44.0%) |
| 25 to 34 Years | 205 (19.7%) | 120 (19.7%) |
| 35 to 44 Years | 0 (0.0%) | 176 (39.8%) |
| 45 to 54 Years | 0 (0.0%) | 107 (17.2%) |
| 55 to 64 Years | 72 (24.8%) | 0 (0.0%) |
| 65 to 74 Years | 0 (0.0%) | 113 (43.5%) |
| 75 Years and over | 0 (0.0%) | 0 (0.0%) |
| Total | 970 (22.3%) | 1,400 (32.5%) |
Income Above Poverty by Sex and Age in Murillo
According to the poverty statistics in Murillo, males aged 16 and 17 years and females aged 5 years are the age groups that are most secure financially, with 100.0% of males and 100.0% of females in these age groups living above the poverty line.
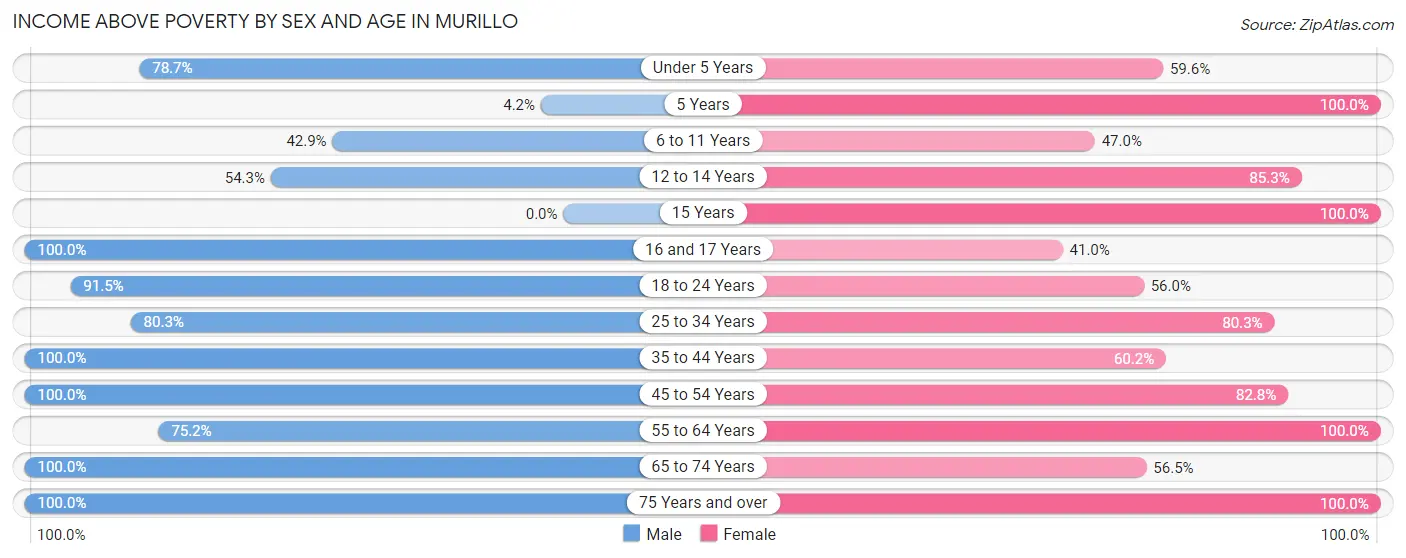
| Age Bracket | Male | Female |
| Under 5 Years | 292 (78.7%) | 248 (59.6%) |
| 5 Years | 2 (4.2%) | 63 (100.0%) |
| 6 to 11 Years | 222 (42.9%) | 231 (46.9%) |
| 12 to 14 Years | 246 (54.3%) | 250 (85.3%) |
| 15 Years | 0 (0.0%) | 80 (100.0%) |
| 16 and 17 Years | 91 (100.0%) | 132 (41.0%) |
| 18 to 24 Years | 699 (91.5%) | 283 (56.0%) |
| 25 to 34 Years | 836 (80.3%) | 489 (80.3%) |
| 35 to 44 Years | 322 (100.0%) | 266 (60.2%) |
| 45 to 54 Years | 356 (100.0%) | 516 (82.8%) |
| 55 to 64 Years | 218 (75.2%) | 139 (100.0%) |
| 65 to 74 Years | 45 (100.0%) | 147 (56.5%) |
| 75 Years and over | 52 (100.0%) | 69 (100.0%) |
| Total | 3,381 (77.7%) | 2,913 (67.5%) |
Income Below Poverty Among Married-Couple Families in Murillo
The poverty statistics for married-couple families in Murillo show that 12.7% or 124 of the total 980 families live below the poverty line. Families with 1 or 2 children have the highest poverty rate of 16.6%, comprising of 67 families. On the other hand, families with 3 or 4 children have the lowest poverty rate of 0.0%, which includes 0 families.
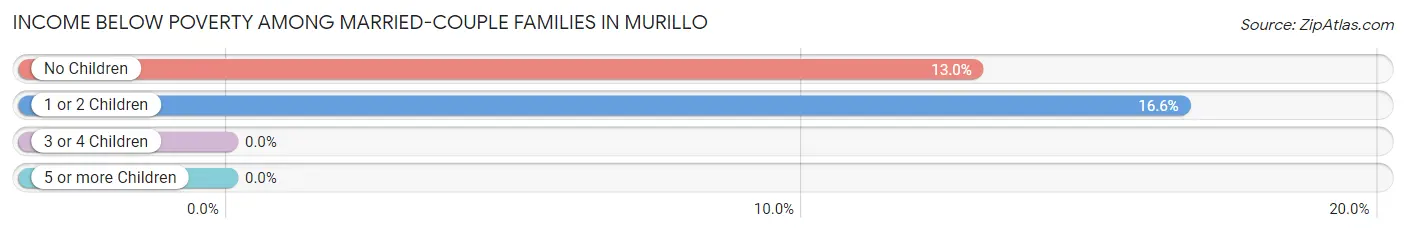
| Children | Above Poverty | Below Poverty |
| No Children | 382 (87.0%) | 57 (13.0%) |
| 1 or 2 Children | 337 (83.4%) | 67 (16.6%) |
| 3 or 4 Children | 137 (100.0%) | 0 (0.0%) |
| 5 or more Children | 0 (0.0%) | 0 (0.0%) |
| Total | 856 (87.4%) | 124 (12.7%) |
Income Below Poverty Among Single-Parent Households in Murillo
According to the poverty data in Murillo, 23.4% or 70 single-father households and 37.0% or 263 single-mother households are living below the poverty line. Among single-father households, those with no children have the highest poverty rate, with 70 households (46.4%) experiencing poverty. Likewise, among single-mother households, those with 5 or more children have the highest poverty rate, with 72 households (100.0%) falling below the poverty line.
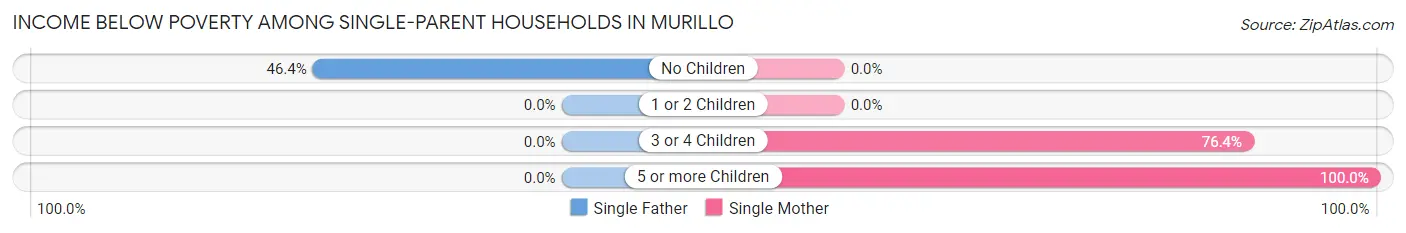
| Children | Single Father | Single Mother |
| No Children | 70 (46.4%) | 0 (0.0%) |
| 1 or 2 Children | 0 (0.0%) | 0 (0.0%) |
| 3 or 4 Children | 0 (0.0%) | 191 (76.4%) |
| 5 or more Children | 0 (0.0%) | 72 (100.0%) |
| Total | 70 (23.4%) | 263 (37.0%) |
Income Below Poverty Among Married-Couple vs Single-Parent Households in Murillo
The poverty data for Murillo shows that 124 of the married-couple family households (12.7%) and 333 of the single-parent households (33.0%) are living below the poverty level. Within the married-couple family households, those with 1 or 2 children have the highest poverty rate, with 67 households (16.6%) falling below the poverty line. Among the single-parent households, those with 5 or more children have the highest poverty rate, with 72 household (100.0%) living below poverty.
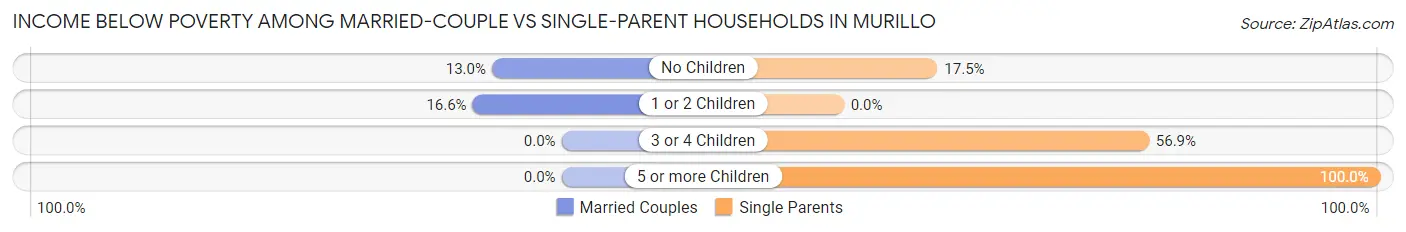
| Children | Married-Couple Families | Single-Parent Households |
| No Children | 57 (13.0%) | 70 (17.5%) |
| 1 or 2 Children | 67 (16.6%) | 0 (0.0%) |
| 3 or 4 Children | 0 (0.0%) | 191 (56.9%) |
| 5 or more Children | 0 (0.0%) | 72 (100.0%) |
| Total | 124 (12.7%) | 333 (33.0%) |
Race in Murillo
The most populous races in Murillo are Hispanic or Latino (8,595 | 98.3%), White / Caucasian (4,486 | 51.3%), and Two or more Races (4,144 | 47.4%).
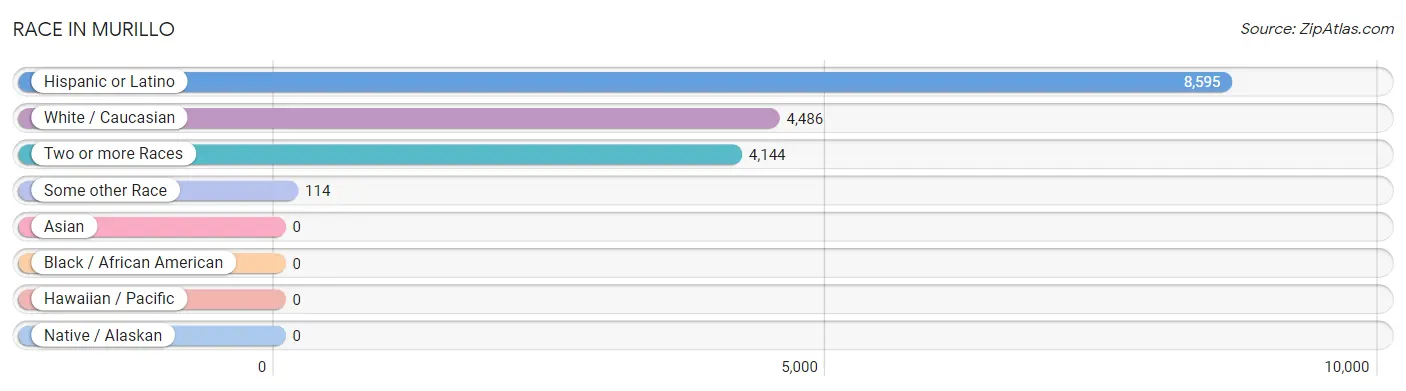
| Race | # Population | % Population |
| Asian | 0 | 0.0% |
| Black / African American | 0 | 0.0% |
| Hawaiian / Pacific | 0 | 0.0% |
| Hispanic or Latino | 8,595 | 98.3% |
| Native / Alaskan | 0 | 0.0% |
| White / Caucasian | 4,486 | 51.3% |
| Two or more Races | 4,144 | 47.4% |
| Some other Race | 114 | 1.3% |
| Total | 8,744 | 100.0% |
Ancestry in Murillo
The most populous ancestries reported in Murillo are Mexican (8,386 | 95.9%), American (234 | 2.7%), Italian (17 | 0.2%), Puerto Rican (17 | 0.2%), and Greek (16 | 0.2%), together accounting for 99.2% of all Murillo residents.
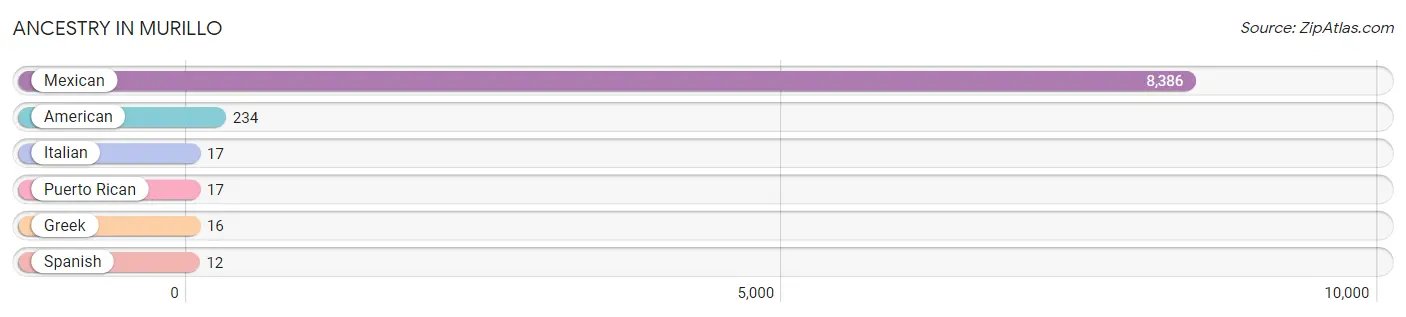
| Ancestry | # Population | % Population |
| American | 234 | 2.7% |
| Greek | 16 | 0.2% |
| Italian | 17 | 0.2% |
| Mexican | 8,386 | 95.9% |
| Puerto Rican | 17 | 0.2% |
| Spanish | 12 | 0.1% | View All 6 Rows |
Immigrants in Murillo
The most numerous immigrant groups reported in Murillo came from Central America (1,559 | 17.8%), Latin America (1,559 | 17.8%), and Mexico (1,559 | 17.8%), together accounting for 53.5% of all Murillo residents.
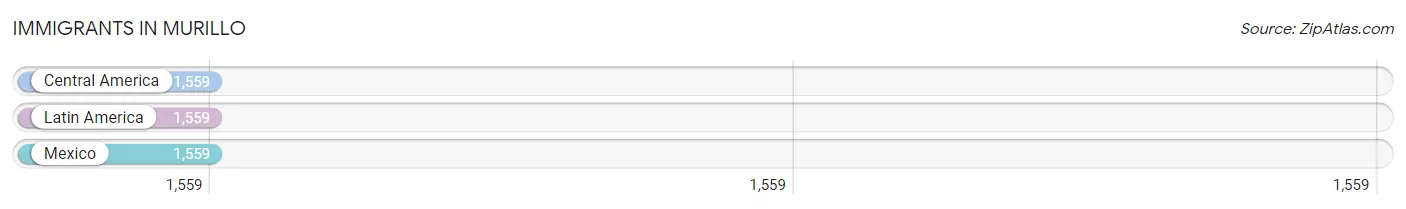
| Immigration Origin | # Population | % Population |
| Central America | 1,559 | 17.8% |
| Latin America | 1,559 | 17.8% |
| Mexico | 1,559 | 17.8% | View All 3 Rows |
Sex and Age in Murillo
Sex and Age in Murillo
The most populous age groups in Murillo are 10 to 14 Years (807 | 18.5%) for men and 5 to 9 Years (531 | 12.1%) for women.
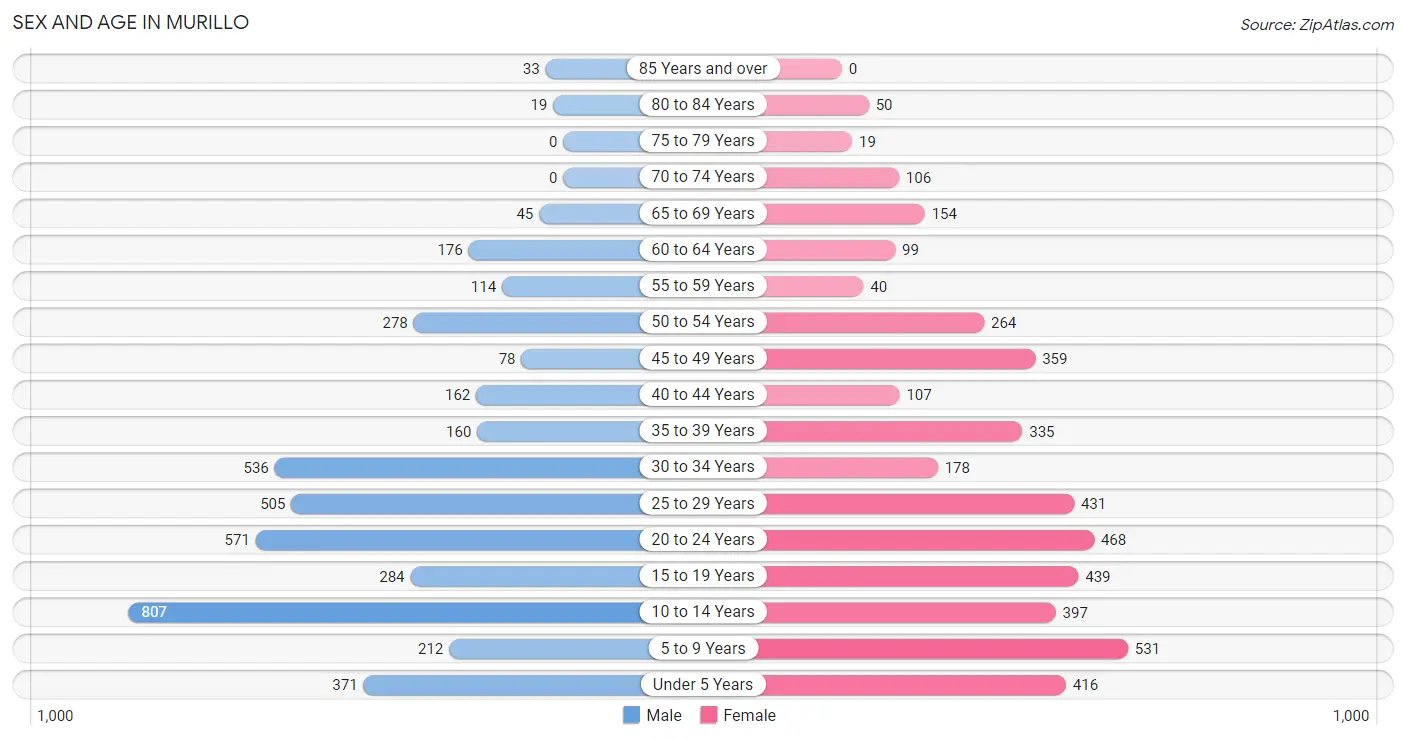
| Age Bracket | Male | Female |
| Under 5 Years | 371 (8.5%) | 416 (9.5%) |
| 5 to 9 Years | 212 (4.9%) | 531 (12.1%) |
| 10 to 14 Years | 807 (18.5%) | 397 (9.0%) |
| 15 to 19 Years | 284 (6.5%) | 439 (10.0%) |
| 20 to 24 Years | 571 (13.1%) | 468 (10.6%) |
| 25 to 29 Years | 505 (11.6%) | 431 (9.8%) |
| 30 to 34 Years | 536 (12.3%) | 178 (4.1%) |
| 35 to 39 Years | 160 (3.7%) | 335 (7.6%) |
| 40 to 44 Years | 162 (3.7%) | 107 (2.4%) |
| 45 to 49 Years | 78 (1.8%) | 359 (8.2%) |
| 50 to 54 Years | 278 (6.4%) | 264 (6.0%) |
| 55 to 59 Years | 114 (2.6%) | 40 (0.9%) |
| 60 to 64 Years | 176 (4.1%) | 99 (2.2%) |
| 65 to 69 Years | 45 (1.0%) | 154 (3.5%) |
| 70 to 74 Years | 0 (0.0%) | 106 (2.4%) |
| 75 to 79 Years | 0 (0.0%) | 19 (0.4%) |
| 80 to 84 Years | 19 (0.4%) | 50 (1.1%) |
| 85 Years and over | 33 (0.8%) | 0 (0.0%) |
| Total | 4,351 (100.0%) | 4,393 (100.0%) |
Families and Households in Murillo
Median Family Size in Murillo
The median family size in Murillo is 4.02 persons per family, with single female/mother families (710 | 35.7%) accounting for the largest median family size of 4.5 persons per family. On the other hand, single male/father families (299 | 15.0%) represent the smallest median family size with 3.04 persons per family.
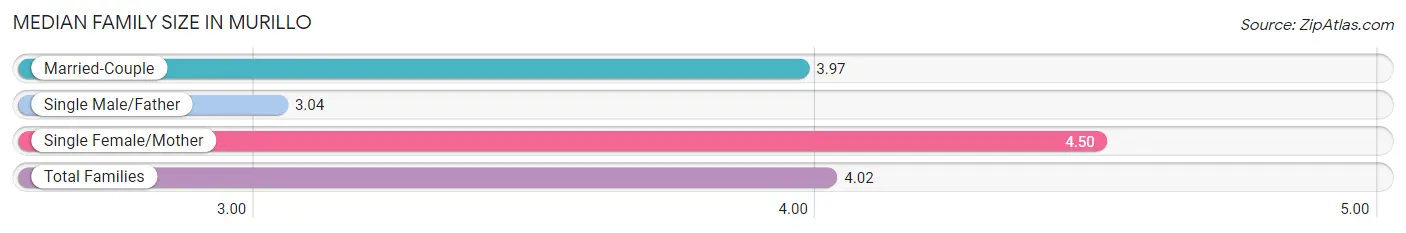
| Family Type | # Families | Family Size |
| Married-Couple | 980 (49.3%) | 3.97 |
| Single Male/Father | 299 (15.0%) | 3.04 |
| Single Female/Mother | 710 (35.7%) | 4.50 |
| Total Families | 1,989 (100.0%) | 4.02 |
Median Household Size in Murillo
The median household size in Murillo is 3.76 persons per household, with single female/mother households (710 | 30.5%) accounting for the largest median household size of 4.68 persons per household. non-family households (339 | 14.6%) represent the smallest median household size with 1.20 persons per household.
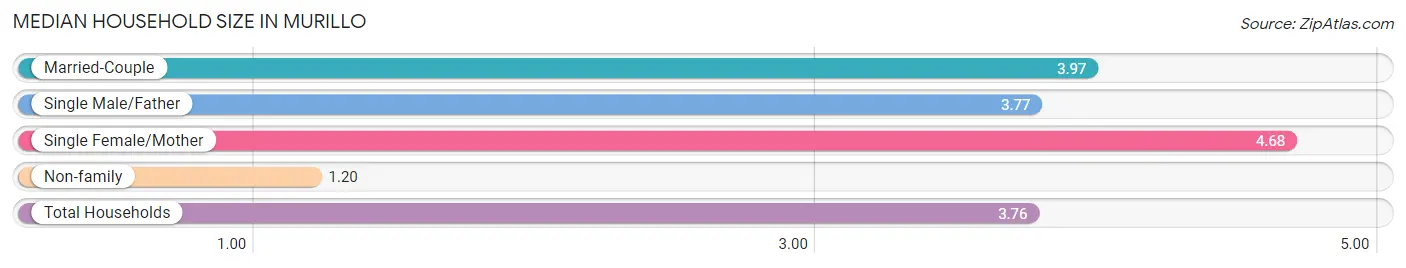
| Household Type | # Households | Household Size |
| Married-Couple | 980 (42.1%) | 3.97 |
| Single Male/Father | 299 (12.8%) | 3.77 |
| Single Female/Mother | 710 (30.5%) | 4.68 |
| Non-family | 339 (14.6%) | 1.20 |
| Total Households | 2,328 (100.0%) | 3.76 |
Household Size by Marriage Status in Murillo
Out of a total of 2,328 households in Murillo, 1,989 (85.4%) are family households, while 339 (14.6%) are nonfamily households. The most numerous type of family households are 4-person households, comprising 547, and the most common type of nonfamily households are 1-person households, comprising 276.
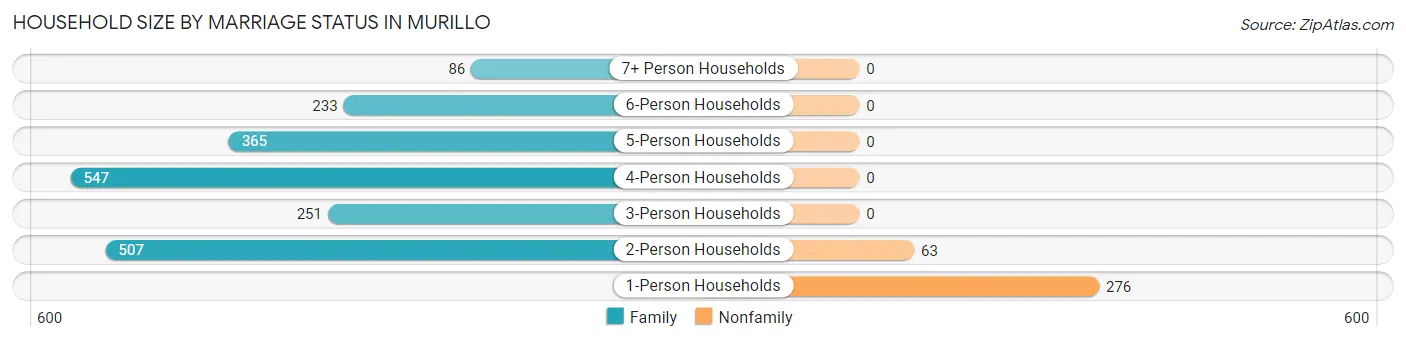
| Household Size | Family Households | Nonfamily Households |
| 1-Person Households | - | 276 (11.9%) |
| 2-Person Households | 507 (21.8%) | 63 (2.7%) |
| 3-Person Households | 251 (10.8%) | 0 (0.0%) |
| 4-Person Households | 547 (23.5%) | 0 (0.0%) |
| 5-Person Households | 365 (15.7%) | 0 (0.0%) |
| 6-Person Households | 233 (10.0%) | 0 (0.0%) |
| 7+ Person Households | 86 (3.7%) | 0 (0.0%) |
| Total | 1,989 (85.4%) | 339 (14.6%) |
Female Fertility in Murillo
Fertility by Age in Murillo
Average fertility rate in Murillo is 60.0 births per 1,000 women. Women in the age bracket of 15 to 19 years have the highest fertility rate with 114.0 births per 1,000 women. Women in the age bracket of 20 to 34 years acount for 63.8% of all women with births.
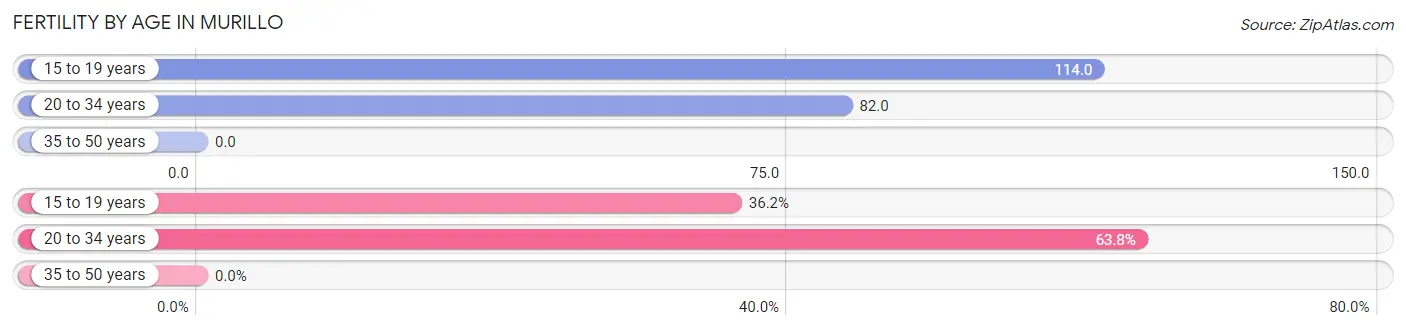
| Age Bracket | Women with Births | Births / 1,000 Women |
| 15 to 19 years | 50 (36.2%) | 114.0 |
| 20 to 34 years | 88 (63.8%) | 82.0 |
| 35 to 50 years | 0 (0.0%) | 0.0 |
| Total | 138 (100.0%) | 60.0 |
Fertility by Age by Marriage Status in Murillo
54.3% of women with births (138) in Murillo are married. The highest percentage of unmarried women with births falls into 15 to 19 years age bracket with 100.0% of them unmarried at the time of birth, while the lowest percentage of unmarried women with births belong to 20 to 34 years age bracket with 14.8% of them unmarried.
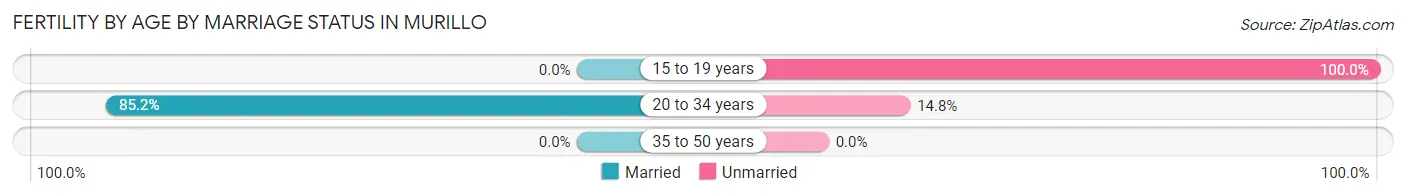
| Age Bracket | Married | Unmarried |
| 15 to 19 years | 0 (0.0%) | 50 (100.0%) |
| 20 to 34 years | 75 (85.2%) | 13 (14.8%) |
| 35 to 50 years | 0 (0.0%) | 0 (0.0%) |
| Total | 75 (54.3%) | 63 (45.7%) |
Fertility by Education in Murillo
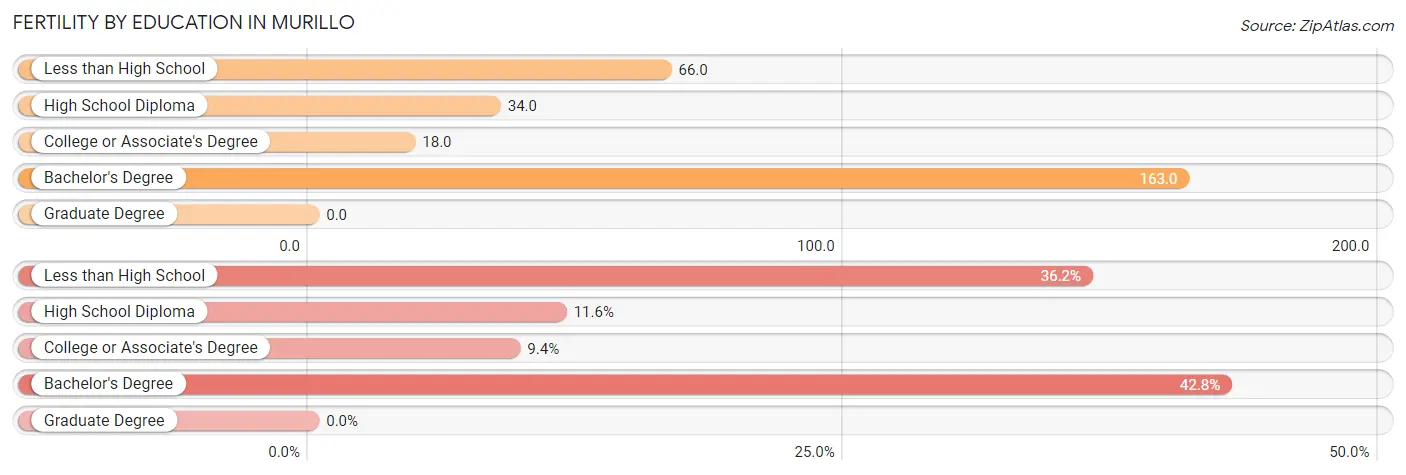
| Educational Attainment | Women with Births | Births / 1,000 Women |
| Less than High School | 50 (36.2%) | 66.0 |
| High School Diploma | 16 (11.6%) | 34.0 |
| College or Associate's Degree | 13 (9.4%) | 18.0 |
| Bachelor's Degree | 59 (42.7%) | 163.0 |
| Graduate Degree | 0 (0.0%) | 0.0 |
| Total | 138 (100.0%) | 60.0 |
Fertility by Education by Marriage Status in Murillo
45.7% of women with births in Murillo are unmarried. Women with the educational attainment of high school diploma are most likely to be married with 100.0% of them married at childbirth, while women with the educational attainment of less than high school are least likely to be married with 100.0% of them unmarried at childbirth.
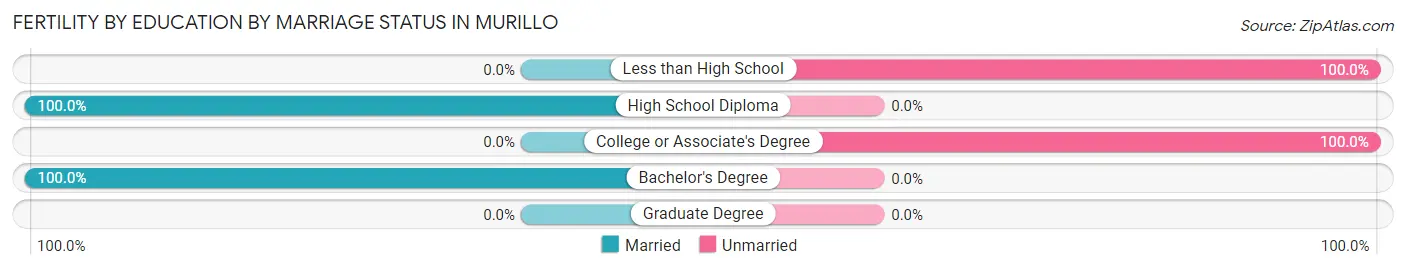
| Educational Attainment | Married | Unmarried |
| Less than High School | 0 (0.0%) | 50 (100.0%) |
| High School Diploma | 16 (100.0%) | 0 (0.0%) |
| College or Associate's Degree | 0 (0.0%) | 13 (100.0%) |
| Bachelor's Degree | 59 (100.0%) | 0 (0.0%) |
| Graduate Degree | 0 (0.0%) | 0 (0.0%) |
| Total | 75 (54.3%) | 63 (45.7%) |
Employment Characteristics in Murillo
Employment by Class of Employer in Murillo
Among the 3,664 employed individuals in Murillo, private company employees (2,226 | 60.8%), local government employees (531 | 14.5%), and state government employees (480 | 13.1%) make up the most common classes of employment.
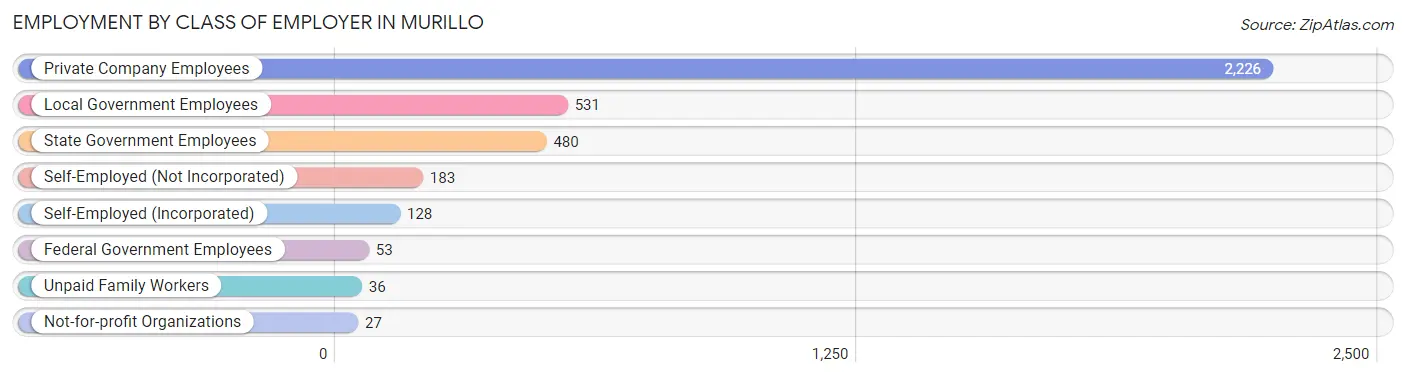
| Employer Class | # Employees | % Employees |
| Private Company Employees | 2,226 | 60.8% |
| Self-Employed (Incorporated) | 128 | 3.5% |
| Self-Employed (Not Incorporated) | 183 | 5.0% |
| Not-for-profit Organizations | 27 | 0.7% |
| Local Government Employees | 531 | 14.5% |
| State Government Employees | 480 | 13.1% |
| Federal Government Employees | 53 | 1.5% |
| Unpaid Family Workers | 36 | 1.0% |
| Total | 3,664 | 100.0% |
Employment Status by Age in Murillo
According to the labor force statistics for Murillo, out of the total population over 16 years of age (5,930), 68.4% or 4,056 individuals are in the labor force, with 7.4% or 300 of them unemployed. The age group with the highest labor force participation rate is 30 to 34 years, with 92.9% or 663 individuals in the labor force. Within the labor force, the 60 to 64 years age range has the highest percentage of unemployed individuals, with 21.1% or 37 of them being unemployed.
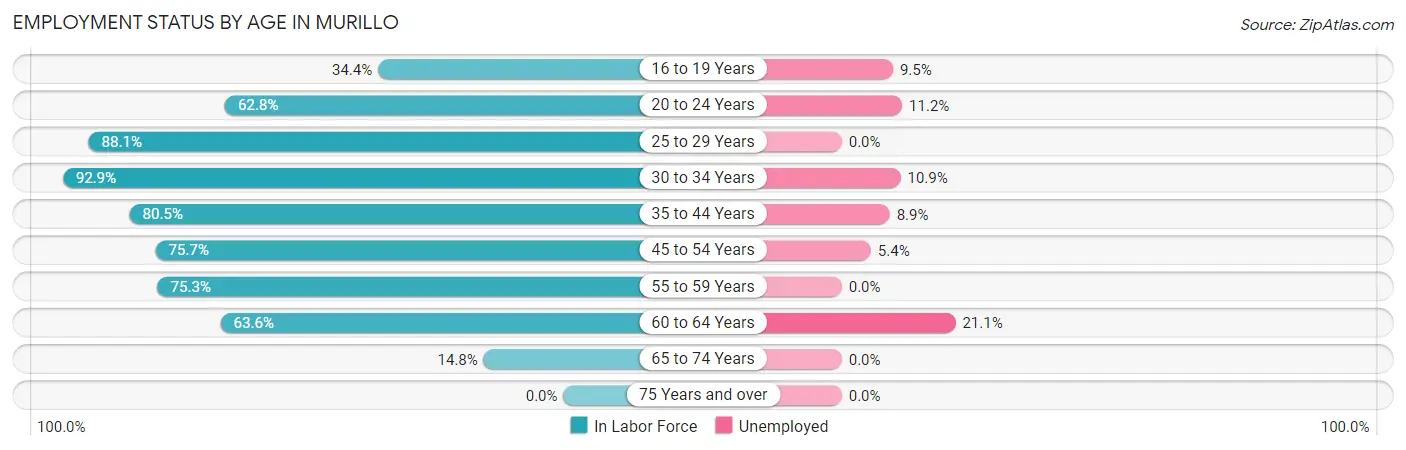
| Age Bracket | In Labor Force | Unemployed |
| 16 to 19 Years | 221 (34.4%) | 21 (9.5%) |
| 20 to 24 Years | 652 (62.8%) | 73 (11.2%) |
| 25 to 29 Years | 825 (88.1%) | 0 (0.0%) |
| 30 to 34 Years | 663 (92.9%) | 72 (10.9%) |
| 35 to 44 Years | 615 (80.5%) | 55 (8.9%) |
| 45 to 54 Years | 741 (75.7%) | 40 (5.4%) |
| 55 to 59 Years | 116 (75.3%) | 0 (0.0%) |
| 60 to 64 Years | 175 (63.6%) | 37 (21.1%) |
| 65 to 74 Years | 45 (14.8%) | 0 (0.0%) |
| 75 Years and over | 0 (0.0%) | 0 (0.0%) |
| Total | 4,056 (68.4%) | 300 (7.4%) |
Employment Status by Educational Attainment in Murillo
According to labor force statistics for Murillo, 82.0% of individuals (3,134) out of the total population between 25 and 64 years of age (3,822) are in the labor force, with 6.5% or 204 of them being unemployed. The group with the highest labor force participation rate are those with the educational attainment of college / associate degree, with 88.5% or 1,043 individuals in the labor force. Within the labor force, individuals with college / associate degree education have the highest percentage of unemployment, with 15.7% or 164 of them being unemployed.
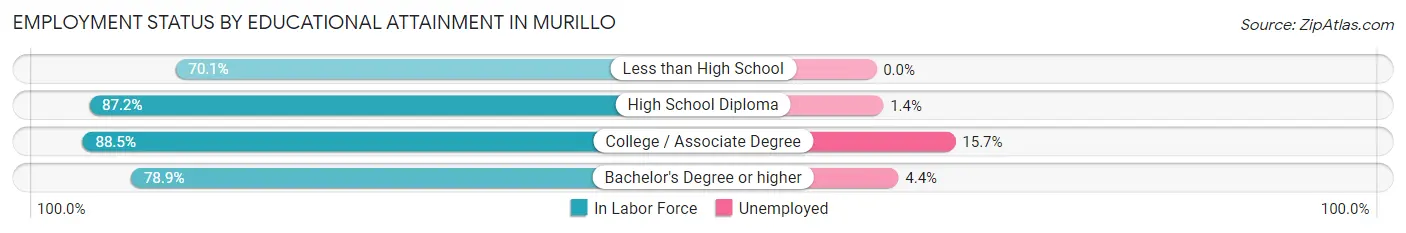
| Educational Attainment | In Labor Force | Unemployed |
| Less than High School | 600 (70.1%) | 0 (0.0%) |
| High School Diploma | 856 (87.2%) | 14 (1.4%) |
| College / Associate Degree | 1,043 (88.5%) | 185 (15.7%) |
| Bachelor's Degree or higher | 636 (78.9%) | 35 (4.4%) |
| Total | 3,134 (82.0%) | 248 (6.5%) |
Employment Occupations by Sex in Murillo
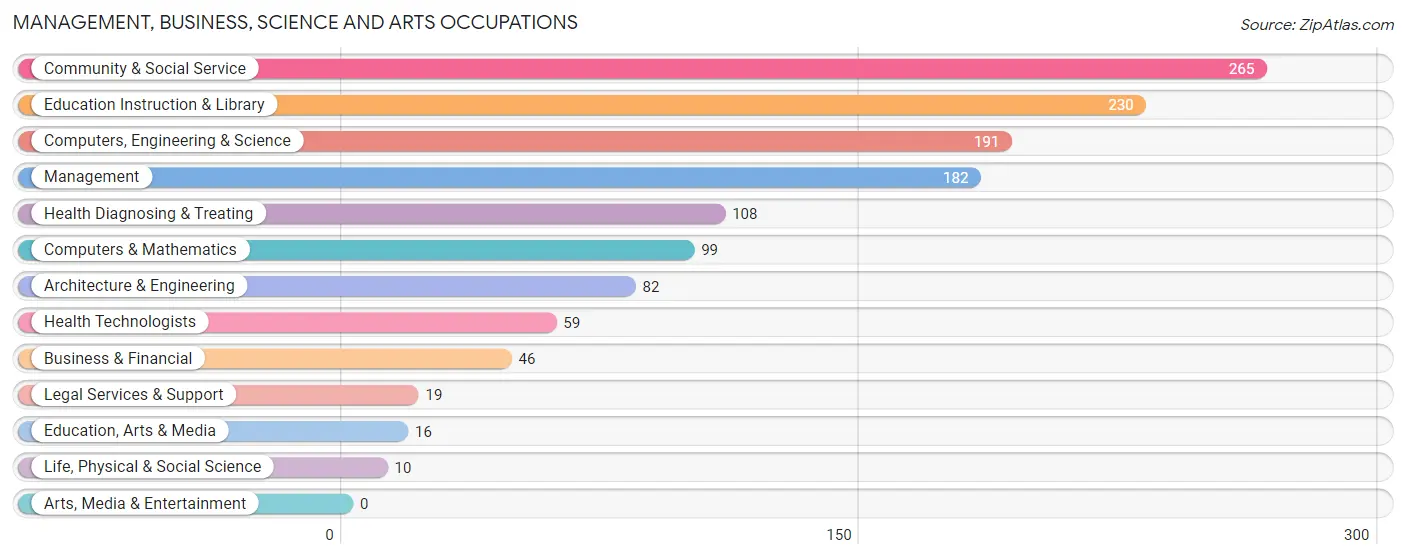
Management, Business, Science and Arts Occupations
The most common Management, Business, Science and Arts occupations in Murillo are Community & Social Service (265 | 7.1%), Education Instruction & Library (230 | 6.1%), Computers, Engineering & Science (191 | 5.1%), Management (182 | 4.9%), and Health Diagnosing & Treating (108 | 2.9%).
Management, Business, Science and Arts Occupations by Sex
Within the Management, Business, Science and Arts occupations in Murillo, the most male-oriented occupations are Computers, Engineering & Science (100.0%), Computers & Mathematics (100.0%), and Architecture & Engineering (100.0%), while the most female-oriented occupations are Education, Arts & Media (100.0%), Education Instruction & Library (82.2%), and Community & Social Service (77.4%).
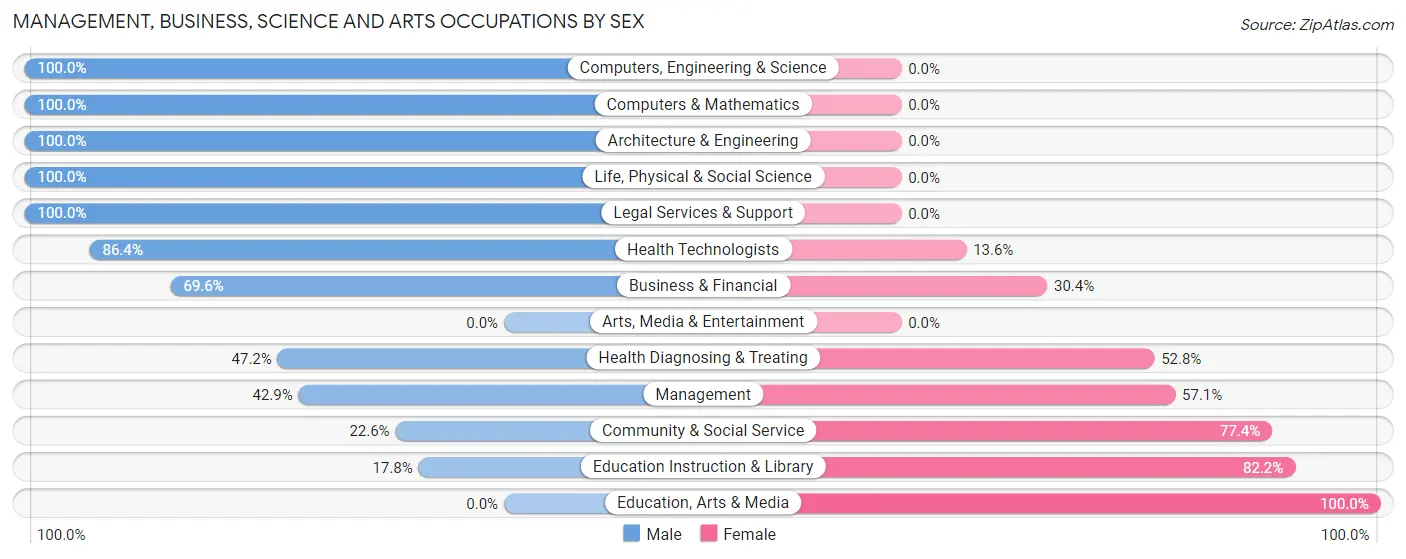
| Occupation | Male | Female |
| Management | 78 (42.9%) | 104 (57.1%) |
| Business & Financial | 32 (69.6%) | 14 (30.4%) |
| Computers, Engineering & Science | 191 (100.0%) | 0 (0.0%) |
| Computers & Mathematics | 99 (100.0%) | 0 (0.0%) |
| Architecture & Engineering | 82 (100.0%) | 0 (0.0%) |
| Life, Physical & Social Science | 10 (100.0%) | 0 (0.0%) |
| Community & Social Service | 60 (22.6%) | 205 (77.4%) |
| Education, Arts & Media | 0 (0.0%) | 16 (100.0%) |
| Legal Services & Support | 19 (100.0%) | 0 (0.0%) |
| Education Instruction & Library | 41 (17.8%) | 189 (82.2%) |
| Arts, Media & Entertainment | 0 (0.0%) | 0 (0.0%) |
| Health Diagnosing & Treating | 51 (47.2%) | 57 (52.8%) |
| Health Technologists | 51 (86.4%) | 8 (13.6%) |
| Total (Category) | 412 (52.0%) | 380 (48.0%) |
| Total (Overall) | 2,094 (55.7%) | 1,662 (44.3%) |
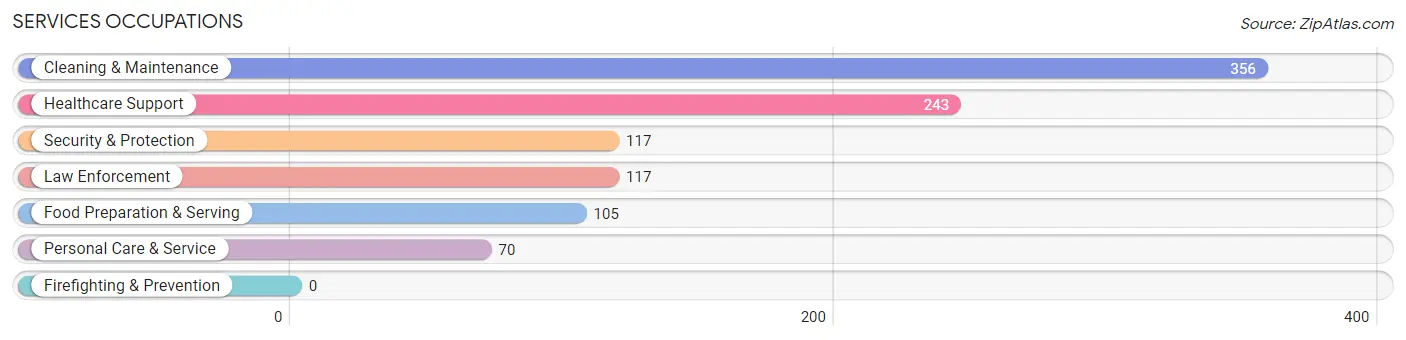
Services Occupations
The most common Services occupations in Murillo are Cleaning & Maintenance (356 | 9.5%), Healthcare Support (243 | 6.5%), Security & Protection (117 | 3.1%), Law Enforcement (117 | 3.1%), and Food Preparation & Serving (105 | 2.8%).
Services Occupations by Sex
Within the Services occupations in Murillo, the most male-oriented occupations are Food Preparation & Serving (100.0%), Security & Protection (85.5%), and Law Enforcement (85.5%), while the most female-oriented occupations are Personal Care & Service (100.0%), Healthcare Support (71.2%), and Cleaning & Maintenance (58.4%).
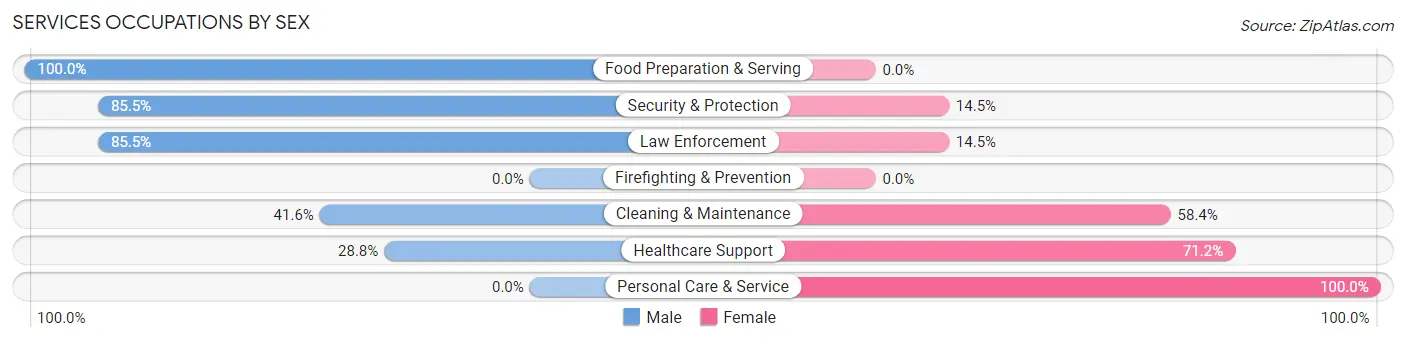
| Occupation | Male | Female |
| Healthcare Support | 70 (28.8%) | 173 (71.2%) |
| Security & Protection | 100 (85.5%) | 17 (14.5%) |
| Firefighting & Prevention | 0 (0.0%) | 0 (0.0%) |
| Law Enforcement | 100 (85.5%) | 17 (14.5%) |
| Food Preparation & Serving | 105 (100.0%) | 0 (0.0%) |
| Cleaning & Maintenance | 148 (41.6%) | 208 (58.4%) |
| Personal Care & Service | 0 (0.0%) | 70 (100.0%) |
| Total (Category) | 423 (47.5%) | 468 (52.5%) |
| Total (Overall) | 2,094 (55.7%) | 1,662 (44.3%) |
Sales and Office Occupations
The most common Sales and Office occupations in Murillo are Office & Administration (766 | 20.4%), and Sales & Related (289 | 7.7%).

Sales and Office Occupations by Sex
| Occupation | Male | Female |
| Sales & Related | 82 (28.4%) | 207 (71.6%) |
| Office & Administration | 229 (29.9%) | 537 (70.1%) |
| Total (Category) | 311 (29.5%) | 744 (70.5%) |
| Total (Overall) | 2,094 (55.7%) | 1,662 (44.3%) |
Natural Resources, Construction and Maintenance Occupations
The most common Natural Resources, Construction and Maintenance occupations in Murillo are Construction & Extraction (339 | 9.0%), and Installation, Maintenance & Repair (148 | 3.9%).

Natural Resources, Construction and Maintenance Occupations by Sex
| Occupation | Male | Female |
| Farming, Fishing & Forestry | 0 (0.0%) | 0 (0.0%) |
| Construction & Extraction | 300 (88.5%) | 39 (11.5%) |
| Installation, Maintenance & Repair | 148 (100.0%) | 0 (0.0%) |
| Total (Category) | 448 (92.0%) | 39 (8.0%) |
| Total (Overall) | 2,094 (55.7%) | 1,662 (44.3%) |
Production, Transportation and Moving Occupations
The most common Production, Transportation and Moving occupations in Murillo are Material Moving (297 | 7.9%), Transportation (137 | 3.6%), and Production (97 | 2.6%).
Production, Transportation and Moving Occupations by Sex
| Occupation | Male | Female |
| Production | 66 (68.0%) | 31 (32.0%) |
| Transportation | 137 (100.0%) | 0 (0.0%) |
| Material Moving | 297 (100.0%) | 0 (0.0%) |
| Total (Category) | 500 (94.2%) | 31 (5.8%) |
| Total (Overall) | 2,094 (55.7%) | 1,662 (44.3%) |
Employment Industries by Sex in Murillo
Employment Industries in Murillo
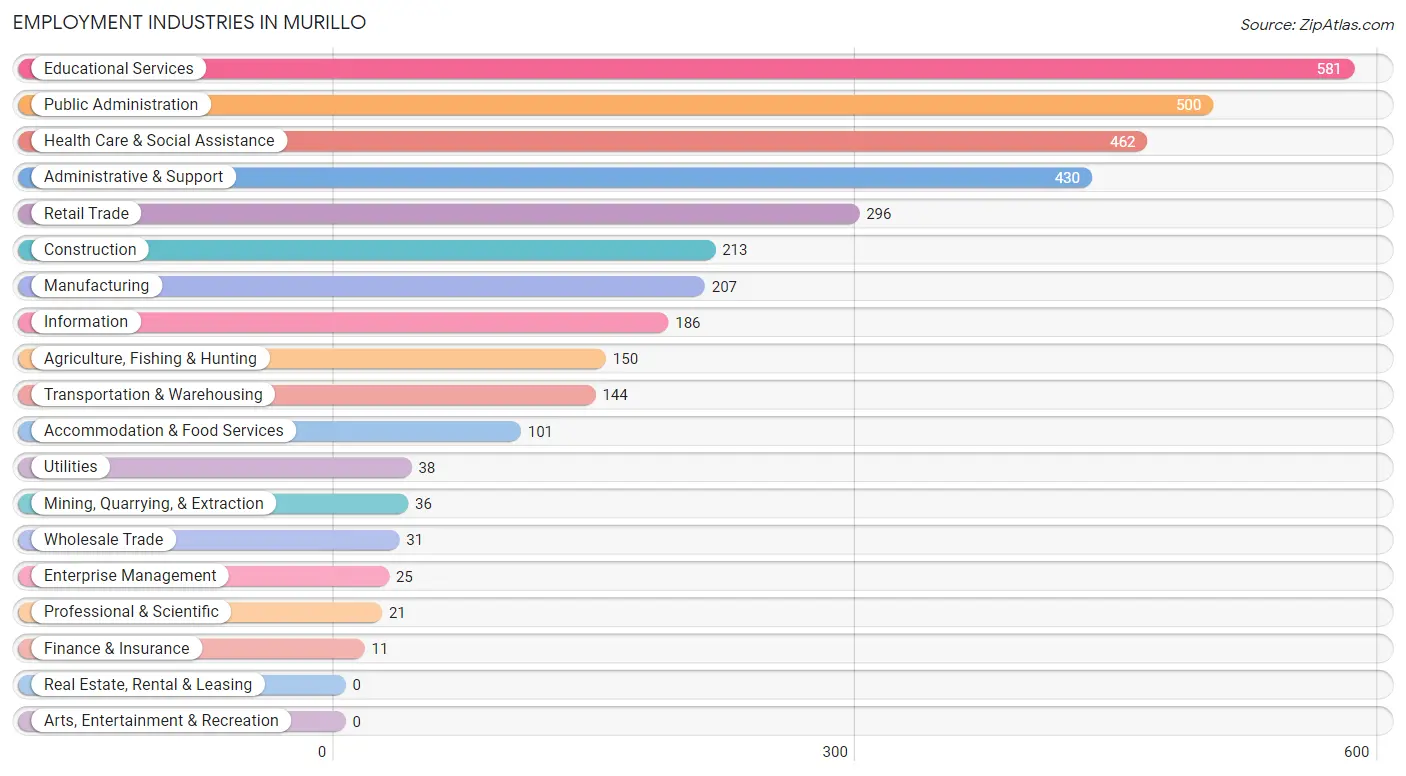
The major employment industries in Murillo include Educational Services (581 | 15.5%), Public Administration (500 | 13.3%), Health Care & Social Assistance (462 | 12.3%), Administrative & Support (430 | 11.5%), and Retail Trade (296 | 7.9%).
Employment Industries by Sex in Murillo
The Murillo industries that see more men than women are Agriculture, Fishing & Hunting (100.0%), Mining, Quarrying, & Extraction (100.0%), and Transportation & Warehousing (100.0%), whereas the industries that tend to have a higher number of women are Finance & Insurance (100.0%), Health Care & Social Assistance (69.9%), and Administrative & Support (64.9%).
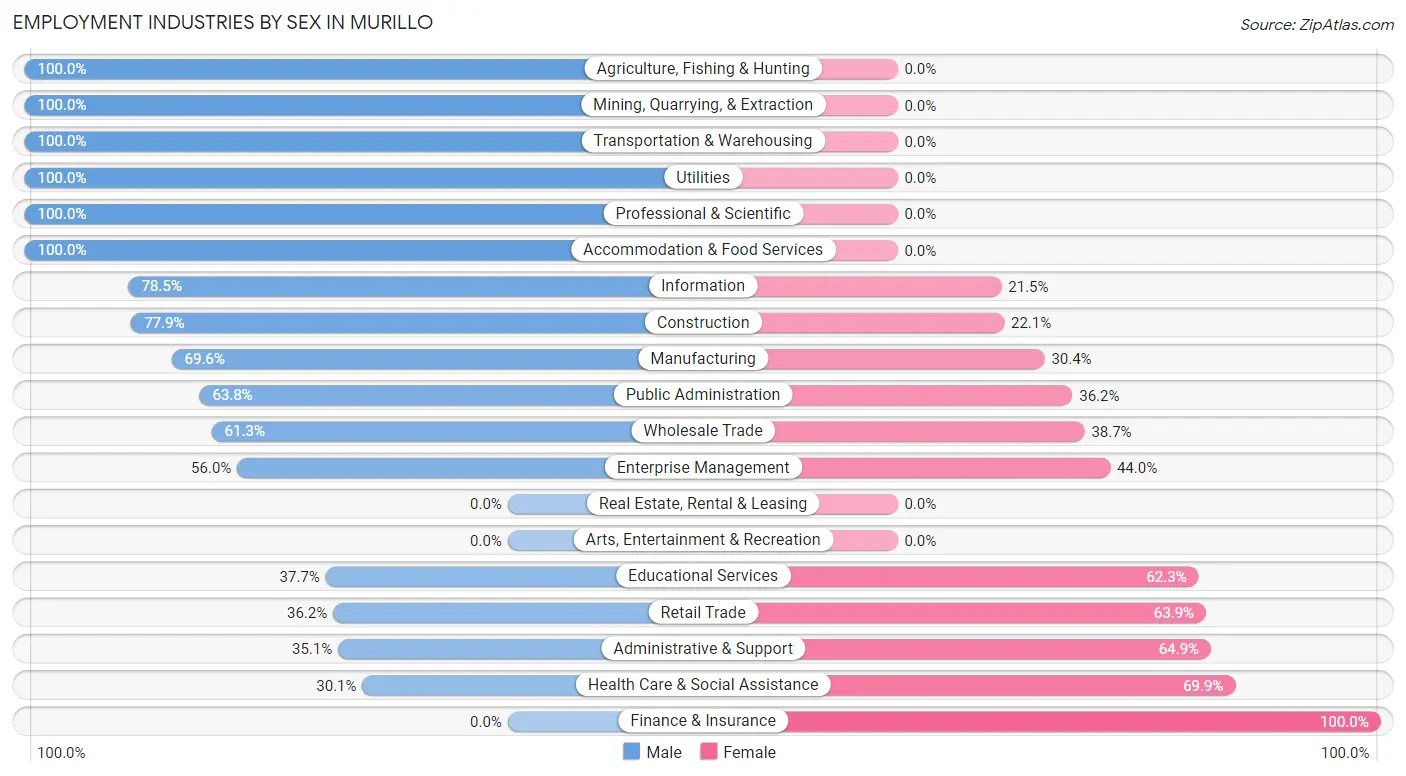
| Industry | Male | Female |
| Agriculture, Fishing & Hunting | 150 (100.0%) | 0 (0.0%) |
| Mining, Quarrying, & Extraction | 36 (100.0%) | 0 (0.0%) |
| Construction | 166 (77.9%) | 47 (22.1%) |
| Manufacturing | 144 (69.6%) | 63 (30.4%) |
| Wholesale Trade | 19 (61.3%) | 12 (38.7%) |
| Retail Trade | 107 (36.1%) | 189 (63.8%) |
| Transportation & Warehousing | 144 (100.0%) | 0 (0.0%) |
| Utilities | 38 (100.0%) | 0 (0.0%) |
| Information | 146 (78.5%) | 40 (21.5%) |
| Finance & Insurance | 0 (0.0%) | 11 (100.0%) |
| Real Estate, Rental & Leasing | 0 (0.0%) | 0 (0.0%) |
| Professional & Scientific | 21 (100.0%) | 0 (0.0%) |
| Enterprise Management | 14 (56.0%) | 11 (44.0%) |
| Administrative & Support | 151 (35.1%) | 279 (64.9%) |
| Educational Services | 219 (37.7%) | 362 (62.3%) |
| Health Care & Social Assistance | 139 (30.1%) | 323 (69.9%) |
| Arts, Entertainment & Recreation | 0 (0.0%) | 0 (0.0%) |
| Accommodation & Food Services | 101 (100.0%) | 0 (0.0%) |
| Public Administration | 319 (63.8%) | 181 (36.2%) |
| Total | 2,094 (55.7%) | 1,662 (44.3%) |
Education in Murillo
School Enrollment in Murillo
The most common levels of schooling among the 3,009 students in Murillo are middle school (922 | 30.6%), high school (729 | 24.2%), and elementary school (668 | 22.2%).
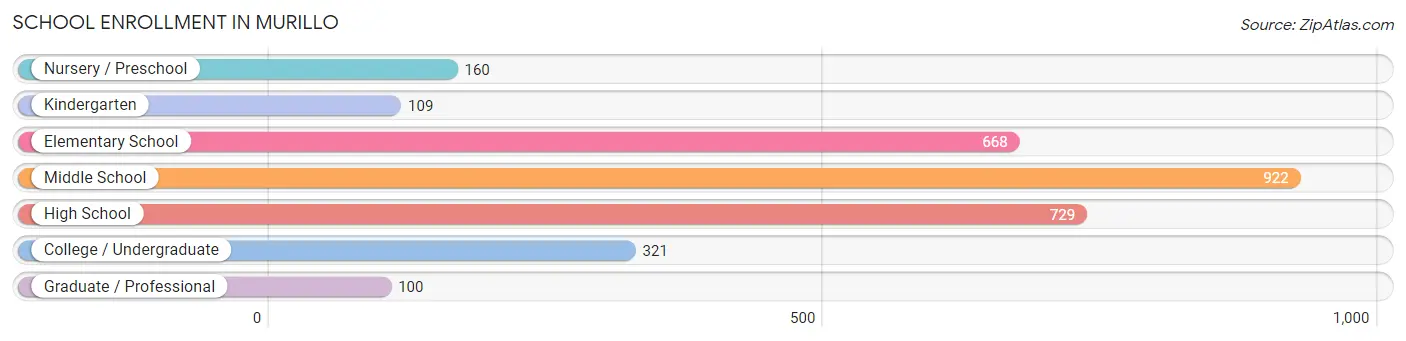
| School Level | # Students | % Students |
| Nursery / Preschool | 160 | 5.3% |
| Kindergarten | 109 | 3.6% |
| Elementary School | 668 | 22.2% |
| Middle School | 922 | 30.6% |
| High School | 729 | 24.2% |
| College / Undergraduate | 321 | 10.7% |
| Graduate / Professional | 100 | 3.3% |
| Total | 3,009 | 100.0% |
School Enrollment by Age by Funding Source in Murillo
Out of a total of 3,009 students who are enrolled in schools in Murillo, 96 (3.2%) attend a private institution, while the remaining 2,913 (96.8%) are enrolled in public schools. The age group of 35 years and over has the highest likelihood of being enrolled in private schools, with 24 (49.0% in the age bracket) enrolled. Conversely, the age group of 3 to 4 year olds has the lowest likelihood of being enrolled in a private school, with 160 (100.0% in the age bracket) attending a public institution.
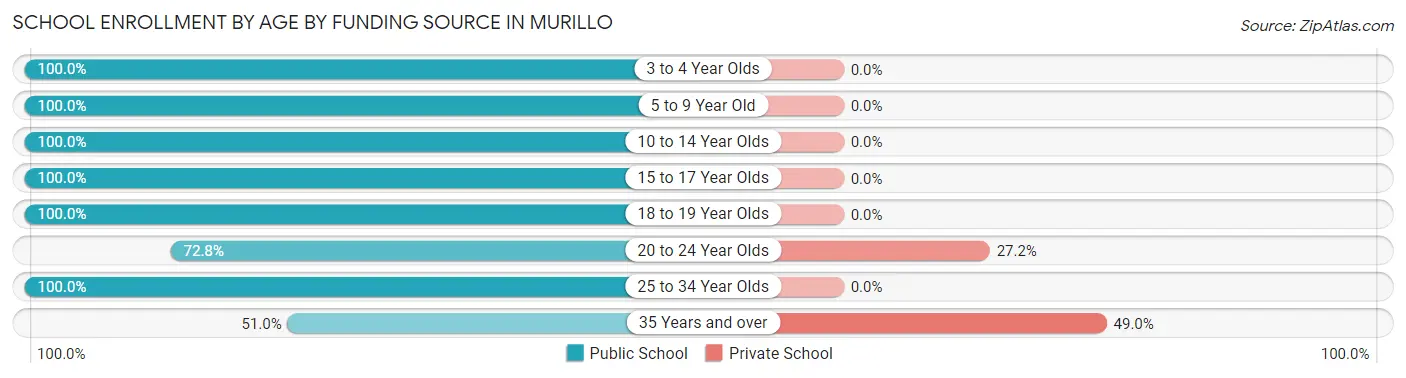
| Age Bracket | Public School | Private School |
| 3 to 4 Year Olds | 160 (100.0%) | 0 (0.0%) |
| 5 to 9 Year Old | 686 (100.0%) | 0 (0.0%) |
| 10 to 14 Year Olds | 1,204 (100.0%) | 0 (0.0%) |
| 15 to 17 Year Olds | 449 (100.0%) | 0 (0.0%) |
| 18 to 19 Year Olds | 149 (100.0%) | 0 (0.0%) |
| 20 to 24 Year Olds | 190 (72.8%) | 71 (27.2%) |
| 25 to 34 Year Olds | 51 (100.0%) | 0 (0.0%) |
| 35 Years and over | 25 (51.0%) | 24 (49.0%) |
| Total | 2,913 (96.8%) | 96 (3.2%) |
Educational Attainment by Field of Study in Murillo
Education (241 | 27.5%), business (228 | 26.1%), arts & humanities (97 | 11.1%), computers & mathematics (89 | 10.2%), and science & technology (68 | 7.8%) are the most common fields of study among 875 individuals in Murillo who have obtained a bachelor's degree or higher.
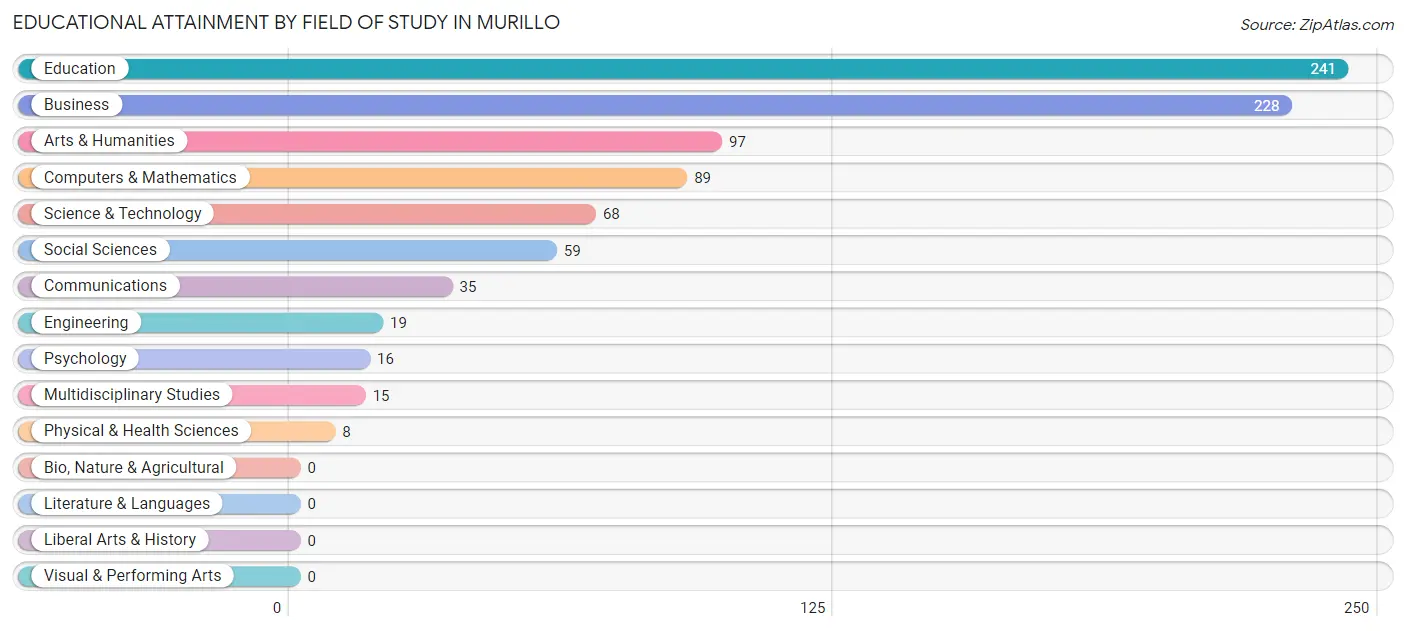
| Field of Study | # Graduates | % Graduates |
| Computers & Mathematics | 89 | 10.2% |
| Bio, Nature & Agricultural | 0 | 0.0% |
| Physical & Health Sciences | 8 | 0.9% |
| Psychology | 16 | 1.8% |
| Social Sciences | 59 | 6.7% |
| Engineering | 19 | 2.2% |
| Multidisciplinary Studies | 15 | 1.7% |
| Science & Technology | 68 | 7.8% |
| Business | 228 | 26.1% |
| Education | 241 | 27.5% |
| Literature & Languages | 0 | 0.0% |
| Liberal Arts & History | 0 | 0.0% |
| Visual & Performing Arts | 0 | 0.0% |
| Communications | 35 | 4.0% |
| Arts & Humanities | 97 | 11.1% |
| Total | 875 | 100.0% |
Transportation & Commute in Murillo
Vehicle Availability by Sex in Murillo
The most prevalent vehicle ownership categories in Murillo are males with 2 vehicles (894, accounting for 43.4%) and females with 2 vehicles (650, making up 55.8%).
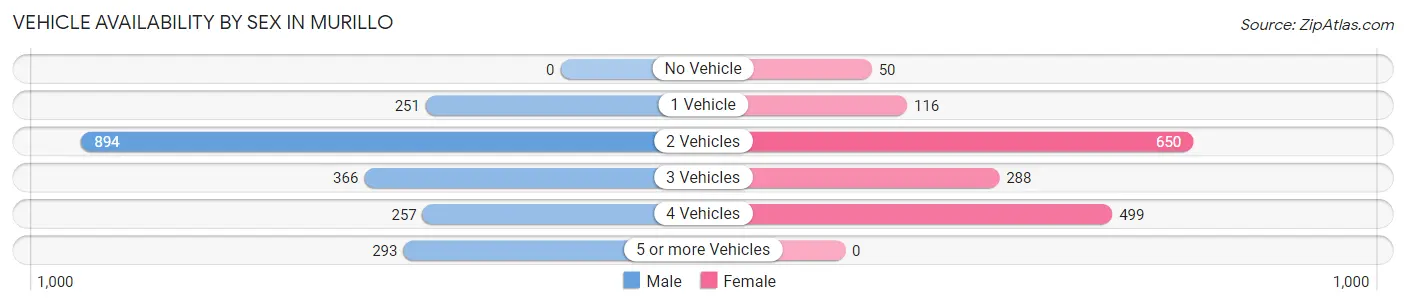
| Vehicles Available | Male | Female |
| No Vehicle | 0 (0.0%) | 50 (3.1%) |
| 1 Vehicle | 251 (12.2%) | 116 (7.2%) |
| 2 Vehicles | 894 (43.4%) | 650 (40.6%) |
| 3 Vehicles | 366 (17.8%) | 288 (18.0%) |
| 4 Vehicles | 257 (12.5%) | 499 (31.1%) |
| 5 or more Vehicles | 293 (14.2%) | 0 (0.0%) |
| Total | 2,061 (100.0%) | 1,603 (100.0%) |
Commute Time in Murillo
The most frequently occuring commute durations in Murillo are 10 to 14 minutes (751 commuters, 22.5%), 20 to 24 minutes (710 commuters, 21.2%), and 15 to 19 minutes (643 commuters, 19.2%).
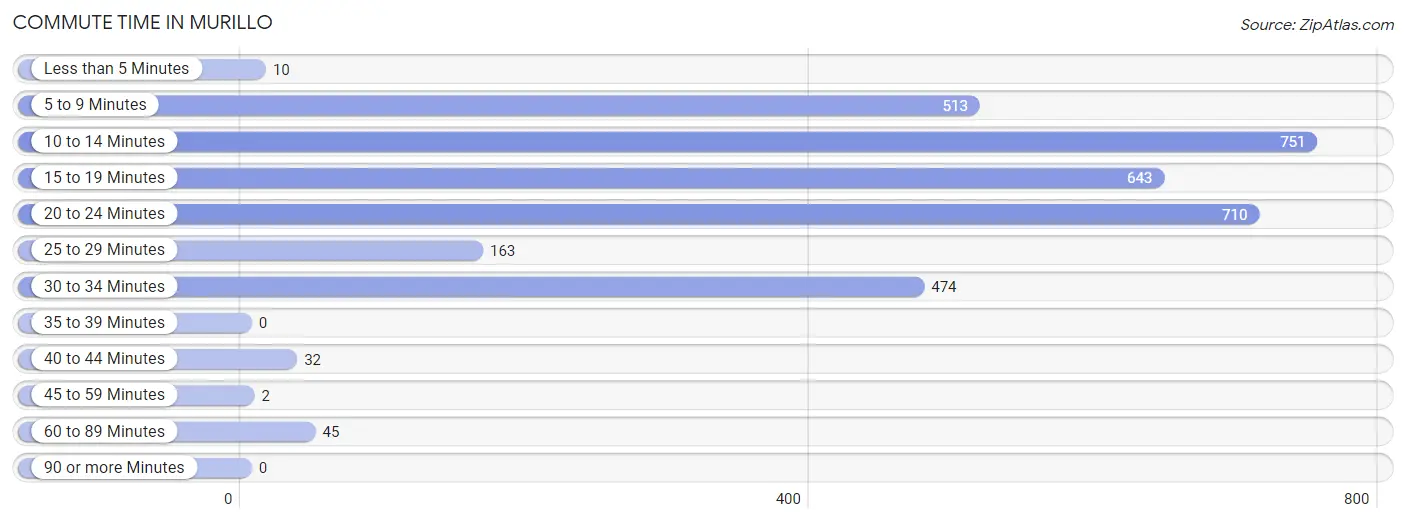
| Commute Time | # Commuters | % Commuters |
| Less than 5 Minutes | 10 | 0.3% |
| 5 to 9 Minutes | 513 | 15.3% |
| 10 to 14 Minutes | 751 | 22.5% |
| 15 to 19 Minutes | 643 | 19.2% |
| 20 to 24 Minutes | 710 | 21.2% |
| 25 to 29 Minutes | 163 | 4.9% |
| 30 to 34 Minutes | 474 | 14.2% |
| 35 to 39 Minutes | 0 | 0.0% |
| 40 to 44 Minutes | 32 | 1.0% |
| 45 to 59 Minutes | 2 | 0.1% |
| 60 to 89 Minutes | 45 | 1.3% |
| 90 or more Minutes | 0 | 0.0% |
Commute Time by Sex in Murillo
The most common commute times in Murillo are 10 to 14 minutes (490 commuters, 26.9%) for males and 15 to 19 minutes (378 commuters, 24.8%) for females.
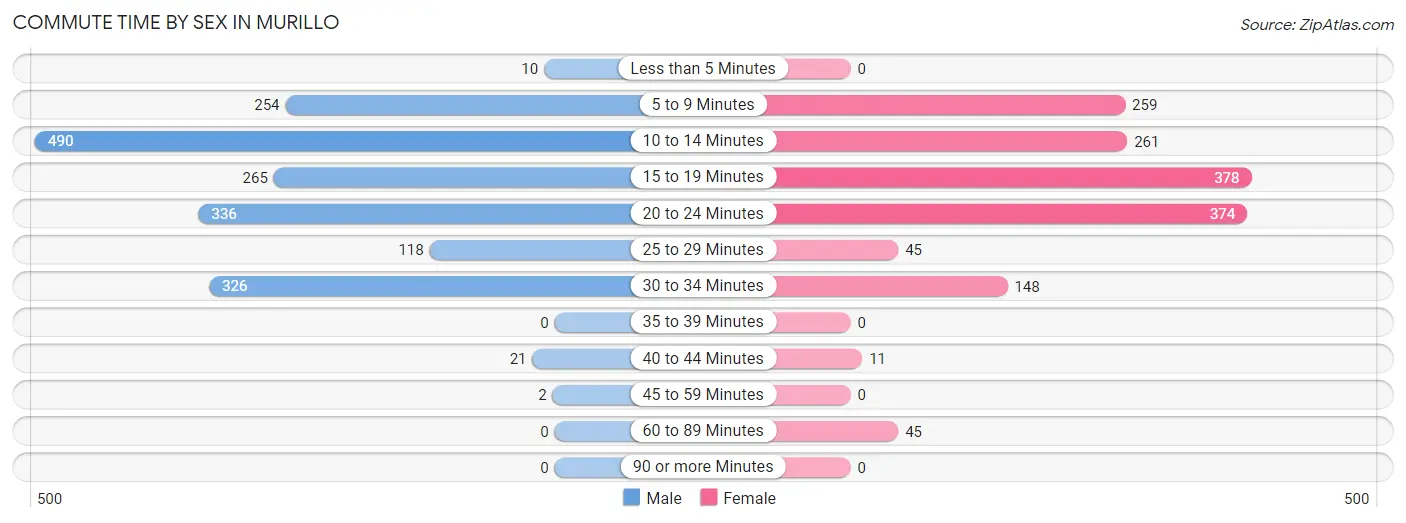
| Commute Time | Male | Female |
| Less than 5 Minutes | 10 (0.5%) | 0 (0.0%) |
| 5 to 9 Minutes | 254 (13.9%) | 259 (17.0%) |
| 10 to 14 Minutes | 490 (26.9%) | 261 (17.2%) |
| 15 to 19 Minutes | 265 (14.5%) | 378 (24.8%) |
| 20 to 24 Minutes | 336 (18.4%) | 374 (24.6%) |
| 25 to 29 Minutes | 118 (6.5%) | 45 (3.0%) |
| 30 to 34 Minutes | 326 (17.9%) | 148 (9.7%) |
| 35 to 39 Minutes | 0 (0.0%) | 0 (0.0%) |
| 40 to 44 Minutes | 21 (1.1%) | 11 (0.7%) |
| 45 to 59 Minutes | 2 (0.1%) | 0 (0.0%) |
| 60 to 89 Minutes | 0 (0.0%) | 45 (3.0%) |
| 90 or more Minutes | 0 (0.0%) | 0 (0.0%) |
Time of Departure to Work by Sex in Murillo
The most frequent times of departure to work in Murillo are 7:30 AM to 7:59 AM (372, 20.4%) for males and 7:30 AM to 7:59 AM (378, 24.8%) for females.
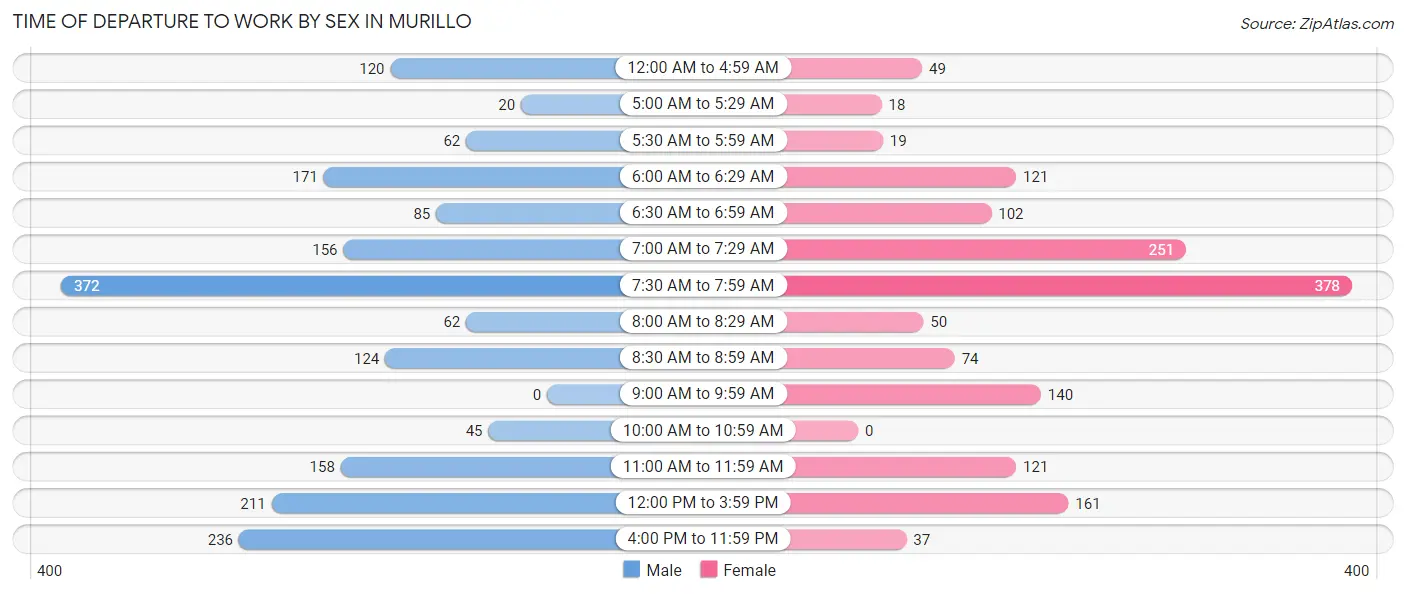
| Time of Departure | Male | Female |
| 12:00 AM to 4:59 AM | 120 (6.6%) | 49 (3.2%) |
| 5:00 AM to 5:29 AM | 20 (1.1%) | 18 (1.2%) |
| 5:30 AM to 5:59 AM | 62 (3.4%) | 19 (1.3%) |
| 6:00 AM to 6:29 AM | 171 (9.4%) | 121 (8.0%) |
| 6:30 AM to 6:59 AM | 85 (4.7%) | 102 (6.7%) |
| 7:00 AM to 7:29 AM | 156 (8.6%) | 251 (16.5%) |
| 7:30 AM to 7:59 AM | 372 (20.4%) | 378 (24.8%) |
| 8:00 AM to 8:29 AM | 62 (3.4%) | 50 (3.3%) |
| 8:30 AM to 8:59 AM | 124 (6.8%) | 74 (4.9%) |
| 9:00 AM to 9:59 AM | 0 (0.0%) | 140 (9.2%) |
| 10:00 AM to 10:59 AM | 45 (2.5%) | 0 (0.0%) |
| 11:00 AM to 11:59 AM | 158 (8.7%) | 121 (8.0%) |
| 12:00 PM to 3:59 PM | 211 (11.6%) | 161 (10.6%) |
| 4:00 PM to 11:59 PM | 236 (13.0%) | 37 (2.4%) |
| Total | 1,822 (100.0%) | 1,521 (100.0%) |
Housing Occupancy in Murillo
Occupancy by Ownership in Murillo
Of the total 2,328 dwellings in Murillo, owner-occupied units account for 1,787 (76.8%), while renter-occupied units make up 541 (23.2%).
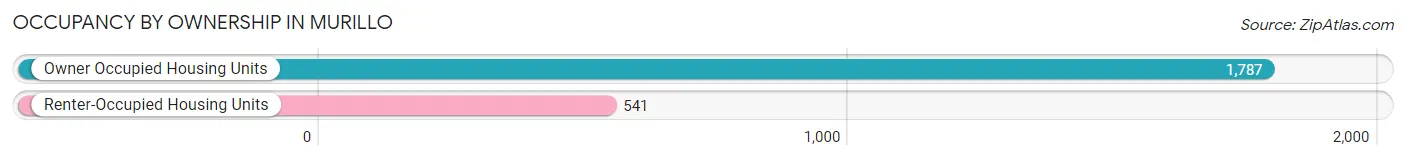
| Occupancy | # Housing Units | % Housing Units |
| Owner Occupied Housing Units | 1,787 | 76.8% |
| Renter-Occupied Housing Units | 541 | 23.2% |
| Total Occupied Housing Units | 2,328 | 100.0% |
Occupancy by Household Size in Murillo
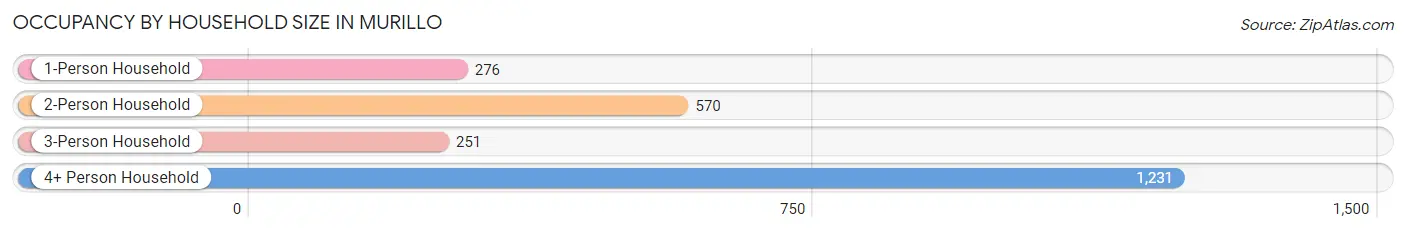
| Household Size | # Housing Units | % Housing Units |
| 1-Person Household | 276 | 11.9% |
| 2-Person Household | 570 | 24.5% |
| 3-Person Household | 251 | 10.8% |
| 4+ Person Household | 1,231 | 52.9% |
| Total Housing Units | 2,328 | 100.0% |
Occupancy by Ownership by Household Size in Murillo
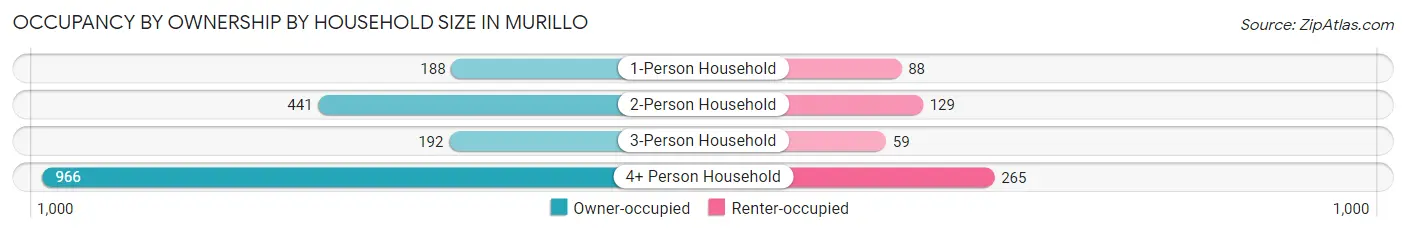
| Household Size | Owner-occupied | Renter-occupied |
| 1-Person Household | 188 (68.1%) | 88 (31.9%) |
| 2-Person Household | 441 (77.4%) | 129 (22.6%) |
| 3-Person Household | 192 (76.5%) | 59 (23.5%) |
| 4+ Person Household | 966 (78.5%) | 265 (21.5%) |
| Total Housing Units | 1,787 (76.8%) | 541 (23.2%) |
Occupancy by Educational Attainment in Murillo
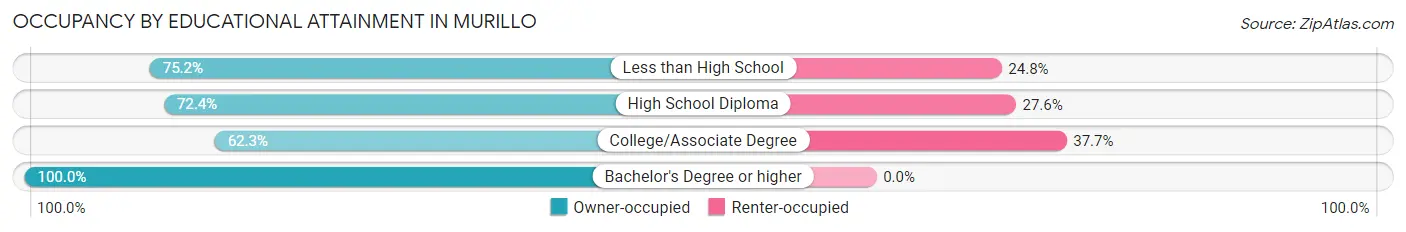
| Household Size | Owner-occupied | Renter-occupied |
| Less than High School | 430 (75.2%) | 142 (24.8%) |
| High School Diploma | 495 (72.4%) | 189 (27.6%) |
| College/Associate Degree | 347 (62.3%) | 210 (37.7%) |
| Bachelor's Degree or higher | 515 (100.0%) | 0 (0.0%) |
Occupancy by Age of Householder in Murillo
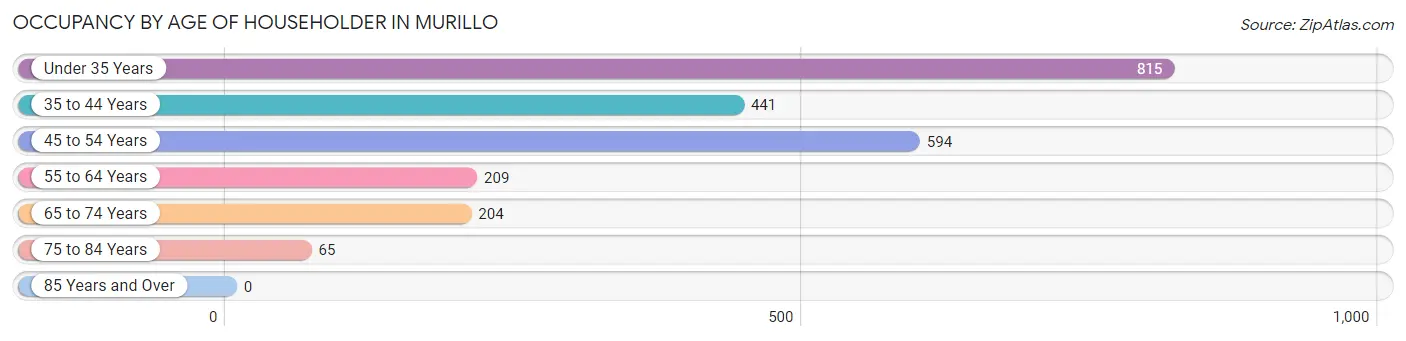
| Age Bracket | # Households | % Households |
| Under 35 Years | 815 | 35.0% |
| 35 to 44 Years | 441 | 18.9% |
| 45 to 54 Years | 594 | 25.5% |
| 55 to 64 Years | 209 | 9.0% |
| 65 to 74 Years | 204 | 8.8% |
| 75 to 84 Years | 65 | 2.8% |
| 85 Years and Over | 0 | 0.0% |
| Total | 2,328 | 100.0% |
Housing Finances in Murillo
Median Income by Occupancy in Murillo
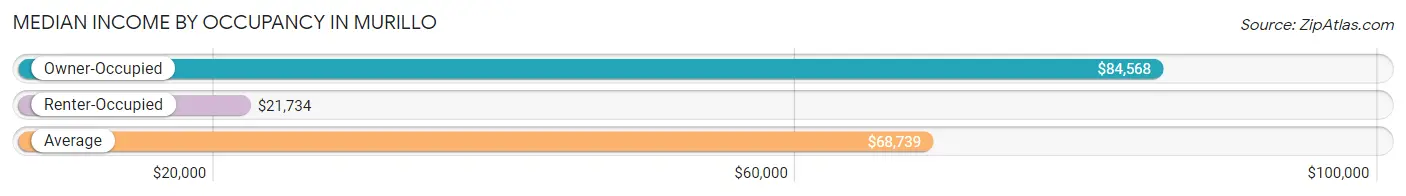
| Occupancy Type | # Households | Median Income |
| Owner-Occupied | 1,787 (76.8%) | $84,568 |
| Renter-Occupied | 541 (23.2%) | $21,734 |
| Average | 2,328 (100.0%) | $68,739 |
Occupancy by Householder Income Bracket in Murillo
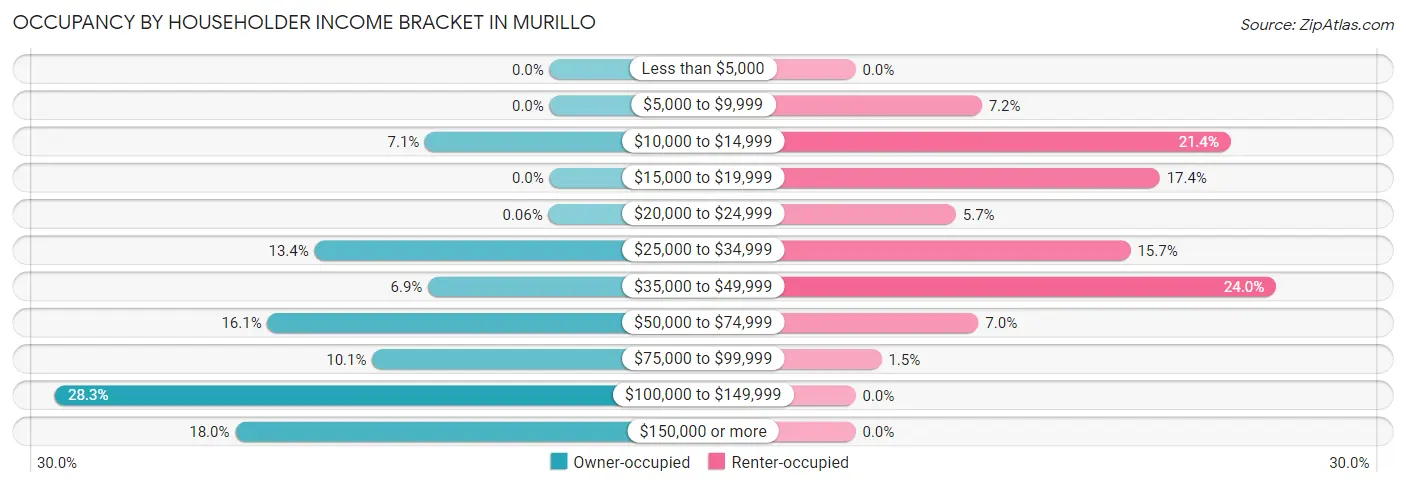
| Income Bracket | Owner-occupied | Renter-occupied |
| Less than $5,000 | 0 (0.0%) | 0 (0.0%) |
| $5,000 to $9,999 | 0 (0.0%) | 39 (7.2%) |
| $10,000 to $14,999 | 127 (7.1%) | 116 (21.4%) |
| $15,000 to $19,999 | 0 (0.0%) | 94 (17.4%) |
| $20,000 to $24,999 | 1 (0.1%) | 31 (5.7%) |
| $25,000 to $34,999 | 240 (13.4%) | 85 (15.7%) |
| $35,000 to $49,999 | 124 (6.9%) | 130 (24.0%) |
| $50,000 to $74,999 | 288 (16.1%) | 38 (7.0%) |
| $75,000 to $99,999 | 181 (10.1%) | 8 (1.5%) |
| $100,000 to $149,999 | 505 (28.3%) | 0 (0.0%) |
| $150,000 or more | 321 (18.0%) | 0 (0.0%) |
| Total | 1,787 (100.0%) | 541 (100.0%) |
Monthly Housing Cost Tiers in Murillo
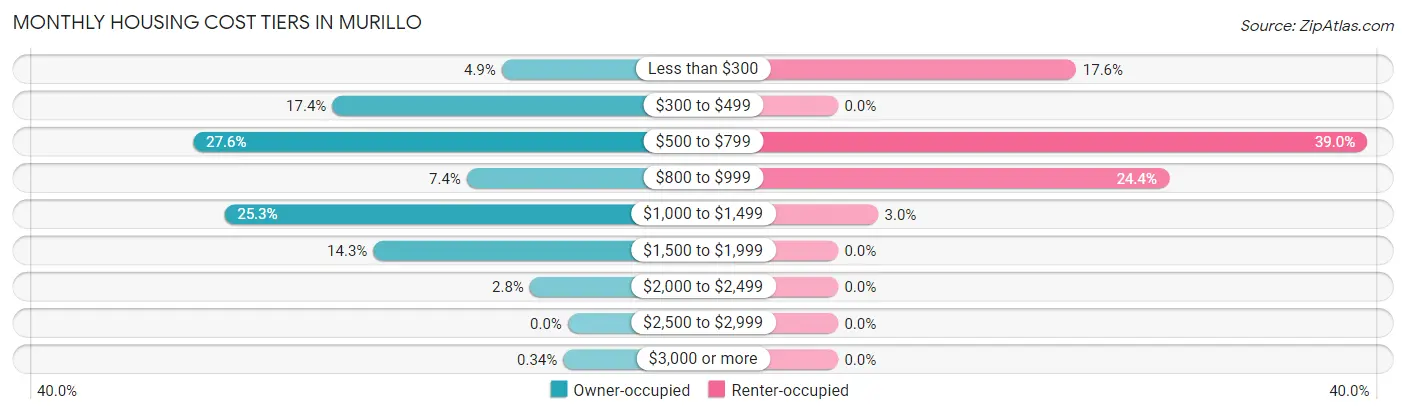
| Monthly Cost | Owner-occupied | Renter-occupied |
| Less than $300 | 87 (4.9%) | 95 (17.6%) |
| $300 to $499 | 310 (17.3%) | 0 (0.0%) |
| $500 to $799 | 493 (27.6%) | 211 (39.0%) |
| $800 to $999 | 133 (7.4%) | 132 (24.4%) |
| $1,000 to $1,499 | 452 (25.3%) | 16 (3.0%) |
| $1,500 to $1,999 | 256 (14.3%) | 0 (0.0%) |
| $2,000 to $2,499 | 50 (2.8%) | 0 (0.0%) |
| $2,500 to $2,999 | 0 (0.0%) | 0 (0.0%) |
| $3,000 or more | 6 (0.3%) | 0 (0.0%) |
| Total | 1,787 (100.0%) | 541 (100.0%) |
Physical Housing Characteristics in Murillo
Housing Structures in Murillo
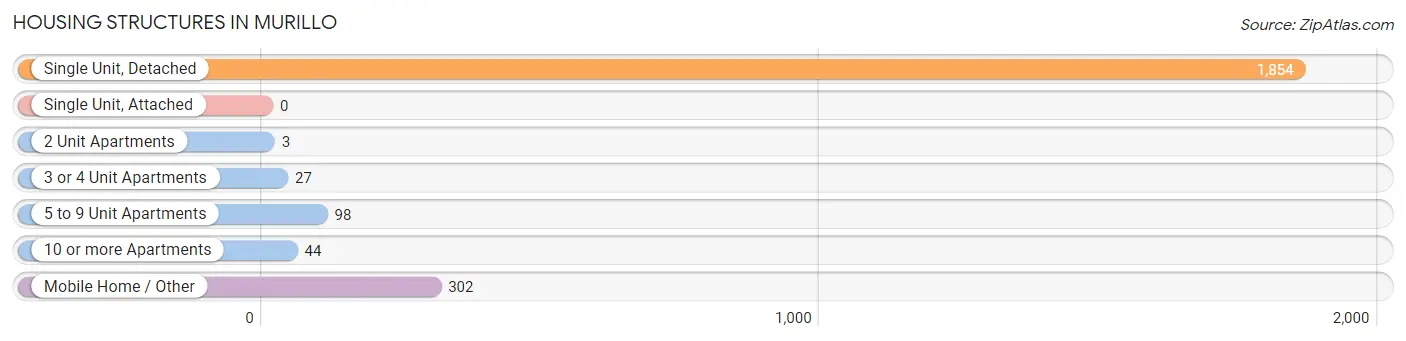
| Structure Type | # Housing Units | % Housing Units |
| Single Unit, Detached | 1,854 | 79.6% |
| Single Unit, Attached | 0 | 0.0% |
| 2 Unit Apartments | 3 | 0.1% |
| 3 or 4 Unit Apartments | 27 | 1.2% |
| 5 to 9 Unit Apartments | 98 | 4.2% |
| 10 or more Apartments | 44 | 1.9% |
| Mobile Home / Other | 302 | 13.0% |
| Total | 2,328 | 100.0% |
Housing Structures by Occupancy in Murillo
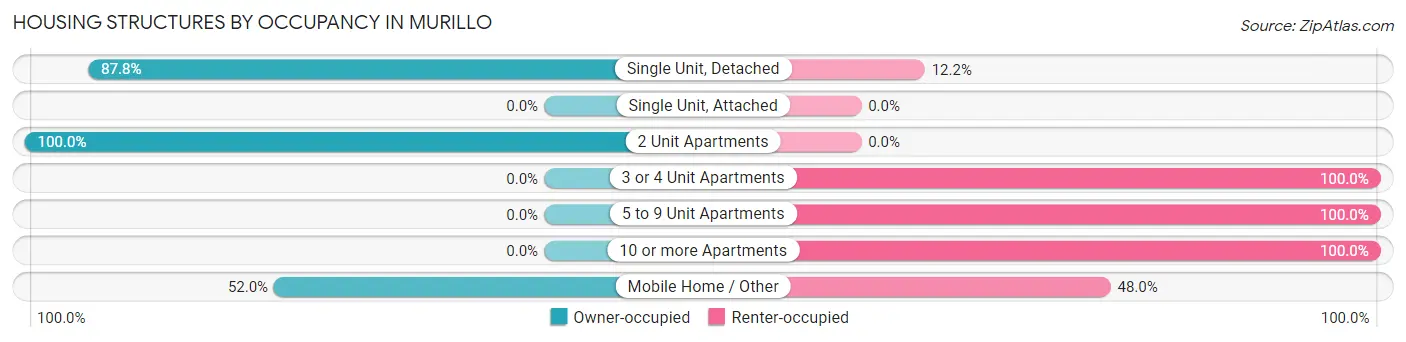
| Structure Type | Owner-occupied | Renter-occupied |
| Single Unit, Detached | 1,627 (87.8%) | 227 (12.2%) |
| Single Unit, Attached | 0 (0.0%) | 0 (0.0%) |
| 2 Unit Apartments | 3 (100.0%) | 0 (0.0%) |
| 3 or 4 Unit Apartments | 0 (0.0%) | 27 (100.0%) |
| 5 to 9 Unit Apartments | 0 (0.0%) | 98 (100.0%) |
| 10 or more Apartments | 0 (0.0%) | 44 (100.0%) |
| Mobile Home / Other | 157 (52.0%) | 145 (48.0%) |
| Total | 1,787 (76.8%) | 541 (23.2%) |
Housing Structures by Number of Rooms in Murillo
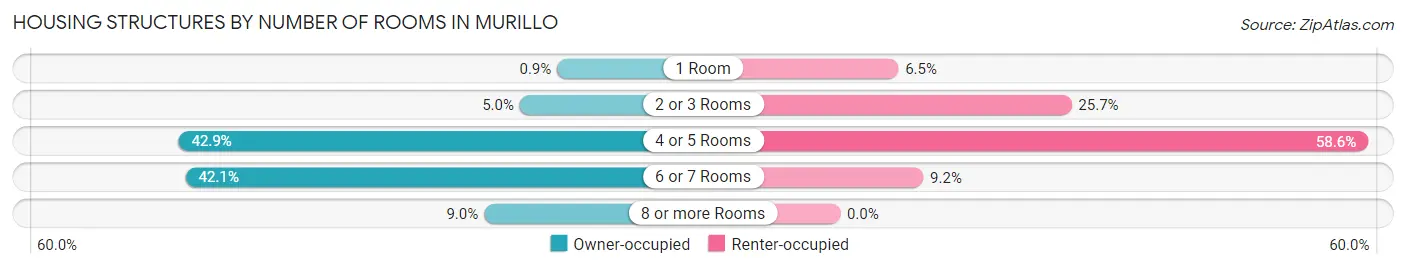
| Number of Rooms | Owner-occupied | Renter-occupied |
| 1 Room | 16 (0.9%) | 35 (6.5%) |
| 2 or 3 Rooms | 90 (5.0%) | 139 (25.7%) |
| 4 or 5 Rooms | 767 (42.9%) | 317 (58.6%) |
| 6 or 7 Rooms | 753 (42.1%) | 50 (9.2%) |
| 8 or more Rooms | 161 (9.0%) | 0 (0.0%) |
| Total | 1,787 (100.0%) | 541 (100.0%) |
Housing Structure by Heating Type in Murillo
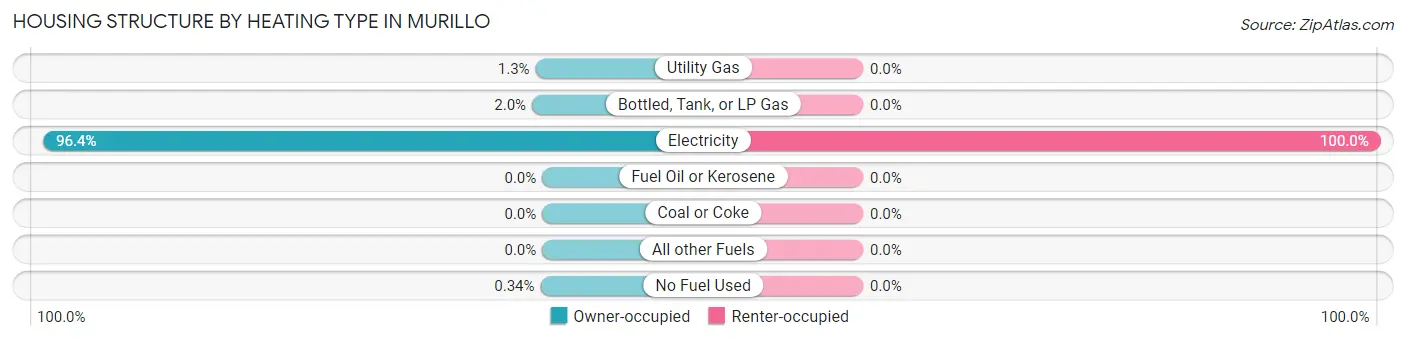
| Heating Type | Owner-occupied | Renter-occupied |
| Utility Gas | 23 (1.3%) | 0 (0.0%) |
| Bottled, Tank, or LP Gas | 35 (2.0%) | 0 (0.0%) |
| Electricity | 1,723 (96.4%) | 541 (100.0%) |
| Fuel Oil or Kerosene | 0 (0.0%) | 0 (0.0%) |
| Coal or Coke | 0 (0.0%) | 0 (0.0%) |
| All other Fuels | 0 (0.0%) | 0 (0.0%) |
| No Fuel Used | 6 (0.3%) | 0 (0.0%) |
| Total | 1,787 (100.0%) | 541 (100.0%) |
Household Vehicle Usage in Murillo
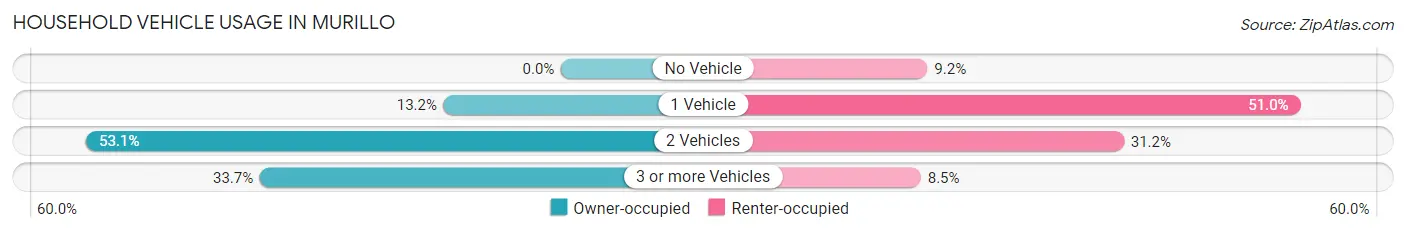
| Vehicles per Household | Owner-occupied | Renter-occupied |
| No Vehicle | 0 (0.0%) | 50 (9.2%) |
| 1 Vehicle | 235 (13.2%) | 276 (51.0%) |
| 2 Vehicles | 949 (53.1%) | 169 (31.2%) |
| 3 or more Vehicles | 603 (33.7%) | 46 (8.5%) |
| Total | 1,787 (100.0%) | 541 (100.0%) |
Real Estate & Mortgages in Murillo
Real Estate and Mortgage Overview in Murillo
| Characteristic | Without Mortgage | With Mortgage |
| Housing Units | 593 | 1,194 |
| Median Property Value | $94,700 | $152,500 |
| Median Household Income | $100,371 | $193 |
| Monthly Housing Costs | $400 | $6 |
| Real Estate Taxes | $1,942 | $0 |
Property Value by Mortgage Status in Murillo
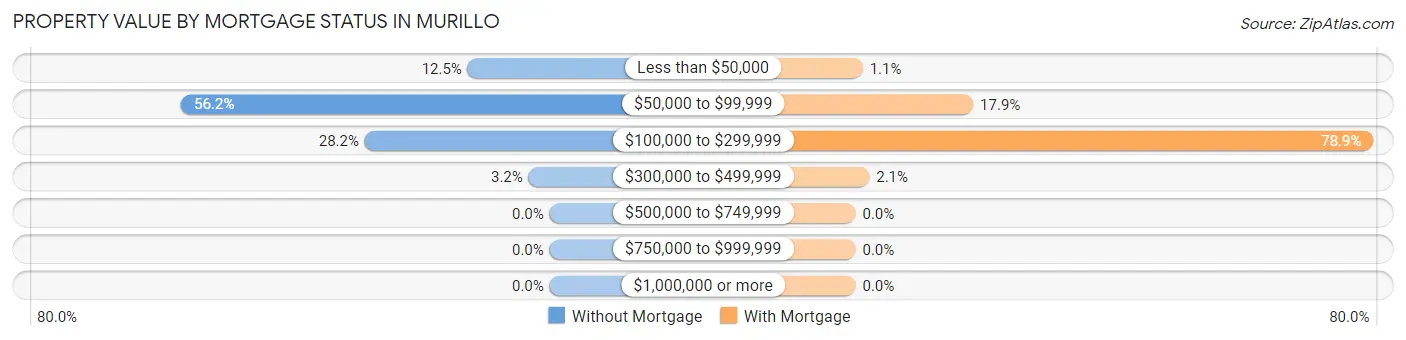
| Property Value | Without Mortgage | With Mortgage |
| Less than $50,000 | 74 (12.5%) | 13 (1.1%) |
| $50,000 to $99,999 | 333 (56.2%) | 214 (17.9%) |
| $100,000 to $299,999 | 167 (28.2%) | 942 (78.9%) |
| $300,000 to $499,999 | 19 (3.2%) | 25 (2.1%) |
| $500,000 to $749,999 | 0 (0.0%) | 0 (0.0%) |
| $750,000 to $999,999 | 0 (0.0%) | 0 (0.0%) |
| $1,000,000 or more | 0 (0.0%) | 0 (0.0%) |
| Total | 593 (100.0%) | 1,194 (100.0%) |
Household Income by Mortgage Status in Murillo
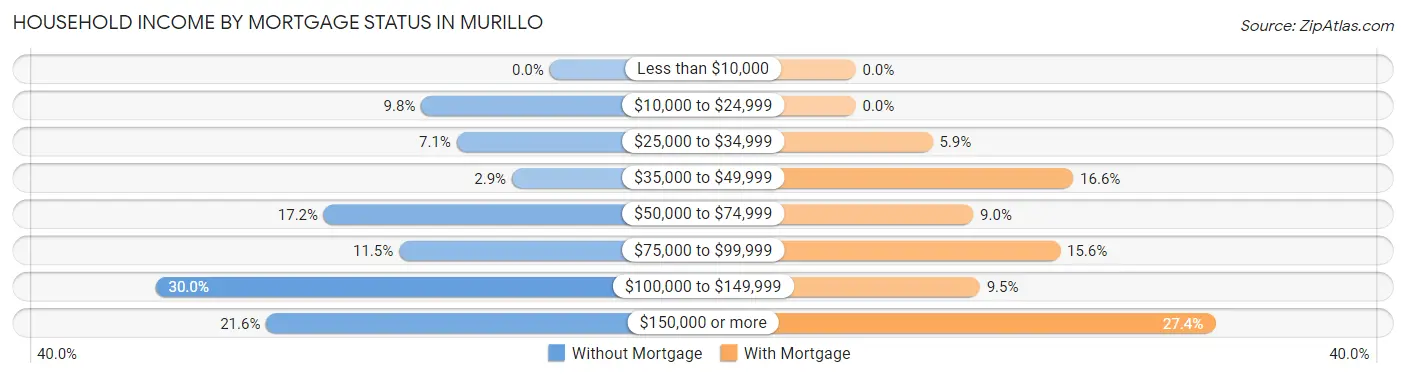
| Household Income | Without Mortgage | With Mortgage |
| Less than $10,000 | 0 (0.0%) | 0 (0.0%) |
| $10,000 to $24,999 | 58 (9.8%) | 0 (0.0%) |
| $25,000 to $34,999 | 42 (7.1%) | 70 (5.9%) |
| $35,000 to $49,999 | 17 (2.9%) | 198 (16.6%) |
| $50,000 to $74,999 | 102 (17.2%) | 107 (9.0%) |
| $75,000 to $99,999 | 68 (11.5%) | 186 (15.6%) |
| $100,000 to $149,999 | 178 (30.0%) | 113 (9.5%) |
| $150,000 or more | 128 (21.6%) | 327 (27.4%) |
| Total | 593 (100.0%) | 1,194 (100.0%) |
Property Value to Household Income Ratio in Murillo
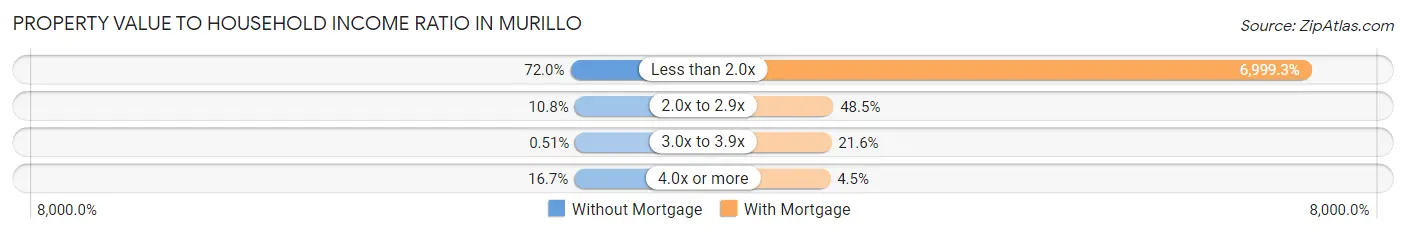
| Value-to-Income Ratio | Without Mortgage | With Mortgage |
| Less than 2.0x | 427 (72.0%) | 83,571 (6,999.3%) |
| 2.0x to 2.9x | 64 (10.8%) | 579 (48.5%) |
| 3.0x to 3.9x | 3 (0.5%) | 258 (21.6%) |
| 4.0x or more | 99 (16.7%) | 54 (4.5%) |
| Total | 593 (100.0%) | 1,194 (100.0%) |
Real Estate Taxes by Mortgage Status in Murillo
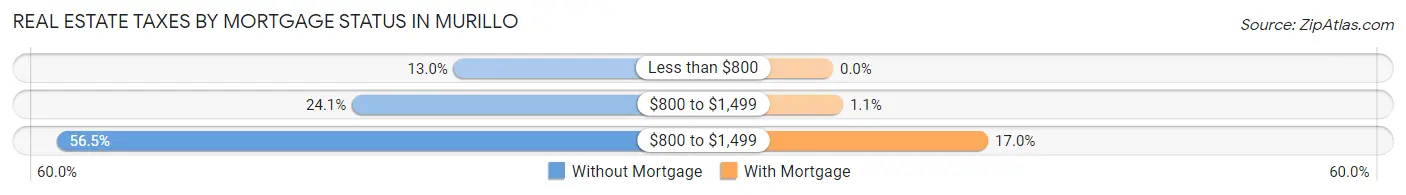
| Property Taxes | Without Mortgage | With Mortgage |
| Less than $800 | 77 (13.0%) | 0 (0.0%) |
| $800 to $1,499 | 143 (24.1%) | 13 (1.1%) |
| $800 to $1,499 | 335 (56.5%) | 203 (17.0%) |
| Total | 593 (100.0%) | 1,194 (100.0%) |
Health & Disability in Murillo
Health Insurance Coverage by Age in Murillo
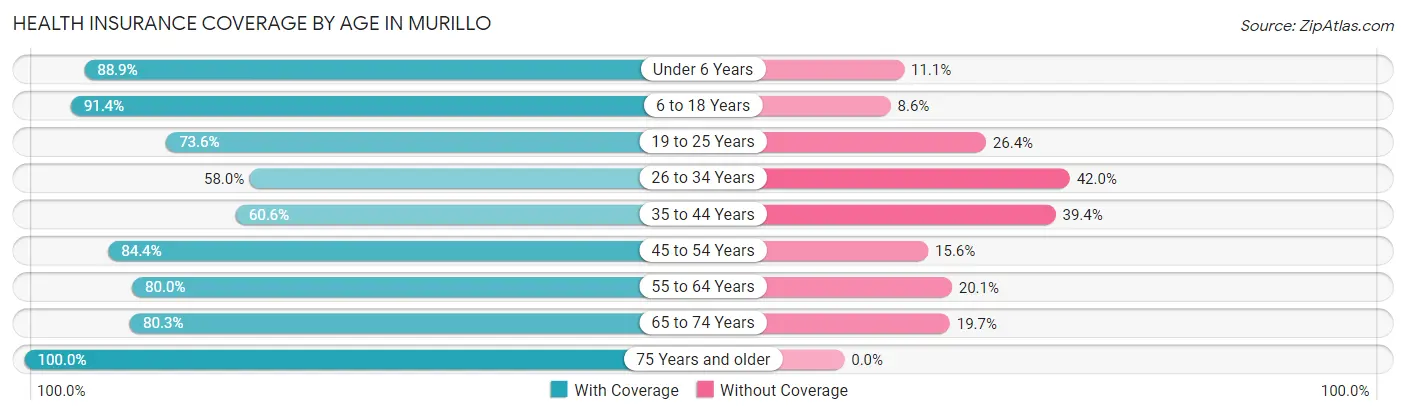
| Age Bracket | With Coverage | Without Coverage |
| Under 6 Years | 798 (88.9%) | 100 (11.1%) |
| 6 to 18 Years | 2,320 (91.4%) | 219 (8.6%) |
| 19 to 25 Years | 861 (73.6%) | 309 (26.4%) |
| 26 to 34 Years | 892 (58.0%) | 647 (42.0%) |
| 35 to 44 Years | 463 (60.6%) | 301 (39.4%) |
| 45 to 54 Years | 826 (84.4%) | 153 (15.6%) |
| 55 to 64 Years | 343 (79.9%) | 86 (20.1%) |
| 65 to 74 Years | 245 (80.3%) | 60 (19.7%) |
| 75 Years and older | 121 (100.0%) | 0 (0.0%) |
| Total | 6,869 (78.6%) | 1,875 (21.4%) |
Health Insurance Coverage by Citizenship Status in Murillo
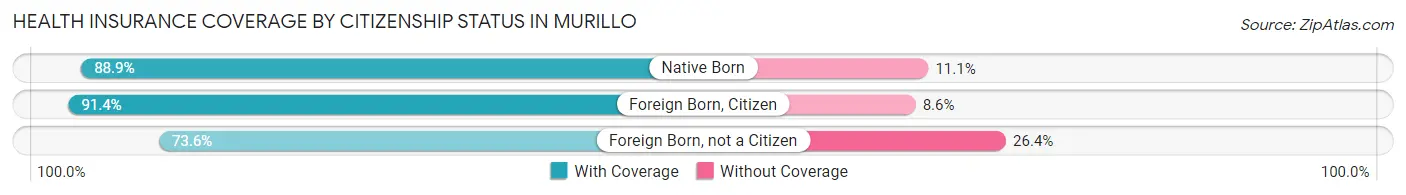
| Citizenship Status | With Coverage | Without Coverage |
| Native Born | 798 (88.9%) | 100 (11.1%) |
| Foreign Born, Citizen | 2,320 (91.4%) | 219 (8.6%) |
| Foreign Born, not a Citizen | 861 (73.6%) | 309 (26.4%) |
Health Insurance Coverage by Household Income in Murillo
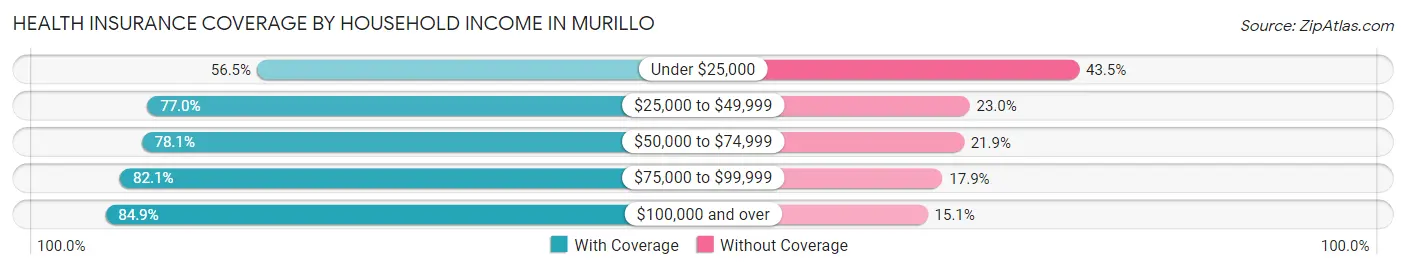
| Household Income | With Coverage | Without Coverage |
| Under $25,000 | 509 (56.5%) | 392 (43.5%) |
| $25,000 to $49,999 | 2,103 (77.0%) | 628 (23.0%) |
| $50,000 to $74,999 | 606 (78.1%) | 170 (21.9%) |
| $75,000 to $99,999 | 848 (82.1%) | 185 (17.9%) |
| $100,000 and over | 2,803 (84.9%) | 500 (15.1%) |
Public vs Private Health Insurance Coverage by Age in Murillo
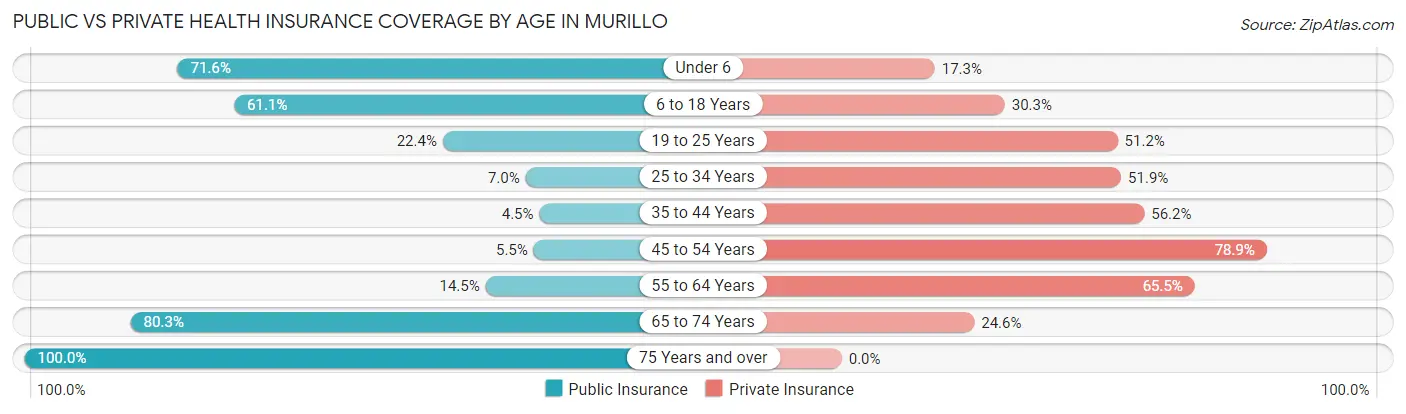
| Age Bracket | Public Insurance | Private Insurance |
| Under 6 | 643 (71.6%) | 155 (17.3%) |
| 6 to 18 Years | 1,552 (61.1%) | 768 (30.2%) |
| 19 to 25 Years | 262 (22.4%) | 599 (51.2%) |
| 25 to 34 Years | 108 (7.0%) | 798 (51.8%) |
| 35 to 44 Years | 34 (4.4%) | 429 (56.1%) |
| 45 to 54 Years | 54 (5.5%) | 772 (78.9%) |
| 55 to 64 Years | 62 (14.4%) | 281 (65.5%) |
| 65 to 74 Years | 245 (80.3%) | 75 (24.6%) |
| 75 Years and over | 121 (100.0%) | 0 (0.0%) |
| Total | 3,081 (35.2%) | 3,877 (44.3%) |
Disability Status by Sex by Age in Murillo
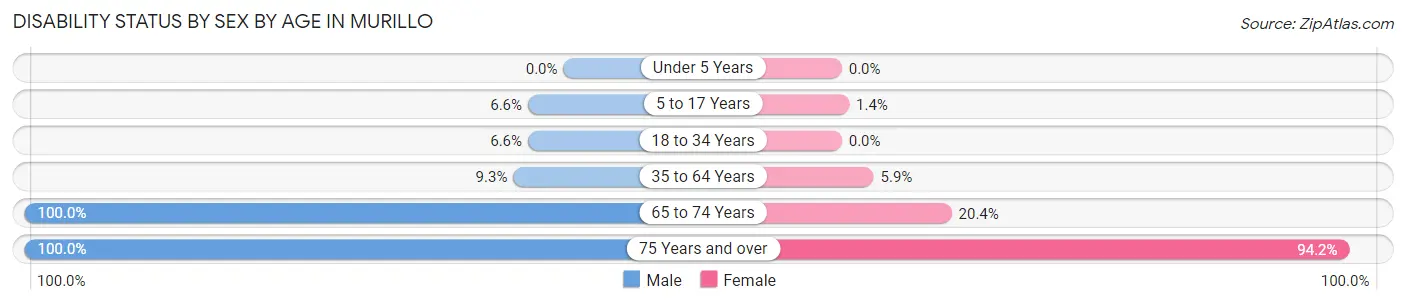
| Age Bracket | Male | Female |
| Under 5 Years | 0 (0.0%) | 0 (0.0%) |
| 5 to 17 Years | 73 (6.6%) | 18 (1.3%) |
| 18 to 34 Years | 119 (6.6%) | 0 (0.0%) |
| 35 to 64 Years | 90 (9.3%) | 71 (5.9%) |
| 65 to 74 Years | 45 (100.0%) | 53 (20.4%) |
| 75 Years and over | 52 (100.0%) | 65 (94.2%) |
Disability Class by Sex by Age in Murillo
Disability Class: Hearing Difficulty
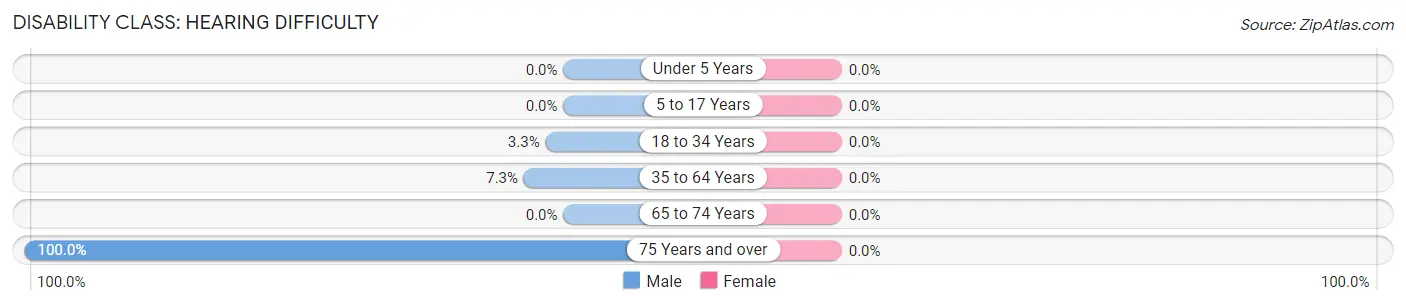
| Age Bracket | Male | Female |
| Under 5 Years | 0 (0.0%) | 0 (0.0%) |
| 5 to 17 Years | 0 (0.0%) | 0 (0.0%) |
| 18 to 34 Years | 60 (3.3%) | 0 (0.0%) |
| 35 to 64 Years | 71 (7.3%) | 0 (0.0%) |
| 65 to 74 Years | 0 (0.0%) | 0 (0.0%) |
| 75 Years and over | 52 (100.0%) | 0 (0.0%) |
Disability Class: Vision Difficulty
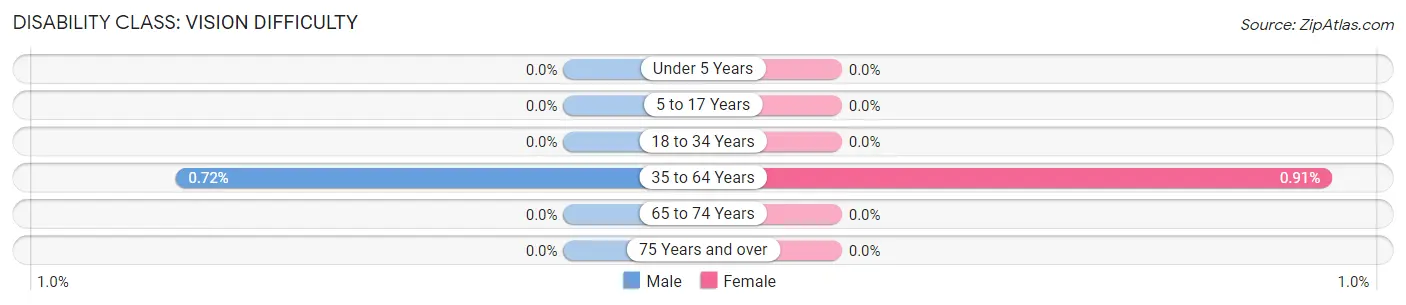
| Age Bracket | Male | Female |
| Under 5 Years | 0 (0.0%) | 0 (0.0%) |
| 5 to 17 Years | 0 (0.0%) | 0 (0.0%) |
| 18 to 34 Years | 0 (0.0%) | 0 (0.0%) |
| 35 to 64 Years | 7 (0.7%) | 11 (0.9%) |
| 65 to 74 Years | 0 (0.0%) | 0 (0.0%) |
| 75 Years and over | 0 (0.0%) | 0 (0.0%) |
Disability Class: Cognitive Difficulty
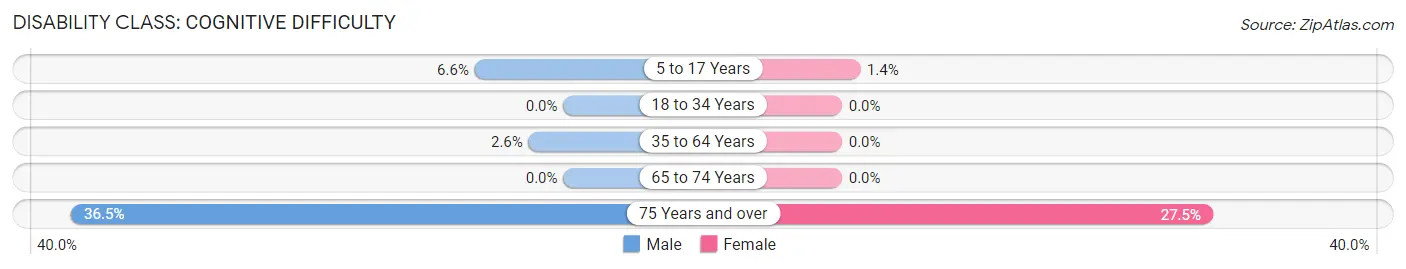
| Age Bracket | Male | Female |
| 5 to 17 Years | 73 (6.6%) | 18 (1.3%) |
| 18 to 34 Years | 0 (0.0%) | 0 (0.0%) |
| 35 to 64 Years | 25 (2.6%) | 0 (0.0%) |
| 65 to 74 Years | 0 (0.0%) | 0 (0.0%) |
| 75 Years and over | 19 (36.5%) | 19 (27.5%) |
Disability Class: Ambulatory Difficulty
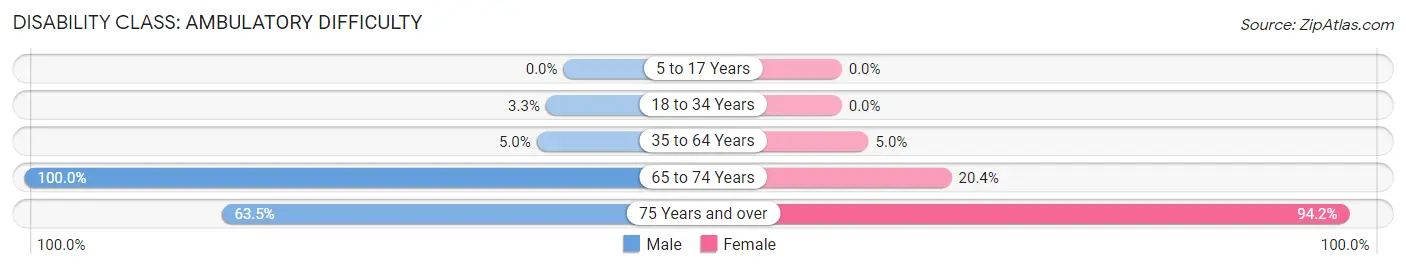
| Age Bracket | Male | Female |
| 5 to 17 Years | 0 (0.0%) | 0 (0.0%) |
| 18 to 34 Years | 59 (3.3%) | 0 (0.0%) |
| 35 to 64 Years | 48 (5.0%) | 60 (5.0%) |
| 65 to 74 Years | 45 (100.0%) | 53 (20.4%) |
| 75 Years and over | 33 (63.5%) | 65 (94.2%) |
Disability Class: Self-Care Difficulty
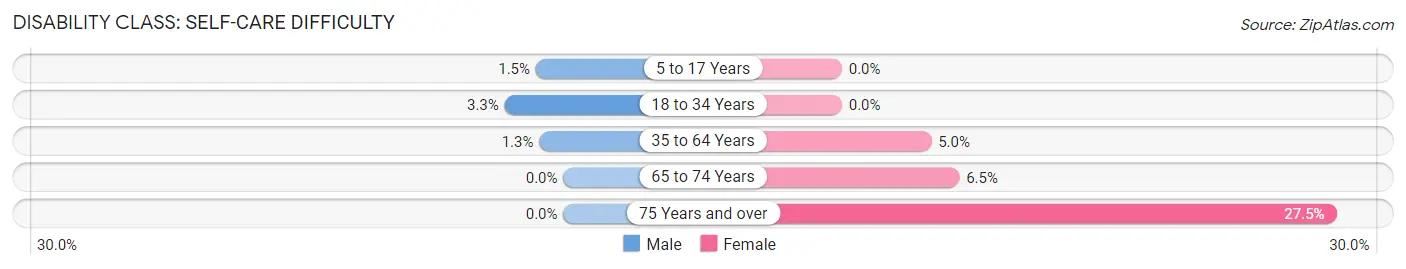
| Age Bracket | Male | Female |
| 5 to 17 Years | 17 (1.5%) | 0 (0.0%) |
| 18 to 34 Years | 59 (3.3%) | 0 (0.0%) |
| 35 to 64 Years | 13 (1.3%) | 60 (5.0%) |
| 65 to 74 Years | 0 (0.0%) | 17 (6.5%) |
| 75 Years and over | 0 (0.0%) | 19 (27.5%) |
Technology Access in Murillo
Computing Device Access in Murillo
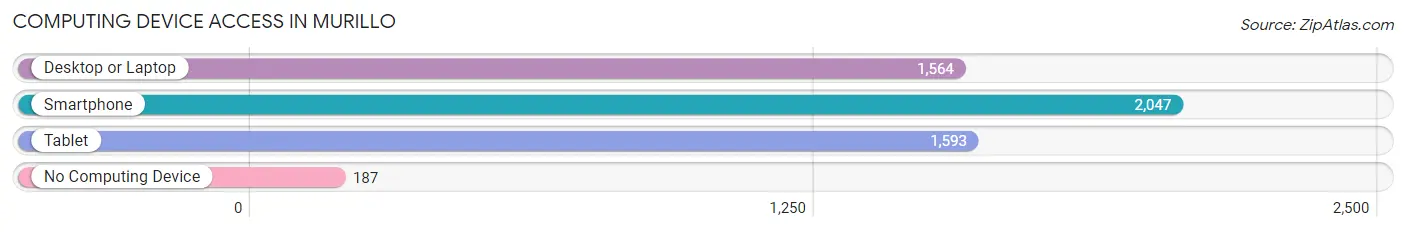
| Device Type | # Households | % Households |
| Desktop or Laptop | 1,564 | 67.2% |
| Smartphone | 2,047 | 87.9% |
| Tablet | 1,593 | 68.4% |
| No Computing Device | 187 | 8.0% |
| Total | 2,328 | 100.0% |
Internet Access in Murillo
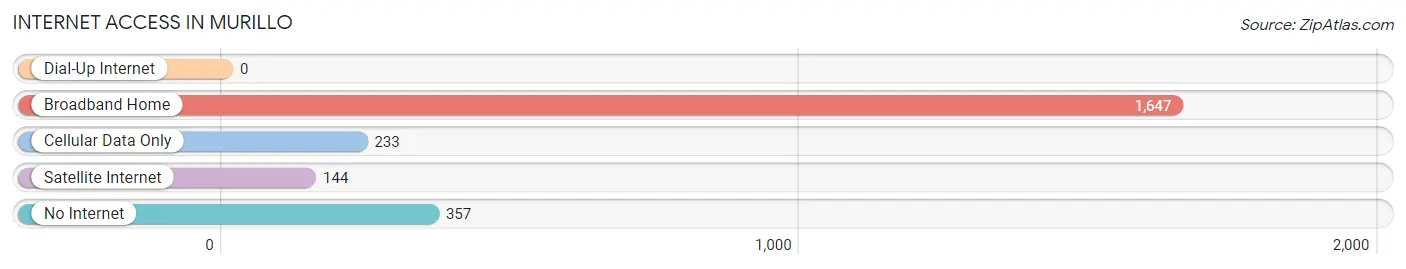
| Internet Type | # Households | % Households |
| Dial-Up Internet | 0 | 0.0% |
| Broadband Home | 1,647 | 70.8% |
| Cellular Data Only | 233 | 10.0% |
| Satellite Internet | 144 | 6.2% |
| No Internet | 357 | 15.3% |
| Total | 2,328 | 100.0% |
Murillo Summary
Murillo, Texas is a small unincorporated community located in Hidalgo County, Texas. It is situated about 10 miles south of the city of McAllen and is part of the McAllen–Edinburg–Mission Metropolitan Statistical Area. The population of Murillo was estimated to be 1,845 in 2019.
History
The area that is now Murillo was originally inhabited by the Coahuiltecan Indians. The first European settlers arrived in the area in the late 19th century. The town was founded in 1891 by a group of Mexican settlers led by Francisco Murillo. The town was named after Murillo and was originally known as “Murillo’s Ranch.”
In the early 20th century, the town began to grow and develop. The first school was built in 1910 and the first post office was established in 1911. The town was officially incorporated in 1915.
Geography
Murillo is located in Hidalgo County, Texas. It is situated about 10 miles south of the city of McAllen and is part of the McAllen–Edinburg–Mission Metropolitan Statistical Area. The town is located at an elevation of about 200 feet above sea level.
The climate in Murillo is classified as a humid subtropical climate. The average temperature in the summer is around 90°F and the average temperature in the winter is around 60°F. The average annual precipitation is around 24 inches.
Economy
The economy of Murillo is largely based on agriculture. The town is home to several farms and ranches that produce a variety of crops, including cotton, corn, sorghum, and wheat. The town is also home to several small businesses, including restaurants, grocery stores, and gas stations.
Demographics
As of 2019, the population of Murillo was estimated to be 1,845. The racial makeup of the town was 94.3% Hispanic or Latino, 4.2% White, and 1.5% other. The median household income was $30,938 and the median age was 28.
Murillo is a small, rural community with a rich history and culture. The town is home to a diverse population and is a great place to live and work. The town is also home to several small businesses and farms that provide employment opportunities for the local residents.
Common Questions
What is Per Capita Income in Murillo?
Per Capita income in Murillo is $22,985.
What is the Median Family Income in Murillo?
Median Family Income in Murillo is $76,165.
What is the Median Household income in Murillo?
Median Household Income in Murillo is $68,739.
What is Income or Wage Gap in Murillo?
Income or Wage Gap in Murillo is 20.2%.
Women in Murillo earn 79.8 cents for every dollar earned by a man.
What is Inequality or Gini Index in Murillo?
Inequality or Gini Index in Murillo is 0.44.
What is the Total Population of Murillo?
Total Population of Murillo is 8,744.
What is the Total Male Population of Murillo?
Total Male Population of Murillo is 4,351.
What is the Total Female Population of Murillo?
Total Female Population of Murillo is 4,393.
What is the Ratio of Males per 100 Females in Murillo?
There are 99.04 Males per 100 Females in Murillo.
What is the Ratio of Females per 100 Males in Murillo?
There are 100.97 Females per 100 Males in Murillo.
What is the Median Population Age in Murillo?
Median Population Age in Murillo is 24.5 Years.
What is the Average Family Size in Murillo
Average Family Size in Murillo is 4.0 People.
What is the Average Household Size in Murillo
Average Household Size in Murillo is 3.8 People.
How Large is the Labor Force in Murillo?
There are 4,056 People in the Labor Forcein in Murillo.
What is the Percentage of People in the Labor Force in Murillo?
68.4% of People are in the Labor Force in Murillo.
What is the Unemployment Rate in Murillo?
Unemployment Rate in Murillo is 7.4%.