Austwell, TX Map & Demographics
Austwell Map
Austwell Overview
$31,645
PER CAPITA INCOME
$55,114
AVG HOUSEHOLD INCOME
50.9%
WAGE / INCOME GAP [ % ]
49.1¢/ $1
WAGE / INCOME GAP [ $ ]
0.39
INEQUALITY / GINI INDEX
115
TOTAL POPULATION
79
MALE POPULATION
36
FEMALE POPULATION
219.44
MALES / 100 FEMALES
45.57
FEMALES / 100 MALES
57.7
MEDIAN AGE
2.5
AVG FAMILY SIZE
1.9
AVG HOUSEHOLD SIZE
59
LABOR FORCE [ PEOPLE ]
51.3%
PERCENT IN LABOR FORCE
3.4%
UNEMPLOYMENT RATE
Austwell Zip Codes
Austwell Area Codes
Income in Austwell
Income Overview in Austwell
| Characteristic | Number | Measure |
| Per Capita Income | 115 | $31,645 |
| Median Family Income | 31 | $0 |
| Mean Family Income | 31 | $68,323 |
| Median Household Income | 61 | $55,114 |
| Mean Household Income | 61 | $57,739 |
| Income Deficit | 31 | $0 |
| Wage / Income Gap (%) | 115 | 50.91% |
| Wage / Income Gap ($) | 115 | 49.09¢ per $1 |
| Gini / Inequality Index | 115 | 0.39 |
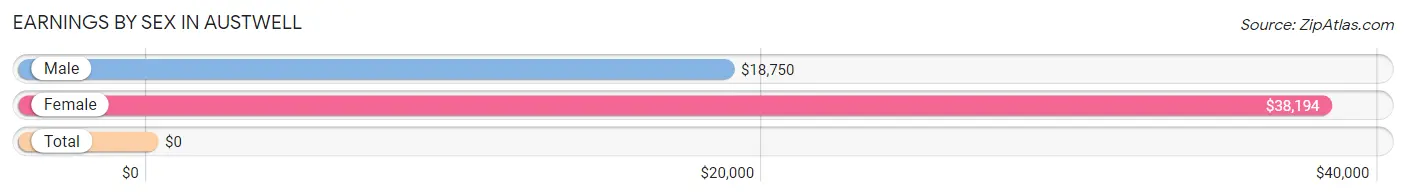
Earnings by Sex in Austwell
| Sex | Number | Average Earnings |
| Male | 41 (66.1%) | $18,750 |
| Female | 21 (33.9%) | $38,194 |
| Total | 62 (100.0%) | $0 |
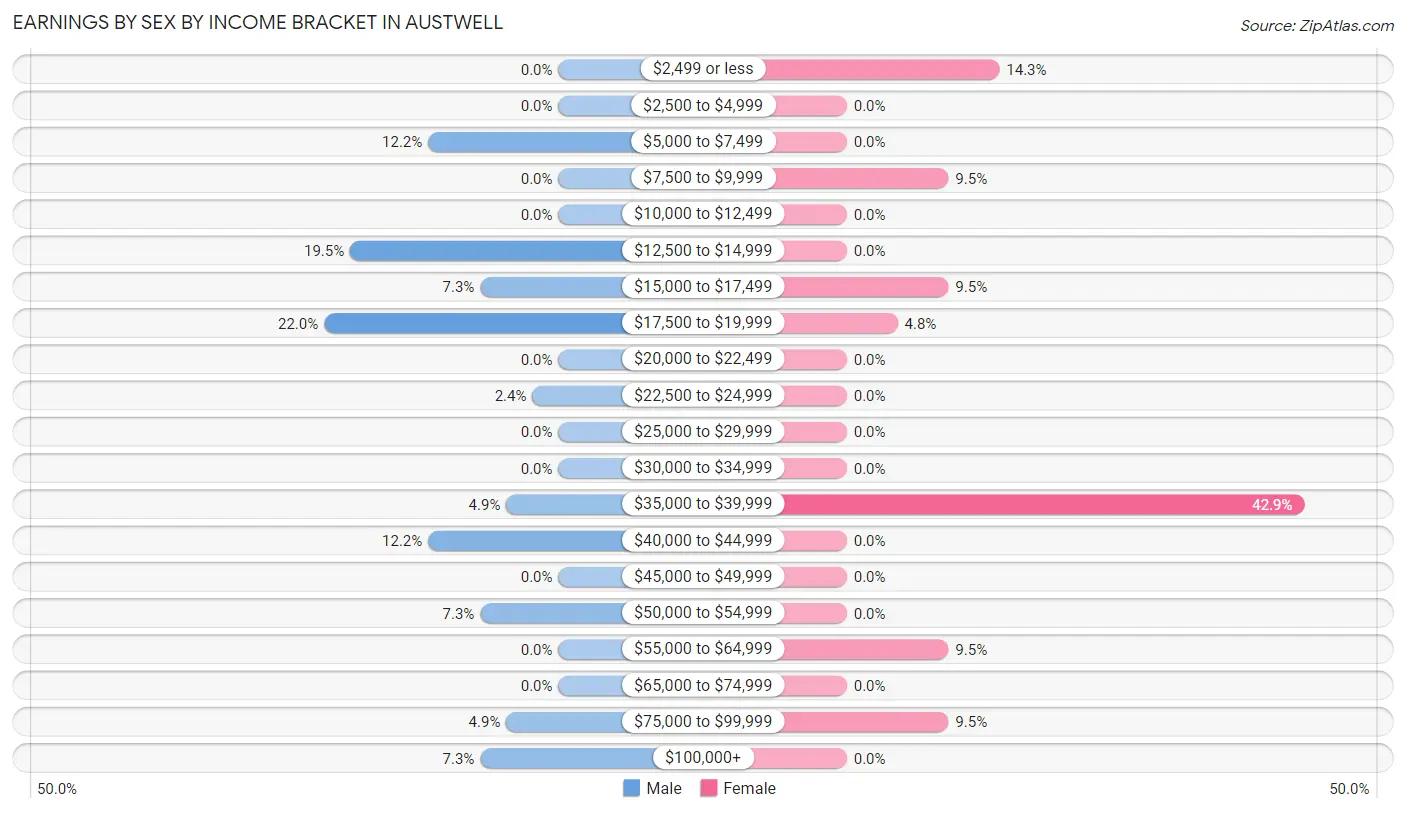
Earnings by Sex by Income Bracket in Austwell
The most common earnings brackets in Austwell are $17,500 to $19,999 for men (9 | 22.0%) and $35,000 to $39,999 for women (9 | 42.9%).
| Income | Male | Female |
| $2,499 or less | 0 (0.0%) | 3 (14.3%) |
| $2,500 to $4,999 | 0 (0.0%) | 0 (0.0%) |
| $5,000 to $7,499 | 5 (12.2%) | 0 (0.0%) |
| $7,500 to $9,999 | 0 (0.0%) | 2 (9.5%) |
| $10,000 to $12,499 | 0 (0.0%) | 0 (0.0%) |
| $12,500 to $14,999 | 8 (19.5%) | 0 (0.0%) |
| $15,000 to $17,499 | 3 (7.3%) | 2 (9.5%) |
| $17,500 to $19,999 | 9 (22.0%) | 1 (4.8%) |
| $20,000 to $22,499 | 0 (0.0%) | 0 (0.0%) |
| $22,500 to $24,999 | 1 (2.4%) | 0 (0.0%) |
| $25,000 to $29,999 | 0 (0.0%) | 0 (0.0%) |
| $30,000 to $34,999 | 0 (0.0%) | 0 (0.0%) |
| $35,000 to $39,999 | 2 (4.9%) | 9 (42.9%) |
| $40,000 to $44,999 | 5 (12.2%) | 0 (0.0%) |
| $45,000 to $49,999 | 0 (0.0%) | 0 (0.0%) |
| $50,000 to $54,999 | 3 (7.3%) | 0 (0.0%) |
| $55,000 to $64,999 | 0 (0.0%) | 2 (9.5%) |
| $65,000 to $74,999 | 0 (0.0%) | 0 (0.0%) |
| $75,000 to $99,999 | 2 (4.9%) | 2 (9.5%) |
| $100,000+ | 3 (7.3%) | 0 (0.0%) |
| Total | 41 (100.0%) | 21 (100.0%) |
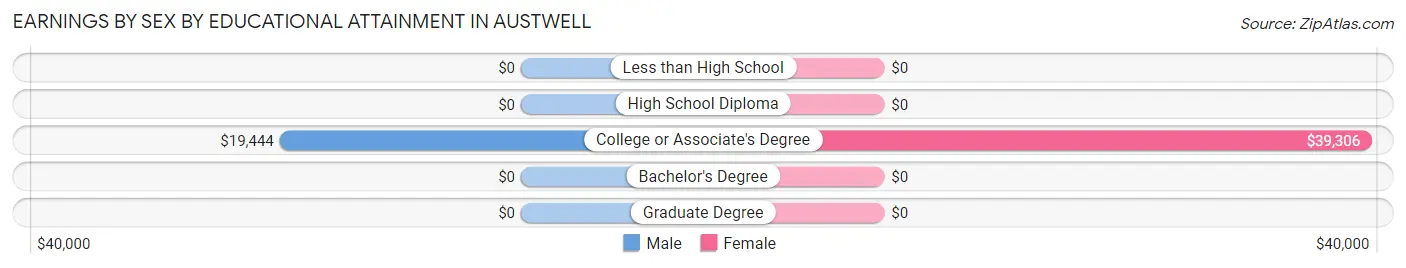
Earnings by Sex by Educational Attainment in Austwell
| Educational Attainment | Male Income | Female Income |
| Less than High School | - | - |
| High School Diploma | - | - |
| College or Associate's Degree | $19,444 | $39,306 |
| Bachelor's Degree | - | - |
| Graduate Degree | - | - |
| Total | - | - |
Family Income in Austwell
Family Income Brackets in Austwell
According to the Austwell family income data, there are 9 families falling into the $75,000 to $99,999 income range, which is the most common income bracket and makes up 29.0% of all families.
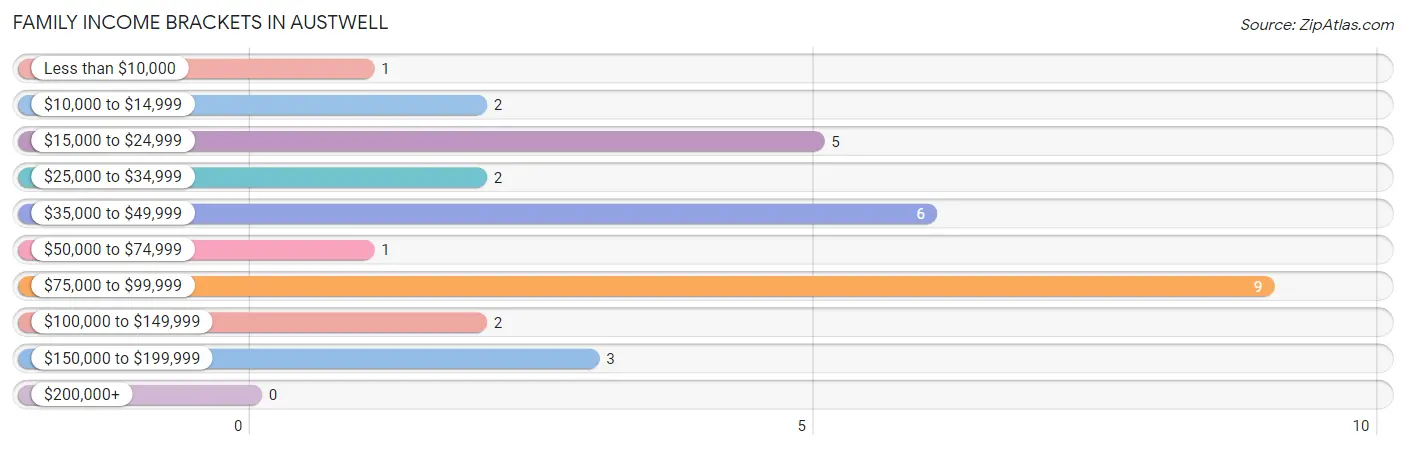
| Income Bracket | # Families | % Families |
| Less than $10,000 | 1 | 3.2% |
| $10,000 to $14,999 | 2 | 6.5% |
| $15,000 to $24,999 | 5 | 16.1% |
| $25,000 to $34,999 | 2 | 6.5% |
| $35,000 to $49,999 | 6 | 19.4% |
| $50,000 to $74,999 | 1 | 3.2% |
| $75,000 to $99,999 | 9 | 29.0% |
| $100,000 to $149,999 | 2 | 6.5% |
| $150,000 to $199,999 | 3 | 9.7% |
| $200,000+ | 0 | 0.0% |
Family Income by Famaliy Size in Austwell
2-person families (21 | 67.7%) account for the highest median family income in Austwell with $35,625 per family, while 2-person families (21 | 67.7%) have the highest median income of $17,812 per family member.
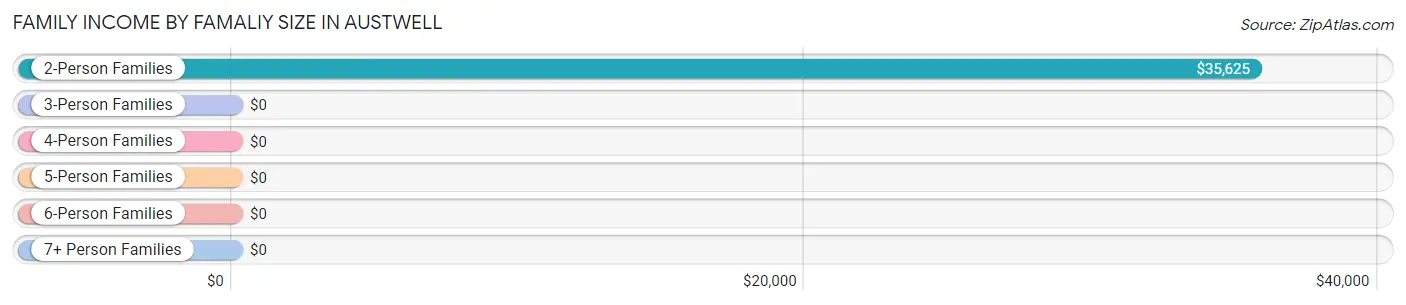
| Income Bracket | # Families | Median Income |
| 2-Person Families | 21 (67.7%) | $35,625 |
| 3-Person Families | 10 (32.3%) | $0 |
| 4-Person Families | 0 (0.0%) | $0 |
| 5-Person Families | 0 (0.0%) | $0 |
| 6-Person Families | 0 (0.0%) | $0 |
| 7+ Person Families | 0 (0.0%) | $0 |
| Total | 31 (100.0%) | $0 |
Family Income by Number of Earners in Austwell
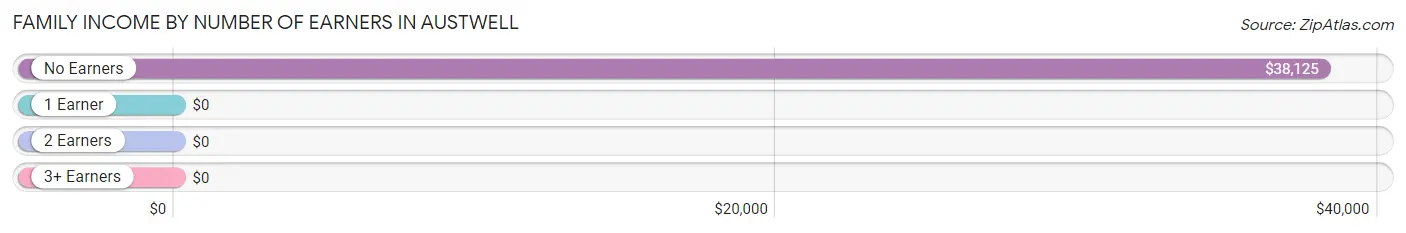
| Number of Earners | # Families | Median Income |
| No Earners | 9 (29.0%) | $38,125 |
| 1 Earner | 5 (16.1%) | $0 |
| 2 Earners | 8 (25.8%) | $0 |
| 3+ Earners | 9 (29.0%) | $0 |
| Total | 31 (100.0%) | $0 |
Household Income in Austwell
Household Income Brackets in Austwell
With 17 households falling in the category, the $50,000 to $74,999 income range is the most frequent in Austwell, accounting for 27.9% of all households.
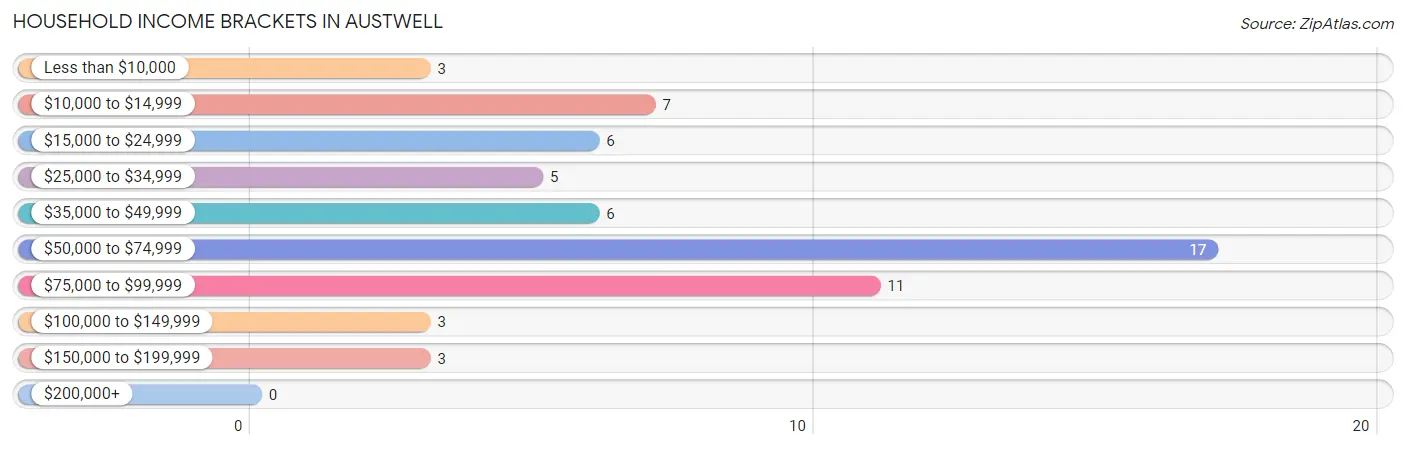
| Income Bracket | # Households | % Households |
| Less than $10,000 | 3 | 4.9% |
| $10,000 to $14,999 | 7 | 11.5% |
| $15,000 to $24,999 | 6 | 9.8% |
| $25,000 to $34,999 | 5 | 8.2% |
| $35,000 to $49,999 | 6 | 9.8% |
| $50,000 to $74,999 | 17 | 27.9% |
| $75,000 to $99,999 | 11 | 18.0% |
| $100,000 to $149,999 | 3 | 4.9% |
| $150,000 to $199,999 | 3 | 4.9% |
| $200,000+ | 0 | 0.0% |
Household Income by Householder Age in Austwell
The median household income in Austwell is $55,114, with the highest median household income of $55,114 found in the 65+ years age bracket for the primary householder. A total of 39 households (63.9%) fall into this category.
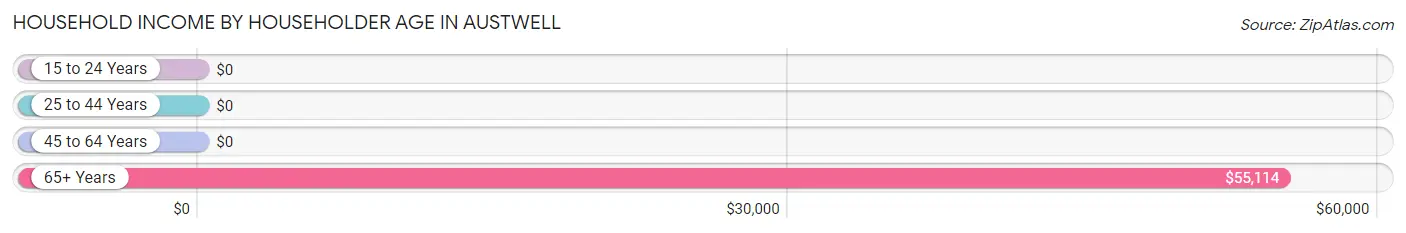
| Income Bracket | # Households | Median Income |
| 15 to 24 Years | 0 (0.0%) | $0 |
| 25 to 44 Years | 0 (0.0%) | $0 |
| 45 to 64 Years | 22 (36.1%) | $0 |
| 65+ Years | 39 (63.9%) | $55,114 |
| Total | 61 (100.0%) | $55,114 |
Poverty in Austwell
Income Below Poverty by Sex and Age in Austwell
With 5.1% poverty level for males and 11.1% for females among the residents of Austwell, 55 to 64 year old males and 75 year old and over females are the most vulnerable to poverty, with 4 males (36.4%) and 2 females (28.6%) in their respective age groups living below the poverty level.
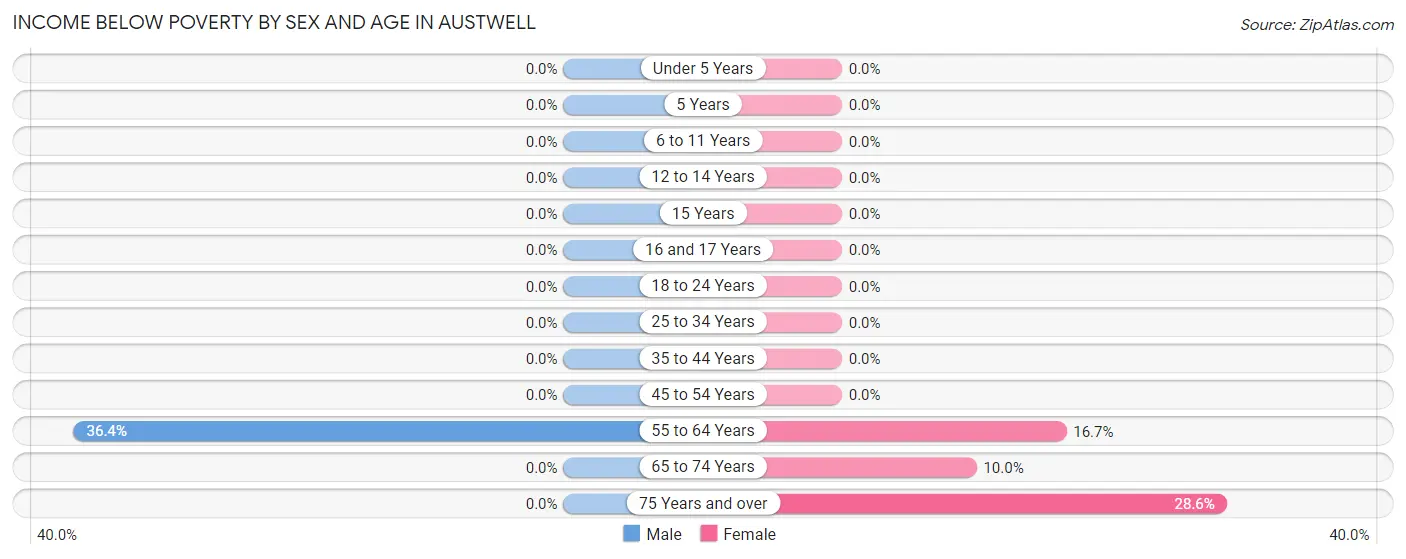
| Age Bracket | Male | Female |
| Under 5 Years | 0 (0.0%) | 0 (0.0%) |
| 5 Years | 0 (0.0%) | 0 (0.0%) |
| 6 to 11 Years | 0 (0.0%) | 0 (0.0%) |
| 12 to 14 Years | 0 (0.0%) | 0 (0.0%) |
| 15 Years | 0 (0.0%) | 0 (0.0%) |
| 16 and 17 Years | 0 (0.0%) | 0 (0.0%) |
| 18 to 24 Years | 0 (0.0%) | 0 (0.0%) |
| 25 to 34 Years | 0 (0.0%) | 0 (0.0%) |
| 35 to 44 Years | 0 (0.0%) | 0 (0.0%) |
| 45 to 54 Years | 0 (0.0%) | 0 (0.0%) |
| 55 to 64 Years | 4 (36.4%) | 1 (16.7%) |
| 65 to 74 Years | 0 (0.0%) | 1 (10.0%) |
| 75 Years and over | 0 (0.0%) | 2 (28.6%) |
| Total | 4 (5.1%) | 4 (11.1%) |
Income Above Poverty by Sex and Age in Austwell
According to the poverty statistics in Austwell, males aged 18 to 24 years and females aged 45 to 54 years are the age groups that are most secure financially, with 100.0% of males and 100.0% of females in these age groups living above the poverty line.
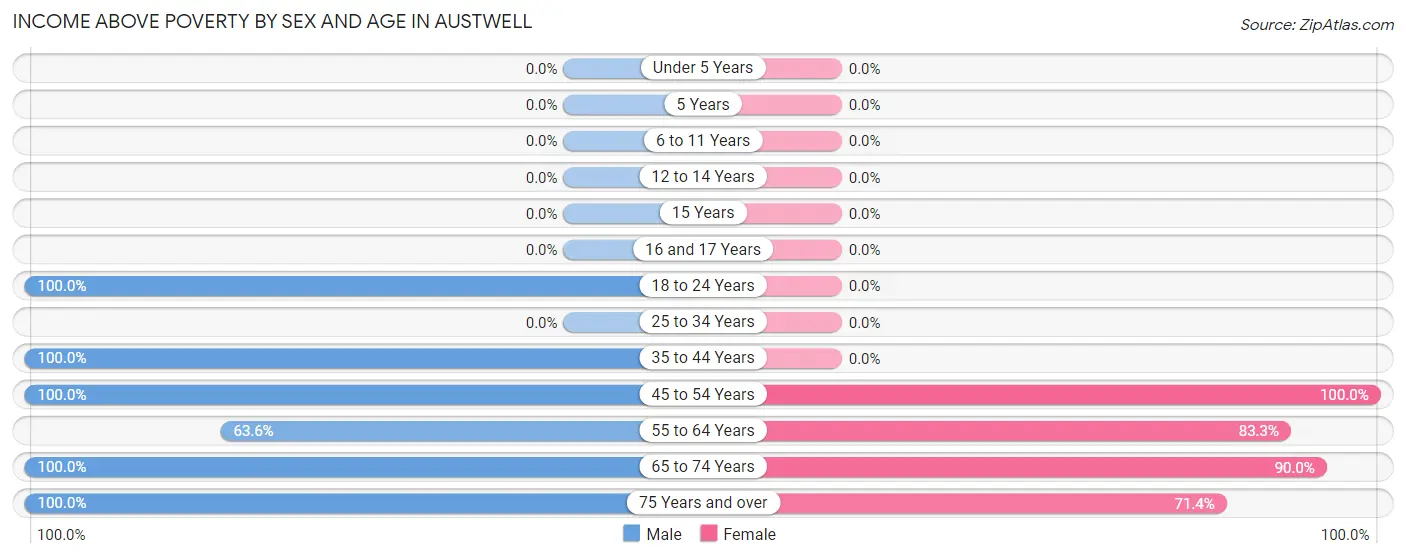
| Age Bracket | Male | Female |
| Under 5 Years | 0 (0.0%) | 0 (0.0%) |
| 5 Years | 0 (0.0%) | 0 (0.0%) |
| 6 to 11 Years | 0 (0.0%) | 0 (0.0%) |
| 12 to 14 Years | 0 (0.0%) | 0 (0.0%) |
| 15 Years | 0 (0.0%) | 0 (0.0%) |
| 16 and 17 Years | 0 (0.0%) | 0 (0.0%) |
| 18 to 24 Years | 8 (100.0%) | 0 (0.0%) |
| 25 to 34 Years | 0 (0.0%) | 0 (0.0%) |
| 35 to 44 Years | 8 (100.0%) | 0 (0.0%) |
| 45 to 54 Years | 23 (100.0%) | 13 (100.0%) |
| 55 to 64 Years | 7 (63.6%) | 5 (83.3%) |
| 65 to 74 Years | 17 (100.0%) | 9 (90.0%) |
| 75 Years and over | 12 (100.0%) | 5 (71.4%) |
| Total | 75 (94.9%) | 32 (88.9%) |
Income Below Poverty Among Married-Couple Families in Austwell
The poverty statistics for married-couple families in Austwell show that 10.7% or 3 of the total 28 families live below the poverty line. Families with no children have the highest poverty rate of 10.7%, comprising of 3 families. On the other hand, families with no children have the lowest poverty rate of 10.7%, which includes 3 families.
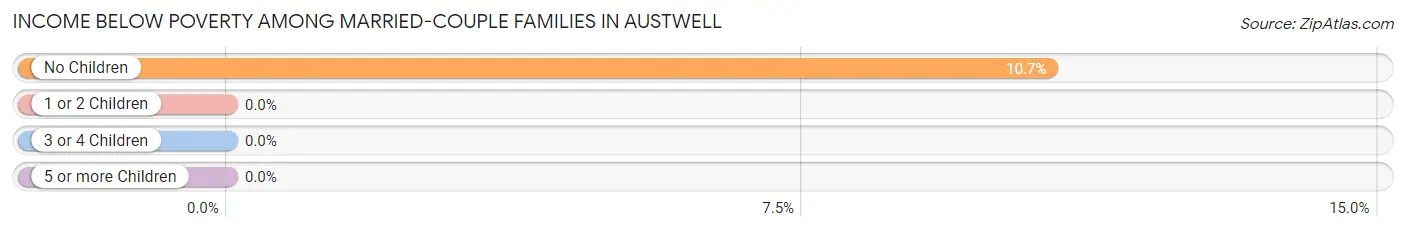
| Children | Above Poverty | Below Poverty |
| No Children | 25 (89.3%) | 3 (10.7%) |
| 1 or 2 Children | 0 (0.0%) | 0 (0.0%) |
| 3 or 4 Children | 0 (0.0%) | 0 (0.0%) |
| 5 or more Children | 0 (0.0%) | 0 (0.0%) |
| Total | 25 (89.3%) | 3 (10.7%) |
Income Below Poverty Among Single-Parent Households in Austwell
| Children | Single Father | Single Mother |
| No Children | 0 (0.0%) | 0 (0.0%) |
| 1 or 2 Children | 0 (0.0%) | 0 (0.0%) |
| 3 or 4 Children | 0 (0.0%) | 0 (0.0%) |
| 5 or more Children | 0 (0.0%) | 0 (0.0%) |
| Total | 0 (0.0%) | 0 (0.0%) |
Income Below Poverty Among Married-Couple vs Single-Parent Households in Austwell
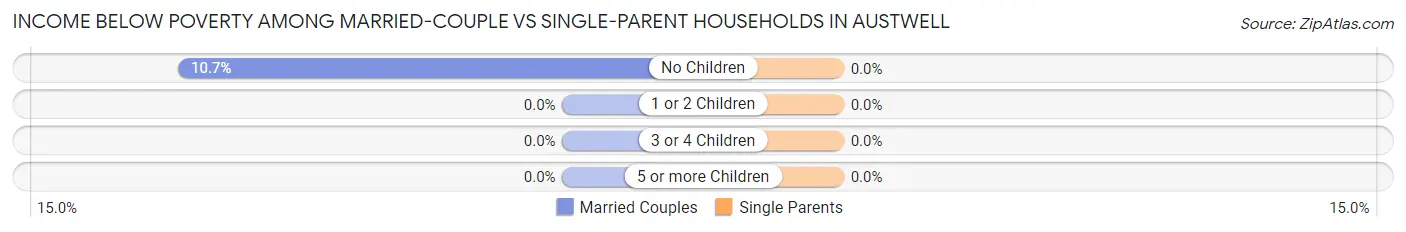
| Children | Married-Couple Families | Single-Parent Households |
| No Children | 3 (10.7%) | 0 (0.0%) |
| 1 or 2 Children | 0 (0.0%) | 0 (0.0%) |
| 3 or 4 Children | 0 (0.0%) | 0 (0.0%) |
| 5 or more Children | 0 (0.0%) | 0 (0.0%) |
| Total | 3 (10.7%) | 0 (0.0%) |
Race in Austwell
The most populous races in Austwell are White / Caucasian (79 | 68.7%), Hispanic or Latino (37 | 32.2%), and Two or more Races (12 | 10.4%).
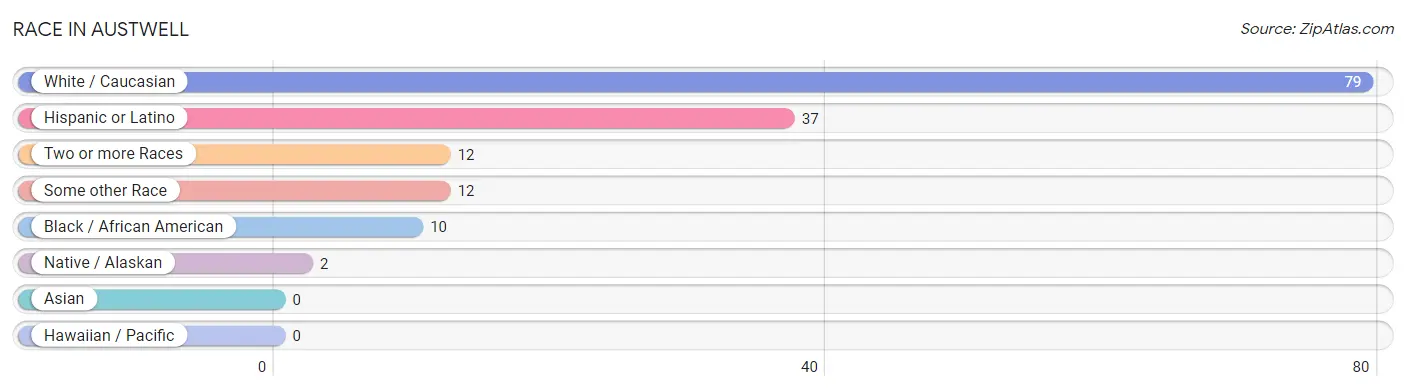
| Race | # Population | % Population |
| Asian | 0 | 0.0% |
| Black / African American | 10 | 8.7% |
| Hawaiian / Pacific | 0 | 0.0% |
| Hispanic or Latino | 37 | 32.2% |
| Native / Alaskan | 2 | 1.7% |
| White / Caucasian | 79 | 68.7% |
| Two or more Races | 12 | 10.4% |
| Some other Race | 12 | 10.4% |
| Total | 115 | 100.0% |
Ancestry in Austwell
The most populous ancestries reported in Austwell are Mexican (36 | 31.3%), German (25 | 21.7%), Czech (17 | 14.8%), Polish (17 | 14.8%), and American (8 | 7.0%), together accounting for 89.6% of all Austwell residents.
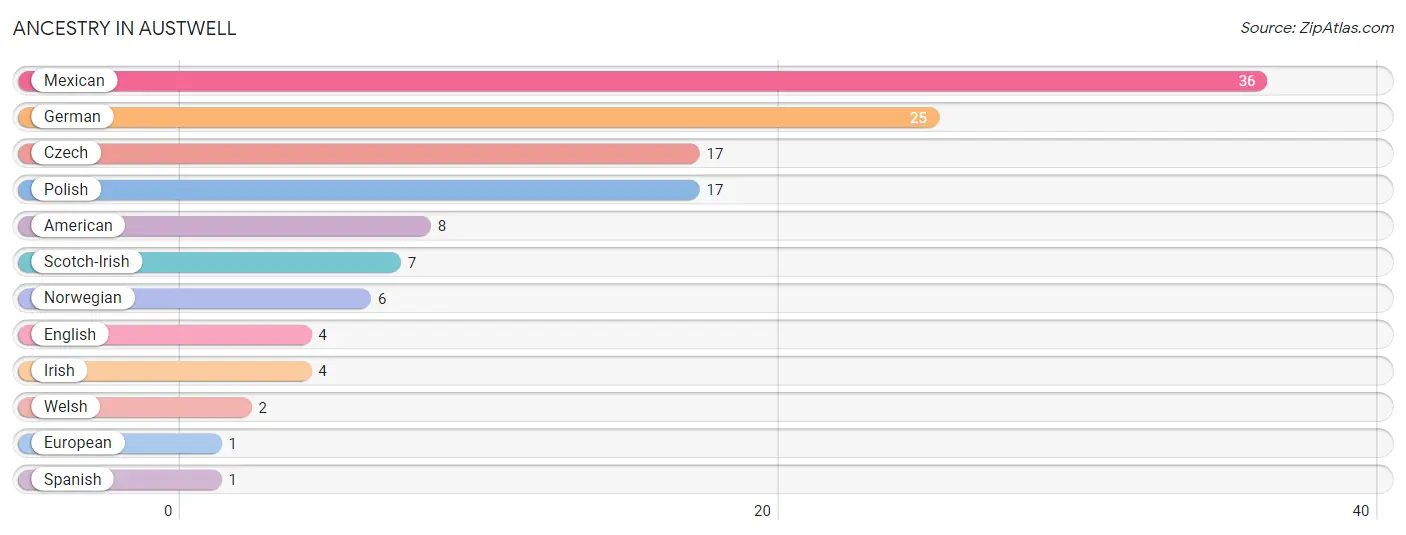
| Ancestry | # Population | % Population |
| American | 8 | 7.0% |
| Czech | 17 | 14.8% |
| English | 4 | 3.5% |
| European | 1 | 0.9% |
| German | 25 | 21.7% |
| Irish | 4 | 3.5% |
| Mexican | 36 | 31.3% |
| Norwegian | 6 | 5.2% |
| Polish | 17 | 14.8% |
| Scotch-Irish | 7 | 6.1% |
| Spanish | 1 | 0.9% |
| Welsh | 2 | 1.7% | View All 12 Rows |
Immigrants in Austwell

| Immigration Origin | # Population | % Population | View All 0 Rows |
Sex and Age in Austwell
Sex and Age in Austwell
The most populous age groups in Austwell are 70 to 74 Years (16 | 20.3%) for men and 50 to 54 Years (13 | 36.1%) for women.
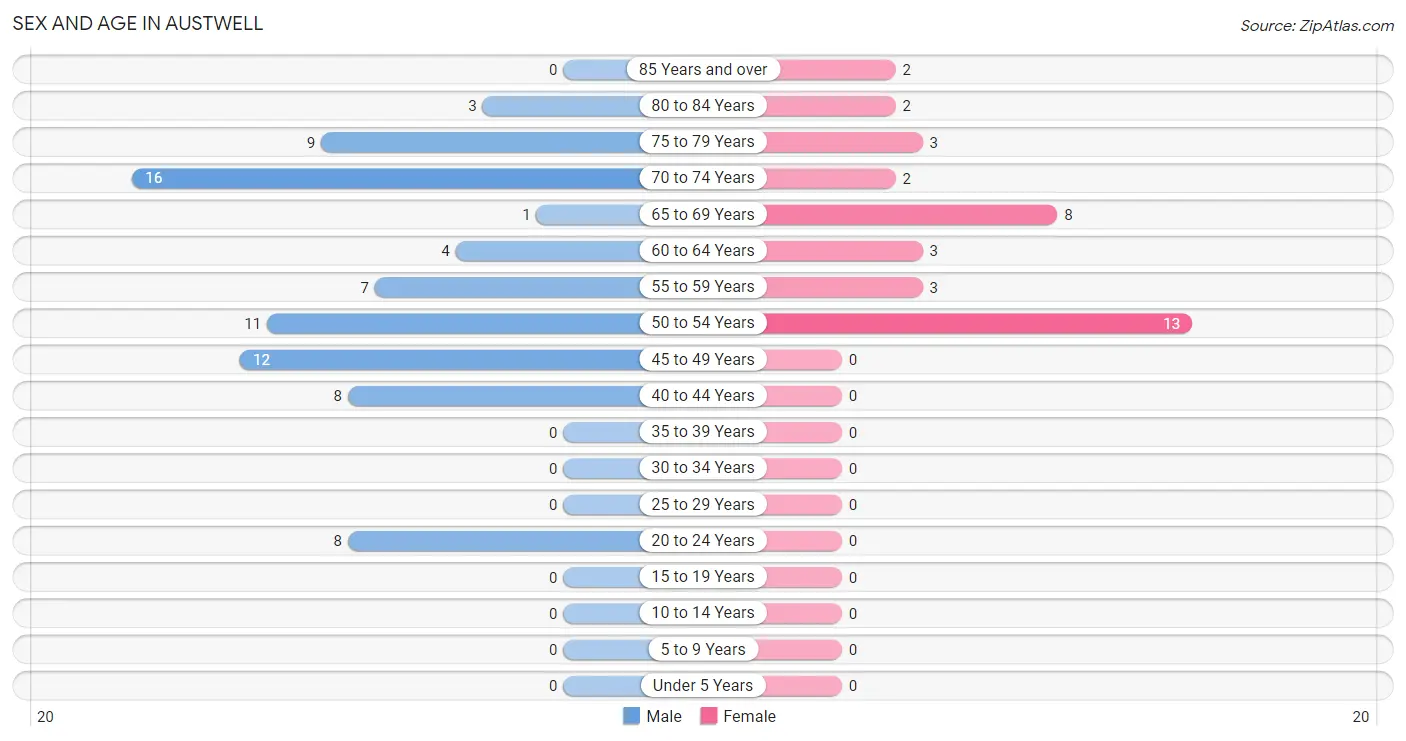
| Age Bracket | Male | Female |
| Under 5 Years | 0 (0.0%) | 0 (0.0%) |
| 5 to 9 Years | 0 (0.0%) | 0 (0.0%) |
| 10 to 14 Years | 0 (0.0%) | 0 (0.0%) |
| 15 to 19 Years | 0 (0.0%) | 0 (0.0%) |
| 20 to 24 Years | 8 (10.1%) | 0 (0.0%) |
| 25 to 29 Years | 0 (0.0%) | 0 (0.0%) |
| 30 to 34 Years | 0 (0.0%) | 0 (0.0%) |
| 35 to 39 Years | 0 (0.0%) | 0 (0.0%) |
| 40 to 44 Years | 8 (10.1%) | 0 (0.0%) |
| 45 to 49 Years | 12 (15.2%) | 0 (0.0%) |
| 50 to 54 Years | 11 (13.9%) | 13 (36.1%) |
| 55 to 59 Years | 7 (8.9%) | 3 (8.3%) |
| 60 to 64 Years | 4 (5.1%) | 3 (8.3%) |
| 65 to 69 Years | 1 (1.3%) | 8 (22.2%) |
| 70 to 74 Years | 16 (20.3%) | 2 (5.6%) |
| 75 to 79 Years | 9 (11.4%) | 3 (8.3%) |
| 80 to 84 Years | 3 (3.8%) | 2 (5.6%) |
| 85 Years and over | 0 (0.0%) | 2 (5.6%) |
| Total | 79 (100.0%) | 36 (100.0%) |
Families and Households in Austwell
Median Family Size in Austwell
The median family size in Austwell is 2.52 persons per family, with single female/mother families (1 | 3.2%) accounting for the largest median family size of 6 persons per family. On the other hand, married-couple families (28 | 90.3%) represent the smallest median family size with 2.29 persons per family.
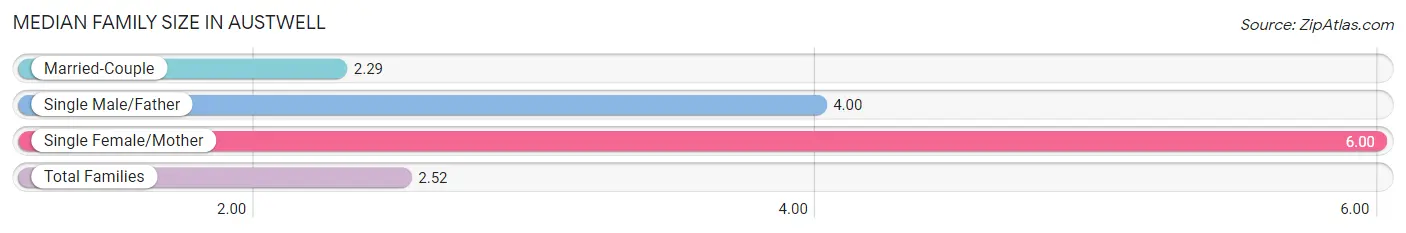
| Family Type | # Families | Family Size |
| Married-Couple | 28 (90.3%) | 2.29 |
| Single Male/Father | 2 (6.5%) | 4.00 |
| Single Female/Mother | 1 (3.2%) | 6.00 |
| Total Families | 31 (100.0%) | 2.52 |
Median Household Size in Austwell
The median household size in Austwell is 1.89 persons per household, with single male/father households (2 | 3.3%) accounting for the largest median household size of 6.5 persons per household. non-family households (30 | 49.2%) represent the smallest median household size with 1.07 persons per household.
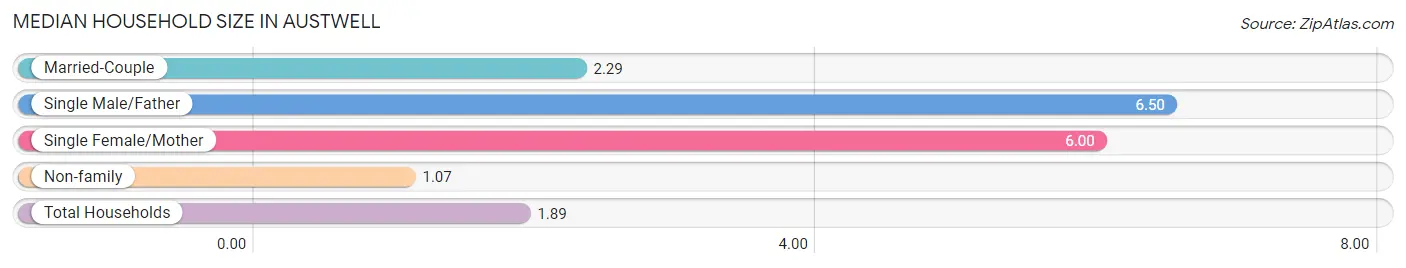
| Household Type | # Households | Household Size |
| Married-Couple | 28 (45.9%) | 2.29 |
| Single Male/Father | 2 (3.3%) | 6.50 |
| Single Female/Mother | 1 (1.6%) | 6.00 |
| Non-family | 30 (49.2%) | 1.07 |
| Total Households | 61 (100.0%) | 1.89 |
Household Size by Marriage Status in Austwell
Out of a total of 61 households in Austwell, 31 (50.8%) are family households, while 30 (49.2%) are nonfamily households. The most numerous type of family households are 2-person households, comprising 19, and the most common type of nonfamily households are 1-person households, comprising 29.
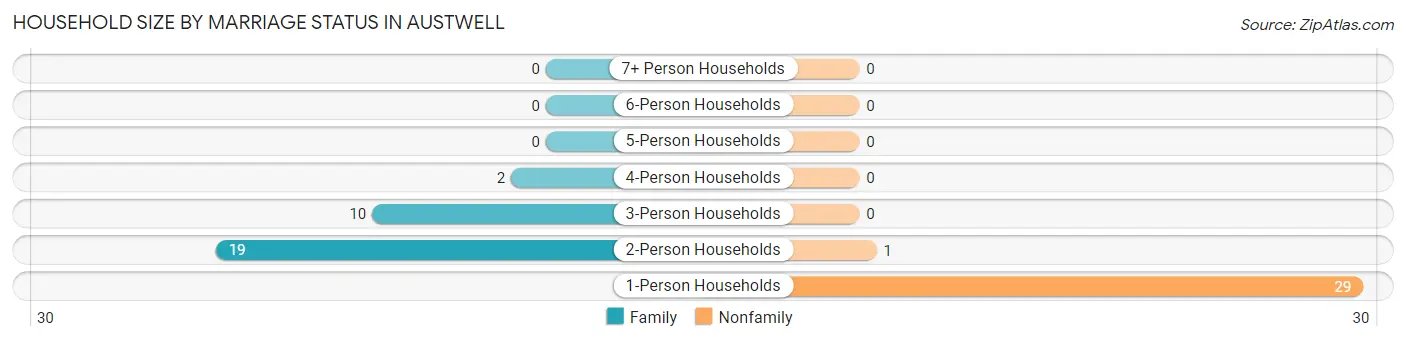
| Household Size | Family Households | Nonfamily Households |
| 1-Person Households | - | 29 (47.5%) |
| 2-Person Households | 19 (31.1%) | 1 (1.6%) |
| 3-Person Households | 10 (16.4%) | 0 (0.0%) |
| 4-Person Households | 2 (3.3%) | 0 (0.0%) |
| 5-Person Households | 0 (0.0%) | 0 (0.0%) |
| 6-Person Households | 0 (0.0%) | 0 (0.0%) |
| 7+ Person Households | 0 (0.0%) | 0 (0.0%) |
| Total | 31 (50.8%) | 30 (49.2%) |
Female Fertility in Austwell
Fertility by Age in Austwell
| Age Bracket | Women with Births | Births / 1,000 Women |
| 15 to 19 years | 0 (0.0%) | 0.0 |
| 20 to 34 years | 0 (0.0%) | 0.0 |
| 35 to 50 years | 0 (0.0%) | 0.0 |
| Total | 0 (0.0%) | 0.0 |
Fertility by Age by Marriage Status in Austwell
| Age Bracket | Married | Unmarried |
| 15 to 19 years | 0 (0.0%) | 0 (0.0%) |
| 20 to 34 years | 0 (0.0%) | 0 (0.0%) |
| 35 to 50 years | 0 (0.0%) | 0 (0.0%) |
| Total | 0 (0.0%) | 0 (0.0%) |
Fertility by Education in Austwell
| Educational Attainment | Women with Births | Births / 1,000 Women |
| Less than High School | 0 (0.0%) | 0.0 |
| High School Diploma | 0 (0.0%) | 0.0 |
| College or Associate's Degree | 0 (0.0%) | 0.0 |
| Bachelor's Degree | 0 (0.0%) | 0.0 |
| Graduate Degree | 0 (0.0%) | 0.0 |
| Total | 0 (0.0%) | 0.0 |
Fertility by Education by Marriage Status in Austwell
| Educational Attainment | Married | Unmarried |
| Less than High School | 0 (0.0%) | 0 (0.0%) |
| High School Diploma | 0 (0.0%) | 0 (0.0%) |
| College or Associate's Degree | 0 (0.0%) | 0 (0.0%) |
| Bachelor's Degree | 0 (0.0%) | 0 (0.0%) |
| Graduate Degree | 0 (0.0%) | 0 (0.0%) |
| Total | 0 (0.0%) | 0 (0.0%) |
Employment Characteristics in Austwell
Employment by Class of Employer in Austwell
Among the 57 employed individuals in Austwell, private company employees (40 | 70.2%), self-employed (not incorporated) (7 | 12.3%), and self-employed (incorporated) (5 | 8.8%) make up the most common classes of employment.
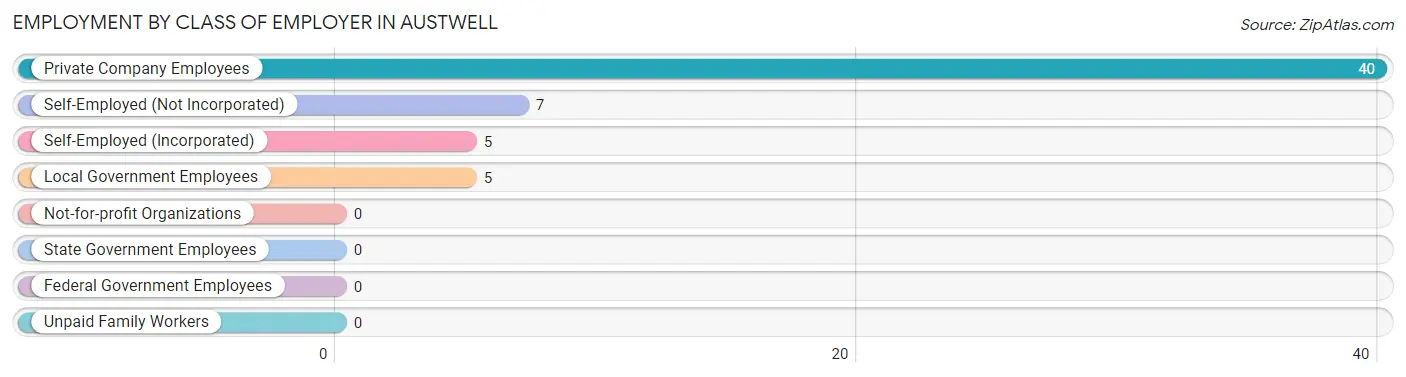
| Employer Class | # Employees | % Employees |
| Private Company Employees | 40 | 70.2% |
| Self-Employed (Incorporated) | 5 | 8.8% |
| Self-Employed (Not Incorporated) | 7 | 12.3% |
| Not-for-profit Organizations | 0 | 0.0% |
| Local Government Employees | 5 | 8.8% |
| State Government Employees | 0 | 0.0% |
| Federal Government Employees | 0 | 0.0% |
| Unpaid Family Workers | 0 | 0.0% |
| Total | 57 | 100.0% |
Employment Status by Age in Austwell
According to the labor force statistics for Austwell, out of the total population over 16 years of age (115), 51.3% or 59 individuals are in the labor force, with 3.4% or 2 of them unemployed. The age group with the highest labor force participation rate is 20 to 24 years, with 100.0% or 8 individuals in the labor force. Within the labor force, the 65 to 74 years age range has the highest percentage of unemployed individuals, with 100.0% or 2 of them being unemployed.
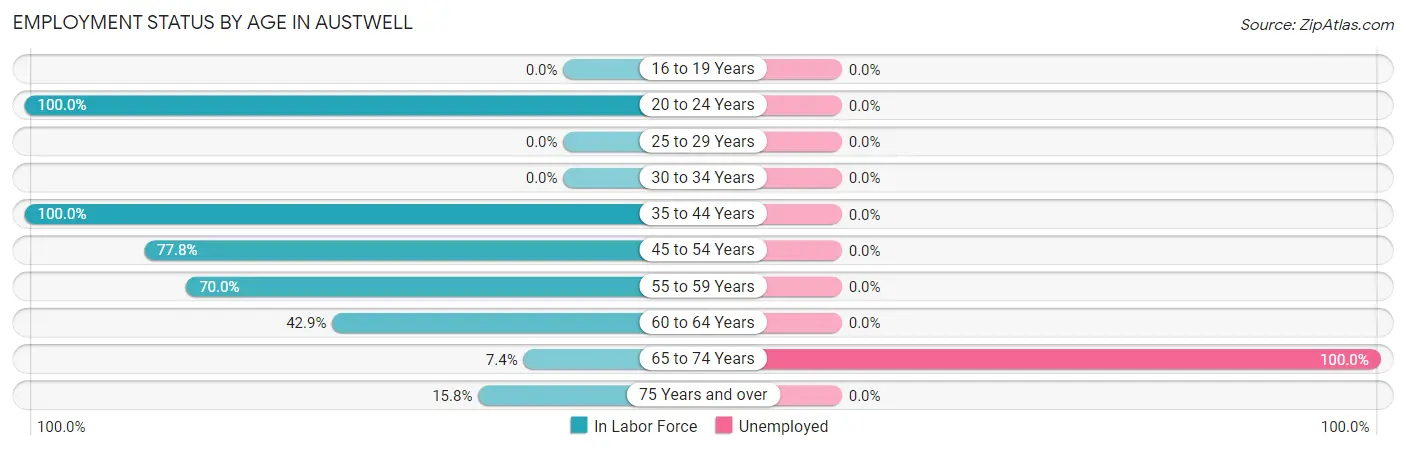
| Age Bracket | In Labor Force | Unemployed |
| 16 to 19 Years | 0 (0.0%) | 0 (0.0%) |
| 20 to 24 Years | 8 (100.0%) | 0 (0.0%) |
| 25 to 29 Years | 0 (0.0%) | 0 (0.0%) |
| 30 to 34 Years | 0 (0.0%) | 0 (0.0%) |
| 35 to 44 Years | 8 (100.0%) | 0 (0.0%) |
| 45 to 54 Years | 28 (77.8%) | 0 (0.0%) |
| 55 to 59 Years | 7 (70.0%) | 0 (0.0%) |
| 60 to 64 Years | 3 (42.9%) | 0 (0.0%) |
| 65 to 74 Years | 2 (7.4%) | 2 (100.0%) |
| 75 Years and over | 3 (15.8%) | 0 (0.0%) |
| Total | 59 (51.3%) | 2 (3.4%) |
Employment Status by Educational Attainment in Austwell
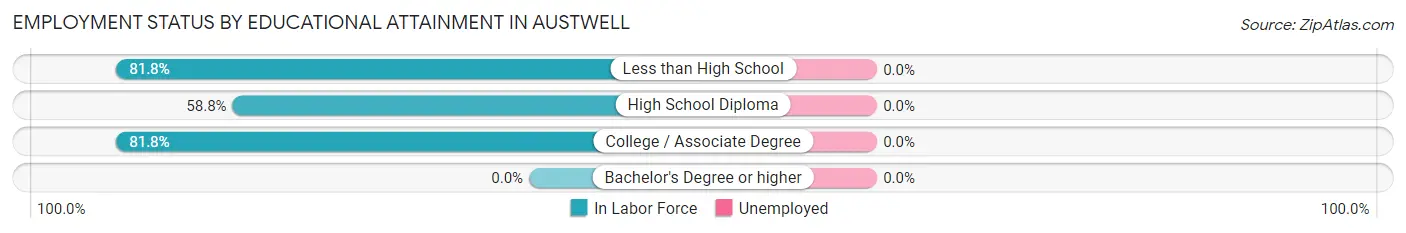
| Educational Attainment | In Labor Force | Unemployed |
| Less than High School | 9 (81.8%) | 0 (0.0%) |
| High School Diploma | 10 (58.8%) | 0 (0.0%) |
| College / Associate Degree | 27 (81.8%) | 0 (0.0%) |
| Bachelor's Degree or higher | 0 (0.0%) | 0 (0.0%) |
| Total | 46 (75.4%) | 0 (0.0%) |
Employment Occupations by Sex in Austwell
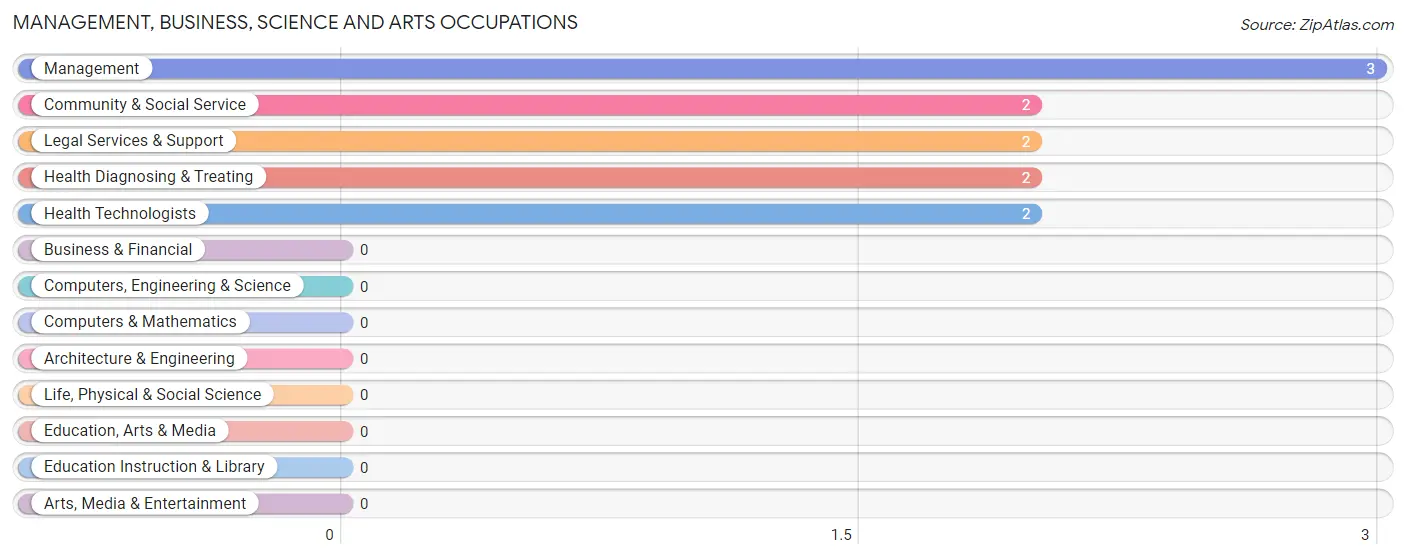
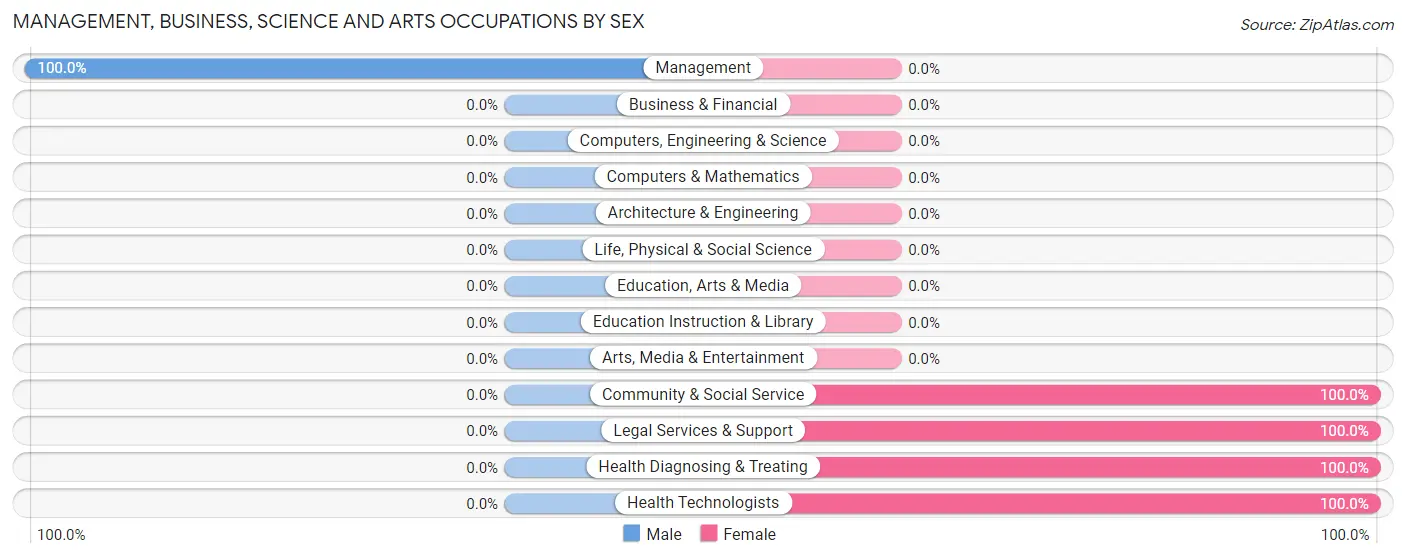
Management, Business, Science and Arts Occupations
The most common Management, Business, Science and Arts occupations in Austwell are Management (3 | 5.3%), Community & Social Service (2 | 3.5%), Legal Services & Support (2 | 3.5%), Health Diagnosing & Treating (2 | 3.5%), and Health Technologists (2 | 3.5%).
Management, Business, Science and Arts Occupations by Sex
| Occupation | Male | Female |
| Management | 3 (100.0%) | 0 (0.0%) |
| Business & Financial | 0 (0.0%) | 0 (0.0%) |
| Computers, Engineering & Science | 0 (0.0%) | 0 (0.0%) |
| Computers & Mathematics | 0 (0.0%) | 0 (0.0%) |
| Architecture & Engineering | 0 (0.0%) | 0 (0.0%) |
| Life, Physical & Social Science | 0 (0.0%) | 0 (0.0%) |
| Community & Social Service | 0 (0.0%) | 2 (100.0%) |
| Education, Arts & Media | 0 (0.0%) | 0 (0.0%) |
| Legal Services & Support | 0 (0.0%) | 2 (100.0%) |
| Education Instruction & Library | 0 (0.0%) | 0 (0.0%) |
| Arts, Media & Entertainment | 0 (0.0%) | 0 (0.0%) |
| Health Diagnosing & Treating | 0 (0.0%) | 2 (100.0%) |
| Health Technologists | 0 (0.0%) | 2 (100.0%) |
| Total (Category) | 3 (42.9%) | 4 (57.1%) |
| Total (Overall) | 39 (68.4%) | 18 (31.6%) |
Services Occupations
The most common Services occupations in Austwell are , and Cleaning & Maintenance (3 | 5.3%).
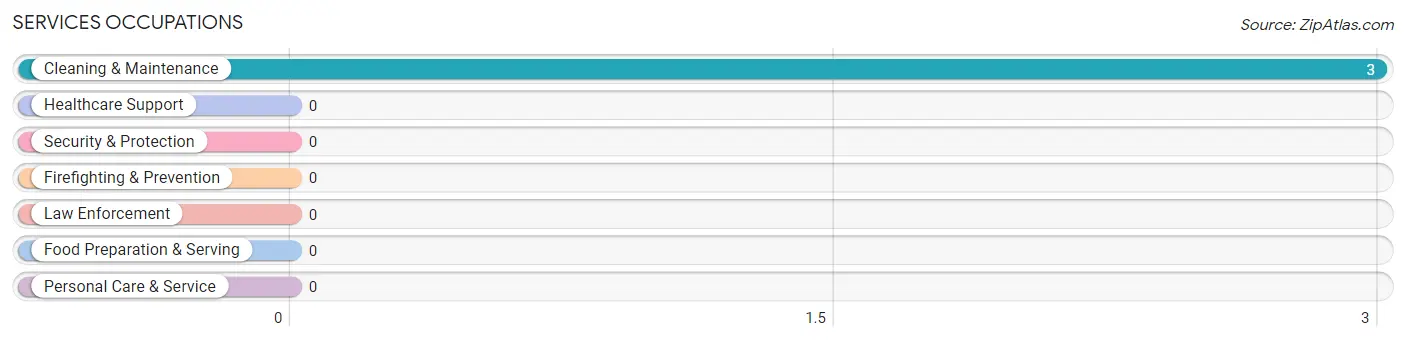
Services Occupations by Sex
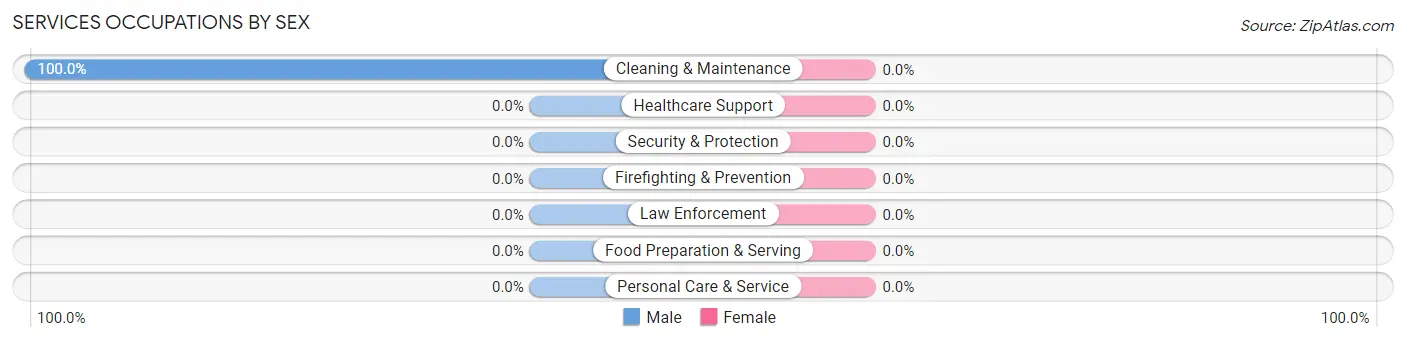
| Occupation | Male | Female |
| Healthcare Support | 0 (0.0%) | 0 (0.0%) |
| Security & Protection | 0 (0.0%) | 0 (0.0%) |
| Firefighting & Prevention | 0 (0.0%) | 0 (0.0%) |
| Law Enforcement | 0 (0.0%) | 0 (0.0%) |
| Food Preparation & Serving | 0 (0.0%) | 0 (0.0%) |
| Cleaning & Maintenance | 3 (100.0%) | 0 (0.0%) |
| Personal Care & Service | 0 (0.0%) | 0 (0.0%) |
| Total (Category) | 3 (100.0%) | 0 (0.0%) |
| Total (Overall) | 39 (68.4%) | 18 (31.6%) |
Sales and Office Occupations
The most common Sales and Office occupations in Austwell are Office & Administration (14 | 24.6%), and Sales & Related (7 | 12.3%).
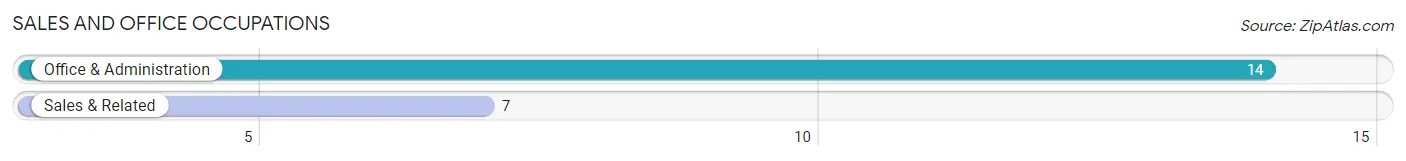
Sales and Office Occupations by Sex
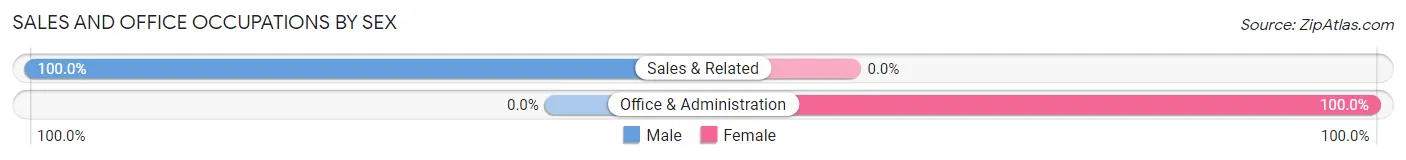
| Occupation | Male | Female |
| Sales & Related | 7 (100.0%) | 0 (0.0%) |
| Office & Administration | 0 (0.0%) | 14 (100.0%) |
| Total (Category) | 7 (33.3%) | 14 (66.7%) |
| Total (Overall) | 39 (68.4%) | 18 (31.6%) |
Natural Resources, Construction and Maintenance Occupations
The most common Natural Resources, Construction and Maintenance occupations in Austwell are , and Construction & Extraction (23 | 40.4%).
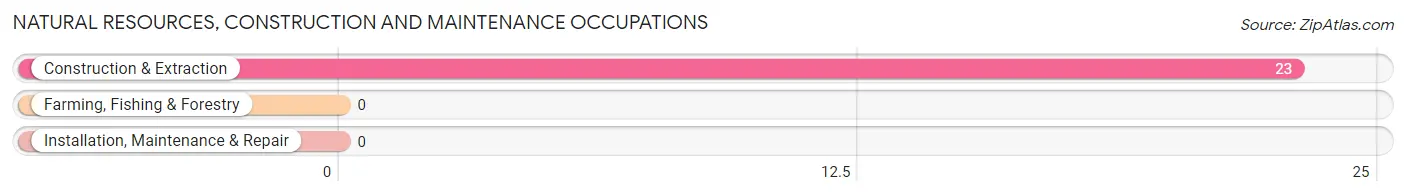
Natural Resources, Construction and Maintenance Occupations by Sex
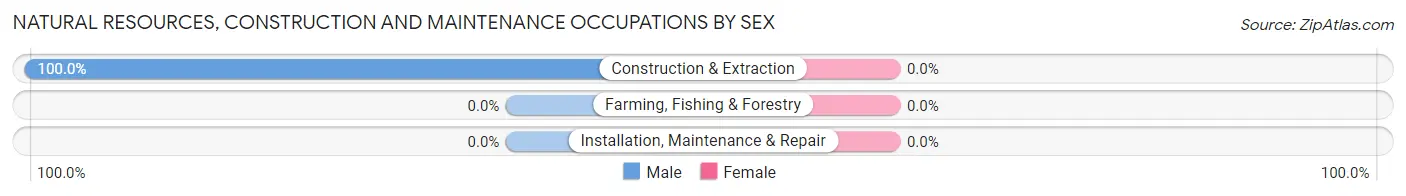
| Occupation | Male | Female |
| Farming, Fishing & Forestry | 0 (0.0%) | 0 (0.0%) |
| Construction & Extraction | 23 (100.0%) | 0 (0.0%) |
| Installation, Maintenance & Repair | 0 (0.0%) | 0 (0.0%) |
| Total (Category) | 23 (100.0%) | 0 (0.0%) |
| Total (Overall) | 39 (68.4%) | 18 (31.6%) |
Production, Transportation and Moving Occupations
The most common Production, Transportation and Moving occupations in Austwell are , and Production (3 | 5.3%).
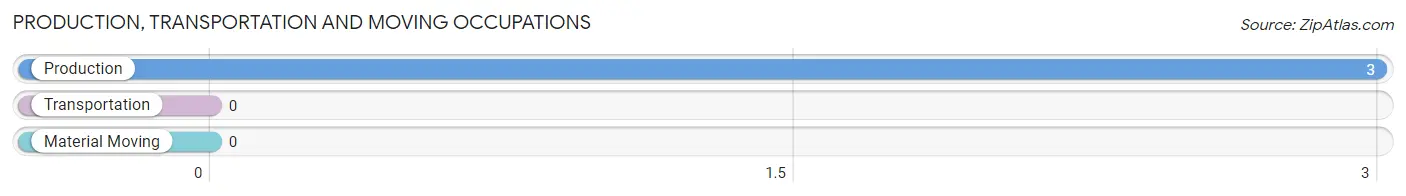
Production, Transportation and Moving Occupations by Sex
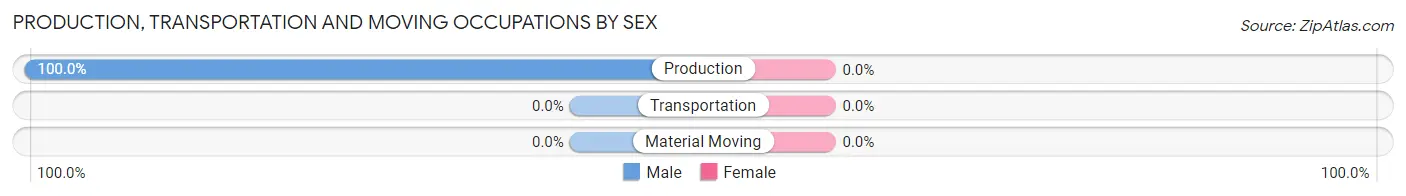
| Occupation | Male | Female |
| Production | 3 (100.0%) | 0 (0.0%) |
| Transportation | 0 (0.0%) | 0 (0.0%) |
| Material Moving | 0 (0.0%) | 0 (0.0%) |
| Total (Category) | 3 (100.0%) | 0 (0.0%) |
| Total (Overall) | 39 (68.4%) | 18 (31.6%) |
Employment Industries by Sex in Austwell
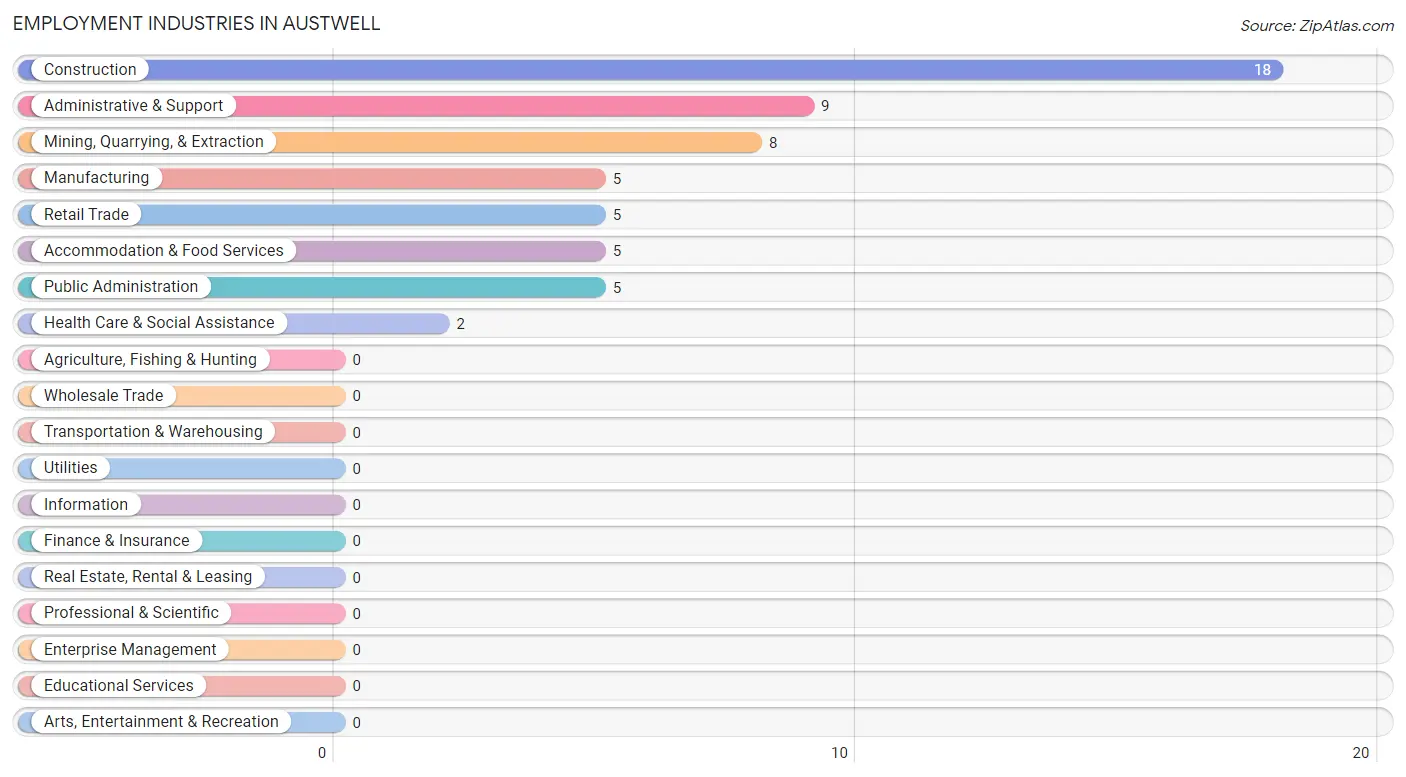
Employment Industries in Austwell
The major employment industries in Austwell include Construction (18 | 31.6%), Administrative & Support (9 | 15.8%), Mining, Quarrying, & Extraction (8 | 14.0%), Manufacturing (5 | 8.8%), and Retail Trade (5 | 8.8%).
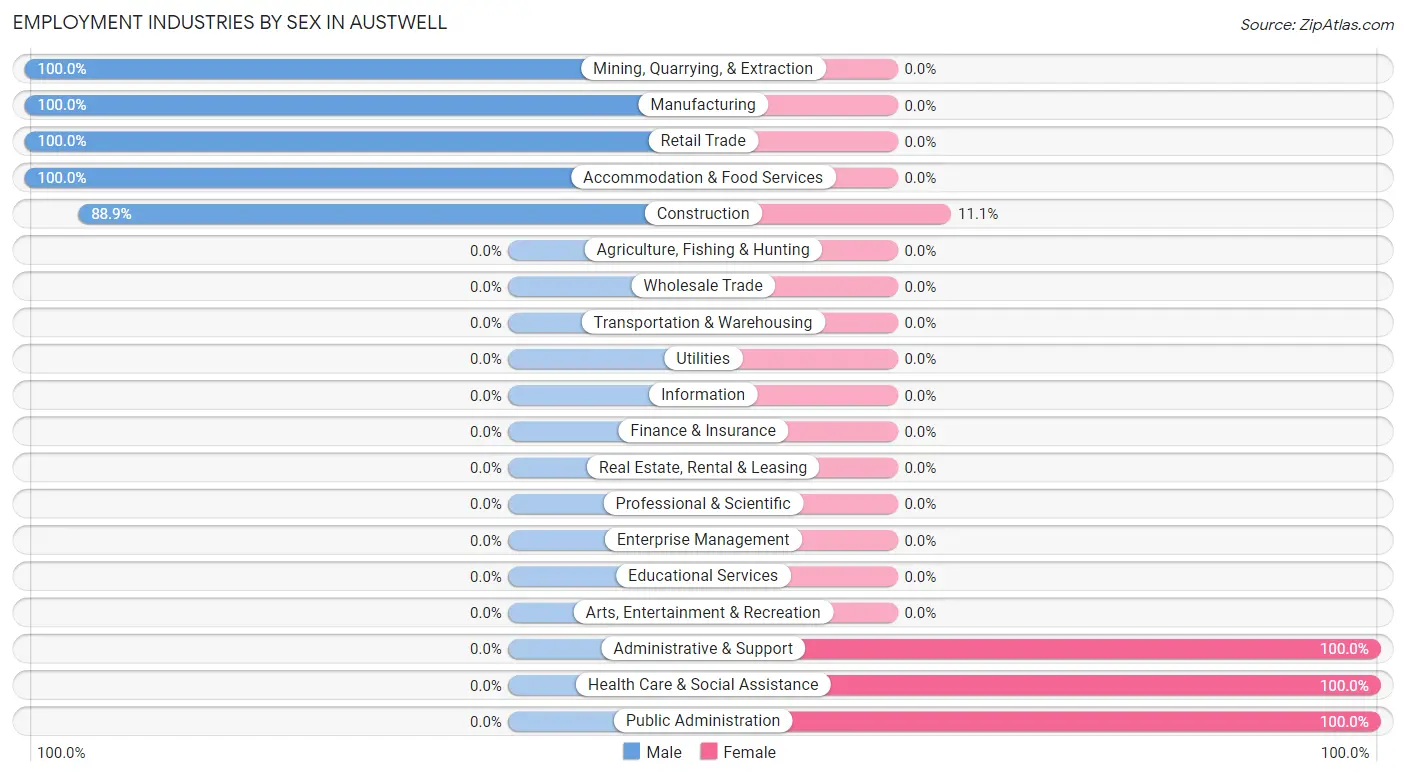
Employment Industries by Sex in Austwell
The Austwell industries that see more men than women are Mining, Quarrying, & Extraction (100.0%), Manufacturing (100.0%), and Retail Trade (100.0%), whereas the industries that tend to have a higher number of women are Administrative & Support (100.0%), Health Care & Social Assistance (100.0%), and Public Administration (100.0%).
| Industry | Male | Female |
| Agriculture, Fishing & Hunting | 0 (0.0%) | 0 (0.0%) |
| Mining, Quarrying, & Extraction | 8 (100.0%) | 0 (0.0%) |
| Construction | 16 (88.9%) | 2 (11.1%) |
| Manufacturing | 5 (100.0%) | 0 (0.0%) |
| Wholesale Trade | 0 (0.0%) | 0 (0.0%) |
| Retail Trade | 5 (100.0%) | 0 (0.0%) |
| Transportation & Warehousing | 0 (0.0%) | 0 (0.0%) |
| Utilities | 0 (0.0%) | 0 (0.0%) |
| Information | 0 (0.0%) | 0 (0.0%) |
| Finance & Insurance | 0 (0.0%) | 0 (0.0%) |
| Real Estate, Rental & Leasing | 0 (0.0%) | 0 (0.0%) |
| Professional & Scientific | 0 (0.0%) | 0 (0.0%) |
| Enterprise Management | 0 (0.0%) | 0 (0.0%) |
| Administrative & Support | 0 (0.0%) | 9 (100.0%) |
| Educational Services | 0 (0.0%) | 0 (0.0%) |
| Health Care & Social Assistance | 0 (0.0%) | 2 (100.0%) |
| Arts, Entertainment & Recreation | 0 (0.0%) | 0 (0.0%) |
| Accommodation & Food Services | 5 (100.0%) | 0 (0.0%) |
| Public Administration | 0 (0.0%) | 5 (100.0%) |
| Total | 39 (68.4%) | 18 (31.6%) |
Education in Austwell
School Enrollment in Austwell
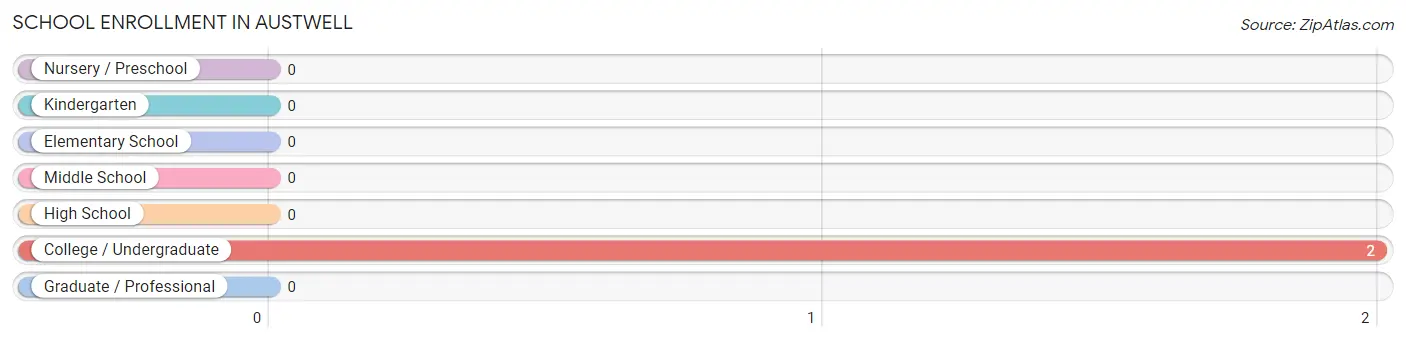
| School Level | # Students | % Students |
| Nursery / Preschool | 0 | 0.0% |
| Kindergarten | 0 | 0.0% |
| Elementary School | 0 | 0.0% |
| Middle School | 0 | 0.0% |
| High School | 0 | 0.0% |
| College / Undergraduate | 2 | 100.0% |
| Graduate / Professional | 0 | 0.0% |
| Total | 2 | 100.0% |
School Enrollment by Age by Funding Source in Austwell
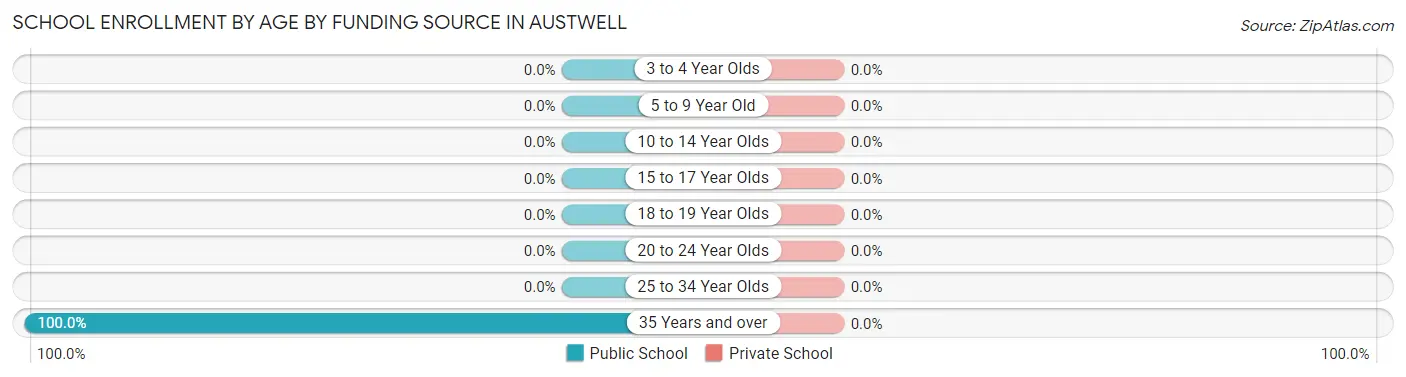
| Age Bracket | Public School | Private School |
| 3 to 4 Year Olds | 0 (0.0%) | 0 (0.0%) |
| 5 to 9 Year Old | 0 (0.0%) | 0 (0.0%) |
| 10 to 14 Year Olds | 0 (0.0%) | 0 (0.0%) |
| 15 to 17 Year Olds | 0 (0.0%) | 0 (0.0%) |
| 18 to 19 Year Olds | 0 (0.0%) | 0 (0.0%) |
| 20 to 24 Year Olds | 0 (0.0%) | 0 (0.0%) |
| 25 to 34 Year Olds | 0 (0.0%) | 0 (0.0%) |
| 35 Years and over | 2 (100.0%) | 0 (0.0%) |
| Total | 2 (100.0%) | 0 (0.0%) |
Educational Attainment by Field of Study in Austwell
Education (4 | 44.4%), science & technology (2 | 22.2%), business (2 | 22.2%), and communications (1 | 11.1%) are the most common fields of study among 9 individuals in Austwell who have obtained a bachelor's degree or higher.
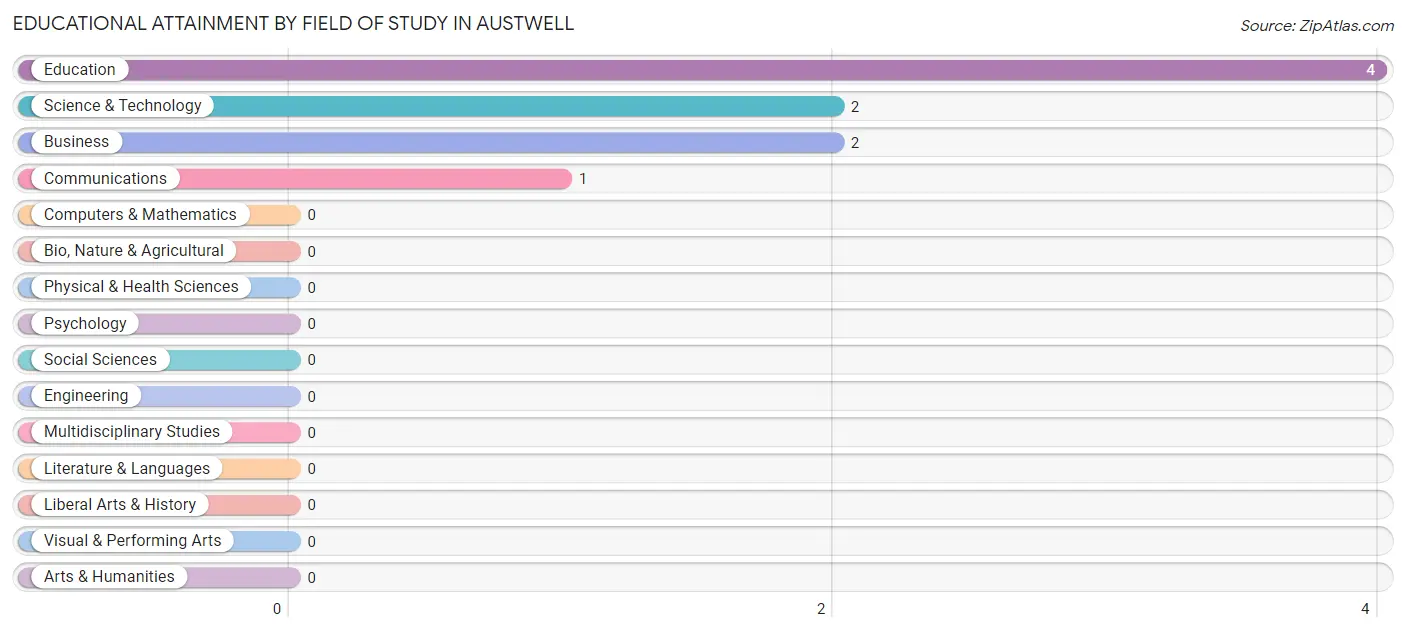
| Field of Study | # Graduates | % Graduates |
| Computers & Mathematics | 0 | 0.0% |
| Bio, Nature & Agricultural | 0 | 0.0% |
| Physical & Health Sciences | 0 | 0.0% |
| Psychology | 0 | 0.0% |
| Social Sciences | 0 | 0.0% |
| Engineering | 0 | 0.0% |
| Multidisciplinary Studies | 0 | 0.0% |
| Science & Technology | 2 | 22.2% |
| Business | 2 | 22.2% |
| Education | 4 | 44.4% |
| Literature & Languages | 0 | 0.0% |
| Liberal Arts & History | 0 | 0.0% |
| Visual & Performing Arts | 0 | 0.0% |
| Communications | 1 | 11.1% |
| Arts & Humanities | 0 | 0.0% |
| Total | 9 | 100.0% |
Transportation & Commute in Austwell
Vehicle Availability by Sex in Austwell
The most prevalent vehicle ownership categories in Austwell are males with 2 vehicles (31, accounting for 79.5%) and females with 2 vehicles (14, making up 172.2%).
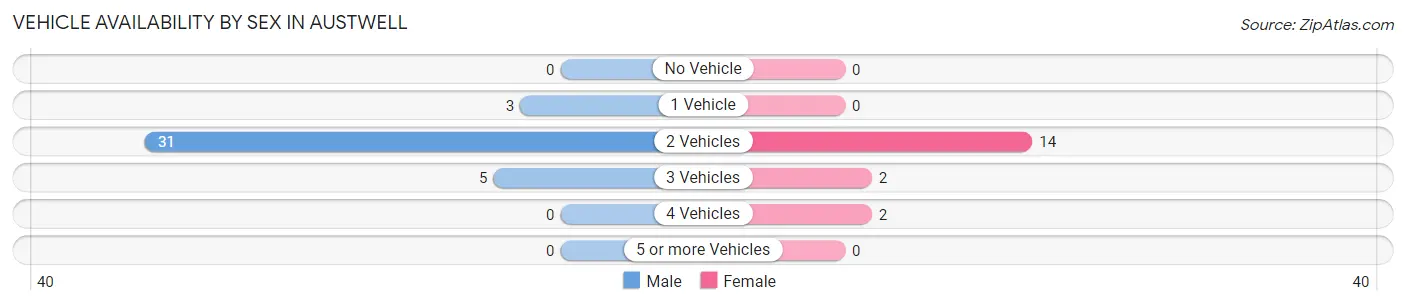
| Vehicles Available | Male | Female |
| No Vehicle | 0 (0.0%) | 0 (0.0%) |
| 1 Vehicle | 3 (7.7%) | 0 (0.0%) |
| 2 Vehicles | 31 (79.5%) | 14 (77.8%) |
| 3 Vehicles | 5 (12.8%) | 2 (11.1%) |
| 4 Vehicles | 0 (0.0%) | 2 (11.1%) |
| 5 or more Vehicles | 0 (0.0%) | 0 (0.0%) |
| Total | 39 (100.0%) | 18 (100.0%) |
Commute Time in Austwell
The most frequently occuring commute durations in Austwell are 40 to 44 minutes (16 commuters, 29.1%), less than 5 minutes (8 commuters, 14.5%), and 10 to 14 minutes (8 commuters, 14.5%).
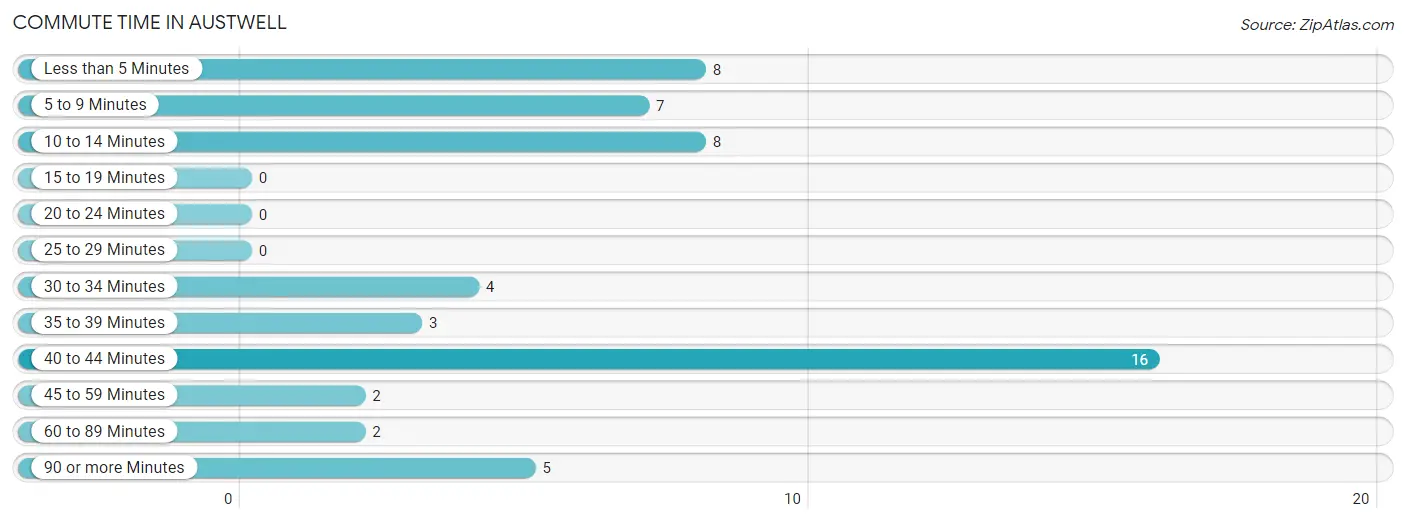
| Commute Time | # Commuters | % Commuters |
| Less than 5 Minutes | 8 | 14.5% |
| 5 to 9 Minutes | 7 | 12.7% |
| 10 to 14 Minutes | 8 | 14.5% |
| 15 to 19 Minutes | 0 | 0.0% |
| 20 to 24 Minutes | 0 | 0.0% |
| 25 to 29 Minutes | 0 | 0.0% |
| 30 to 34 Minutes | 4 | 7.3% |
| 35 to 39 Minutes | 3 | 5.4% |
| 40 to 44 Minutes | 16 | 29.1% |
| 45 to 59 Minutes | 2 | 3.6% |
| 60 to 89 Minutes | 2 | 3.6% |
| 90 or more Minutes | 5 | 9.1% |
Commute Time by Sex in Austwell
The most common commute times in Austwell are 10 to 14 minutes (8 commuters, 20.5%) for males and 40 to 44 minutes (11 commuters, 68.8%) for females.
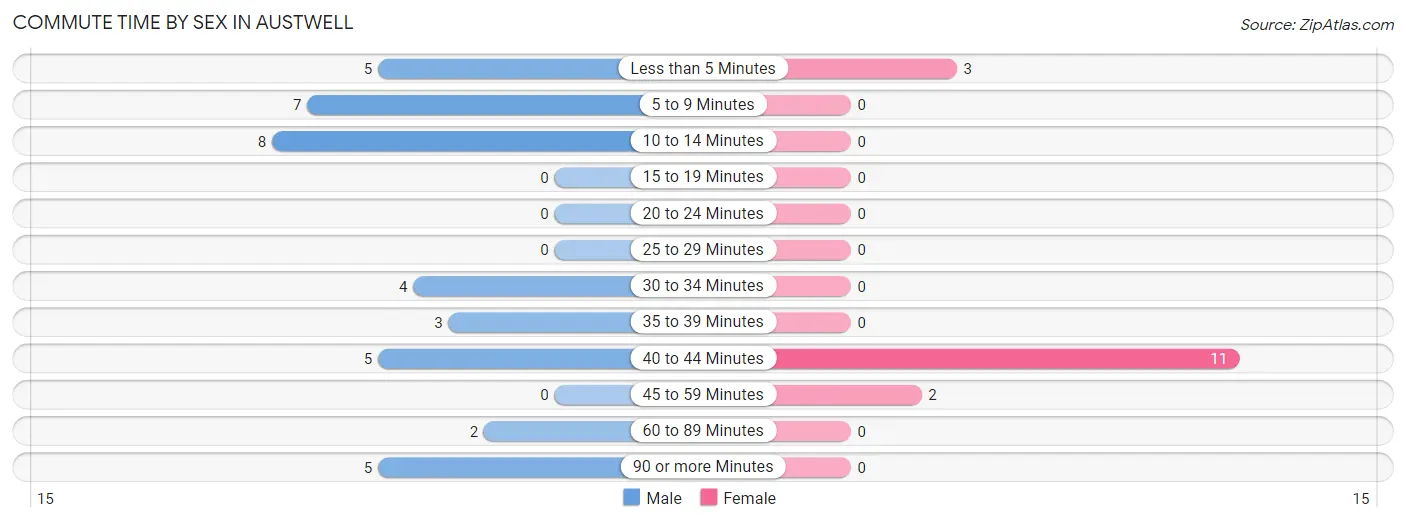
| Commute Time | Male | Female |
| Less than 5 Minutes | 5 (12.8%) | 3 (18.8%) |
| 5 to 9 Minutes | 7 (17.9%) | 0 (0.0%) |
| 10 to 14 Minutes | 8 (20.5%) | 0 (0.0%) |
| 15 to 19 Minutes | 0 (0.0%) | 0 (0.0%) |
| 20 to 24 Minutes | 0 (0.0%) | 0 (0.0%) |
| 25 to 29 Minutes | 0 (0.0%) | 0 (0.0%) |
| 30 to 34 Minutes | 4 (10.3%) | 0 (0.0%) |
| 35 to 39 Minutes | 3 (7.7%) | 0 (0.0%) |
| 40 to 44 Minutes | 5 (12.8%) | 11 (68.8%) |
| 45 to 59 Minutes | 0 (0.0%) | 2 (12.5%) |
| 60 to 89 Minutes | 2 (5.1%) | 0 (0.0%) |
| 90 or more Minutes | 5 (12.8%) | 0 (0.0%) |
Time of Departure to Work by Sex in Austwell
The most frequent times of departure to work in Austwell are 8:00 AM to 8:29 AM (14, 35.9%) for males and 7:00 AM to 7:29 AM (11, 68.8%) for females.
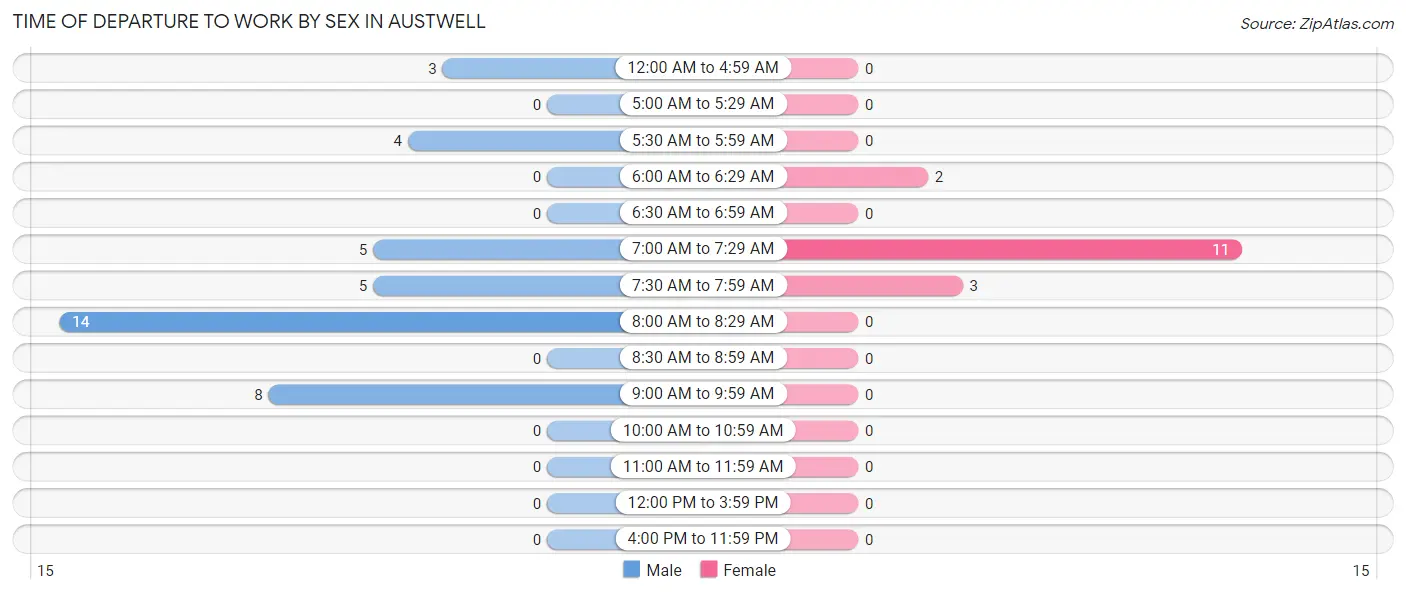
| Time of Departure | Male | Female |
| 12:00 AM to 4:59 AM | 3 (7.7%) | 0 (0.0%) |
| 5:00 AM to 5:29 AM | 0 (0.0%) | 0 (0.0%) |
| 5:30 AM to 5:59 AM | 4 (10.3%) | 0 (0.0%) |
| 6:00 AM to 6:29 AM | 0 (0.0%) | 2 (12.5%) |
| 6:30 AM to 6:59 AM | 0 (0.0%) | 0 (0.0%) |
| 7:00 AM to 7:29 AM | 5 (12.8%) | 11 (68.8%) |
| 7:30 AM to 7:59 AM | 5 (12.8%) | 3 (18.8%) |
| 8:00 AM to 8:29 AM | 14 (35.9%) | 0 (0.0%) |
| 8:30 AM to 8:59 AM | 0 (0.0%) | 0 (0.0%) |
| 9:00 AM to 9:59 AM | 8 (20.5%) | 0 (0.0%) |
| 10:00 AM to 10:59 AM | 0 (0.0%) | 0 (0.0%) |
| 11:00 AM to 11:59 AM | 0 (0.0%) | 0 (0.0%) |
| 12:00 PM to 3:59 PM | 0 (0.0%) | 0 (0.0%) |
| 4:00 PM to 11:59 PM | 0 (0.0%) | 0 (0.0%) |
| Total | 39 (100.0%) | 16 (100.0%) |
Housing Occupancy in Austwell
Occupancy by Ownership in Austwell
Of the total 61 dwellings in Austwell, owner-occupied units account for 46 (75.4%), while renter-occupied units make up 15 (24.6%).
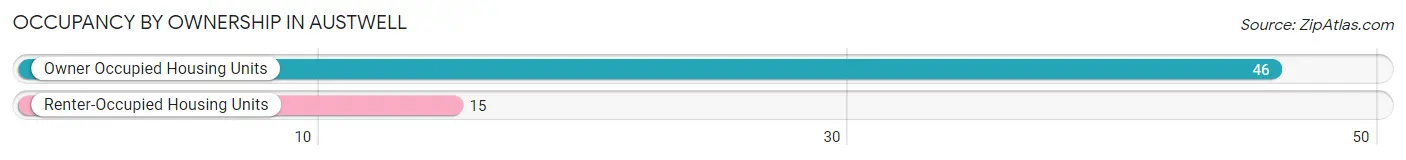
| Occupancy | # Housing Units | % Housing Units |
| Owner Occupied Housing Units | 46 | 75.4% |
| Renter-Occupied Housing Units | 15 | 24.6% |
| Total Occupied Housing Units | 61 | 100.0% |
Occupancy by Household Size in Austwell
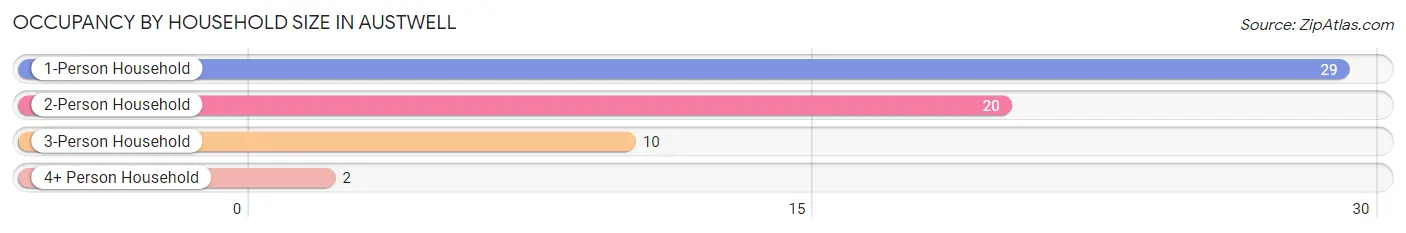
| Household Size | # Housing Units | % Housing Units |
| 1-Person Household | 29 | 47.5% |
| 2-Person Household | 20 | 32.8% |
| 3-Person Household | 10 | 16.4% |
| 4+ Person Household | 2 | 3.3% |
| Total Housing Units | 61 | 100.0% |
Occupancy by Ownership by Household Size in Austwell
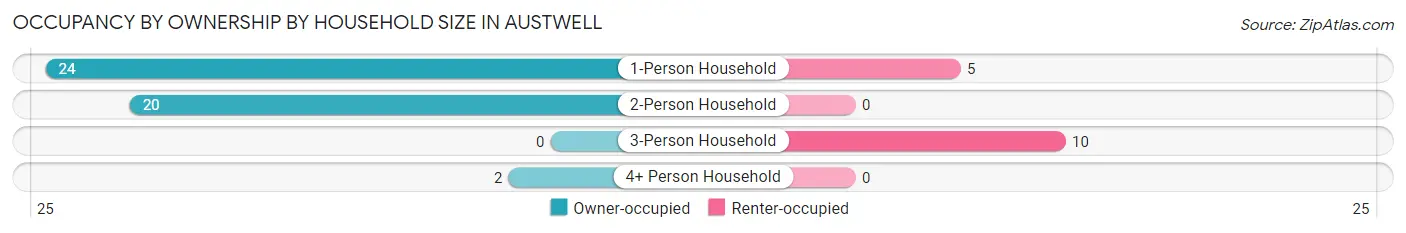
| Household Size | Owner-occupied | Renter-occupied |
| 1-Person Household | 24 (82.8%) | 5 (17.2%) |
| 2-Person Household | 20 (100.0%) | 0 (0.0%) |
| 3-Person Household | 0 (0.0%) | 10 (100.0%) |
| 4+ Person Household | 2 (100.0%) | 0 (0.0%) |
| Total Housing Units | 46 (75.4%) | 15 (24.6%) |
Occupancy by Educational Attainment in Austwell
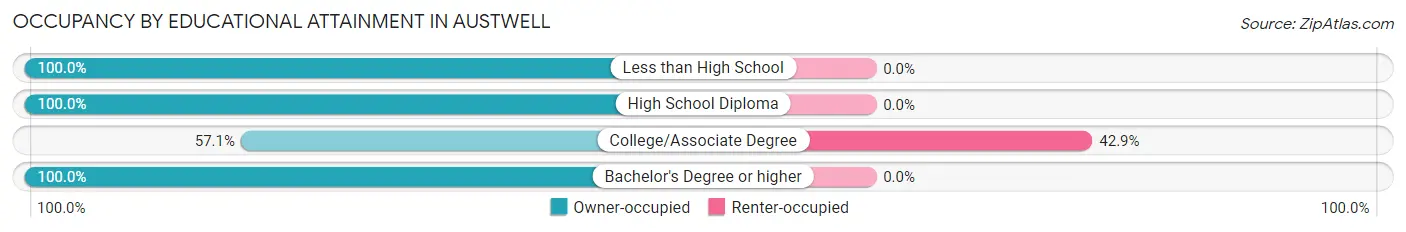
| Household Size | Owner-occupied | Renter-occupied |
| Less than High School | 10 (100.0%) | 0 (0.0%) |
| High School Diploma | 8 (100.0%) | 0 (0.0%) |
| College/Associate Degree | 20 (57.1%) | 15 (42.9%) |
| Bachelor's Degree or higher | 8 (100.0%) | 0 (0.0%) |
Occupancy by Age of Householder in Austwell
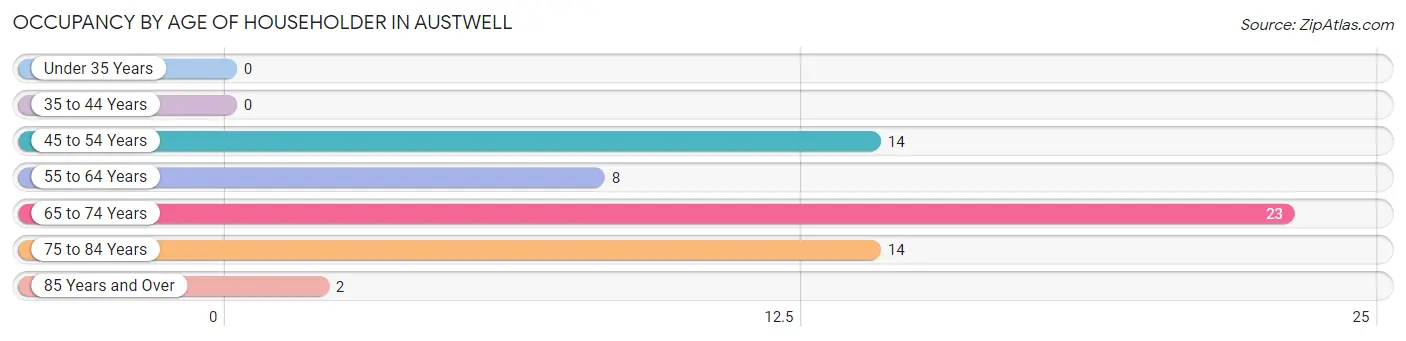
| Age Bracket | # Households | % Households |
| Under 35 Years | 0 | 0.0% |
| 35 to 44 Years | 0 | 0.0% |
| 45 to 54 Years | 14 | 23.0% |
| 55 to 64 Years | 8 | 13.1% |
| 65 to 74 Years | 23 | 37.7% |
| 75 to 84 Years | 14 | 23.0% |
| 85 Years and Over | 2 | 3.3% |
| Total | 61 | 100.0% |
Housing Finances in Austwell
Median Income by Occupancy in Austwell
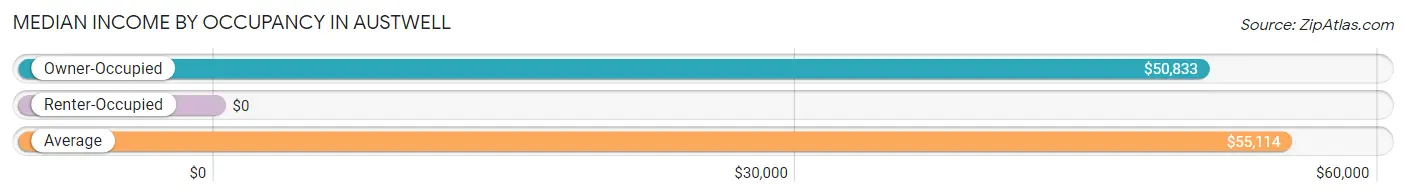
| Occupancy Type | # Households | Median Income |
| Owner-Occupied | 46 (75.4%) | $50,833 |
| Renter-Occupied | 15 (24.6%) | $0 |
| Average | 61 (100.0%) | $55,114 |
Occupancy by Householder Income Bracket in Austwell
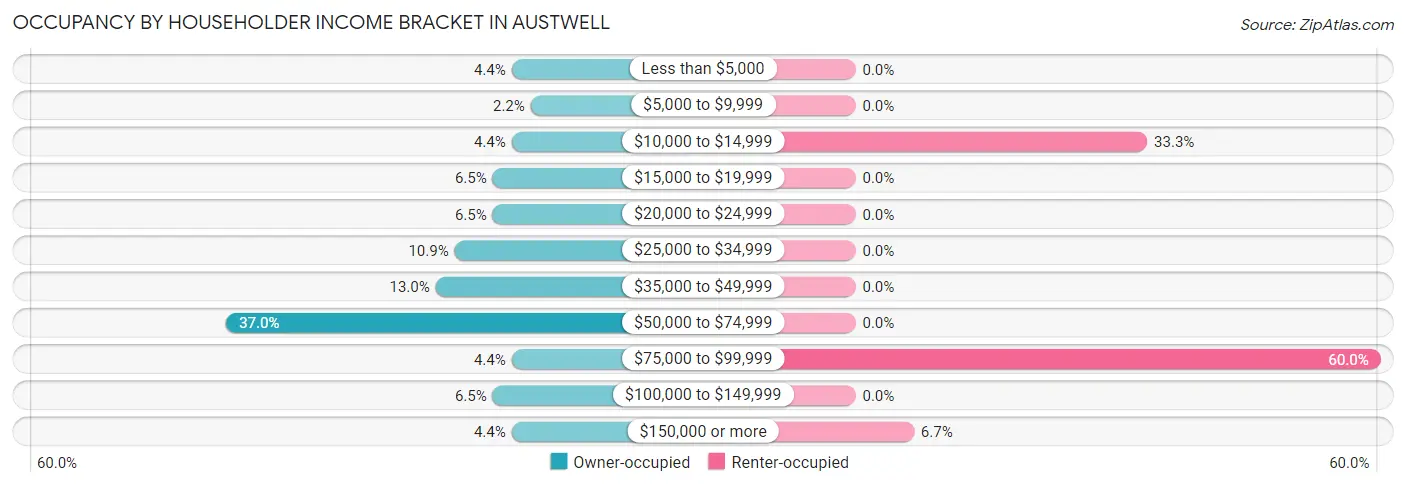
| Income Bracket | Owner-occupied | Renter-occupied |
| Less than $5,000 | 2 (4.3%) | 0 (0.0%) |
| $5,000 to $9,999 | 1 (2.2%) | 0 (0.0%) |
| $10,000 to $14,999 | 2 (4.3%) | 5 (33.3%) |
| $15,000 to $19,999 | 3 (6.5%) | 0 (0.0%) |
| $20,000 to $24,999 | 3 (6.5%) | 0 (0.0%) |
| $25,000 to $34,999 | 5 (10.9%) | 0 (0.0%) |
| $35,000 to $49,999 | 6 (13.0%) | 0 (0.0%) |
| $50,000 to $74,999 | 17 (37.0%) | 0 (0.0%) |
| $75,000 to $99,999 | 2 (4.3%) | 9 (60.0%) |
| $100,000 to $149,999 | 3 (6.5%) | 0 (0.0%) |
| $150,000 or more | 2 (4.3%) | 1 (6.7%) |
| Total | 46 (100.0%) | 15 (100.0%) |
Monthly Housing Cost Tiers in Austwell
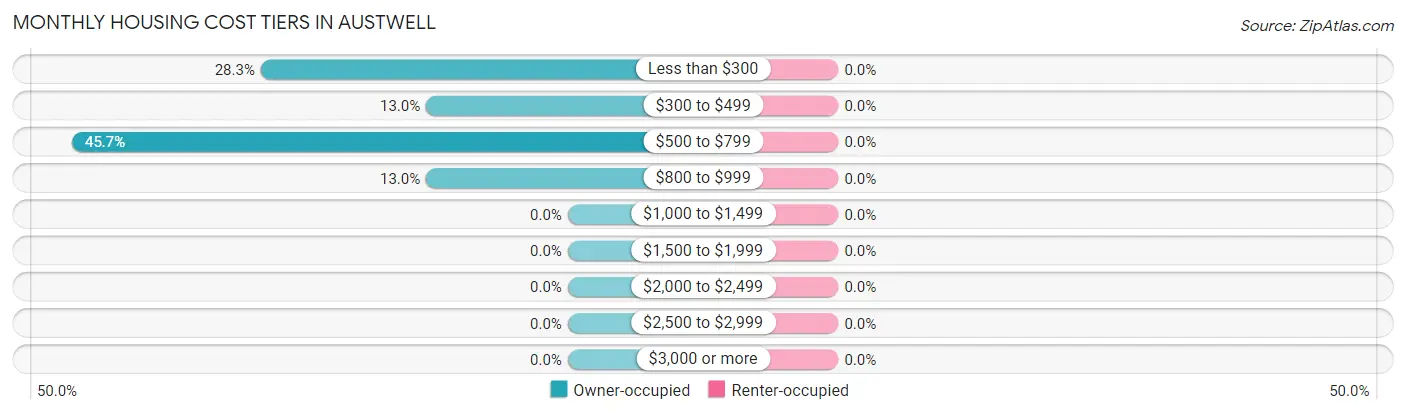
| Monthly Cost | Owner-occupied | Renter-occupied |
| Less than $300 | 13 (28.3%) | 0 (0.0%) |
| $300 to $499 | 6 (13.0%) | 0 (0.0%) |
| $500 to $799 | 21 (45.7%) | 0 (0.0%) |
| $800 to $999 | 6 (13.0%) | 0 (0.0%) |
| $1,000 to $1,499 | 0 (0.0%) | 0 (0.0%) |
| $1,500 to $1,999 | 0 (0.0%) | 0 (0.0%) |
| $2,000 to $2,499 | 0 (0.0%) | 0 (0.0%) |
| $2,500 to $2,999 | 0 (0.0%) | 0 (0.0%) |
| $3,000 or more | 0 (0.0%) | 0 (0.0%) |
| Total | 46 (100.0%) | 15 (100.0%) |
Physical Housing Characteristics in Austwell
Housing Structures in Austwell
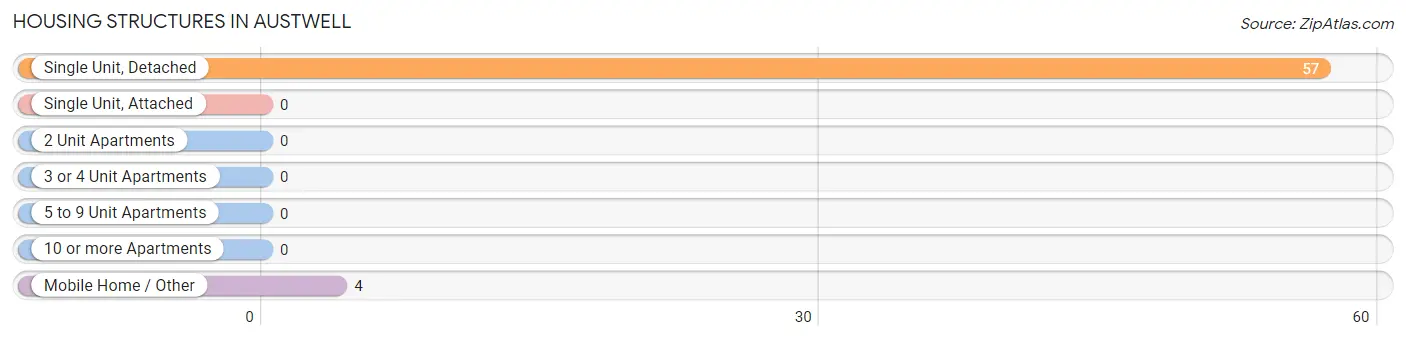
| Structure Type | # Housing Units | % Housing Units |
| Single Unit, Detached | 57 | 93.4% |
| Single Unit, Attached | 0 | 0.0% |
| 2 Unit Apartments | 0 | 0.0% |
| 3 or 4 Unit Apartments | 0 | 0.0% |
| 5 to 9 Unit Apartments | 0 | 0.0% |
| 10 or more Apartments | 0 | 0.0% |
| Mobile Home / Other | 4 | 6.6% |
| Total | 61 | 100.0% |
Housing Structures by Occupancy in Austwell
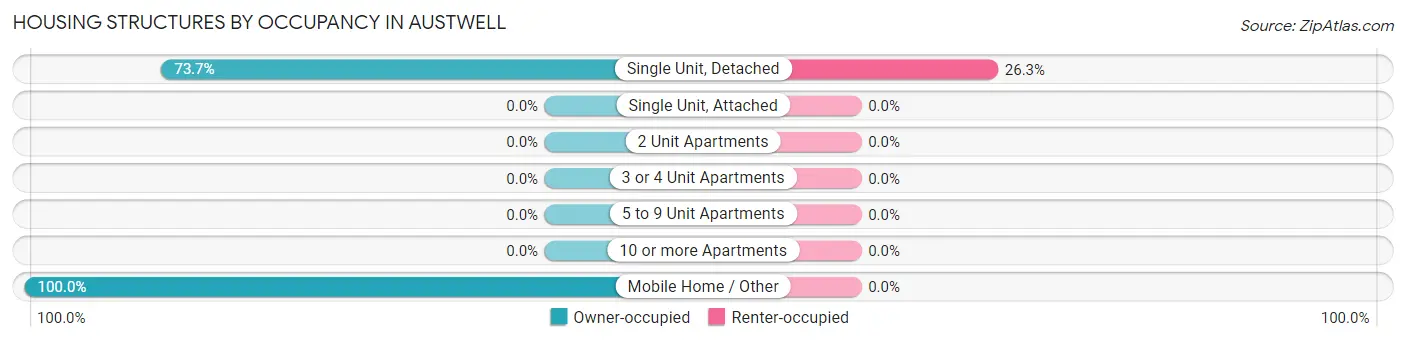
| Structure Type | Owner-occupied | Renter-occupied |
| Single Unit, Detached | 42 (73.7%) | 15 (26.3%) |
| Single Unit, Attached | 0 (0.0%) | 0 (0.0%) |
| 2 Unit Apartments | 0 (0.0%) | 0 (0.0%) |
| 3 or 4 Unit Apartments | 0 (0.0%) | 0 (0.0%) |
| 5 to 9 Unit Apartments | 0 (0.0%) | 0 (0.0%) |
| 10 or more Apartments | 0 (0.0%) | 0 (0.0%) |
| Mobile Home / Other | 4 (100.0%) | 0 (0.0%) |
| Total | 46 (75.4%) | 15 (24.6%) |
Housing Structures by Number of Rooms in Austwell
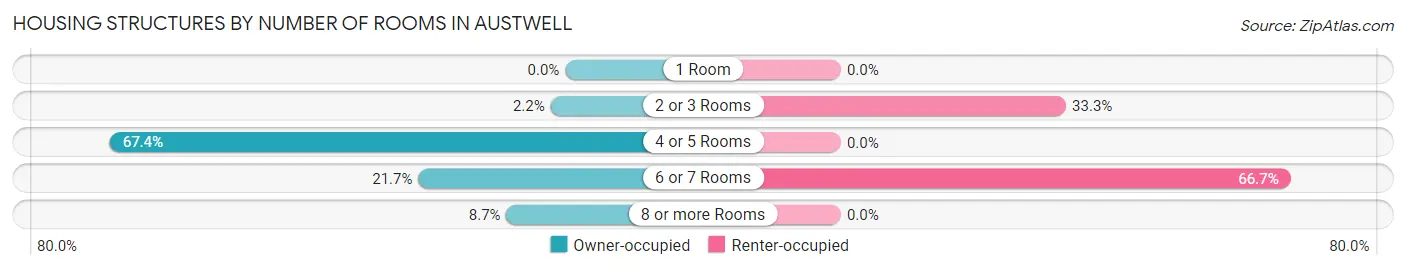
| Number of Rooms | Owner-occupied | Renter-occupied |
| 1 Room | 0 (0.0%) | 0 (0.0%) |
| 2 or 3 Rooms | 1 (2.2%) | 5 (33.3%) |
| 4 or 5 Rooms | 31 (67.4%) | 0 (0.0%) |
| 6 or 7 Rooms | 10 (21.7%) | 10 (66.7%) |
| 8 or more Rooms | 4 (8.7%) | 0 (0.0%) |
| Total | 46 (100.0%) | 15 (100.0%) |
Housing Structure by Heating Type in Austwell
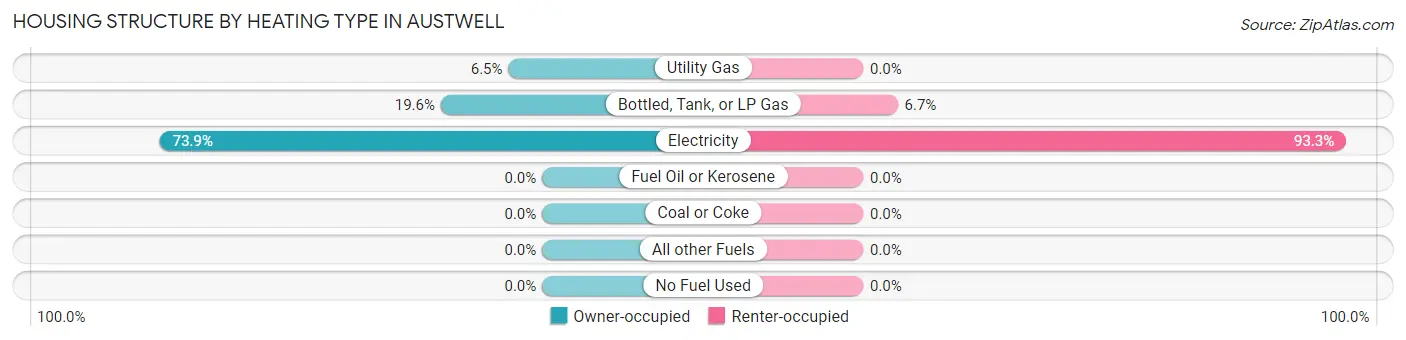
| Heating Type | Owner-occupied | Renter-occupied |
| Utility Gas | 3 (6.5%) | 0 (0.0%) |
| Bottled, Tank, or LP Gas | 9 (19.6%) | 1 (6.7%) |
| Electricity | 34 (73.9%) | 14 (93.3%) |
| Fuel Oil or Kerosene | 0 (0.0%) | 0 (0.0%) |
| Coal or Coke | 0 (0.0%) | 0 (0.0%) |
| All other Fuels | 0 (0.0%) | 0 (0.0%) |
| No Fuel Used | 0 (0.0%) | 0 (0.0%) |
| Total | 46 (100.0%) | 15 (100.0%) |
Household Vehicle Usage in Austwell
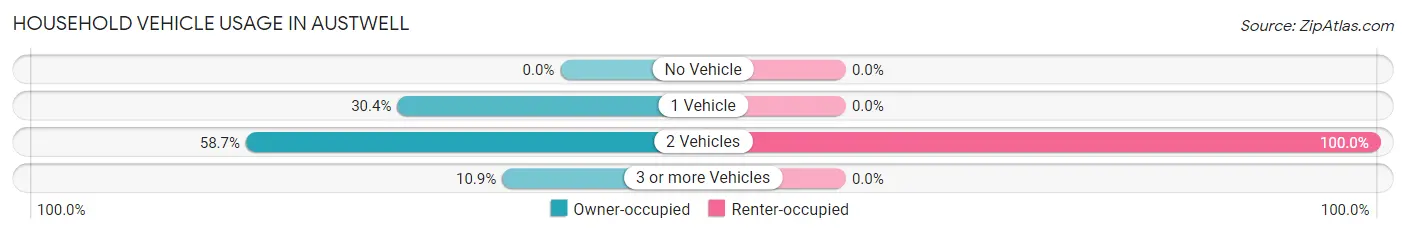
| Vehicles per Household | Owner-occupied | Renter-occupied |
| No Vehicle | 0 (0.0%) | 0 (0.0%) |
| 1 Vehicle | 14 (30.4%) | 0 (0.0%) |
| 2 Vehicles | 27 (58.7%) | 15 (100.0%) |
| 3 or more Vehicles | 5 (10.9%) | 0 (0.0%) |
| Total | 46 (100.0%) | 15 (100.0%) |
Real Estate & Mortgages in Austwell
Real Estate and Mortgage Overview in Austwell
| Characteristic | Without Mortgage | With Mortgage |
| Housing Units | 40 | 6 |
| Median Property Value | $83,300 | $45,000 |
| Median Household Income | $46,250 | $2 |
| Monthly Housing Costs | $511 | $0 |
| Real Estate Taxes | - | - |
Property Value by Mortgage Status in Austwell
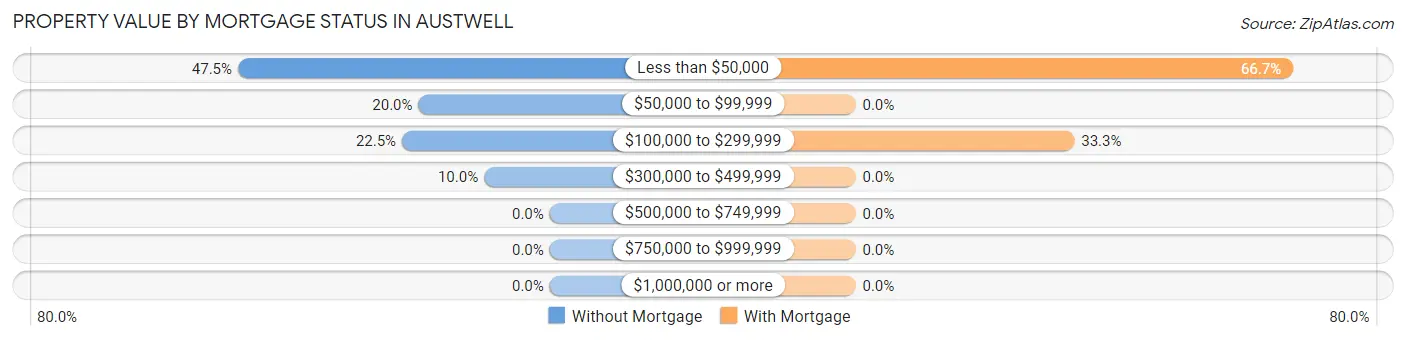
| Property Value | Without Mortgage | With Mortgage |
| Less than $50,000 | 19 (47.5%) | 4 (66.7%) |
| $50,000 to $99,999 | 8 (20.0%) | 0 (0.0%) |
| $100,000 to $299,999 | 9 (22.5%) | 2 (33.3%) |
| $300,000 to $499,999 | 4 (10.0%) | 0 (0.0%) |
| $500,000 to $749,999 | 0 (0.0%) | 0 (0.0%) |
| $750,000 to $999,999 | 0 (0.0%) | 0 (0.0%) |
| $1,000,000 or more | 0 (0.0%) | 0 (0.0%) |
| Total | 40 (100.0%) | 6 (100.0%) |
Household Income by Mortgage Status in Austwell
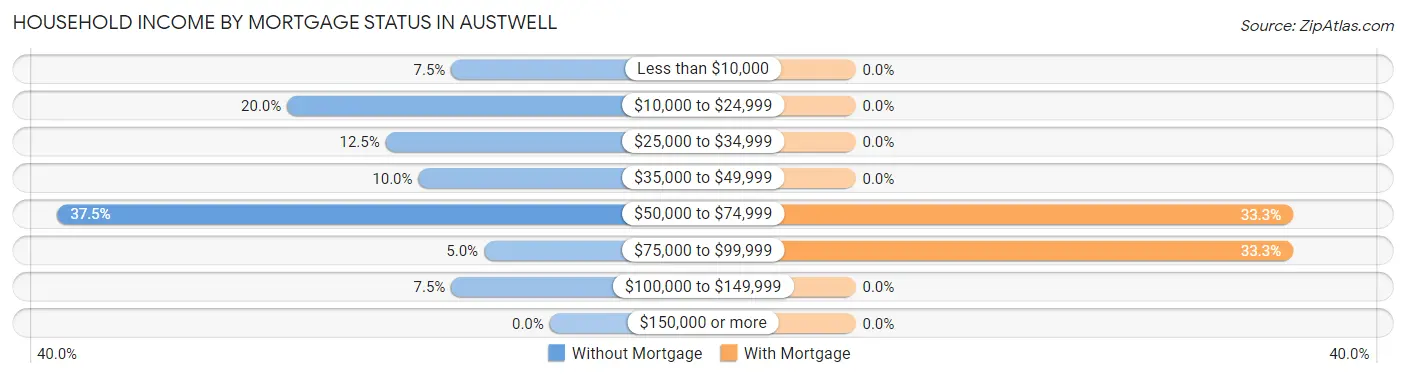
| Household Income | Without Mortgage | With Mortgage |
| Less than $10,000 | 3 (7.5%) | 0 (0.0%) |
| $10,000 to $24,999 | 8 (20.0%) | 0 (0.0%) |
| $25,000 to $34,999 | 5 (12.5%) | 0 (0.0%) |
| $35,000 to $49,999 | 4 (10.0%) | 0 (0.0%) |
| $50,000 to $74,999 | 15 (37.5%) | 2 (33.3%) |
| $75,000 to $99,999 | 2 (5.0%) | 2 (33.3%) |
| $100,000 to $149,999 | 3 (7.5%) | 0 (0.0%) |
| $150,000 or more | 0 (0.0%) | 0 (0.0%) |
| Total | 40 (100.0%) | 6 (100.0%) |
Property Value to Household Income Ratio in Austwell
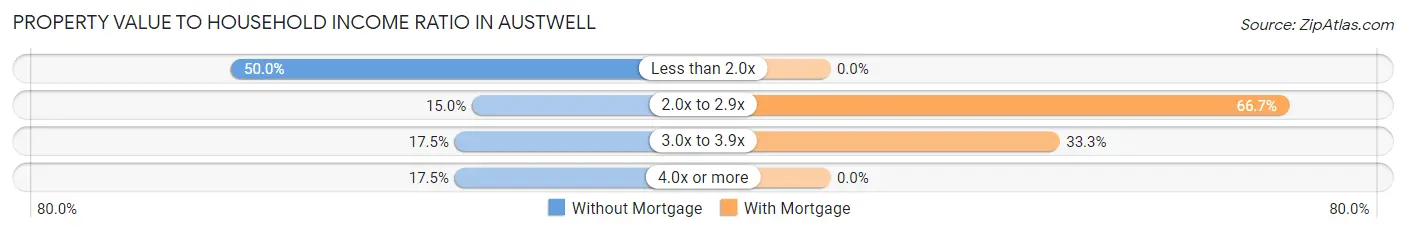
| Value-to-Income Ratio | Without Mortgage | With Mortgage |
| Less than 2.0x | 20 (50.0%) | 0 (0.0%) |
| 2.0x to 2.9x | 6 (15.0%) | 4 (66.7%) |
| 3.0x to 3.9x | 7 (17.5%) | 2 (33.3%) |
| 4.0x or more | 7 (17.5%) | 0 (0.0%) |
| Total | 40 (100.0%) | 6 (100.0%) |
Real Estate Taxes by Mortgage Status in Austwell
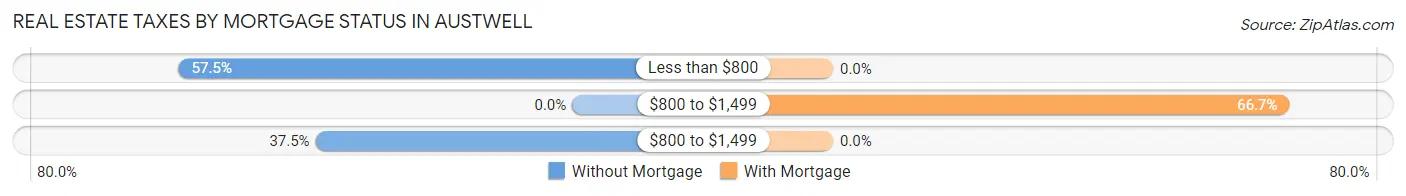
| Property Taxes | Without Mortgage | With Mortgage |
| Less than $800 | 23 (57.5%) | 0 (0.0%) |
| $800 to $1,499 | 0 (0.0%) | 4 (66.7%) |
| $800 to $1,499 | 15 (37.5%) | 0 (0.0%) |
| Total | 40 (100.0%) | 6 (100.0%) |
Health & Disability in Austwell
Health Insurance Coverage by Age in Austwell
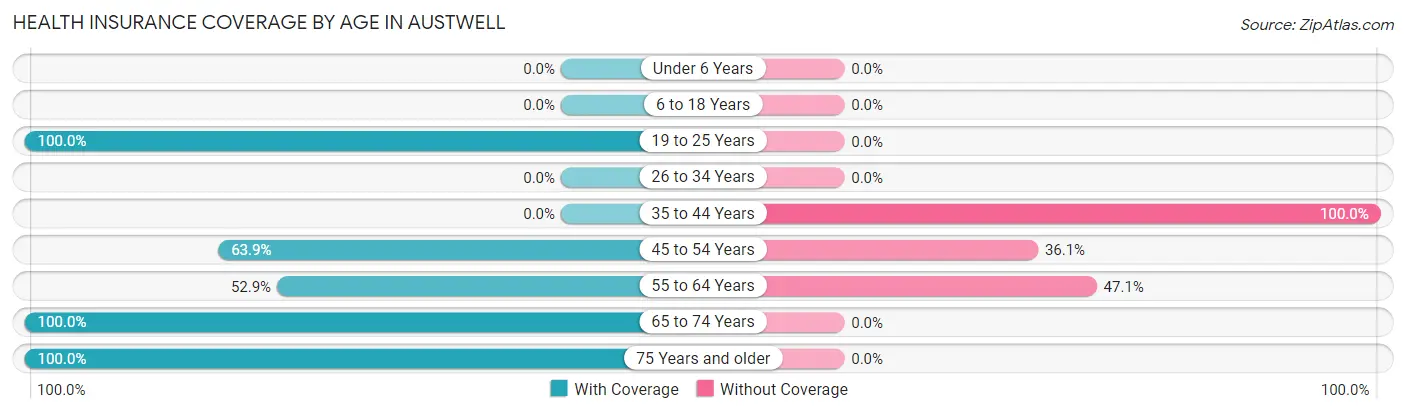
| Age Bracket | With Coverage | Without Coverage |
| Under 6 Years | 0 (0.0%) | 0 (0.0%) |
| 6 to 18 Years | 0 (0.0%) | 0 (0.0%) |
| 19 to 25 Years | 8 (100.0%) | 0 (0.0%) |
| 26 to 34 Years | 0 (0.0%) | 0 (0.0%) |
| 35 to 44 Years | 0 (0.0%) | 8 (100.0%) |
| 45 to 54 Years | 23 (63.9%) | 13 (36.1%) |
| 55 to 64 Years | 9 (52.9%) | 8 (47.1%) |
| 65 to 74 Years | 27 (100.0%) | 0 (0.0%) |
| 75 Years and older | 19 (100.0%) | 0 (0.0%) |
| Total | 86 (74.8%) | 29 (25.2%) |
Health Insurance Coverage by Citizenship Status in Austwell
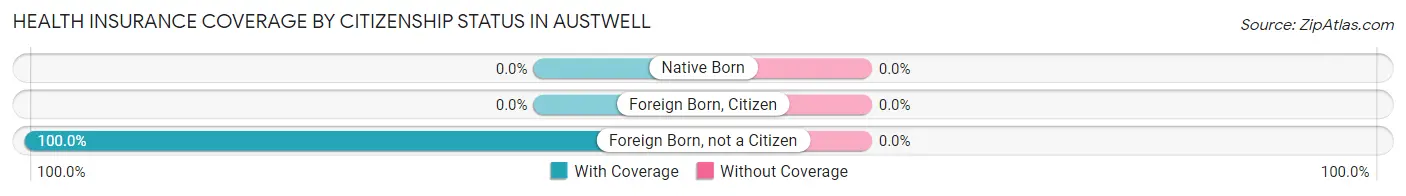
| Citizenship Status | With Coverage | Without Coverage |
| Native Born | 0 (0.0%) | 0 (0.0%) |
| Foreign Born, Citizen | 0 (0.0%) | 0 (0.0%) |
| Foreign Born, not a Citizen | 8 (100.0%) | 0 (0.0%) |
Health Insurance Coverage by Household Income in Austwell
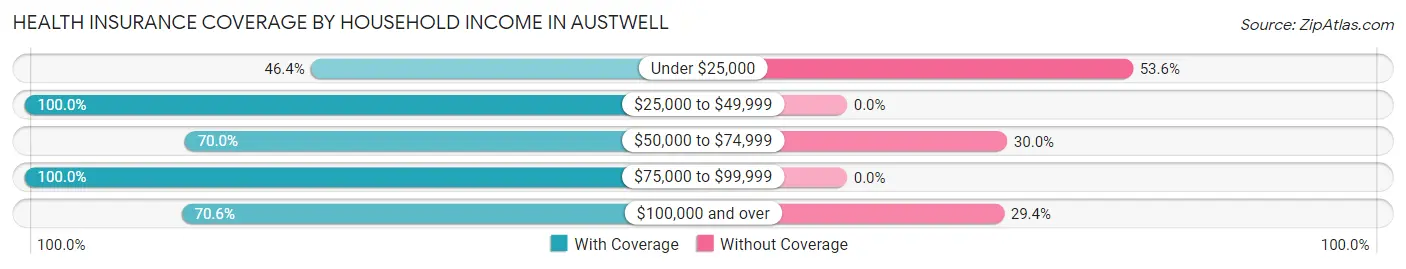
| Household Income | With Coverage | Without Coverage |
| Under $25,000 | 13 (46.4%) | 15 (53.6%) |
| $25,000 to $49,999 | 16 (100.0%) | 0 (0.0%) |
| $50,000 to $74,999 | 21 (70.0%) | 9 (30.0%) |
| $75,000 to $99,999 | 24 (100.0%) | 0 (0.0%) |
| $100,000 and over | 12 (70.6%) | 5 (29.4%) |
Public vs Private Health Insurance Coverage by Age in Austwell
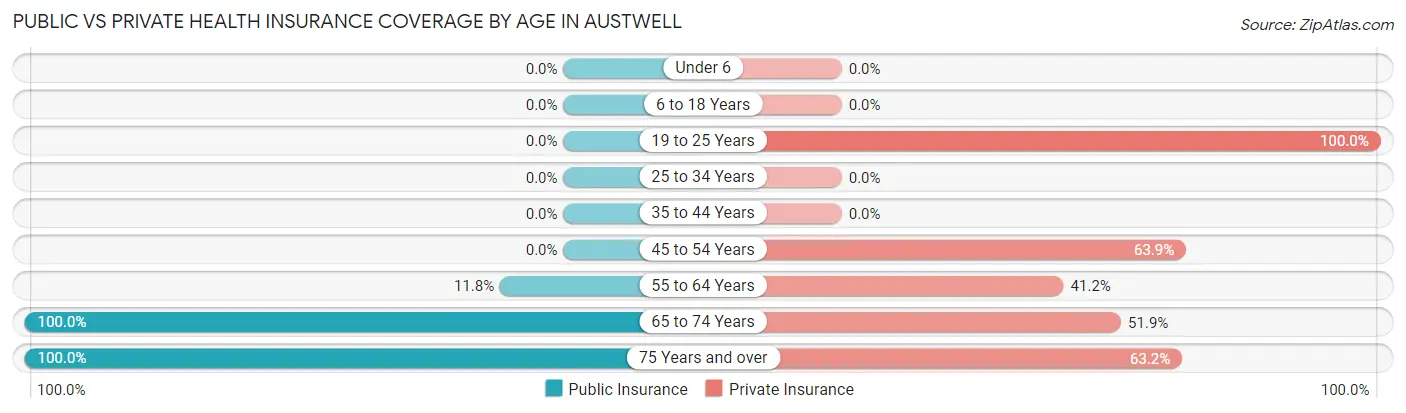
| Age Bracket | Public Insurance | Private Insurance |
| Under 6 | 0 (0.0%) | 0 (0.0%) |
| 6 to 18 Years | 0 (0.0%) | 0 (0.0%) |
| 19 to 25 Years | 0 (0.0%) | 8 (100.0%) |
| 25 to 34 Years | 0 (0.0%) | 0 (0.0%) |
| 35 to 44 Years | 0 (0.0%) | 0 (0.0%) |
| 45 to 54 Years | 0 (0.0%) | 23 (63.9%) |
| 55 to 64 Years | 2 (11.8%) | 7 (41.2%) |
| 65 to 74 Years | 27 (100.0%) | 14 (51.8%) |
| 75 Years and over | 19 (100.0%) | 12 (63.2%) |
| Total | 48 (41.7%) | 64 (55.6%) |
Disability Status by Sex by Age in Austwell
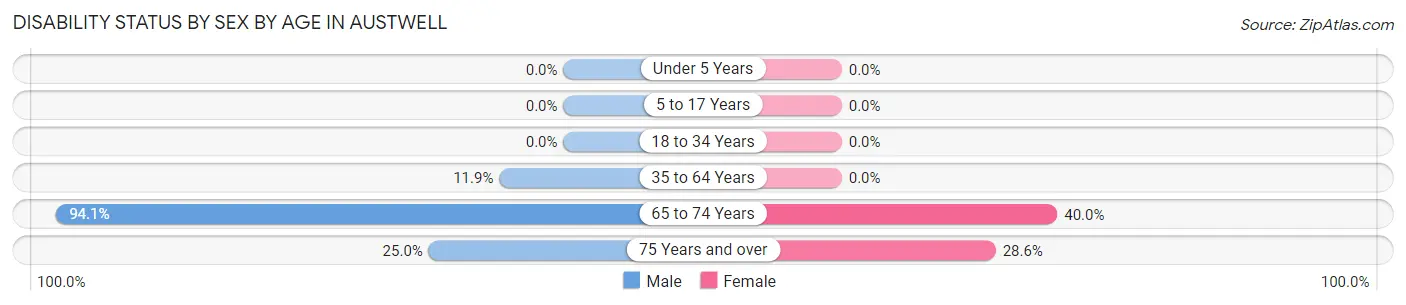
| Age Bracket | Male | Female |
| Under 5 Years | 0 (0.0%) | 0 (0.0%) |
| 5 to 17 Years | 0 (0.0%) | 0 (0.0%) |
| 18 to 34 Years | 0 (0.0%) | 0 (0.0%) |
| 35 to 64 Years | 5 (11.9%) | 0 (0.0%) |
| 65 to 74 Years | 16 (94.1%) | 4 (40.0%) |
| 75 Years and over | 3 (25.0%) | 2 (28.6%) |
Disability Class by Sex by Age in Austwell
Disability Class: Hearing Difficulty
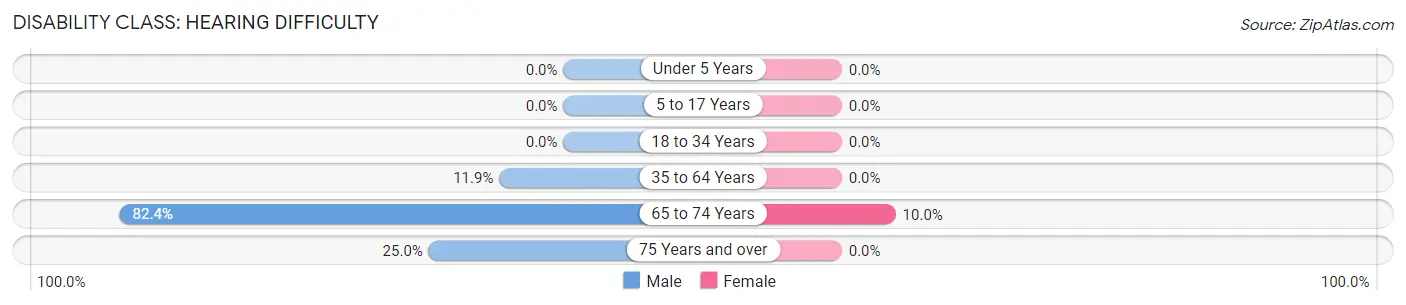
| Age Bracket | Male | Female |
| Under 5 Years | 0 (0.0%) | 0 (0.0%) |
| 5 to 17 Years | 0 (0.0%) | 0 (0.0%) |
| 18 to 34 Years | 0 (0.0%) | 0 (0.0%) |
| 35 to 64 Years | 5 (11.9%) | 0 (0.0%) |
| 65 to 74 Years | 14 (82.4%) | 1 (10.0%) |
| 75 Years and over | 3 (25.0%) | 0 (0.0%) |
Disability Class: Vision Difficulty
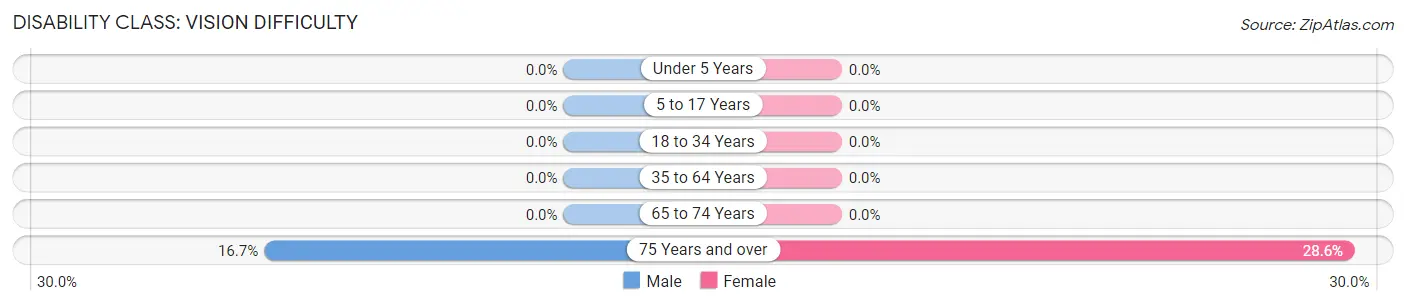
| Age Bracket | Male | Female |
| Under 5 Years | 0 (0.0%) | 0 (0.0%) |
| 5 to 17 Years | 0 (0.0%) | 0 (0.0%) |
| 18 to 34 Years | 0 (0.0%) | 0 (0.0%) |
| 35 to 64 Years | 0 (0.0%) | 0 (0.0%) |
| 65 to 74 Years | 0 (0.0%) | 0 (0.0%) |
| 75 Years and over | 2 (16.7%) | 2 (28.6%) |
Disability Class: Cognitive Difficulty
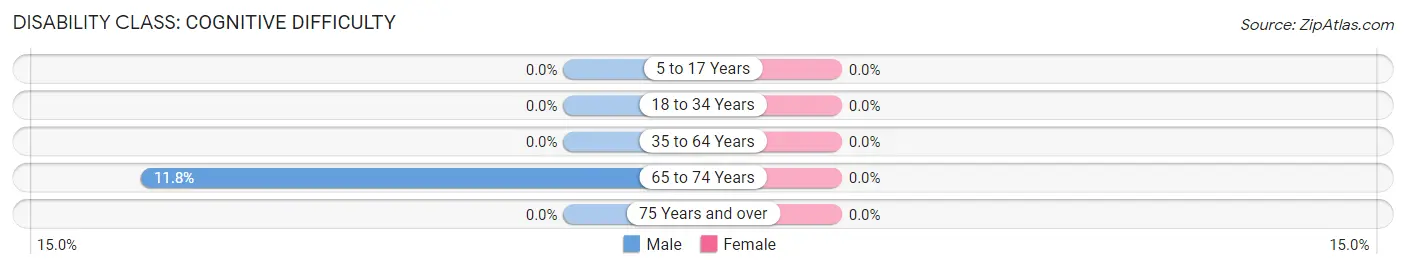
| Age Bracket | Male | Female |
| 5 to 17 Years | 0 (0.0%) | 0 (0.0%) |
| 18 to 34 Years | 0 (0.0%) | 0 (0.0%) |
| 35 to 64 Years | 0 (0.0%) | 0 (0.0%) |
| 65 to 74 Years | 2 (11.8%) | 0 (0.0%) |
| 75 Years and over | 0 (0.0%) | 0 (0.0%) |
Disability Class: Ambulatory Difficulty
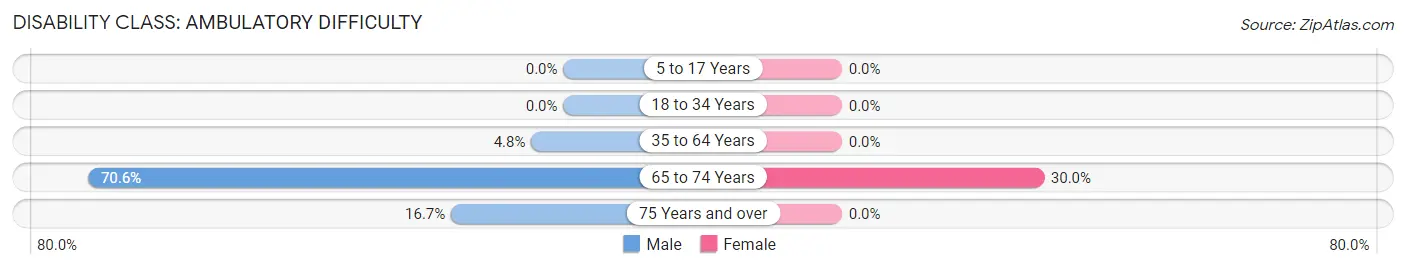
| Age Bracket | Male | Female |
| 5 to 17 Years | 0 (0.0%) | 0 (0.0%) |
| 18 to 34 Years | 0 (0.0%) | 0 (0.0%) |
| 35 to 64 Years | 2 (4.8%) | 0 (0.0%) |
| 65 to 74 Years | 12 (70.6%) | 3 (30.0%) |
| 75 Years and over | 2 (16.7%) | 0 (0.0%) |
Disability Class: Self-Care Difficulty
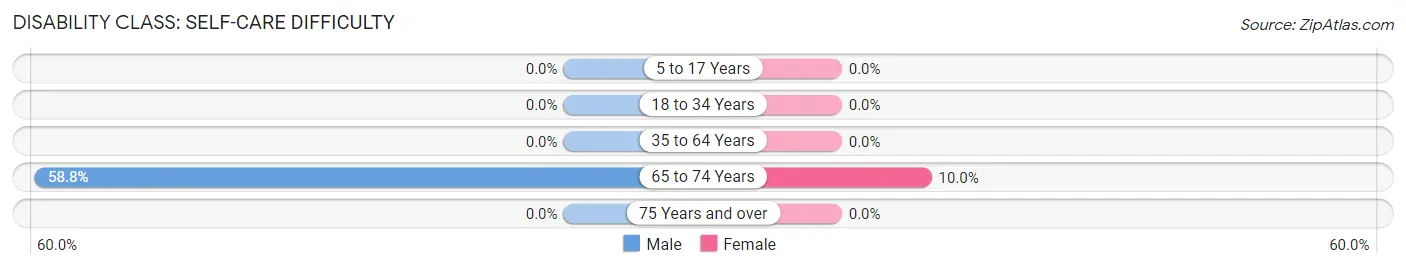
| Age Bracket | Male | Female |
| 5 to 17 Years | 0 (0.0%) | 0 (0.0%) |
| 18 to 34 Years | 0 (0.0%) | 0 (0.0%) |
| 35 to 64 Years | 0 (0.0%) | 0 (0.0%) |
| 65 to 74 Years | 10 (58.8%) | 1 (10.0%) |
| 75 Years and over | 0 (0.0%) | 0 (0.0%) |
Technology Access in Austwell
Computing Device Access in Austwell
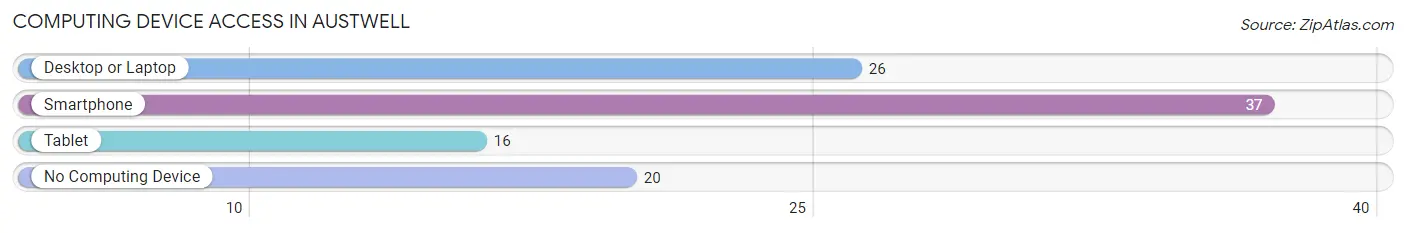
| Device Type | # Households | % Households |
| Desktop or Laptop | 26 | 42.6% |
| Smartphone | 37 | 60.7% |
| Tablet | 16 | 26.2% |
| No Computing Device | 20 | 32.8% |
| Total | 61 | 100.0% |
Internet Access in Austwell
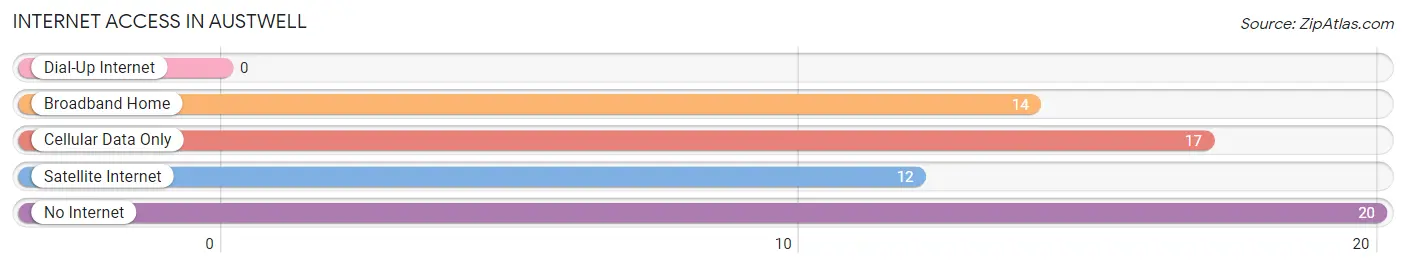
| Internet Type | # Households | % Households |
| Dial-Up Internet | 0 | 0.0% |
| Broadband Home | 14 | 23.0% |
| Cellular Data Only | 17 | 27.9% |
| Satellite Internet | 12 | 19.7% |
| No Internet | 20 | 32.8% |
| Total | 61 | 100.0% |
Austwell Summary
Introduction
Located in Refugio County, Texas, the small town of Austwell is situated on the banks of the San Antonio Bay. With a population of just over 200 people, Austwell is a small, rural community that is home to a variety of businesses, churches, and organizations. The town is known for its rich history, diverse geography, and unique economy. This paper will explore the history, geography, economy, and demographics of Austwell, Texas in 2000 words.
History
The history of Austwell, Texas dates back to the late 1800s. The town was originally founded in 1891 by a group of German settlers who had immigrated to the area from Germany. The settlers named the town after their hometown of Austwell, Germany. The town quickly grew and by the early 1900s, it had become a thriving community with a variety of businesses, churches, and organizations.
In the early 1900s, Austwell was a major center for the cattle industry. The town was home to several large ranches and was a popular destination for cattle drives. In the 1920s, the town began to experience a decline in the cattle industry and many of the ranches were sold off.
In the 1940s, Austwell experienced a resurgence in the economy due to the discovery of oil in the area. The town quickly became a hub for the oil industry and many of the businesses and organizations in the town were related to the oil industry.
In the 1950s, Austwell experienced a decline in the oil industry and many of the businesses and organizations in the town closed. The town experienced a period of stagnation until the late 1970s when the town began to experience a resurgence in the economy due to the discovery of natural gas in the area.
Geography
Austwell is located in Refugio County, Texas, on the banks of the San Antonio Bay. The town is situated on the Gulf Coast and is surrounded by a variety of natural features, including wetlands, estuaries, and coastal prairies. The town is located approximately 30 miles south of Corpus Christi and is accessible by State Highway 35.
The town is located in a humid subtropical climate zone and experiences hot, humid summers and mild winters. The average temperature in the summer is around 90 degrees Fahrenheit and the average temperature in the winter is around 60 degrees Fahrenheit.
Economy
The economy of Austwell is largely based on the oil and gas industry. The town is home to several oil and gas companies, including Chevron, Shell, and ExxonMobil. The town is also home to a variety of other businesses, including restaurants, retail stores, and service providers.
The town is also home to a variety of agricultural businesses, including cattle ranches, dairy farms, and vegetable farms. The town is also home to a variety of fishing businesses, including commercial fishing operations and recreational fishing charters.
Demographics
As of the 2010 census, the population of Austwell was 203 people. The town is predominantly white, with approximately 90% of the population identifying as white. The town is also home to a small Hispanic population, with approximately 8% of the population identifying as Hispanic.
The median household income in Austwell is $37,500, which is slightly lower than the national median household income of $50,000. The town has a poverty rate of approximately 20%, which is slightly higher than the national poverty rate of 15%.
Conclusion
Austwell, Texas is a small, rural town located in Refugio County, Texas. The town is known for its rich history, diverse geography, and unique economy. The town is home to a variety of businesses, churches, and organizations and is largely supported by the oil and gas industry. The town has a population of just over 200 people and is predominantly white, with a small Hispanic population. The town has a median household income of $37,500 and a poverty rate of approximately 20%.
Common Questions
What is Per Capita Income in Austwell?
Per Capita income in Austwell is $31,645.
What is the Median Household income in Austwell?
Median Household Income in Austwell is $55,114.
What is Income or Wage Gap in Austwell?
Income or Wage Gap in Austwell is 50.9%.
Women in Austwell earn 49.1 cents for every dollar earned by a man.
What is Inequality or Gini Index in Austwell?
Inequality or Gini Index in Austwell is 0.39.
What is the Total Population of Austwell?
Total Population of Austwell is 115.
What is the Total Male Population of Austwell?
Total Male Population of Austwell is 79.
What is the Total Female Population of Austwell?
Total Female Population of Austwell is 36.
What is the Ratio of Males per 100 Females in Austwell?
There are 219.44 Males per 100 Females in Austwell.
What is the Ratio of Females per 100 Males in Austwell?
There are 45.57 Females per 100 Males in Austwell.
What is the Median Population Age in Austwell?
Median Population Age in Austwell is 57.7 Years.
What is the Average Family Size in Austwell
Average Family Size in Austwell is 2.5 People.
What is the Average Household Size in Austwell
Average Household Size in Austwell is 1.9 People.
How Large is the Labor Force in Austwell?
There are 59 People in the Labor Forcein in Austwell.
What is the Percentage of People in the Labor Force in Austwell?
51.3% of People are in the Labor Force in Austwell.
What is the Unemployment Rate in Austwell?
Unemployment Rate in Austwell is 3.4%.