Solis, TX Map & Demographics
Solis Map
Solis Overview
$13,586
PER CAPITA INCOME
$62,995
AVG FAMILY INCOME
$70,094
AVG HOUSEHOLD INCOME
0.41
INEQUALITY / GINI INDEX
688
TOTAL POPULATION
289
MALE POPULATION
399
FEMALE POPULATION
72.43
MALES / 100 FEMALES
138.06
FEMALES / 100 MALES
17.9
MEDIAN AGE
4.9
AVG FAMILY SIZE
4.8
AVG HOUSEHOLD SIZE
204
LABOR FORCE [ PEOPLE ]
45.2%
PERCENT IN LABOR FORCE
28.4%
UNEMPLOYMENT RATE
Income in Solis
Income Overview in Solis
Per Capita Income in Solis is $13,586, while median incomes of families and households are $62,995 and $70,094 respectively.
| Characteristic | Number | Measure |
| Per Capita Income | 688 | $13,586 |
| Median Family Income | 125 | $62,995 |
| Mean Family Income | 125 | $66,128 |
| Median Household Income | 142 | $70,094 |
| Mean Household Income | 142 | $62,761 |
| Income Deficit | 125 | $0 |
| Wage / Income Gap (%) | 688 | 0.00% |
| Wage / Income Gap ($) | 688 | 100.00¢ per $1 |
| Gini / Inequality Index | 688 | 0.41 |
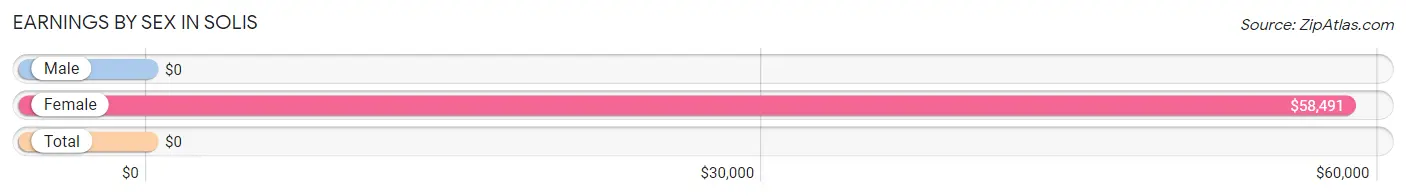
Earnings by Sex in Solis
| Sex | Number | Average Earnings |
| Male | 143 (58.9%) | $0 |
| Female | 100 (41.1%) | $58,491 |
| Total | 243 (100.0%) | $0 |
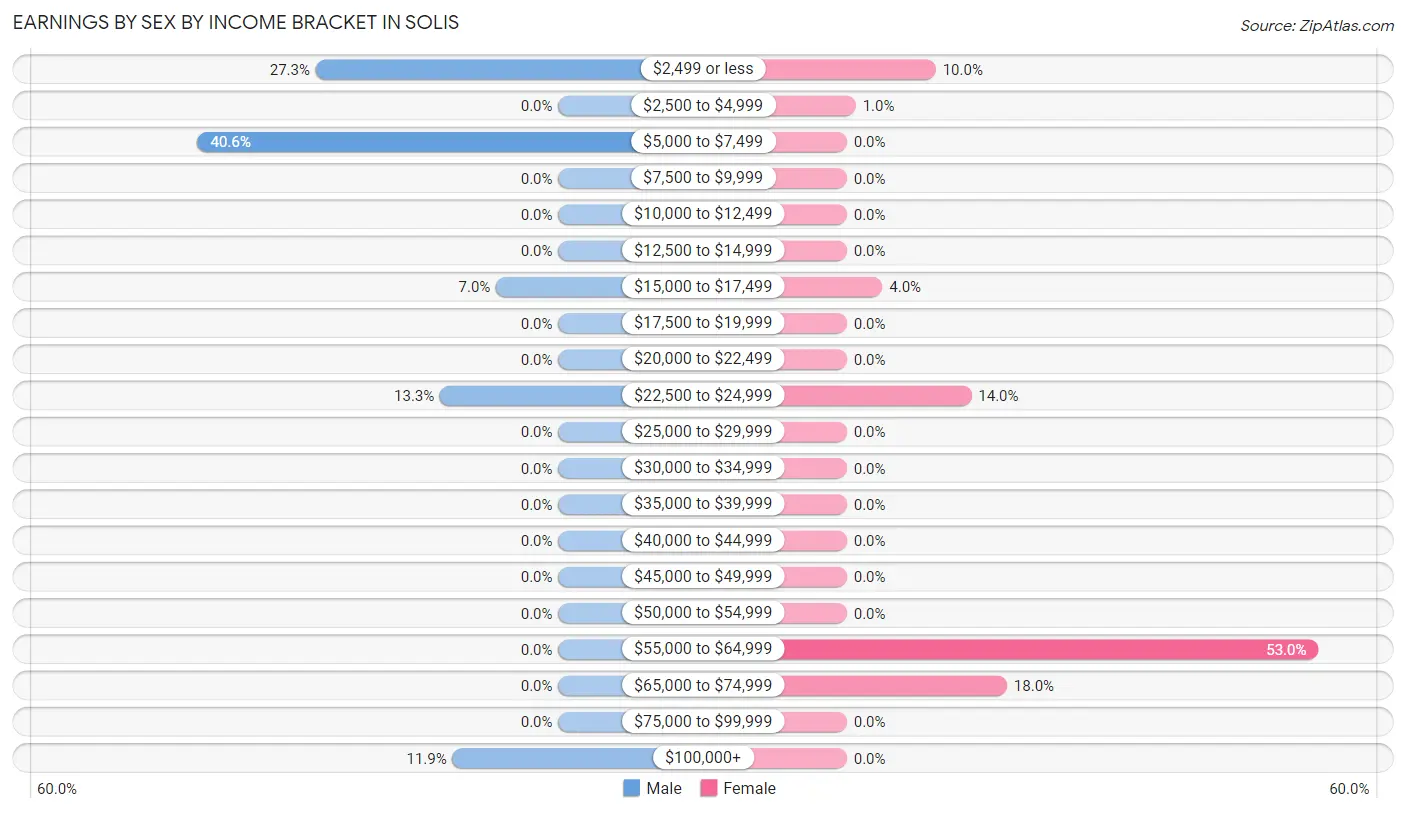
Earnings by Sex by Income Bracket in Solis
The most common earnings brackets in Solis are $5,000 to $7,499 for men (58 | 40.6%) and $55,000 to $64,999 for women (53 | 53.0%).
| Income | Male | Female |
| $2,499 or less | 39 (27.3%) | 10 (10.0%) |
| $2,500 to $4,999 | 0 (0.0%) | 1 (1.0%) |
| $5,000 to $7,499 | 58 (40.6%) | 0 (0.0%) |
| $7,500 to $9,999 | 0 (0.0%) | 0 (0.0%) |
| $10,000 to $12,499 | 0 (0.0%) | 0 (0.0%) |
| $12,500 to $14,999 | 0 (0.0%) | 0 (0.0%) |
| $15,000 to $17,499 | 10 (7.0%) | 4 (4.0%) |
| $17,500 to $19,999 | 0 (0.0%) | 0 (0.0%) |
| $20,000 to $22,499 | 0 (0.0%) | 0 (0.0%) |
| $22,500 to $24,999 | 19 (13.3%) | 14 (14.0%) |
| $25,000 to $29,999 | 0 (0.0%) | 0 (0.0%) |
| $30,000 to $34,999 | 0 (0.0%) | 0 (0.0%) |
| $35,000 to $39,999 | 0 (0.0%) | 0 (0.0%) |
| $40,000 to $44,999 | 0 (0.0%) | 0 (0.0%) |
| $45,000 to $49,999 | 0 (0.0%) | 0 (0.0%) |
| $50,000 to $54,999 | 0 (0.0%) | 0 (0.0%) |
| $55,000 to $64,999 | 0 (0.0%) | 53 (53.0%) |
| $65,000 to $74,999 | 0 (0.0%) | 18 (18.0%) |
| $75,000 to $99,999 | 0 (0.0%) | 0 (0.0%) |
| $100,000+ | 17 (11.9%) | 0 (0.0%) |
| Total | 143 (100.0%) | 100 (100.0%) |
Earnings by Sex by Educational Attainment in Solis
| Educational Attainment | Male Income | Female Income |
| Less than High School | - | - |
| High School Diploma | - | - |
| College or Associate's Degree | - | - |
| Bachelor's Degree | - | - |
| Graduate Degree | - | - |
| Total | - | - |
Family Income in Solis
Family Income Brackets in Solis
According to the Solis family income data, there are 56 families falling into the $50,000 to $74,999 income range, which is the most common income bracket and makes up 44.8% of all families.
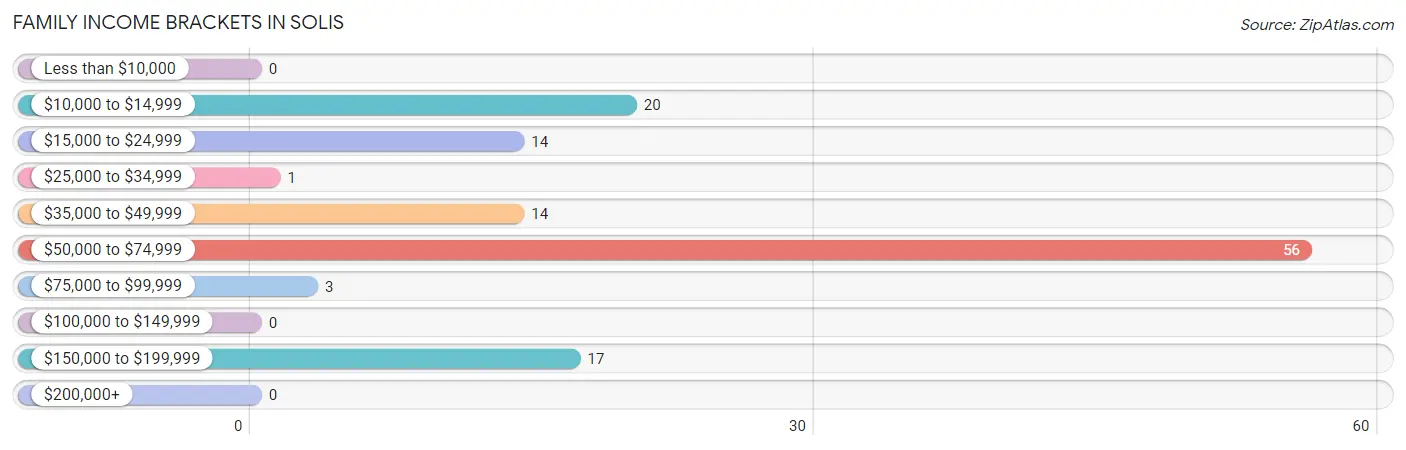
| Income Bracket | # Families | % Families |
| Less than $10,000 | 0 | 0.0% |
| $10,000 to $14,999 | 20 | 16.0% |
| $15,000 to $24,999 | 14 | 11.2% |
| $25,000 to $34,999 | 1 | 0.8% |
| $35,000 to $49,999 | 14 | 11.2% |
| $50,000 to $74,999 | 56 | 44.8% |
| $75,000 to $99,999 | 3 | 2.4% |
| $100,000 to $149,999 | 0 | 0.0% |
| $150,000 to $199,999 | 17 | 13.6% |
| $200,000+ | 0 | 0.0% |
Family Income by Famaliy Size in Solis
2-person families (24 | 19.2%) account for the highest median family income in Solis with $188,235 per family, while 2-person families (24 | 19.2%) have the highest median income of $94,118 per family member.
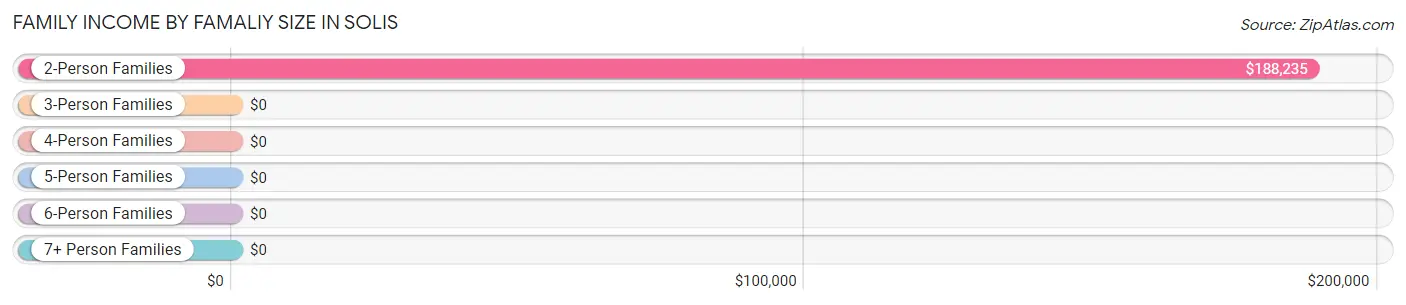
| Income Bracket | # Families | Median Income |
| 2-Person Families | 24 (19.2%) | $188,235 |
| 3-Person Families | 11 (8.8%) | $0 |
| 4-Person Families | 53 (42.4%) | $0 |
| 5-Person Families | 20 (16.0%) | $0 |
| 6-Person Families | 14 (11.2%) | $0 |
| 7+ Person Families | 3 (2.4%) | $0 |
| Total | 125 (100.0%) | $62,995 |
Family Income by Number of Earners in Solis
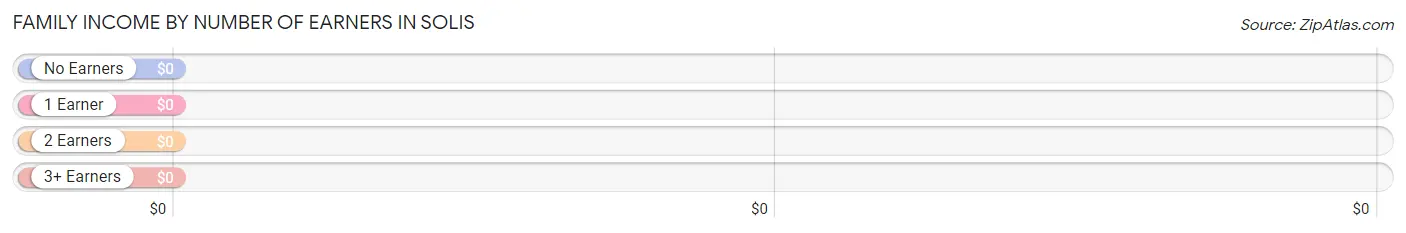
| Number of Earners | # Families | Median Income |
| No Earners | 0 (0.0%) | $0 |
| 1 Earner | 93 (74.4%) | $0 |
| 2 Earners | 32 (25.6%) | $0 |
| 3+ Earners | 0 (0.0%) | $0 |
| Total | 125 (100.0%) | $62,995 |
Household Income in Solis
Household Income Brackets in Solis
With 56 households falling in the category, the $50,000 to $74,999 income range is the most frequent in Solis, accounting for 39.4% of all households.
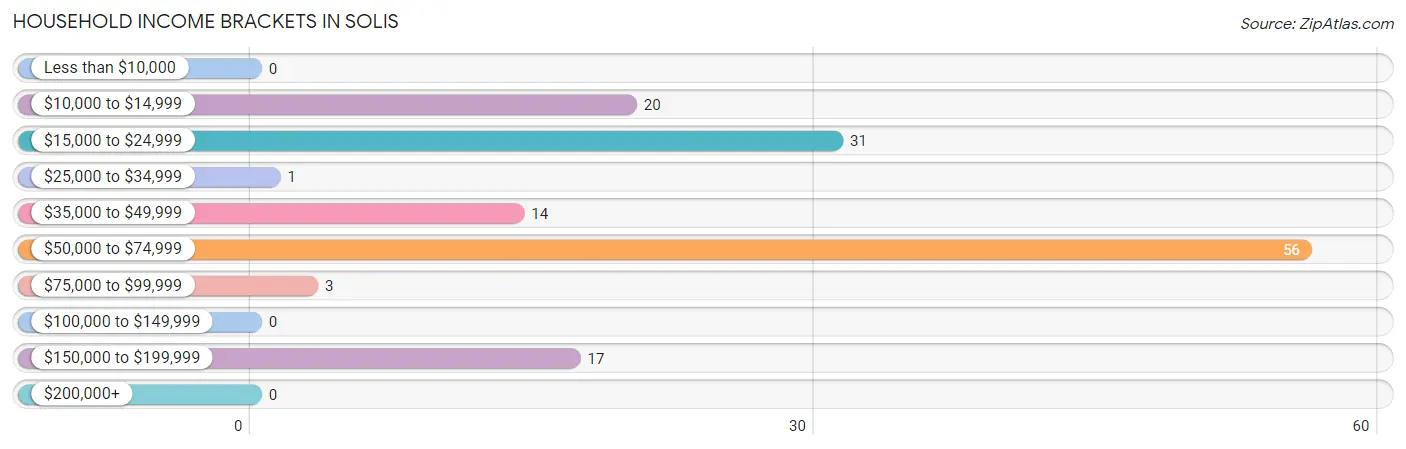
| Income Bracket | # Households | % Households |
| Less than $10,000 | 0 | 0.0% |
| $10,000 to $14,999 | 20 | 14.1% |
| $15,000 to $24,999 | 31 | 21.8% |
| $25,000 to $34,999 | 1 | 0.7% |
| $35,000 to $49,999 | 14 | 9.9% |
| $50,000 to $74,999 | 56 | 39.4% |
| $75,000 to $99,999 | 3 | 2.1% |
| $100,000 to $149,999 | 0 | 0.0% |
| $150,000 to $199,999 | 17 | 12.0% |
| $200,000+ | 0 | 0.0% |
Household Income by Householder Age in Solis
| Income Bracket | # Households | Median Income |
| 15 to 24 Years | 0 (0.0%) | $0 |
| 25 to 44 Years | 67 (47.2%) | $0 |
| 45 to 64 Years | 71 (50.0%) | $0 |
| 65+ Years | 4 (2.8%) | $0 |
| Total | 142 (100.0%) | $70,094 |
Poverty in Solis
Income Below Poverty by Sex and Age in Solis
With 42.2% poverty level for males and 26.8% for females among the residents of Solis, 18 to 24 year old males and 45 to 54 year old females are the most vulnerable to poverty, with 54 males (100.0%) and 20 females (83.3%) in their respective age groups living below the poverty level.
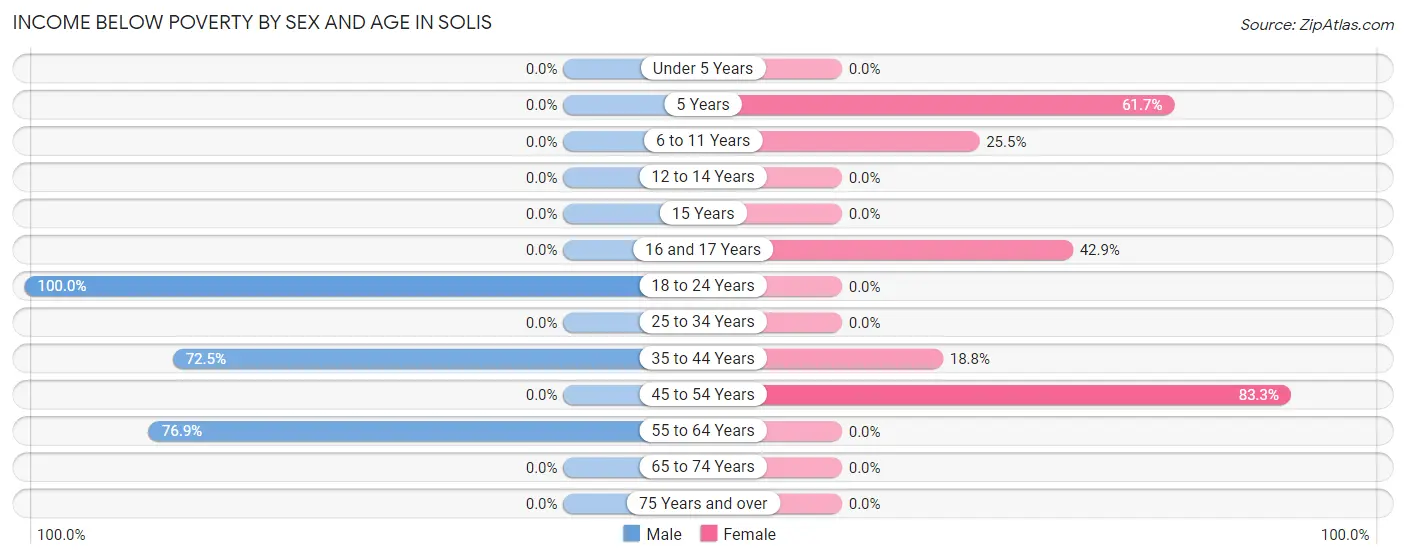
| Age Bracket | Male | Female |
| Under 5 Years | 0 (0.0%) | 0 (0.0%) |
| 5 Years | 0 (0.0%) | 29 (61.7%) |
| 6 to 11 Years | 0 (0.0%) | 25 (25.5%) |
| 12 to 14 Years | 0 (0.0%) | 0 (0.0%) |
| 15 Years | 0 (0.0%) | 0 (0.0%) |
| 16 and 17 Years | 0 (0.0%) | 24 (42.9%) |
| 18 to 24 Years | 54 (100.0%) | 0 (0.0%) |
| 25 to 34 Years | 0 (0.0%) | 0 (0.0%) |
| 35 to 44 Years | 58 (72.5%) | 9 (18.8%) |
| 45 to 54 Years | 0 (0.0%) | 20 (83.3%) |
| 55 to 64 Years | 10 (76.9%) | 0 (0.0%) |
| 65 to 74 Years | 0 (0.0%) | 0 (0.0%) |
| 75 Years and over | 0 (0.0%) | 0 (0.0%) |
| Total | 122 (42.2%) | 107 (26.8%) |
Income Above Poverty by Sex and Age in Solis
According to the poverty statistics in Solis, males aged 6 to 11 years and females aged 12 to 14 years are the age groups that are most secure financially, with 100.0% of males and 100.0% of females in these age groups living above the poverty line.
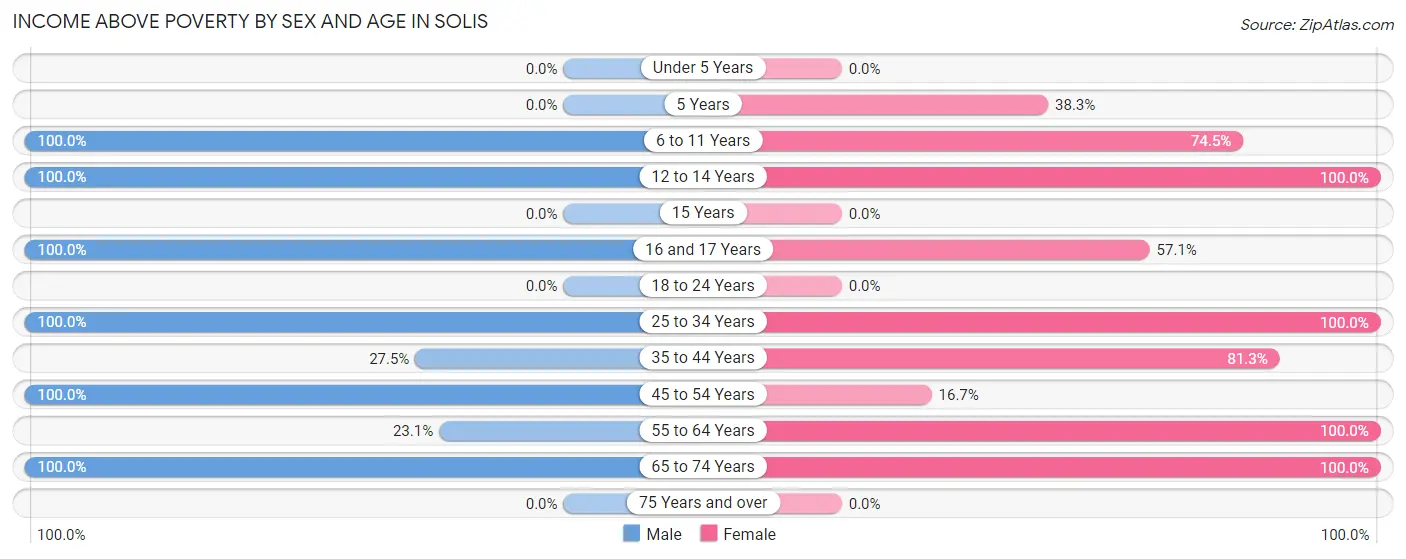
| Age Bracket | Male | Female |
| Under 5 Years | 0 (0.0%) | 0 (0.0%) |
| 5 Years | 0 (0.0%) | 18 (38.3%) |
| 6 to 11 Years | 16 (100.0%) | 73 (74.5%) |
| 12 to 14 Years | 10 (100.0%) | 66 (100.0%) |
| 15 Years | 0 (0.0%) | 0 (0.0%) |
| 16 and 17 Years | 55 (100.0%) | 32 (57.1%) |
| 18 to 24 Years | 0 (0.0%) | 0 (0.0%) |
| 25 to 34 Years | 18 (100.0%) | 53 (100.0%) |
| 35 to 44 Years | 22 (27.5%) | 39 (81.2%) |
| 45 to 54 Years | 34 (100.0%) | 4 (16.7%) |
| 55 to 64 Years | 3 (23.1%) | 4 (100.0%) |
| 65 to 74 Years | 9 (100.0%) | 3 (100.0%) |
| 75 Years and over | 0 (0.0%) | 0 (0.0%) |
| Total | 167 (57.8%) | 292 (73.2%) |
Income Below Poverty Among Married-Couple Families in Solis
The poverty statistics for married-couple families in Solis show that 20.8% or 10 of the total 48 families live below the poverty line. Families with no children have the highest poverty rate of 32.3%, comprising of 10 families. On the other hand, families with 3 or 4 children have the lowest poverty rate of 0.0%, which includes 0 families.
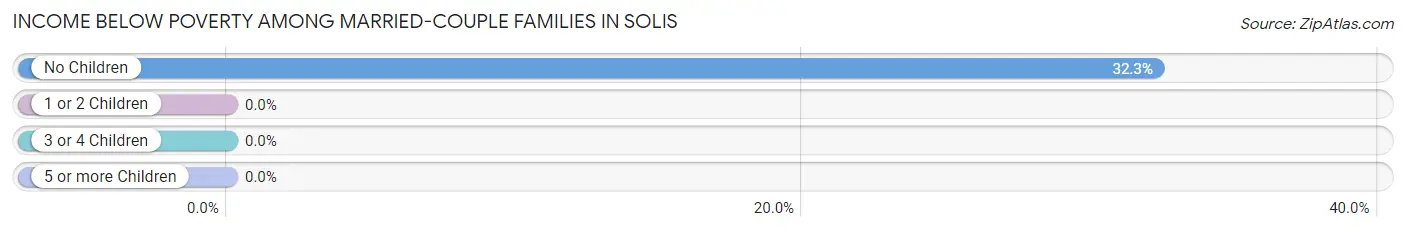
| Children | Above Poverty | Below Poverty |
| No Children | 21 (67.7%) | 10 (32.3%) |
| 1 or 2 Children | 0 (0.0%) | 0 (0.0%) |
| 3 or 4 Children | 17 (100.0%) | 0 (0.0%) |
| 5 or more Children | 0 (0.0%) | 0 (0.0%) |
| Total | 38 (79.2%) | 10 (20.8%) |
Income Below Poverty Among Single-Parent Households in Solis
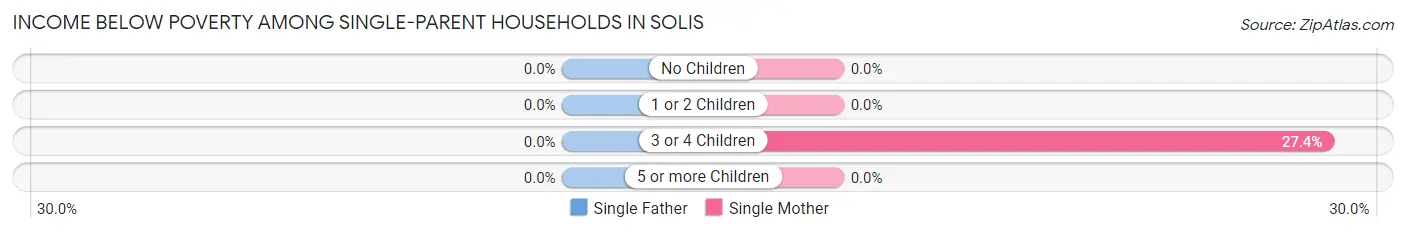
| Children | Single Father | Single Mother |
| No Children | 0 (0.0%) | 0 (0.0%) |
| 1 or 2 Children | 0 (0.0%) | 0 (0.0%) |
| 3 or 4 Children | 0 (0.0%) | 20 (27.4%) |
| 5 or more Children | 0 (0.0%) | 0 (0.0%) |
| Total | 0 (0.0%) | 20 (26.0%) |
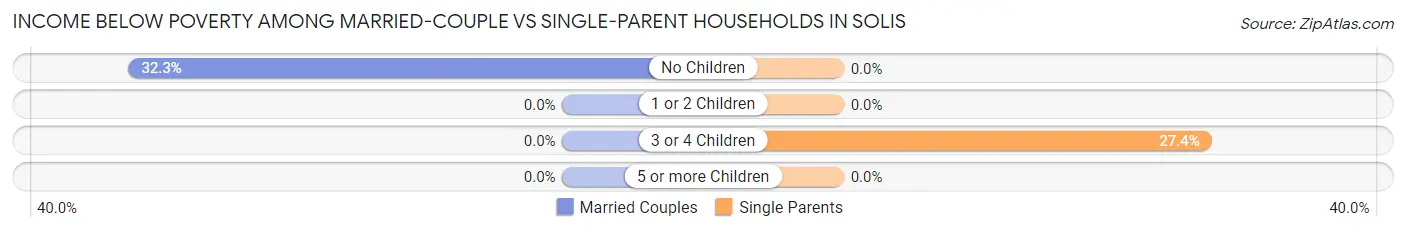
Income Below Poverty Among Married-Couple vs Single-Parent Households in Solis
The poverty data for Solis shows that 10 of the married-couple family households (20.8%) and 20 of the single-parent households (26.0%) are living below the poverty level. Within the married-couple family households, those with no children have the highest poverty rate, with 10 households (32.3%) falling below the poverty line. Among the single-parent households, those with 3 or 4 children have the highest poverty rate, with 20 household (27.4%) living below poverty.
| Children | Married-Couple Families | Single-Parent Households |
| No Children | 10 (32.3%) | 0 (0.0%) |
| 1 or 2 Children | 0 (0.0%) | 0 (0.0%) |
| 3 or 4 Children | 0 (0.0%) | 20 (27.4%) |
| 5 or more Children | 0 (0.0%) | 0 (0.0%) |
| Total | 10 (20.8%) | 20 (26.0%) |
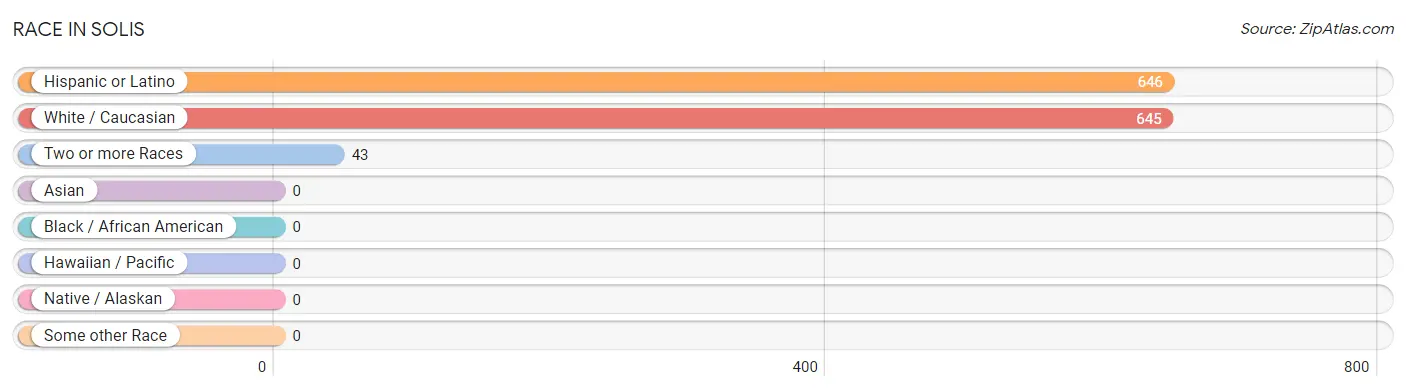
Race in Solis
The most populous races in Solis are Hispanic or Latino (646 | 93.9%), White / Caucasian (645 | 93.8%), and Two or more Races (43 | 6.2%).
| Race | # Population | % Population |
| Asian | 0 | 0.0% |
| Black / African American | 0 | 0.0% |
| Hawaiian / Pacific | 0 | 0.0% |
| Hispanic or Latino | 646 | 93.9% |
| Native / Alaskan | 0 | 0.0% |
| White / Caucasian | 645 | 93.8% |
| Two or more Races | 43 | 6.2% |
| Some other Race | 0 | 0.0% |
| Total | 688 | 100.0% |
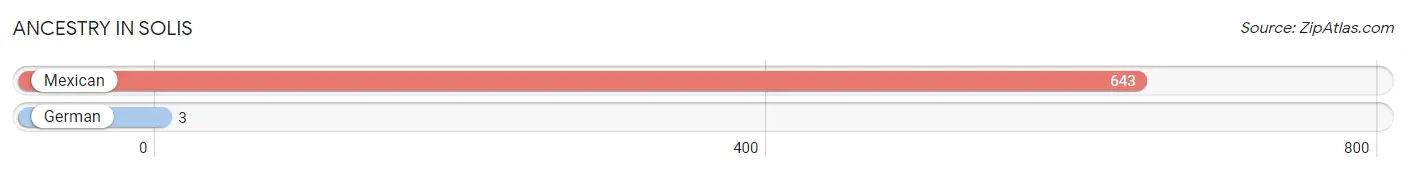
Ancestry in Solis
The most populous ancestries reported in Solis are Mexican (643 | 93.5%), and German (3 | 0.4%), together accounting for 93.9% of all Solis residents.
| Ancestry | # Population | % Population |
| German | 3 | 0.4% |
| Mexican | 643 | 93.5% | View All 2 Rows |
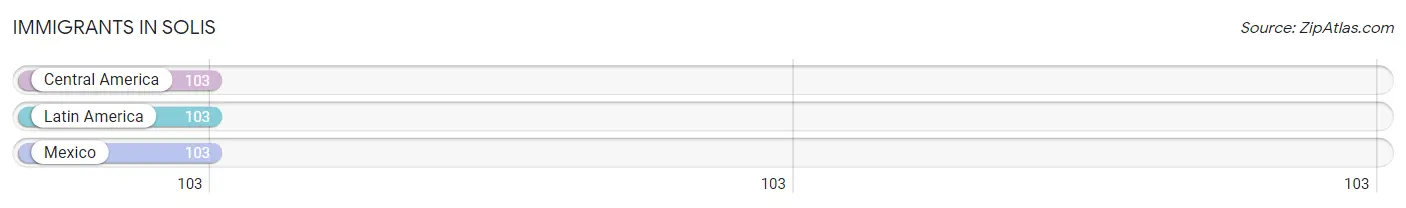
Immigrants in Solis
The most numerous immigrant groups reported in Solis came from Central America (103 | 15.0%), Latin America (103 | 15.0%), and Mexico (103 | 15.0%), together accounting for 44.9% of all Solis residents.
| Immigration Origin | # Population | % Population |
| Central America | 103 | 15.0% |
| Latin America | 103 | 15.0% |
| Mexico | 103 | 15.0% | View All 3 Rows |
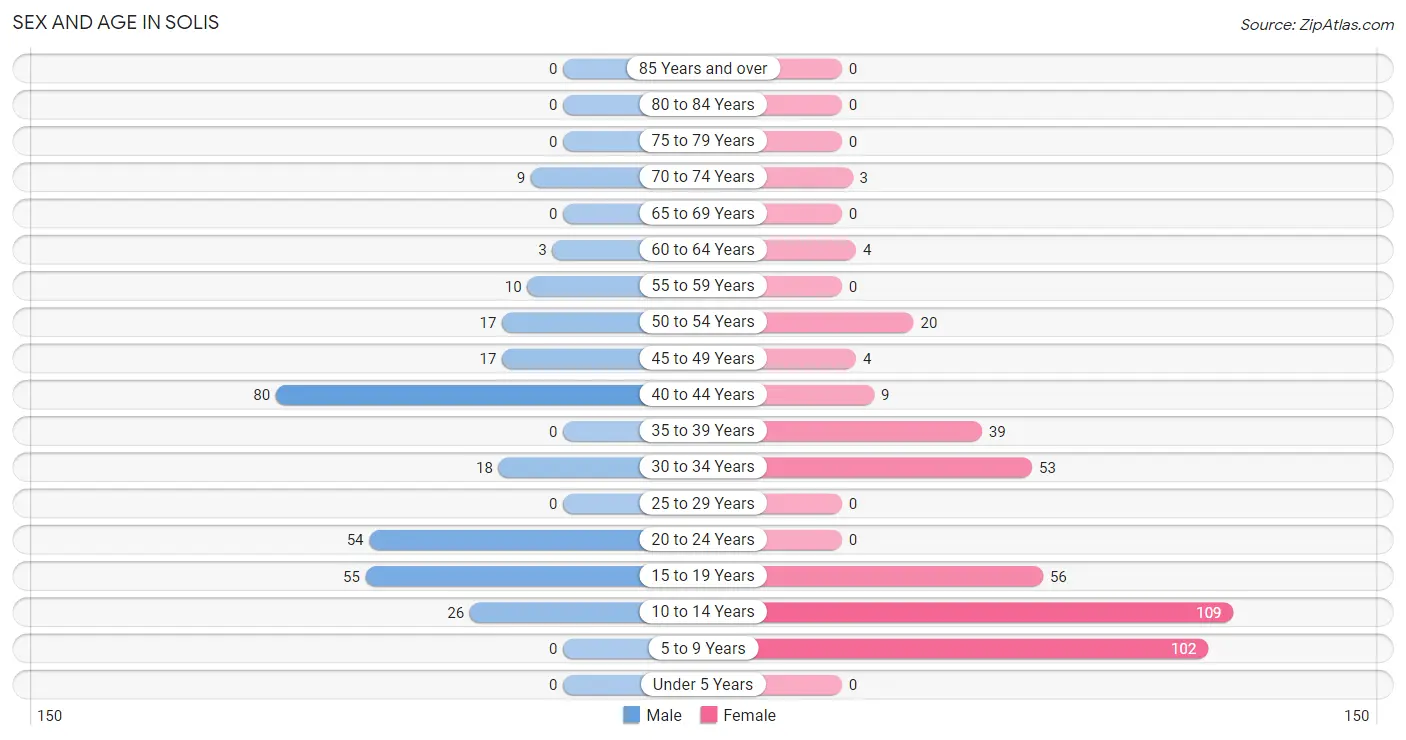
Sex and Age in Solis
Sex and Age in Solis
The most populous age groups in Solis are 40 to 44 Years (80 | 27.7%) for men and 10 to 14 Years (109 | 27.3%) for women.
| Age Bracket | Male | Female |
| Under 5 Years | 0 (0.0%) | 0 (0.0%) |
| 5 to 9 Years | 0 (0.0%) | 102 (25.6%) |
| 10 to 14 Years | 26 (9.0%) | 109 (27.3%) |
| 15 to 19 Years | 55 (19.0%) | 56 (14.0%) |
| 20 to 24 Years | 54 (18.7%) | 0 (0.0%) |
| 25 to 29 Years | 0 (0.0%) | 0 (0.0%) |
| 30 to 34 Years | 18 (6.2%) | 53 (13.3%) |
| 35 to 39 Years | 0 (0.0%) | 39 (9.8%) |
| 40 to 44 Years | 80 (27.7%) | 9 (2.3%) |
| 45 to 49 Years | 17 (5.9%) | 4 (1.0%) |
| 50 to 54 Years | 17 (5.9%) | 20 (5.0%) |
| 55 to 59 Years | 10 (3.5%) | 0 (0.0%) |
| 60 to 64 Years | 3 (1.0%) | 4 (1.0%) |
| 65 to 69 Years | 0 (0.0%) | 0 (0.0%) |
| 70 to 74 Years | 9 (3.1%) | 3 (0.7%) |
| 75 to 79 Years | 0 (0.0%) | 0 (0.0%) |
| 80 to 84 Years | 0 (0.0%) | 0 (0.0%) |
| 85 Years and over | 0 (0.0%) | 0 (0.0%) |
| Total | 289 (100.0%) | 399 (100.0%) |
Families and Households in Solis
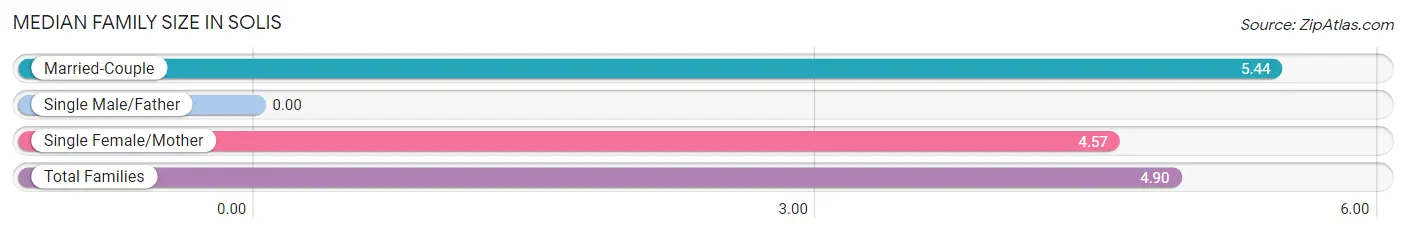
Median Family Size in Solis
| Family Type | # Families | Family Size |
| Married-Couple | 48 (38.4%) | 5.44 |
| Single Male/Father | 0 (0.0%) | - |
| Single Female/Mother | 77 (61.6%) | 4.57 |
| Total Families | 125 (100.0%) | 4.90 |
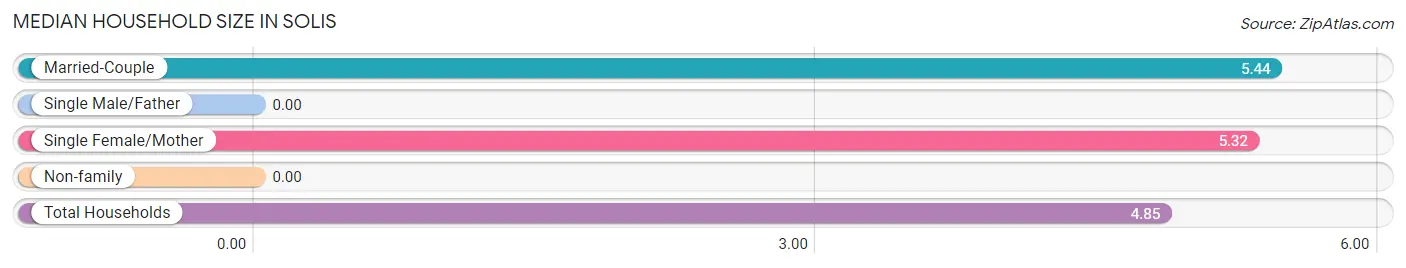
Median Household Size in Solis
| Household Type | # Households | Household Size |
| Married-Couple | 48 (33.8%) | 5.44 |
| Single Male/Father | 0 (0.0%) | - |
| Single Female/Mother | 77 (54.2%) | 5.32 |
| Non-family | 17 (12.0%) | - |
| Total Households | 142 (100.0%) | 4.85 |
Household Size by Marriage Status in Solis
Out of a total of 142 households in Solis, 125 (88.0%) are family households, while 17 (12.0%) are nonfamily households. The most numerous type of family households are 5-person households, comprising 73, and the most common type of nonfamily households are 1-person households, comprising 17.
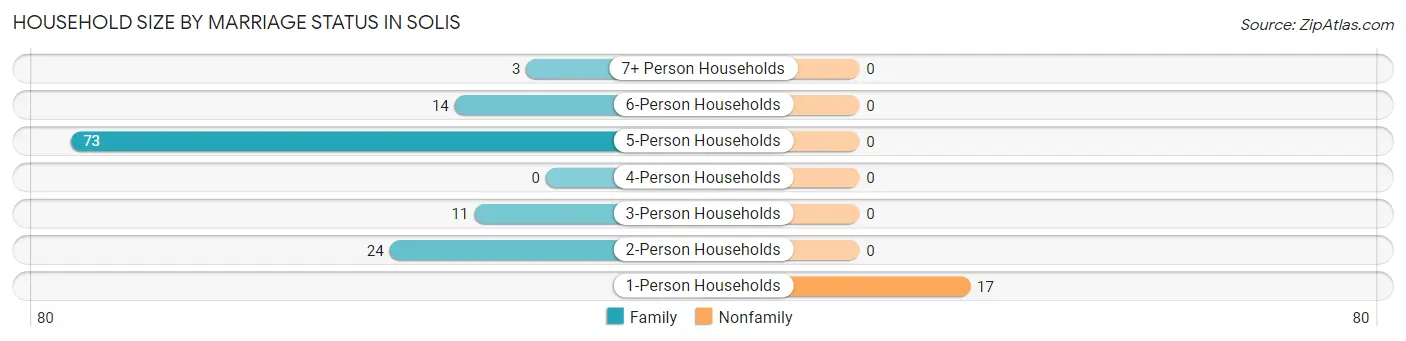
| Household Size | Family Households | Nonfamily Households |
| 1-Person Households | - | 17 (12.0%) |
| 2-Person Households | 24 (16.9%) | 0 (0.0%) |
| 3-Person Households | 11 (7.7%) | 0 (0.0%) |
| 4-Person Households | 0 (0.0%) | 0 (0.0%) |
| 5-Person Households | 73 (51.4%) | 0 (0.0%) |
| 6-Person Households | 14 (9.9%) | 0 (0.0%) |
| 7+ Person Households | 3 (2.1%) | 0 (0.0%) |
| Total | 125 (88.0%) | 17 (12.0%) |
Female Fertility in Solis
Fertility by Age in Solis
| Age Bracket | Women with Births | Births / 1,000 Women |
| 15 to 19 years | 0 (0.0%) | 0.0 |
| 20 to 34 years | 0 (0.0%) | 0.0 |
| 35 to 50 years | 0 (0.0%) | 0.0 |
| Total | 0 (0.0%) | 0.0 |
Fertility by Age by Marriage Status in Solis
| Age Bracket | Married | Unmarried |
| 15 to 19 years | 0 (0.0%) | 0 (0.0%) |
| 20 to 34 years | 0 (0.0%) | 0 (0.0%) |
| 35 to 50 years | 0 (0.0%) | 0 (0.0%) |
| Total | 0 (0.0%) | 0 (0.0%) |
Fertility by Education in Solis
| Educational Attainment | Women with Births | Births / 1,000 Women |
| Less than High School | 0 (0.0%) | 0.0 |
| High School Diploma | 0 (0.0%) | 0.0 |
| College or Associate's Degree | 0 (0.0%) | 0.0 |
| Bachelor's Degree | 0 (0.0%) | 0.0 |
| Graduate Degree | 0 (0.0%) | 0.0 |
| Total | 0 (0.0%) | 0.0 |
Fertility by Education by Marriage Status in Solis
| Educational Attainment | Married | Unmarried |
| Less than High School | 0 (0.0%) | 0 (0.0%) |
| High School Diploma | 0 (0.0%) | 0 (0.0%) |
| College or Associate's Degree | 0 (0.0%) | 0 (0.0%) |
| Bachelor's Degree | 0 (0.0%) | 0 (0.0%) |
| Graduate Degree | 0 (0.0%) | 0 (0.0%) |
| Total | 0 (0.0%) | 0 (0.0%) |
Employment Characteristics in Solis
Employment by Class of Employer in Solis
Among the 146 employed individuals in Solis, local government employees (53 | 36.3%), private company employees (41 | 28.1%), and self-employed (not incorporated) (34 | 23.3%) make up the most common classes of employment.
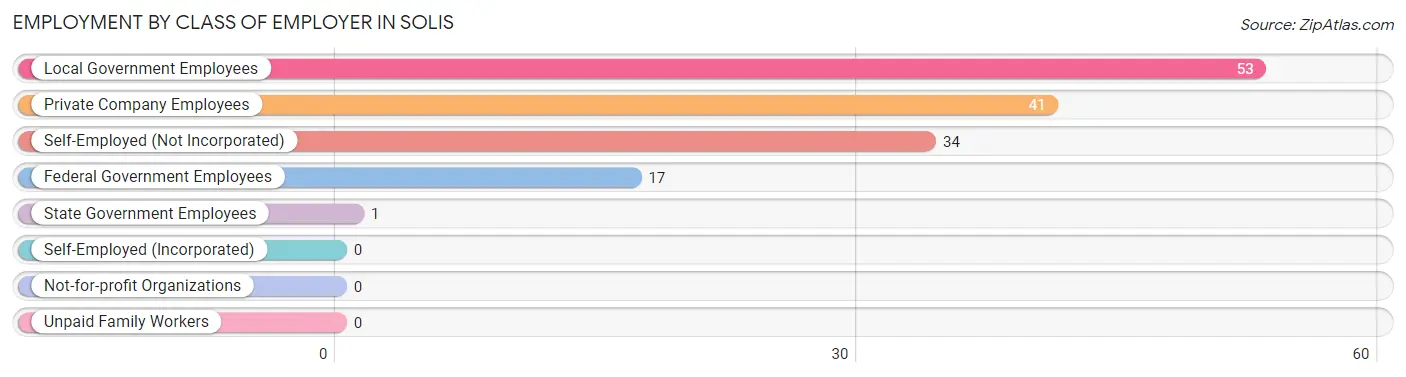
| Employer Class | # Employees | % Employees |
| Private Company Employees | 41 | 28.1% |
| Self-Employed (Incorporated) | 0 | 0.0% |
| Self-Employed (Not Incorporated) | 34 | 23.3% |
| Not-for-profit Organizations | 0 | 0.0% |
| Local Government Employees | 53 | 36.3% |
| State Government Employees | 1 | 0.7% |
| Federal Government Employees | 17 | 11.6% |
| Unpaid Family Workers | 0 | 0.0% |
| Total | 146 | 100.0% |
Employment Status by Age in Solis
According to the labor force statistics for Solis, out of the total population over 16 years of age (451), 45.2% or 204 individuals are in the labor force, with 28.4% or 58 of them unemployed. The age group with the highest labor force participation rate is 30 to 34 years, with 100.0% or 71 individuals in the labor force. Within the labor force, the 35 to 44 years age range has the highest percentage of unemployed individuals, with 59.2% or 58 of them being unemployed.
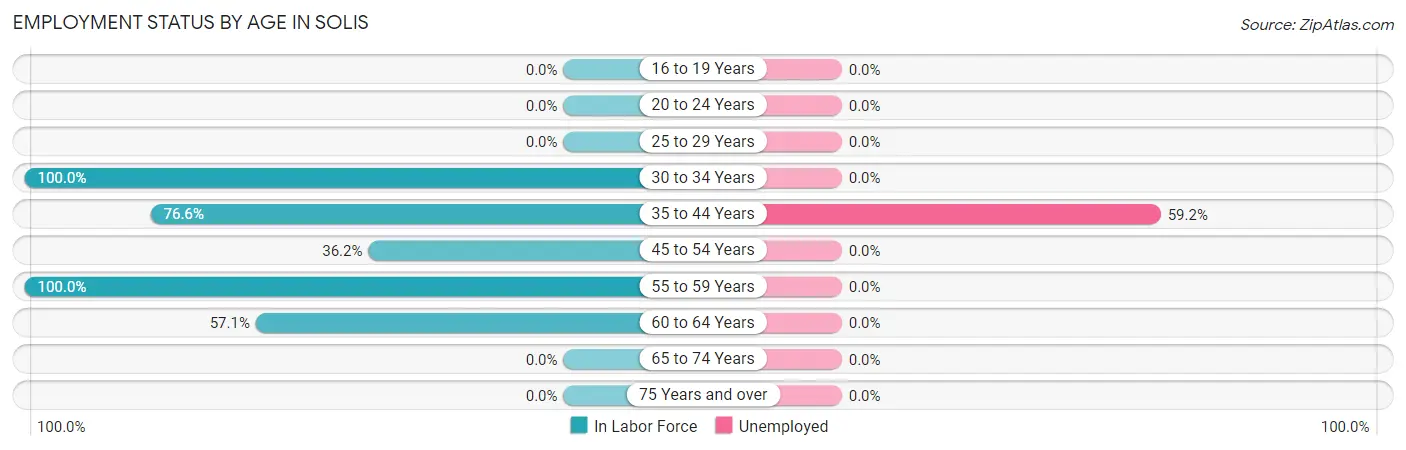
| Age Bracket | In Labor Force | Unemployed |
| 16 to 19 Years | 0 (0.0%) | 0 (0.0%) |
| 20 to 24 Years | 0 (0.0%) | 0 (0.0%) |
| 25 to 29 Years | 0 (0.0%) | 0 (0.0%) |
| 30 to 34 Years | 71 (100.0%) | 0 (0.0%) |
| 35 to 44 Years | 98 (76.6%) | 58 (59.2%) |
| 45 to 54 Years | 21 (36.2%) | 0 (0.0%) |
| 55 to 59 Years | 10 (100.0%) | 0 (0.0%) |
| 60 to 64 Years | 4 (57.1%) | 0 (0.0%) |
| 65 to 74 Years | 0 (0.0%) | 0 (0.0%) |
| 75 Years and over | 0 (0.0%) | 0 (0.0%) |
| Total | 204 (45.2%) | 58 (28.4%) |
Employment Status by Educational Attainment in Solis
According to labor force statistics for Solis, 74.5% of individuals (204) out of the total population between 25 and 64 years of age (274) are in the labor force, with 28.4% or 58 of them being unemployed. The group with the highest labor force participation rate are those with the educational attainment of bachelor's degree or higher, with 100.0% or 32 individuals in the labor force. Within the labor force, individuals with college / associate degree education have the highest percentage of unemployment, with 79.5% or 58 of them being unemployed.
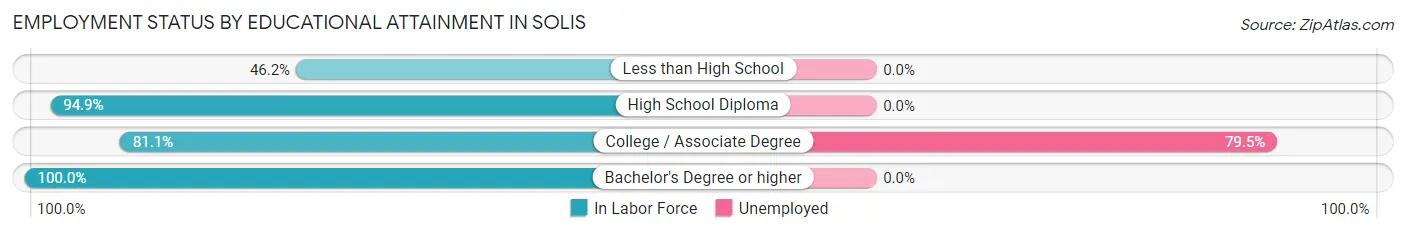
| Educational Attainment | In Labor Force | Unemployed |
| Less than High School | 43 (46.2%) | 0 (0.0%) |
| High School Diploma | 56 (94.9%) | 0 (0.0%) |
| College / Associate Degree | 73 (81.1%) | 72 (79.5%) |
| Bachelor's Degree or higher | 32 (100.0%) | 0 (0.0%) |
| Total | 204 (74.5%) | 78 (28.4%) |
Employment Occupations by Sex in Solis
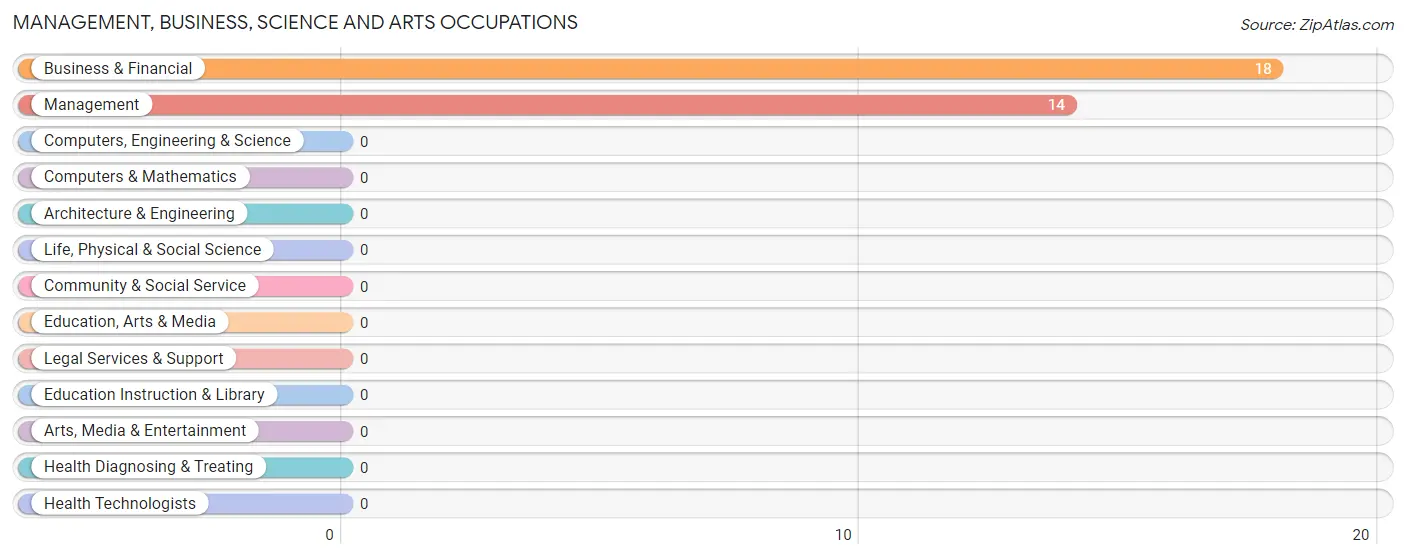
Management, Business, Science and Arts Occupations
The most common Management, Business, Science and Arts occupations in Solis are Business & Financial (18 | 12.3%), and Management (14 | 9.6%).
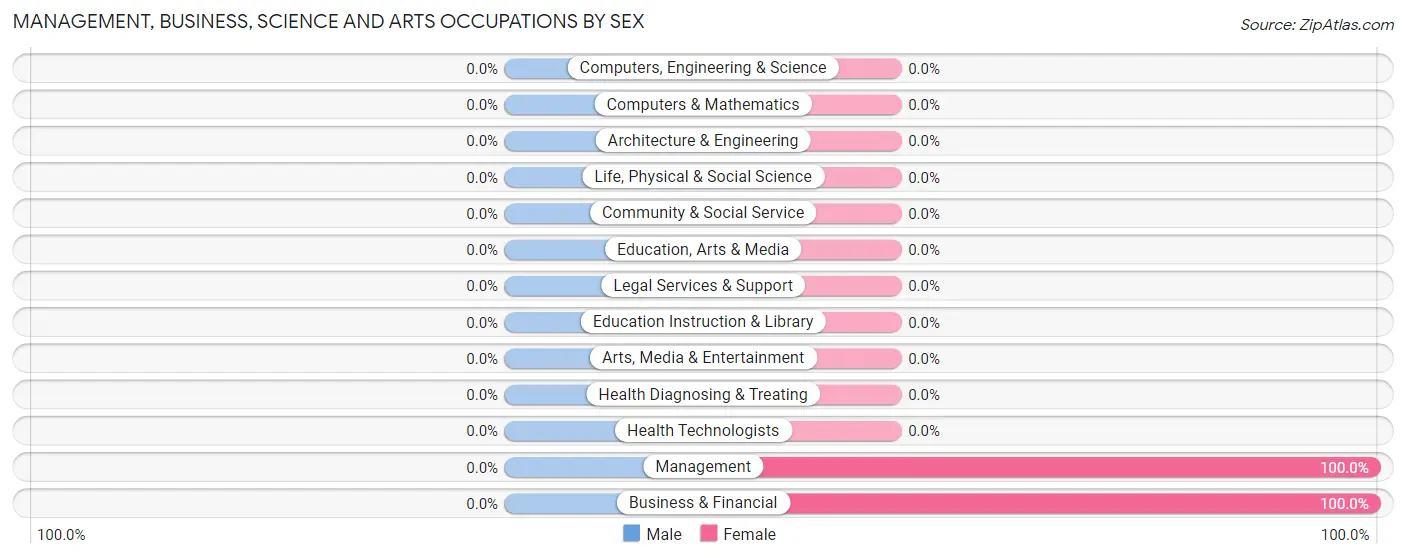
Management, Business, Science and Arts Occupations by Sex
| Occupation | Male | Female |
| Management | 0 (0.0%) | 14 (100.0%) |
| Business & Financial | 0 (0.0%) | 18 (100.0%) |
| Computers, Engineering & Science | 0 (0.0%) | 0 (0.0%) |
| Computers & Mathematics | 0 (0.0%) | 0 (0.0%) |
| Architecture & Engineering | 0 (0.0%) | 0 (0.0%) |
| Life, Physical & Social Science | 0 (0.0%) | 0 (0.0%) |
| Community & Social Service | 0 (0.0%) | 0 (0.0%) |
| Education, Arts & Media | 0 (0.0%) | 0 (0.0%) |
| Legal Services & Support | 0 (0.0%) | 0 (0.0%) |
| Education Instruction & Library | 0 (0.0%) | 0 (0.0%) |
| Arts, Media & Entertainment | 0 (0.0%) | 0 (0.0%) |
| Health Diagnosing & Treating | 0 (0.0%) | 0 (0.0%) |
| Health Technologists | 0 (0.0%) | 0 (0.0%) |
| Total (Category) | 0 (0.0%) | 32 (100.0%) |
| Total (Overall) | 46 (31.5%) | 100 (68.5%) |
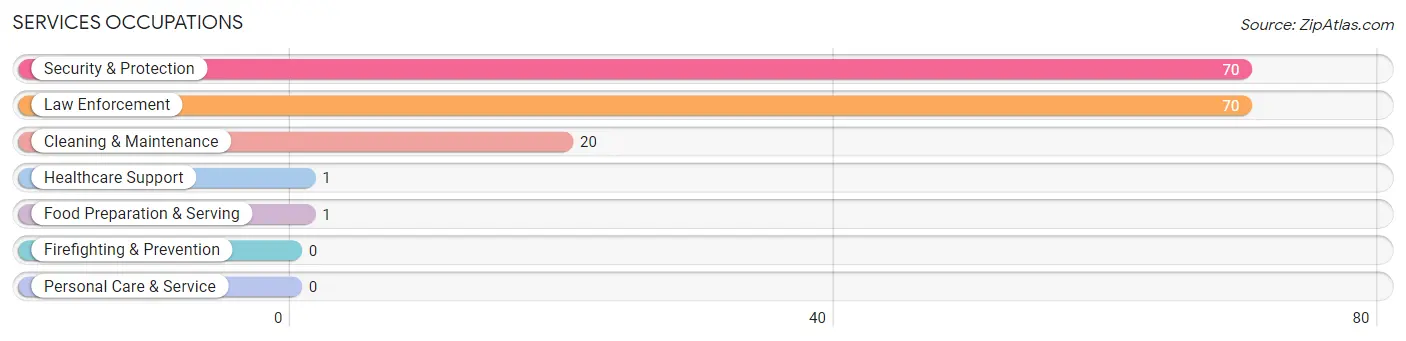
Services Occupations
The most common Services occupations in Solis are Security & Protection (70 | 47.9%), Law Enforcement (70 | 47.9%), Cleaning & Maintenance (20 | 13.7%), Healthcare Support (1 | 0.7%), and Food Preparation & Serving (1 | 0.7%).
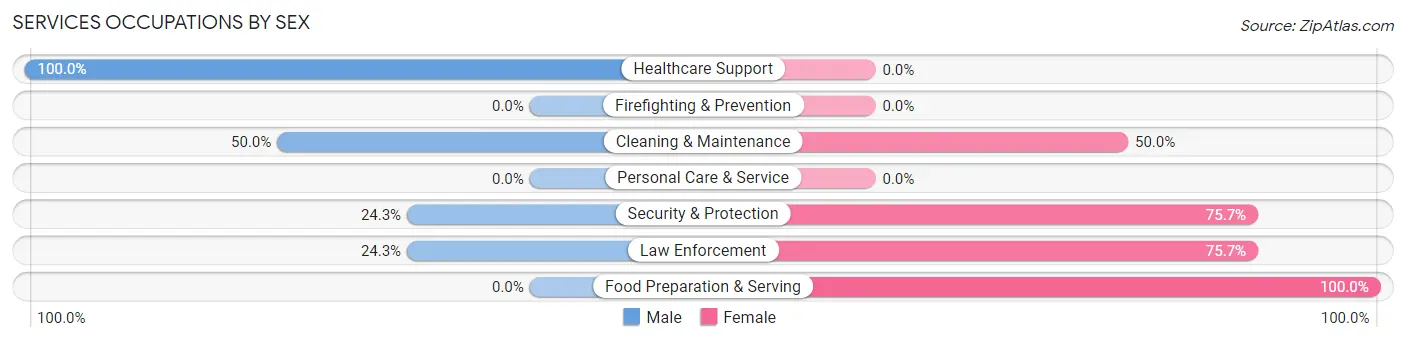
Services Occupations by Sex
Within the Services occupations in Solis, the most male-oriented occupations are Healthcare Support (100.0%), Cleaning & Maintenance (50.0%), and Security & Protection (24.3%), while the most female-oriented occupations are Food Preparation & Serving (100.0%), Security & Protection (75.7%), and Law Enforcement (75.7%).
| Occupation | Male | Female |
| Healthcare Support | 1 (100.0%) | 0 (0.0%) |
| Security & Protection | 17 (24.3%) | 53 (75.7%) |
| Firefighting & Prevention | 0 (0.0%) | 0 (0.0%) |
| Law Enforcement | 17 (24.3%) | 53 (75.7%) |
| Food Preparation & Serving | 0 (0.0%) | 1 (100.0%) |
| Cleaning & Maintenance | 10 (50.0%) | 10 (50.0%) |
| Personal Care & Service | 0 (0.0%) | 0 (0.0%) |
| Total (Category) | 28 (30.4%) | 64 (69.6%) |
| Total (Overall) | 46 (31.5%) | 100 (68.5%) |
Sales and Office Occupations
The most common Sales and Office occupations in Solis are , and Office & Administration (4 | 2.7%).
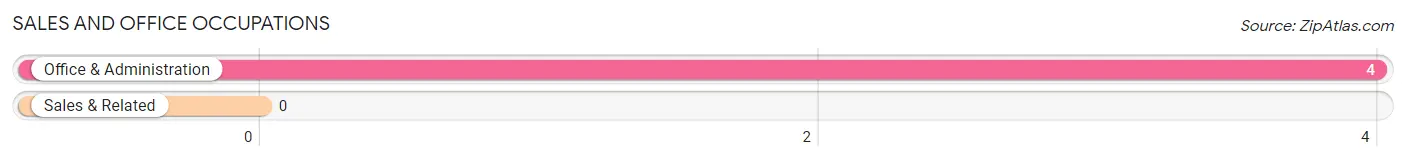
Sales and Office Occupations by Sex
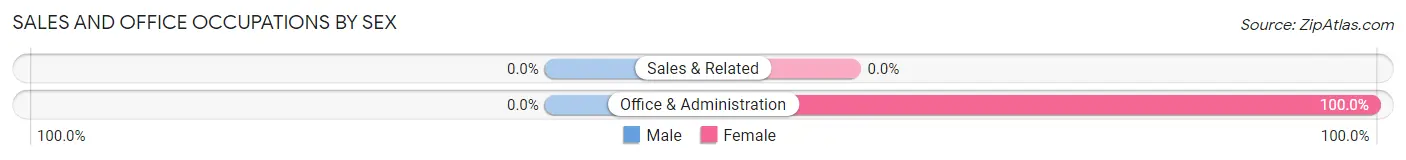
| Occupation | Male | Female |
| Sales & Related | 0 (0.0%) | 0 (0.0%) |
| Office & Administration | 0 (0.0%) | 4 (100.0%) |
| Total (Category) | 0 (0.0%) | 4 (100.0%) |
| Total (Overall) | 46 (31.5%) | 100 (68.5%) |
Natural Resources, Construction and Maintenance Occupations
The most common Natural Resources, Construction and Maintenance occupations in Solis are , and Construction & Extraction (18 | 12.3%).
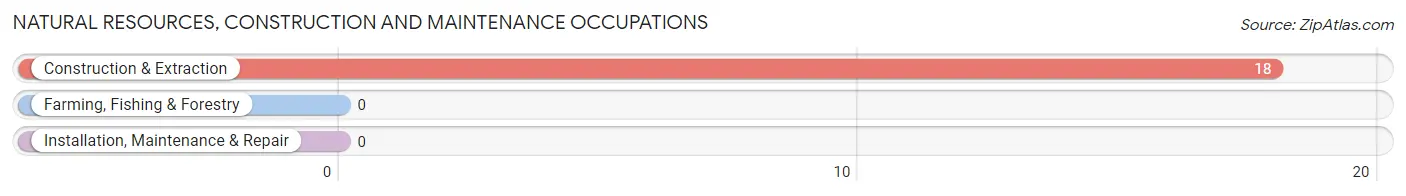
Natural Resources, Construction and Maintenance Occupations by Sex
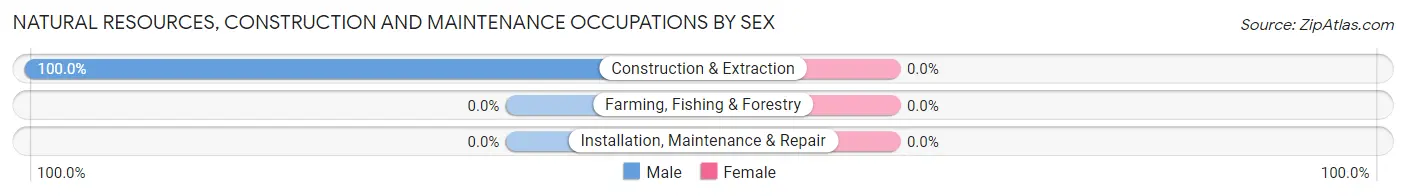
| Occupation | Male | Female |
| Farming, Fishing & Forestry | 0 (0.0%) | 0 (0.0%) |
| Construction & Extraction | 18 (100.0%) | 0 (0.0%) |
| Installation, Maintenance & Repair | 0 (0.0%) | 0 (0.0%) |
| Total (Category) | 18 (100.0%) | 0 (0.0%) |
| Total (Overall) | 46 (31.5%) | 100 (68.5%) |
Production, Transportation and Moving Occupations
Production, Transportation and Moving Occupations by Sex
| Occupation | Male | Female |
| Production | 0 (0.0%) | 0 (0.0%) |
| Transportation | 0 (0.0%) | 0 (0.0%) |
| Material Moving | 0 (0.0%) | 0 (0.0%) |
| Total (Category) | 0 (0.0%) | 0 (0.0%) |
| Total (Overall) | 46 (31.5%) | 100 (68.5%) |
Employment Industries by Sex in Solis
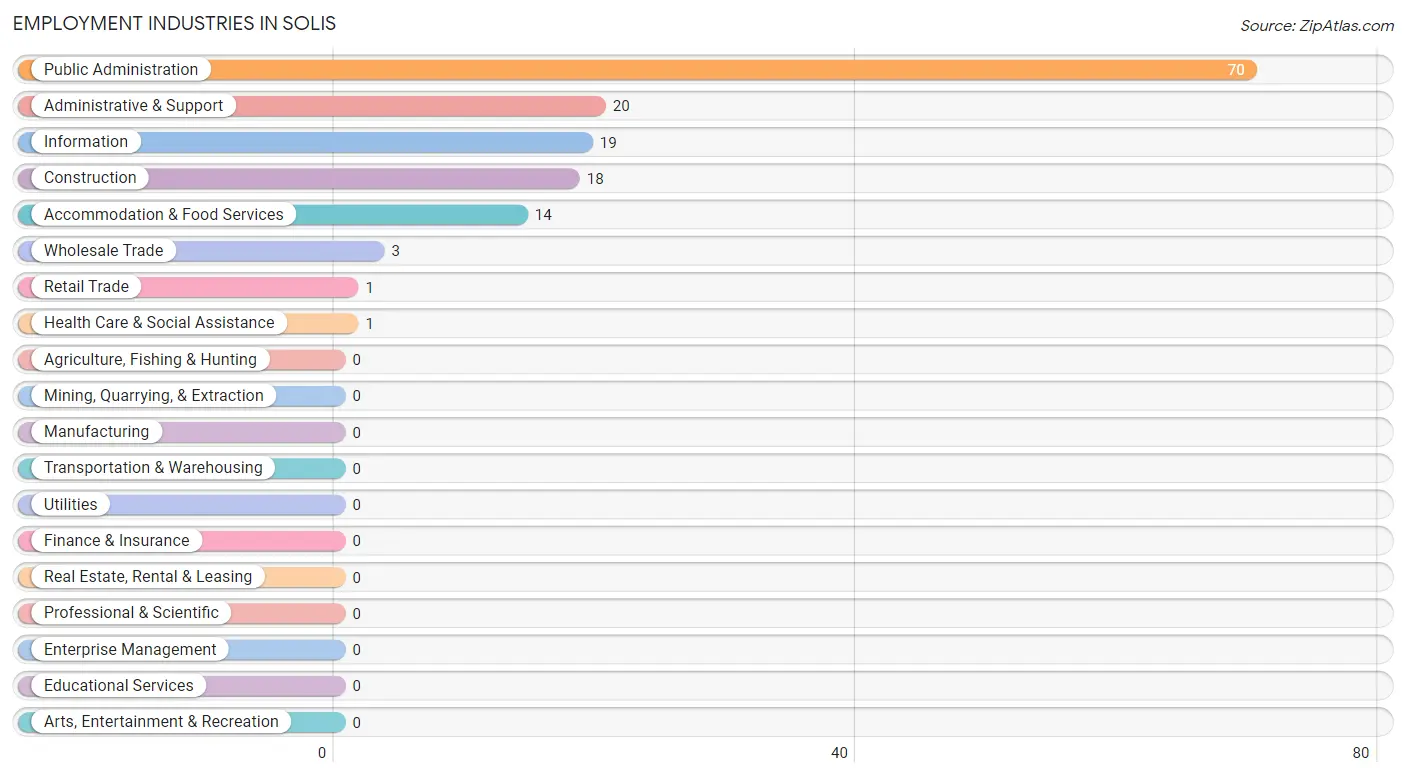
Employment Industries in Solis
The major employment industries in Solis include Public Administration (70 | 47.9%), Administrative & Support (20 | 13.7%), Information (19 | 13.0%), Construction (18 | 12.3%), and Accommodation & Food Services (14 | 9.6%).
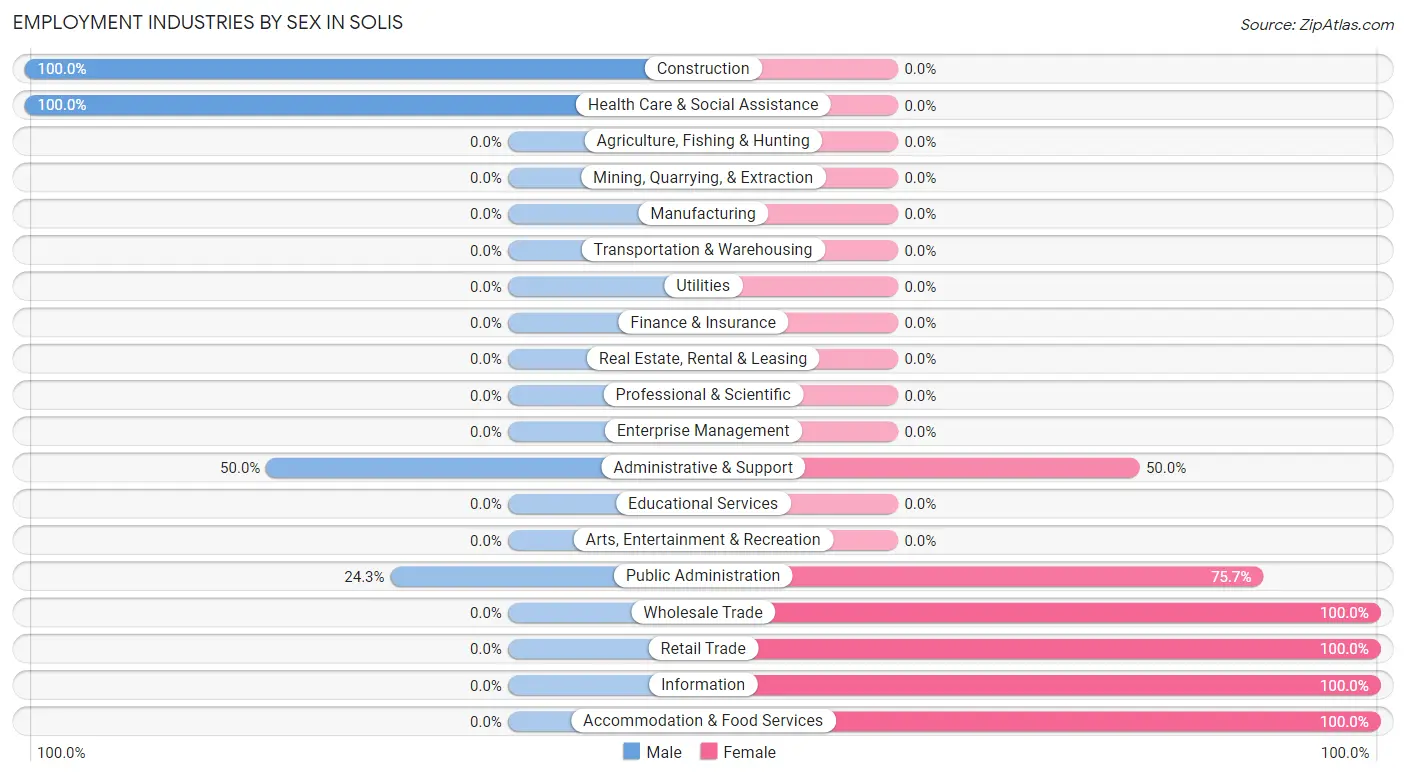
Employment Industries by Sex in Solis
The Solis industries that see more men than women are Construction (100.0%), Health Care & Social Assistance (100.0%), and Administrative & Support (50.0%), whereas the industries that tend to have a higher number of women are Wholesale Trade (100.0%), Retail Trade (100.0%), and Information (100.0%).
| Industry | Male | Female |
| Agriculture, Fishing & Hunting | 0 (0.0%) | 0 (0.0%) |
| Mining, Quarrying, & Extraction | 0 (0.0%) | 0 (0.0%) |
| Construction | 18 (100.0%) | 0 (0.0%) |
| Manufacturing | 0 (0.0%) | 0 (0.0%) |
| Wholesale Trade | 0 (0.0%) | 3 (100.0%) |
| Retail Trade | 0 (0.0%) | 1 (100.0%) |
| Transportation & Warehousing | 0 (0.0%) | 0 (0.0%) |
| Utilities | 0 (0.0%) | 0 (0.0%) |
| Information | 0 (0.0%) | 19 (100.0%) |
| Finance & Insurance | 0 (0.0%) | 0 (0.0%) |
| Real Estate, Rental & Leasing | 0 (0.0%) | 0 (0.0%) |
| Professional & Scientific | 0 (0.0%) | 0 (0.0%) |
| Enterprise Management | 0 (0.0%) | 0 (0.0%) |
| Administrative & Support | 10 (50.0%) | 10 (50.0%) |
| Educational Services | 0 (0.0%) | 0 (0.0%) |
| Health Care & Social Assistance | 1 (100.0%) | 0 (0.0%) |
| Arts, Entertainment & Recreation | 0 (0.0%) | 0 (0.0%) |
| Accommodation & Food Services | 0 (0.0%) | 14 (100.0%) |
| Public Administration | 17 (24.3%) | 53 (75.7%) |
| Total | 46 (31.5%) | 100 (68.5%) |
Education in Solis
School Enrollment in Solis
The most common levels of schooling among the 358 students in Solis are high school (111 | 31.0%), middle school (99 | 27.7%), and elementary school (80 | 22.4%).
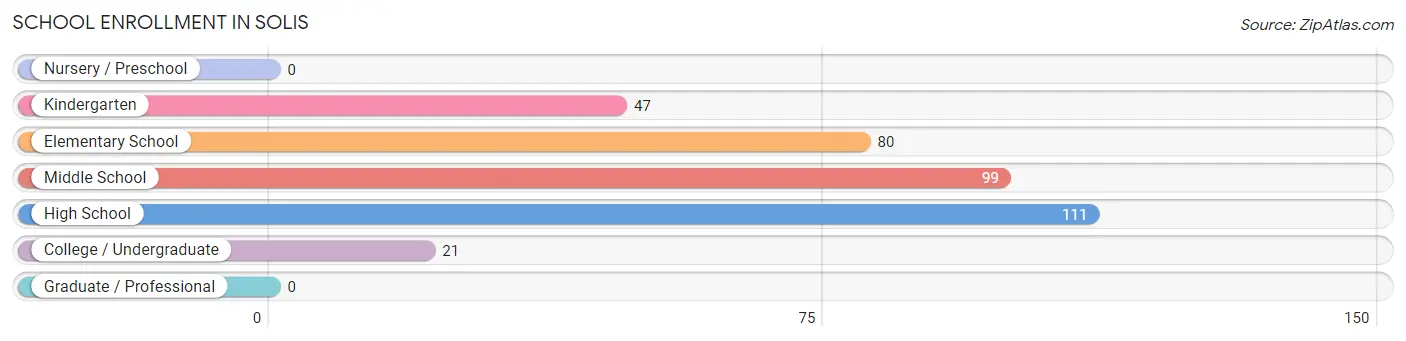
| School Level | # Students | % Students |
| Nursery / Preschool | 0 | 0.0% |
| Kindergarten | 47 | 13.1% |
| Elementary School | 80 | 22.4% |
| Middle School | 99 | 27.7% |
| High School | 111 | 31.0% |
| College / Undergraduate | 21 | 5.9% |
| Graduate / Professional | 0 | 0.0% |
| Total | 358 | 100.0% |
School Enrollment by Age by Funding Source in Solis
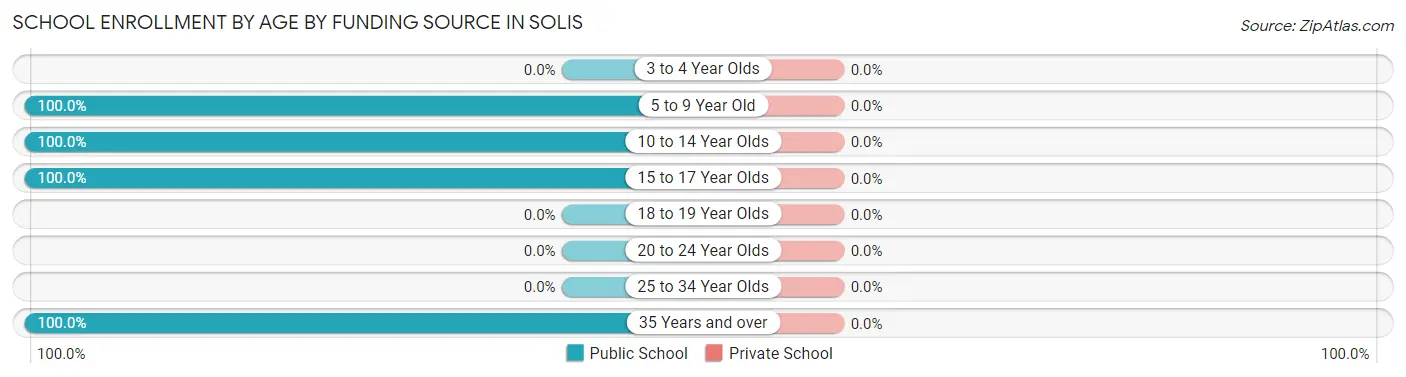
| Age Bracket | Public School | Private School |
| 3 to 4 Year Olds | 0 (0.0%) | 0 (0.0%) |
| 5 to 9 Year Old | 102 (100.0%) | 0 (0.0%) |
| 10 to 14 Year Olds | 135 (100.0%) | 0 (0.0%) |
| 15 to 17 Year Olds | 111 (100.0%) | 0 (0.0%) |
| 18 to 19 Year Olds | 0 (0.0%) | 0 (0.0%) |
| 20 to 24 Year Olds | 0 (0.0%) | 0 (0.0%) |
| 25 to 34 Year Olds | 0 (0.0%) | 0 (0.0%) |
| 35 Years and over | 10 (100.0%) | 0 (0.0%) |
| Total | 358 (100.0%) | 0 (0.0%) |
Educational Attainment by Field of Study in Solis
Communications (17 | 53.1%), and business (15 | 46.9%) are the most common fields of study among 32 individuals in Solis who have obtained a bachelor's degree or higher.
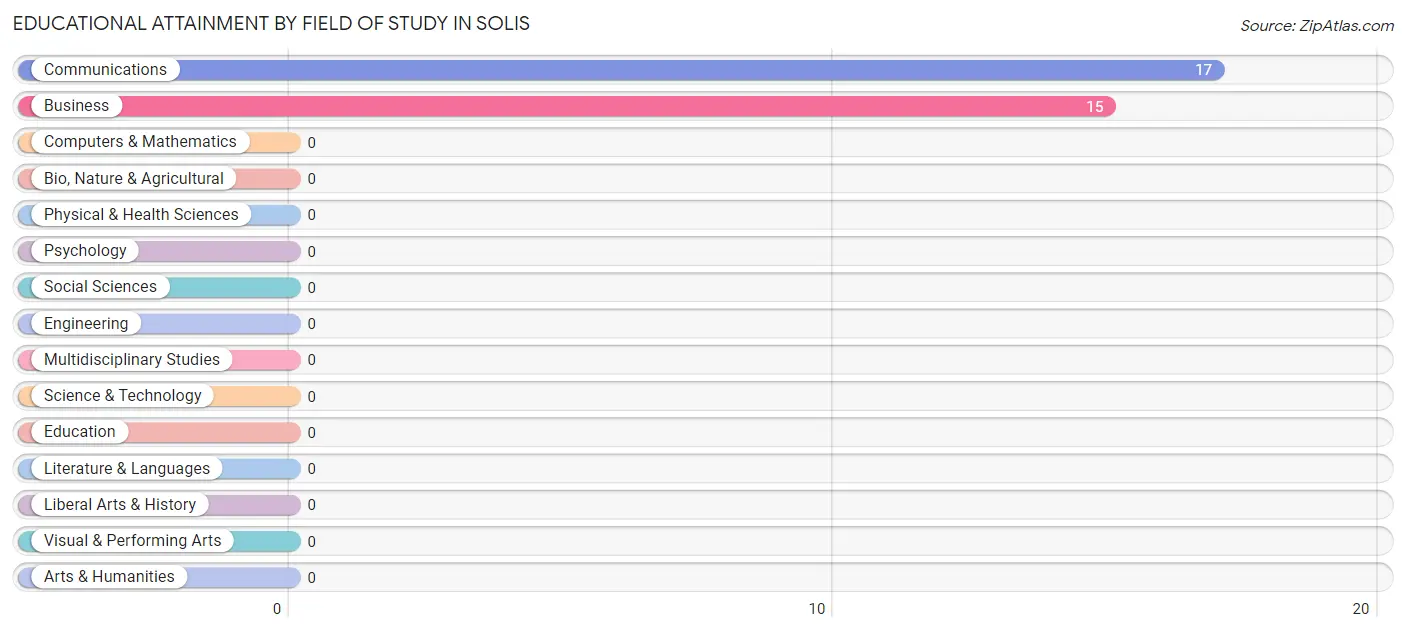
| Field of Study | # Graduates | % Graduates |
| Computers & Mathematics | 0 | 0.0% |
| Bio, Nature & Agricultural | 0 | 0.0% |
| Physical & Health Sciences | 0 | 0.0% |
| Psychology | 0 | 0.0% |
| Social Sciences | 0 | 0.0% |
| Engineering | 0 | 0.0% |
| Multidisciplinary Studies | 0 | 0.0% |
| Science & Technology | 0 | 0.0% |
| Business | 15 | 46.9% |
| Education | 0 | 0.0% |
| Literature & Languages | 0 | 0.0% |
| Liberal Arts & History | 0 | 0.0% |
| Visual & Performing Arts | 0 | 0.0% |
| Communications | 17 | 53.1% |
| Arts & Humanities | 0 | 0.0% |
| Total | 32 | 100.0% |
Transportation & Commute in Solis
Vehicle Availability by Sex in Solis
The most prevalent vehicle ownership categories in Solis are males with 2 vehicles (45, accounting for 97.8%) and females with 2 vehicles (85, making up 45.0%).
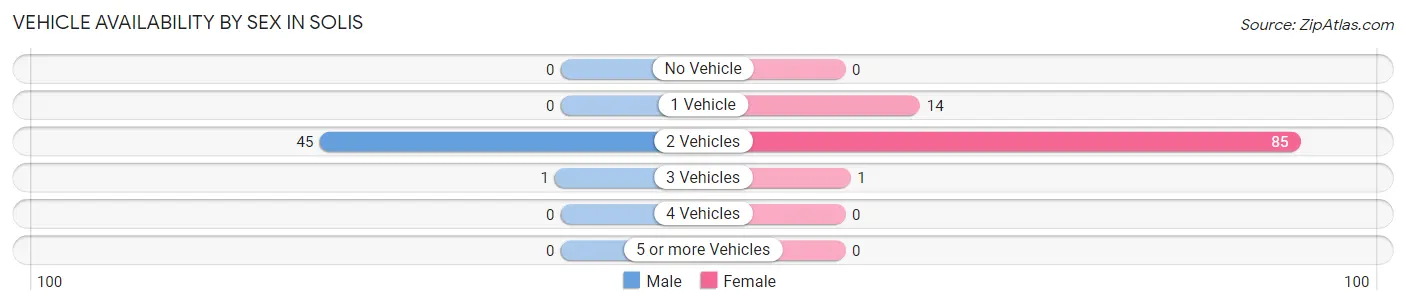
| Vehicles Available | Male | Female |
| No Vehicle | 0 (0.0%) | 0 (0.0%) |
| 1 Vehicle | 0 (0.0%) | 14 (14.0%) |
| 2 Vehicles | 45 (97.8%) | 85 (85.0%) |
| 3 Vehicles | 1 (2.2%) | 1 (1.0%) |
| 4 Vehicles | 0 (0.0%) | 0 (0.0%) |
| 5 or more Vehicles | 0 (0.0%) | 0 (0.0%) |
| Total | 46 (100.0%) | 100 (100.0%) |
Commute Time in Solis
The most frequently occuring commute durations in Solis are 15 to 19 minutes (63 commuters, 44.1%), 45 to 59 minutes (18 commuters, 12.6%), and 30 to 34 minutes (17 commuters, 11.9%).
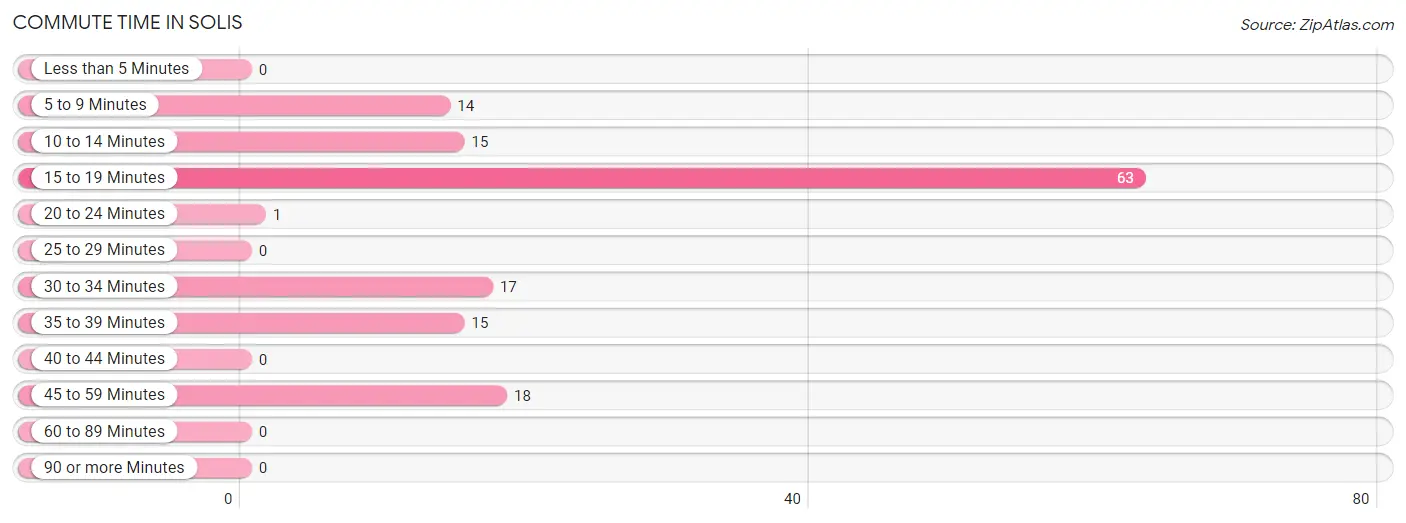
| Commute Time | # Commuters | % Commuters |
| Less than 5 Minutes | 0 | 0.0% |
| 5 to 9 Minutes | 14 | 9.8% |
| 10 to 14 Minutes | 15 | 10.5% |
| 15 to 19 Minutes | 63 | 44.1% |
| 20 to 24 Minutes | 1 | 0.7% |
| 25 to 29 Minutes | 0 | 0.0% |
| 30 to 34 Minutes | 17 | 11.9% |
| 35 to 39 Minutes | 15 | 10.5% |
| 40 to 44 Minutes | 0 | 0.0% |
| 45 to 59 Minutes | 18 | 12.6% |
| 60 to 89 Minutes | 0 | 0.0% |
| 90 or more Minutes | 0 | 0.0% |
Commute Time by Sex in Solis
The most common commute times in Solis are 45 to 59 minutes (18 commuters, 39.1%) for males and 15 to 19 minutes (53 commuters, 54.6%) for females.
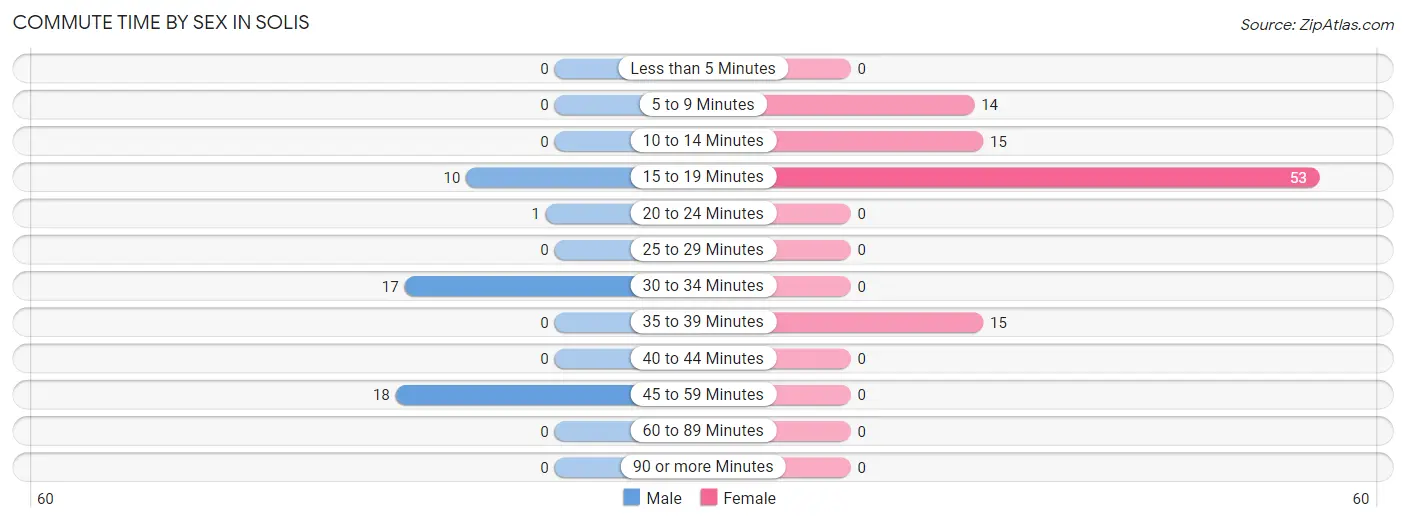
| Commute Time | Male | Female |
| Less than 5 Minutes | 0 (0.0%) | 0 (0.0%) |
| 5 to 9 Minutes | 0 (0.0%) | 14 (14.4%) |
| 10 to 14 Minutes | 0 (0.0%) | 15 (15.5%) |
| 15 to 19 Minutes | 10 (21.7%) | 53 (54.6%) |
| 20 to 24 Minutes | 1 (2.2%) | 0 (0.0%) |
| 25 to 29 Minutes | 0 (0.0%) | 0 (0.0%) |
| 30 to 34 Minutes | 17 (37.0%) | 0 (0.0%) |
| 35 to 39 Minutes | 0 (0.0%) | 15 (15.5%) |
| 40 to 44 Minutes | 0 (0.0%) | 0 (0.0%) |
| 45 to 59 Minutes | 18 (39.1%) | 0 (0.0%) |
| 60 to 89 Minutes | 0 (0.0%) | 0 (0.0%) |
| 90 or more Minutes | 0 (0.0%) | 0 (0.0%) |
Time of Departure to Work by Sex in Solis
The most frequent times of departure to work in Solis are 6:00 AM to 6:29 AM (18, 39.1%) for males and 4:00 PM to 11:59 PM (53, 54.6%) for females.
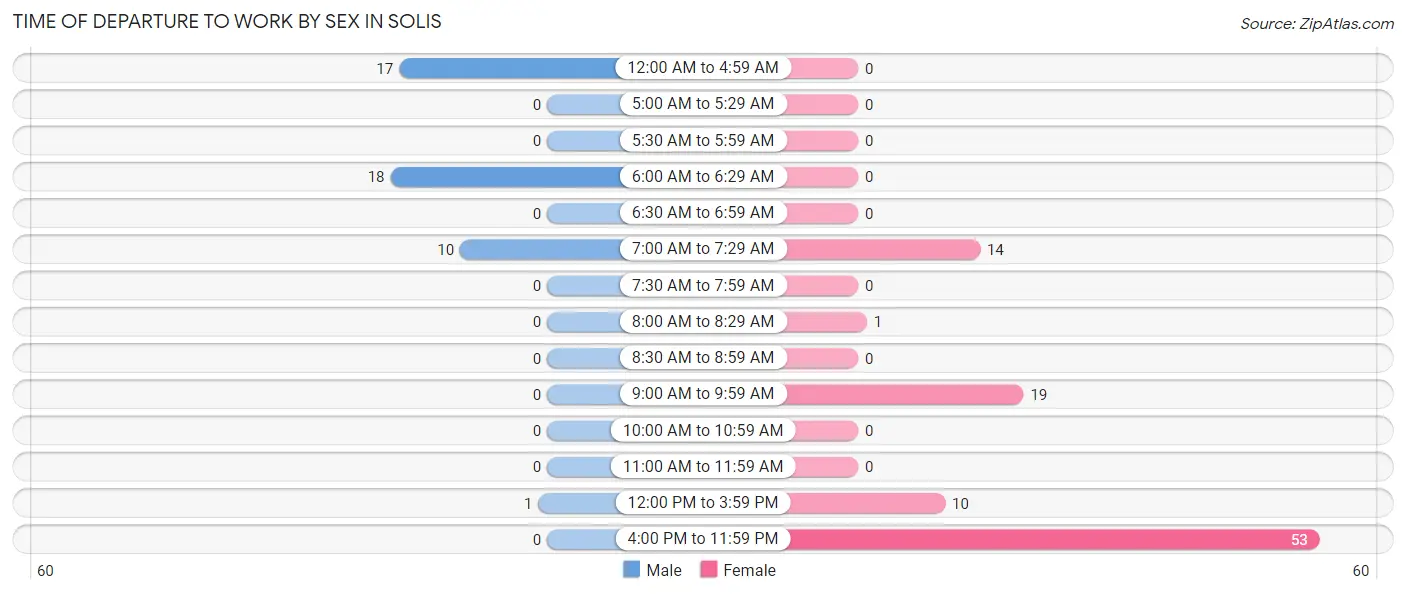
| Time of Departure | Male | Female |
| 12:00 AM to 4:59 AM | 17 (37.0%) | 0 (0.0%) |
| 5:00 AM to 5:29 AM | 0 (0.0%) | 0 (0.0%) |
| 5:30 AM to 5:59 AM | 0 (0.0%) | 0 (0.0%) |
| 6:00 AM to 6:29 AM | 18 (39.1%) | 0 (0.0%) |
| 6:30 AM to 6:59 AM | 0 (0.0%) | 0 (0.0%) |
| 7:00 AM to 7:29 AM | 10 (21.7%) | 14 (14.4%) |
| 7:30 AM to 7:59 AM | 0 (0.0%) | 0 (0.0%) |
| 8:00 AM to 8:29 AM | 0 (0.0%) | 1 (1.0%) |
| 8:30 AM to 8:59 AM | 0 (0.0%) | 0 (0.0%) |
| 9:00 AM to 9:59 AM | 0 (0.0%) | 19 (19.6%) |
| 10:00 AM to 10:59 AM | 0 (0.0%) | 0 (0.0%) |
| 11:00 AM to 11:59 AM | 0 (0.0%) | 0 (0.0%) |
| 12:00 PM to 3:59 PM | 1 (2.2%) | 10 (10.3%) |
| 4:00 PM to 11:59 PM | 0 (0.0%) | 53 (54.6%) |
| Total | 46 (100.0%) | 97 (100.0%) |
Housing Occupancy in Solis
Occupancy by Ownership in Solis
Of the total 142 dwellings in Solis, owner-occupied units account for 42 (29.6%), while renter-occupied units make up 100 (70.4%).
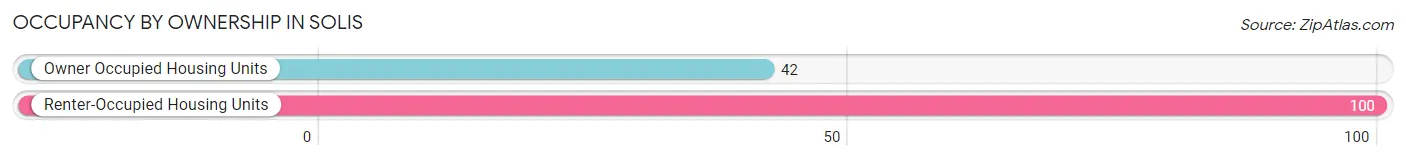
| Occupancy | # Housing Units | % Housing Units |
| Owner Occupied Housing Units | 42 | 29.6% |
| Renter-Occupied Housing Units | 100 | 70.4% |
| Total Occupied Housing Units | 142 | 100.0% |
Occupancy by Household Size in Solis
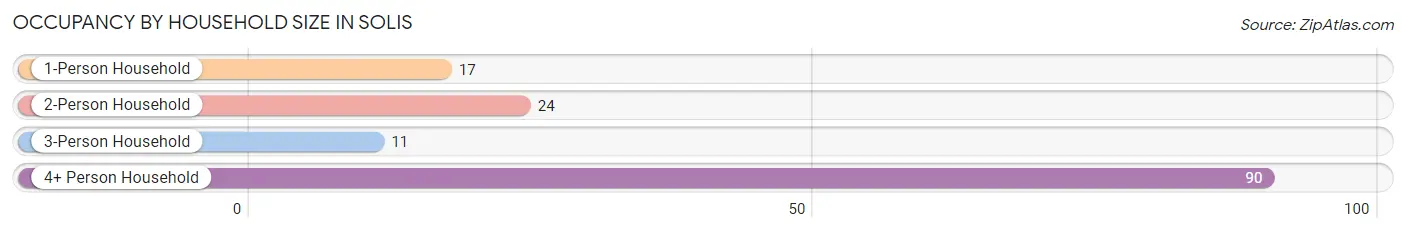
| Household Size | # Housing Units | % Housing Units |
| 1-Person Household | 17 | 12.0% |
| 2-Person Household | 24 | 16.9% |
| 3-Person Household | 11 | 7.7% |
| 4+ Person Household | 90 | 63.4% |
| Total Housing Units | 142 | 100.0% |
Occupancy by Ownership by Household Size in Solis
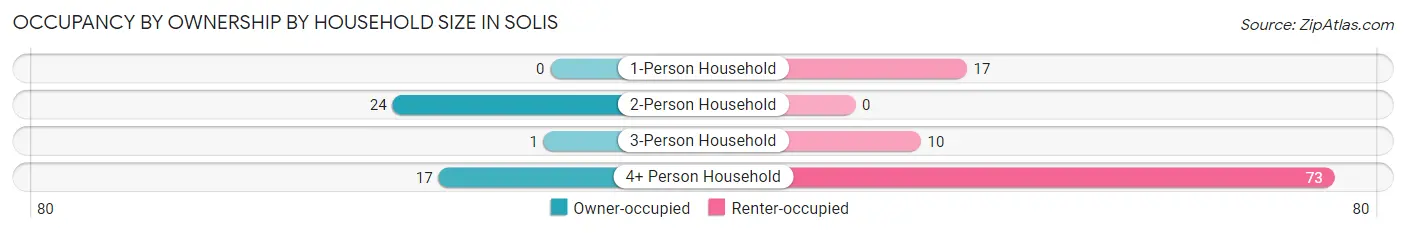
| Household Size | Owner-occupied | Renter-occupied |
| 1-Person Household | 0 (0.0%) | 17 (100.0%) |
| 2-Person Household | 24 (100.0%) | 0 (0.0%) |
| 3-Person Household | 1 (9.1%) | 10 (90.9%) |
| 4+ Person Household | 17 (18.9%) | 73 (81.1%) |
| Total Housing Units | 42 (29.6%) | 100 (70.4%) |
Occupancy by Educational Attainment in Solis
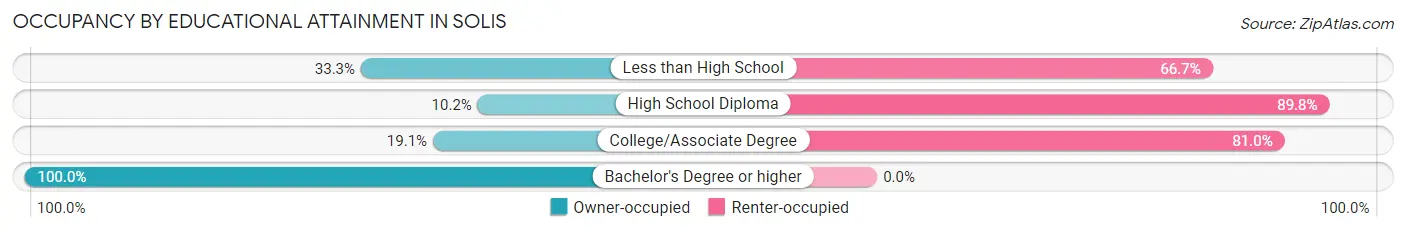
| Household Size | Owner-occupied | Renter-occupied |
| Less than High School | 15 (33.3%) | 30 (66.7%) |
| High School Diploma | 6 (10.2%) | 53 (89.8%) |
| College/Associate Degree | 4 (19.1%) | 17 (80.9%) |
| Bachelor's Degree or higher | 17 (100.0%) | 0 (0.0%) |
Occupancy by Age of Householder in Solis
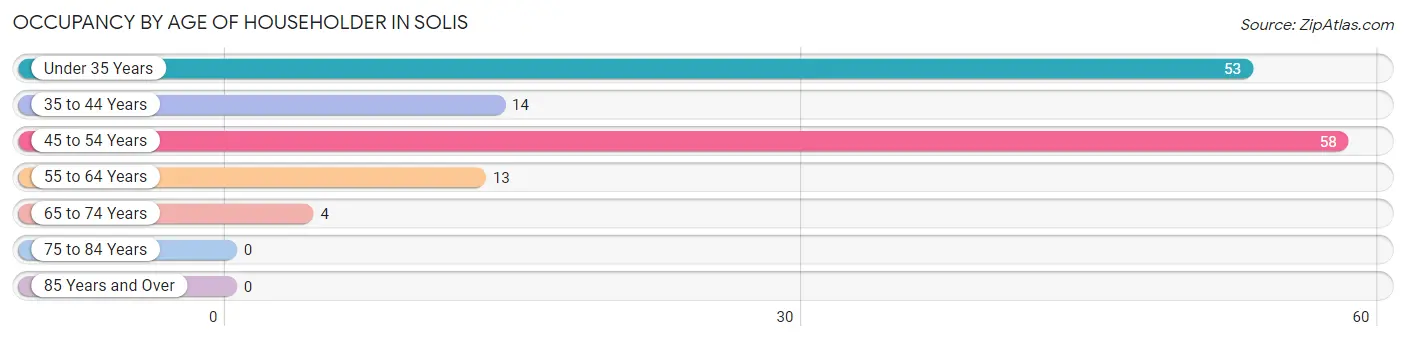
| Age Bracket | # Households | % Households |
| Under 35 Years | 53 | 37.3% |
| 35 to 44 Years | 14 | 9.9% |
| 45 to 54 Years | 58 | 40.8% |
| 55 to 64 Years | 13 | 9.1% |
| 65 to 74 Years | 4 | 2.8% |
| 75 to 84 Years | 0 | 0.0% |
| 85 Years and Over | 0 | 0.0% |
| Total | 142 | 100.0% |
Housing Finances in Solis
Median Income by Occupancy in Solis
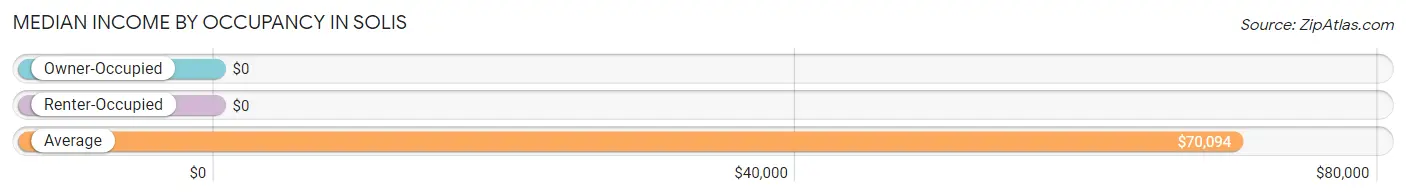
| Occupancy Type | # Households | Median Income |
| Owner-Occupied | 42 (29.6%) | $0 |
| Renter-Occupied | 100 (70.4%) | $0 |
| Average | 142 (100.0%) | $70,094 |
Occupancy by Householder Income Bracket in Solis
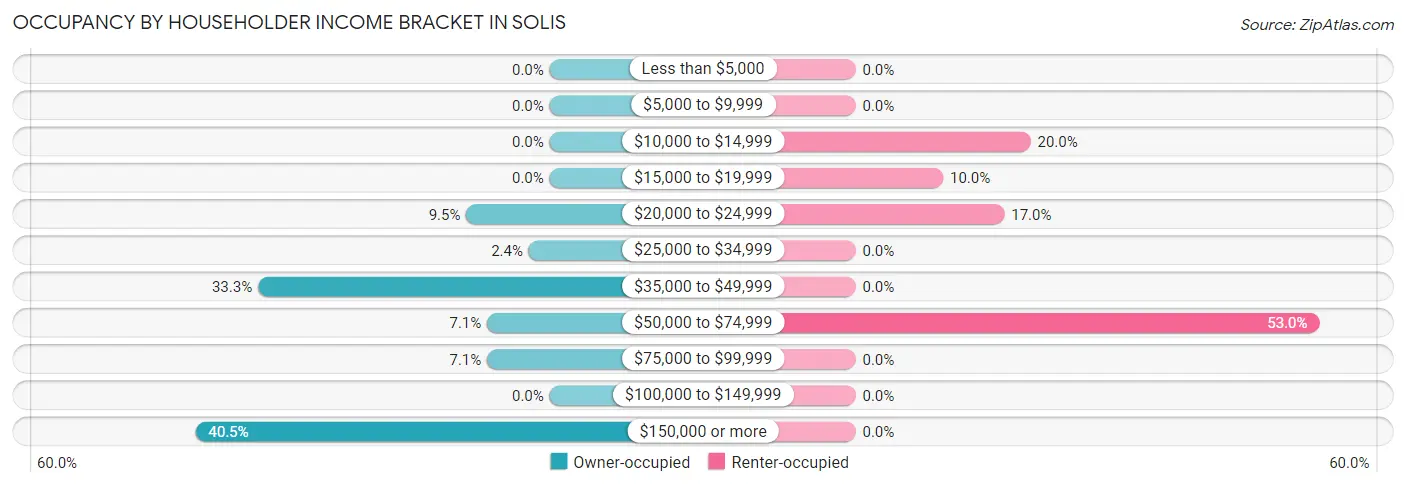
| Income Bracket | Owner-occupied | Renter-occupied |
| Less than $5,000 | 0 (0.0%) | 0 (0.0%) |
| $5,000 to $9,999 | 0 (0.0%) | 0 (0.0%) |
| $10,000 to $14,999 | 0 (0.0%) | 20 (20.0%) |
| $15,000 to $19,999 | 0 (0.0%) | 10 (10.0%) |
| $20,000 to $24,999 | 4 (9.5%) | 17 (17.0%) |
| $25,000 to $34,999 | 1 (2.4%) | 0 (0.0%) |
| $35,000 to $49,999 | 14 (33.3%) | 0 (0.0%) |
| $50,000 to $74,999 | 3 (7.1%) | 53 (53.0%) |
| $75,000 to $99,999 | 3 (7.1%) | 0 (0.0%) |
| $100,000 to $149,999 | 0 (0.0%) | 0 (0.0%) |
| $150,000 or more | 17 (40.5%) | 0 (0.0%) |
| Total | 42 (100.0%) | 100 (100.0%) |
Monthly Housing Cost Tiers in Solis
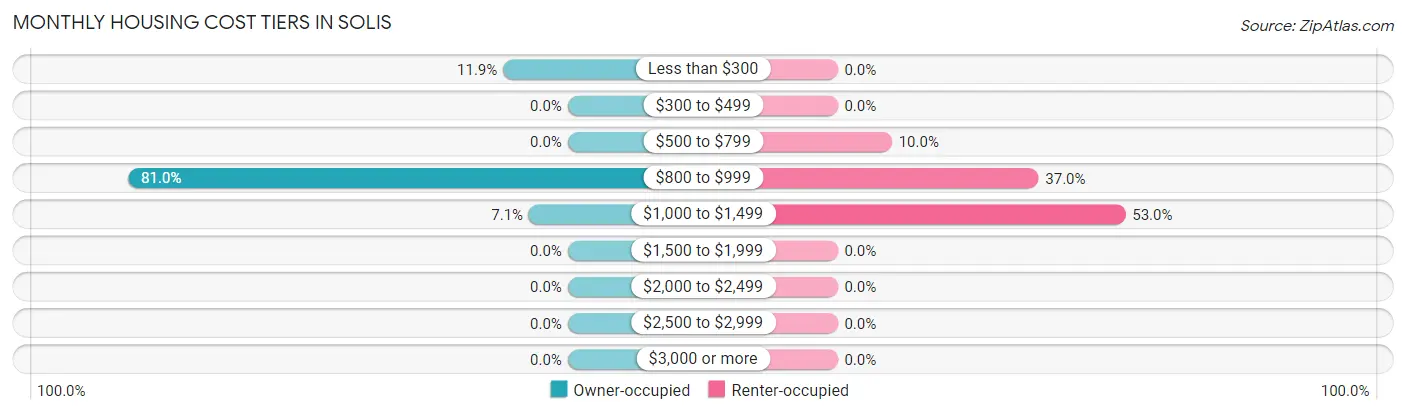
| Monthly Cost | Owner-occupied | Renter-occupied |
| Less than $300 | 5 (11.9%) | 0 (0.0%) |
| $300 to $499 | 0 (0.0%) | 0 (0.0%) |
| $500 to $799 | 0 (0.0%) | 10 (10.0%) |
| $800 to $999 | 34 (80.9%) | 37 (37.0%) |
| $1,000 to $1,499 | 3 (7.1%) | 53 (53.0%) |
| $1,500 to $1,999 | 0 (0.0%) | 0 (0.0%) |
| $2,000 to $2,499 | 0 (0.0%) | 0 (0.0%) |
| $2,500 to $2,999 | 0 (0.0%) | 0 (0.0%) |
| $3,000 or more | 0 (0.0%) | 0 (0.0%) |
| Total | 42 (100.0%) | 100 (100.0%) |
Physical Housing Characteristics in Solis
Housing Structures in Solis
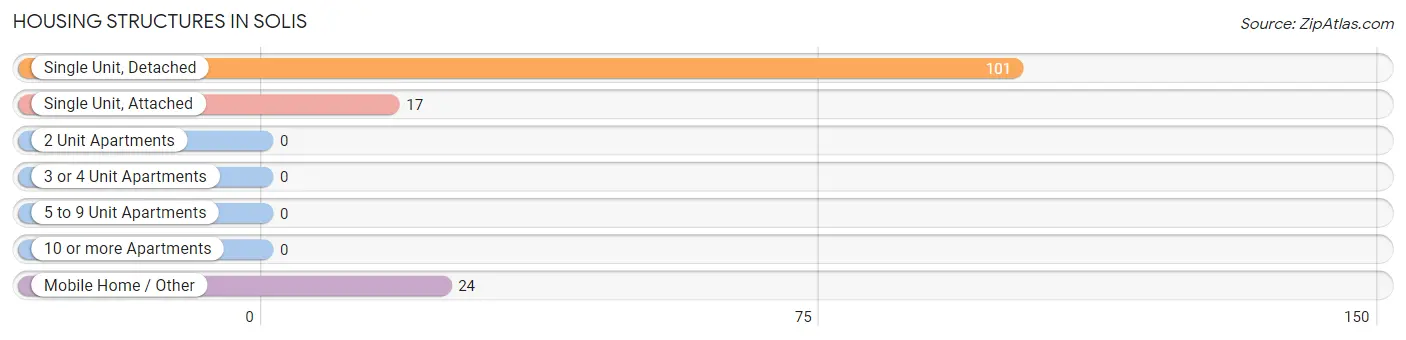
| Structure Type | # Housing Units | % Housing Units |
| Single Unit, Detached | 101 | 71.1% |
| Single Unit, Attached | 17 | 12.0% |
| 2 Unit Apartments | 0 | 0.0% |
| 3 or 4 Unit Apartments | 0 | 0.0% |
| 5 to 9 Unit Apartments | 0 | 0.0% |
| 10 or more Apartments | 0 | 0.0% |
| Mobile Home / Other | 24 | 16.9% |
| Total | 142 | 100.0% |
Housing Structures by Occupancy in Solis
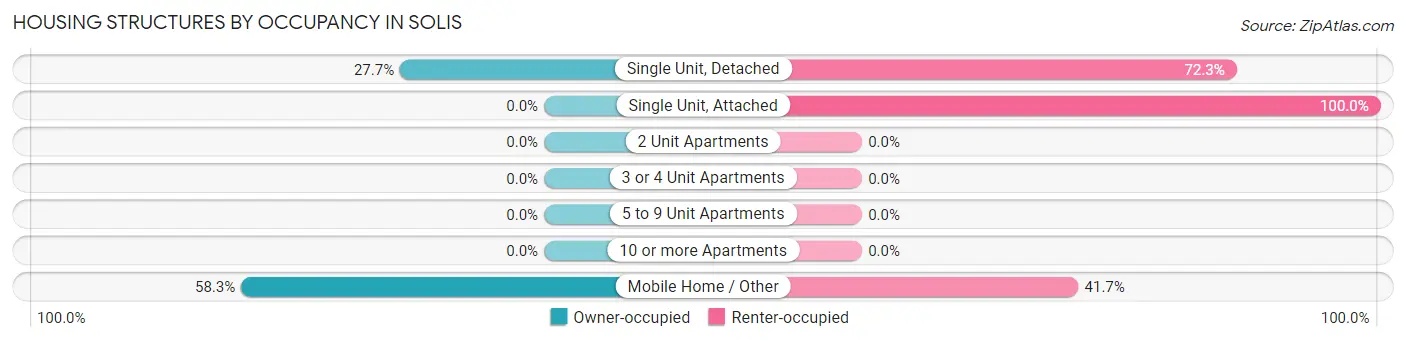
| Structure Type | Owner-occupied | Renter-occupied |
| Single Unit, Detached | 28 (27.7%) | 73 (72.3%) |
| Single Unit, Attached | 0 (0.0%) | 17 (100.0%) |
| 2 Unit Apartments | 0 (0.0%) | 0 (0.0%) |
| 3 or 4 Unit Apartments | 0 (0.0%) | 0 (0.0%) |
| 5 to 9 Unit Apartments | 0 (0.0%) | 0 (0.0%) |
| 10 or more Apartments | 0 (0.0%) | 0 (0.0%) |
| Mobile Home / Other | 14 (58.3%) | 10 (41.7%) |
| Total | 42 (29.6%) | 100 (70.4%) |
Housing Structures by Number of Rooms in Solis
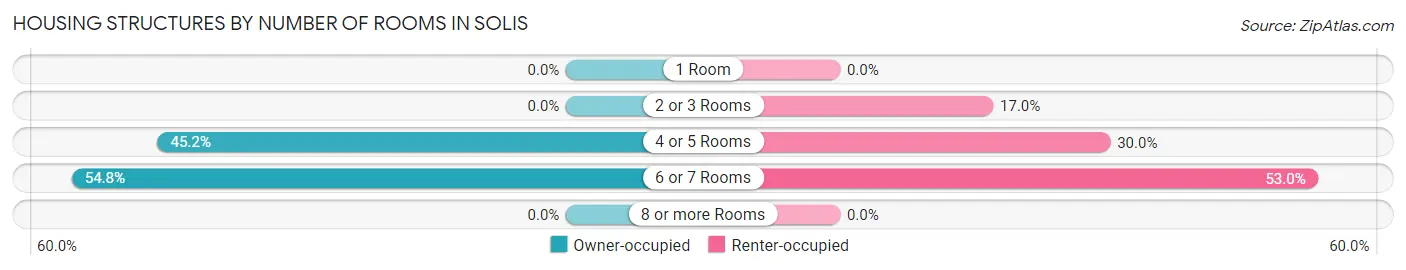
| Number of Rooms | Owner-occupied | Renter-occupied |
| 1 Room | 0 (0.0%) | 0 (0.0%) |
| 2 or 3 Rooms | 0 (0.0%) | 17 (17.0%) |
| 4 or 5 Rooms | 19 (45.2%) | 30 (30.0%) |
| 6 or 7 Rooms | 23 (54.8%) | 53 (53.0%) |
| 8 or more Rooms | 0 (0.0%) | 0 (0.0%) |
| Total | 42 (100.0%) | 100 (100.0%) |
Housing Structure by Heating Type in Solis
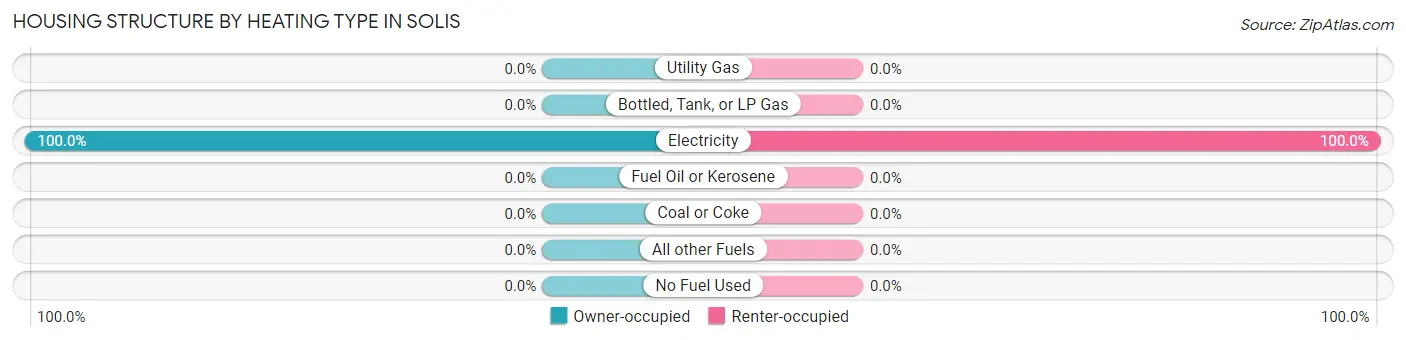
| Heating Type | Owner-occupied | Renter-occupied |
| Utility Gas | 0 (0.0%) | 0 (0.0%) |
| Bottled, Tank, or LP Gas | 0 (0.0%) | 0 (0.0%) |
| Electricity | 42 (100.0%) | 100 (100.0%) |
| Fuel Oil or Kerosene | 0 (0.0%) | 0 (0.0%) |
| Coal or Coke | 0 (0.0%) | 0 (0.0%) |
| All other Fuels | 0 (0.0%) | 0 (0.0%) |
| No Fuel Used | 0 (0.0%) | 0 (0.0%) |
| Total | 42 (100.0%) | 100 (100.0%) |
Household Vehicle Usage in Solis
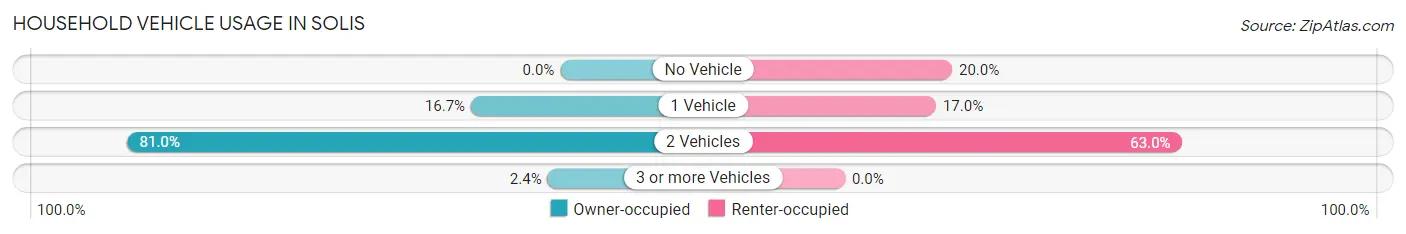
| Vehicles per Household | Owner-occupied | Renter-occupied |
| No Vehicle | 0 (0.0%) | 20 (20.0%) |
| 1 Vehicle | 7 (16.7%) | 17 (17.0%) |
| 2 Vehicles | 34 (80.9%) | 63 (63.0%) |
| 3 or more Vehicles | 1 (2.4%) | 0 (0.0%) |
| Total | 42 (100.0%) | 100 (100.0%) |
Real Estate & Mortgages in Solis
Real Estate and Mortgage Overview in Solis
| Characteristic | Without Mortgage | With Mortgage |
| Housing Units | 5 | 37 |
| Median Property Value | - | - |
| Median Household Income | - | - |
| Monthly Housing Costs | - | - |
| Real Estate Taxes | - | - |
Property Value by Mortgage Status in Solis
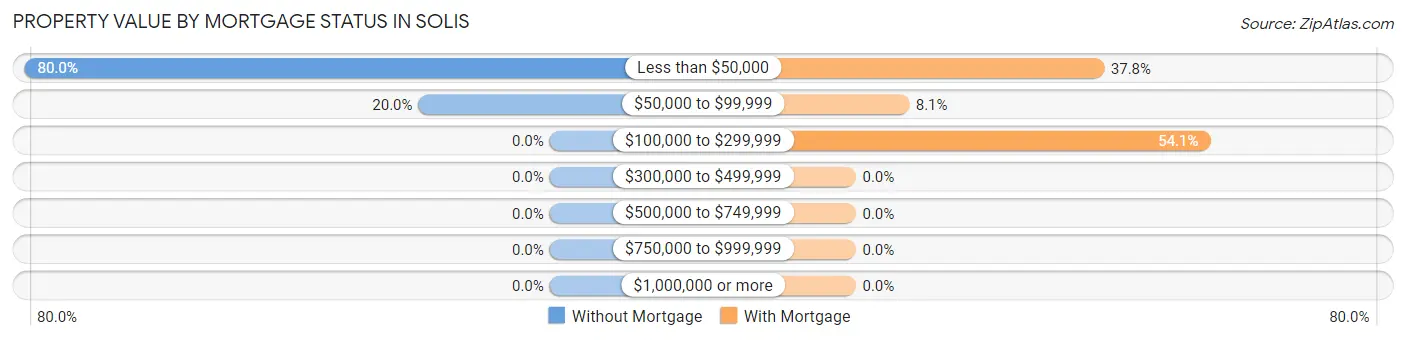
| Property Value | Without Mortgage | With Mortgage |
| Less than $50,000 | 4 (80.0%) | 14 (37.8%) |
| $50,000 to $99,999 | 1 (20.0%) | 3 (8.1%) |
| $100,000 to $299,999 | 0 (0.0%) | 20 (54.0%) |
| $300,000 to $499,999 | 0 (0.0%) | 0 (0.0%) |
| $500,000 to $749,999 | 0 (0.0%) | 0 (0.0%) |
| $750,000 to $999,999 | 0 (0.0%) | 0 (0.0%) |
| $1,000,000 or more | 0 (0.0%) | 0 (0.0%) |
| Total | 5 (100.0%) | 37 (100.0%) |
Household Income by Mortgage Status in Solis
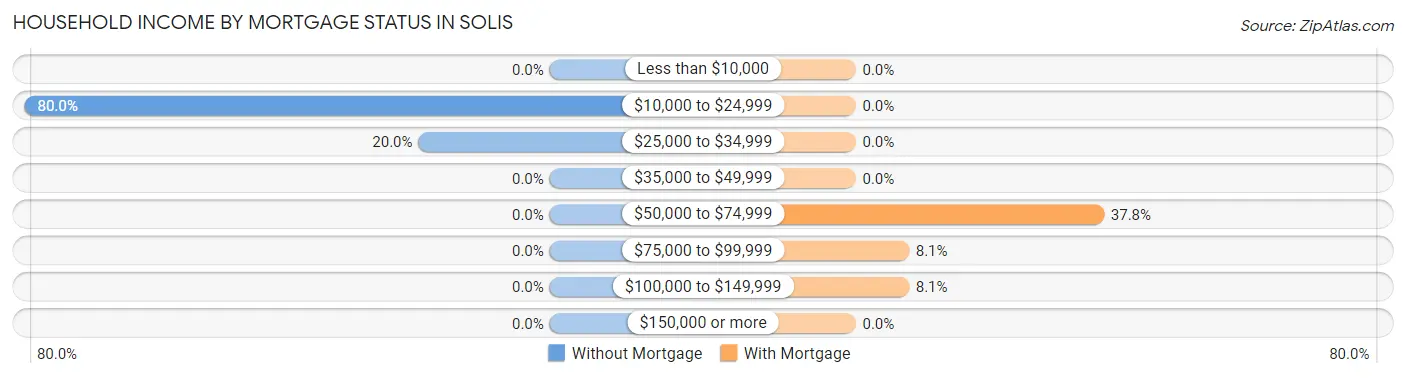
| Household Income | Without Mortgage | With Mortgage |
| Less than $10,000 | 0 (0.0%) | 0 (0.0%) |
| $10,000 to $24,999 | 4 (80.0%) | 0 (0.0%) |
| $25,000 to $34,999 | 1 (20.0%) | 0 (0.0%) |
| $35,000 to $49,999 | 0 (0.0%) | 0 (0.0%) |
| $50,000 to $74,999 | 0 (0.0%) | 14 (37.8%) |
| $75,000 to $99,999 | 0 (0.0%) | 3 (8.1%) |
| $100,000 to $149,999 | 0 (0.0%) | 3 (8.1%) |
| $150,000 or more | 0 (0.0%) | 0 (0.0%) |
| Total | 5 (100.0%) | 37 (100.0%) |
Property Value to Household Income Ratio in Solis
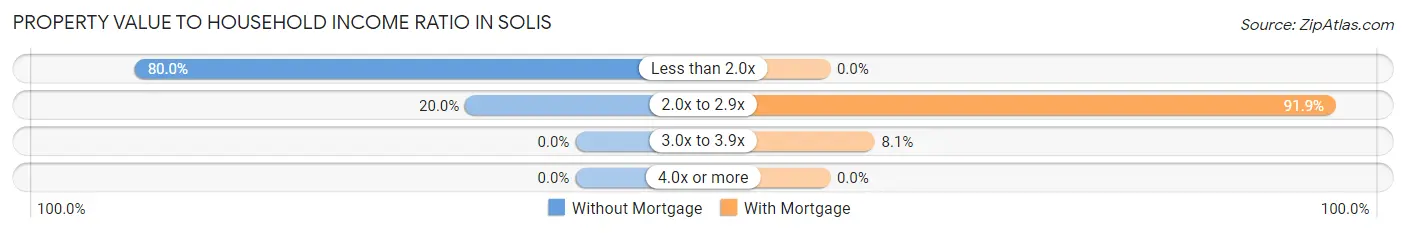
| Value-to-Income Ratio | Without Mortgage | With Mortgage |
| Less than 2.0x | 4 (80.0%) | 0 (0.0%) |
| 2.0x to 2.9x | 1 (20.0%) | 34 (91.9%) |
| 3.0x to 3.9x | 0 (0.0%) | 3 (8.1%) |
| 4.0x or more | 0 (0.0%) | 0 (0.0%) |
| Total | 5 (100.0%) | 37 (100.0%) |
Real Estate Taxes by Mortgage Status in Solis
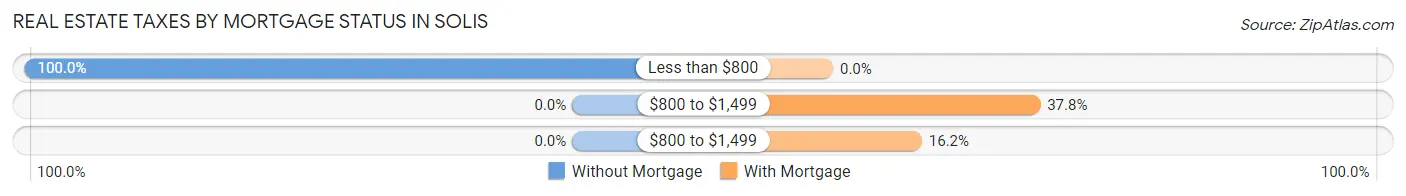
| Property Taxes | Without Mortgage | With Mortgage |
| Less than $800 | 5 (100.0%) | 0 (0.0%) |
| $800 to $1,499 | 0 (0.0%) | 14 (37.8%) |
| $800 to $1,499 | 0 (0.0%) | 6 (16.2%) |
| Total | 5 (100.0%) | 37 (100.0%) |
Health & Disability in Solis
Health Insurance Coverage by Age in Solis
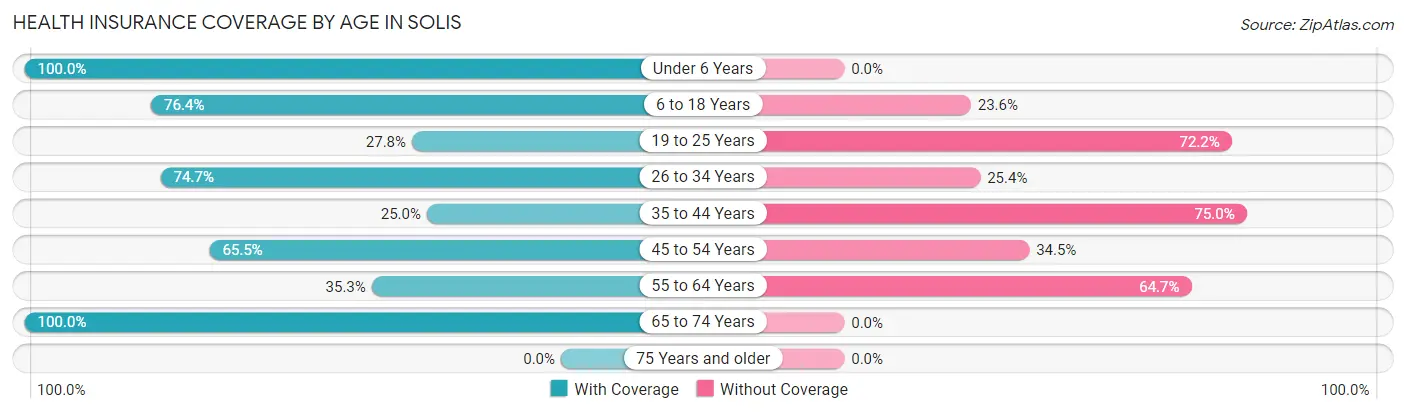
| Age Bracket | With Coverage | Without Coverage |
| Under 6 Years | 47 (100.0%) | 0 (0.0%) |
| 6 to 18 Years | 230 (76.4%) | 71 (23.6%) |
| 19 to 25 Years | 15 (27.8%) | 39 (72.2%) |
| 26 to 34 Years | 53 (74.7%) | 18 (25.4%) |
| 35 to 44 Years | 32 (25.0%) | 96 (75.0%) |
| 45 to 54 Years | 38 (65.5%) | 20 (34.5%) |
| 55 to 64 Years | 6 (35.3%) | 11 (64.7%) |
| 65 to 74 Years | 12 (100.0%) | 0 (0.0%) |
| 75 Years and older | 0 (0.0%) | 0 (0.0%) |
| Total | 433 (62.9%) | 255 (37.1%) |
Health Insurance Coverage by Citizenship Status in Solis
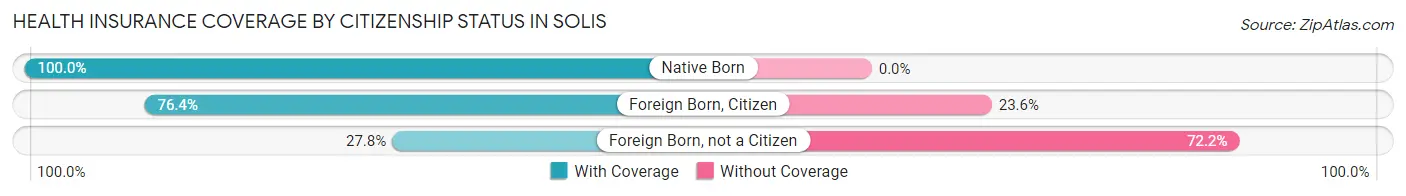
| Citizenship Status | With Coverage | Without Coverage |
| Native Born | 47 (100.0%) | 0 (0.0%) |
| Foreign Born, Citizen | 230 (76.4%) | 71 (23.6%) |
| Foreign Born, not a Citizen | 15 (27.8%) | 39 (72.2%) |
Health Insurance Coverage by Household Income in Solis
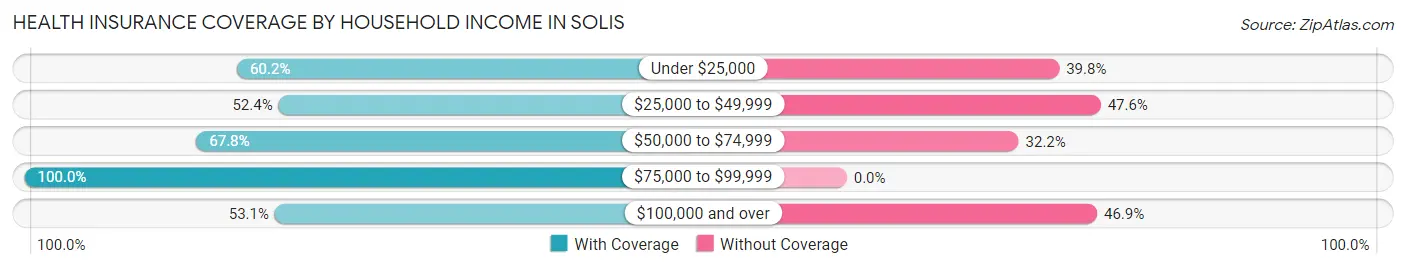
| Household Income | With Coverage | Without Coverage |
| Under $25,000 | 118 (60.2%) | 78 (39.8%) |
| $25,000 to $49,999 | 54 (52.4%) | 49 (47.6%) |
| $50,000 to $74,999 | 238 (67.8%) | 113 (32.2%) |
| $75,000 to $99,999 | 6 (100.0%) | 0 (0.0%) |
| $100,000 and over | 17 (53.1%) | 15 (46.9%) |
Public vs Private Health Insurance Coverage by Age in Solis
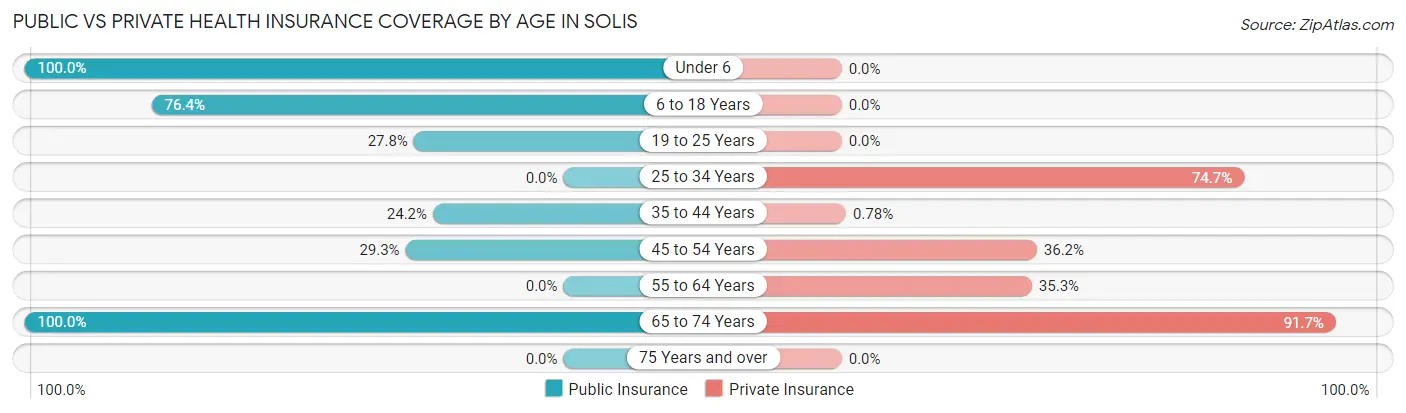
| Age Bracket | Public Insurance | Private Insurance |
| Under 6 | 47 (100.0%) | 0 (0.0%) |
| 6 to 18 Years | 230 (76.4%) | 0 (0.0%) |
| 19 to 25 Years | 15 (27.8%) | 0 (0.0%) |
| 25 to 34 Years | 0 (0.0%) | 53 (74.7%) |
| 35 to 44 Years | 31 (24.2%) | 1 (0.8%) |
| 45 to 54 Years | 17 (29.3%) | 21 (36.2%) |
| 55 to 64 Years | 0 (0.0%) | 6 (35.3%) |
| 65 to 74 Years | 12 (100.0%) | 11 (91.7%) |
| 75 Years and over | 0 (0.0%) | 0 (0.0%) |
| Total | 352 (51.2%) | 92 (13.4%) |
Disability Status by Sex by Age in Solis
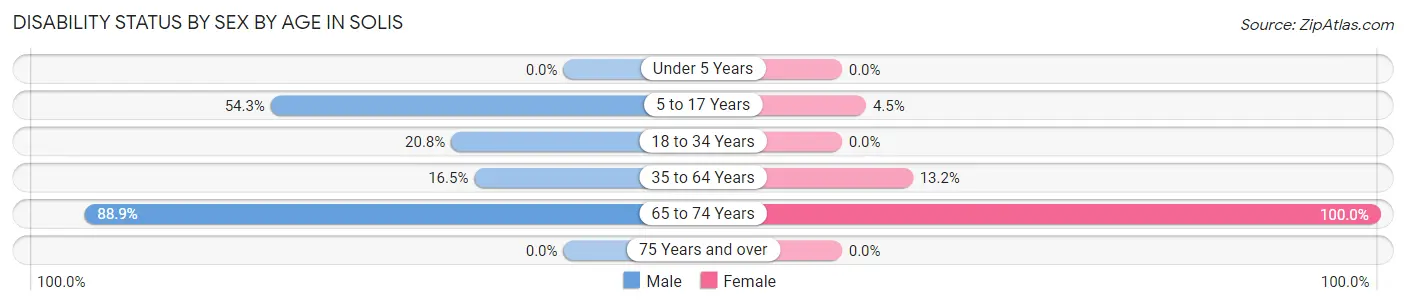
| Age Bracket | Male | Female |
| Under 5 Years | 0 (0.0%) | 0 (0.0%) |
| 5 to 17 Years | 44 (54.3%) | 12 (4.5%) |
| 18 to 34 Years | 15 (20.8%) | 0 (0.0%) |
| 35 to 64 Years | 21 (16.5%) | 10 (13.2%) |
| 65 to 74 Years | 8 (88.9%) | 3 (100.0%) |
| 75 Years and over | 0 (0.0%) | 0 (0.0%) |
Disability Class by Sex by Age in Solis
Disability Class: Hearing Difficulty
| Age Bracket | Male | Female |
| Under 5 Years | 0 (0.0%) | 0 (0.0%) |
| 5 to 17 Years | 0 (0.0%) | 0 (0.0%) |
| 18 to 34 Years | 0 (0.0%) | 0 (0.0%) |
| 35 to 64 Years | 0 (0.0%) | 0 (0.0%) |
| 65 to 74 Years | 0 (0.0%) | 0 (0.0%) |
| 75 Years and over | 0 (0.0%) | 0 (0.0%) |
Disability Class: Vision Difficulty
| Age Bracket | Male | Female |
| Under 5 Years | 0 (0.0%) | 0 (0.0%) |
| 5 to 17 Years | 0 (0.0%) | 0 (0.0%) |
| 18 to 34 Years | 0 (0.0%) | 0 (0.0%) |
| 35 to 64 Years | 0 (0.0%) | 0 (0.0%) |
| 65 to 74 Years | 0 (0.0%) | 0 (0.0%) |
| 75 Years and over | 0 (0.0%) | 0 (0.0%) |
Disability Class: Cognitive Difficulty
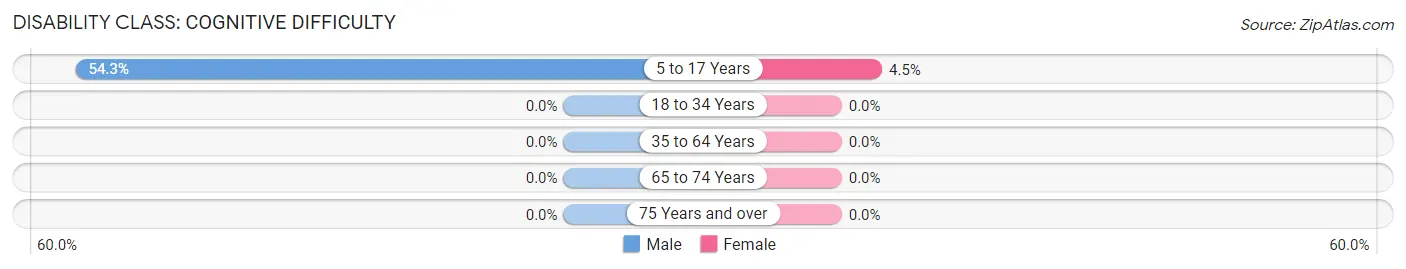
| Age Bracket | Male | Female |
| 5 to 17 Years | 44 (54.3%) | 12 (4.5%) |
| 18 to 34 Years | 0 (0.0%) | 0 (0.0%) |
| 35 to 64 Years | 0 (0.0%) | 0 (0.0%) |
| 65 to 74 Years | 0 (0.0%) | 0 (0.0%) |
| 75 Years and over | 0 (0.0%) | 0 (0.0%) |
Disability Class: Ambulatory Difficulty
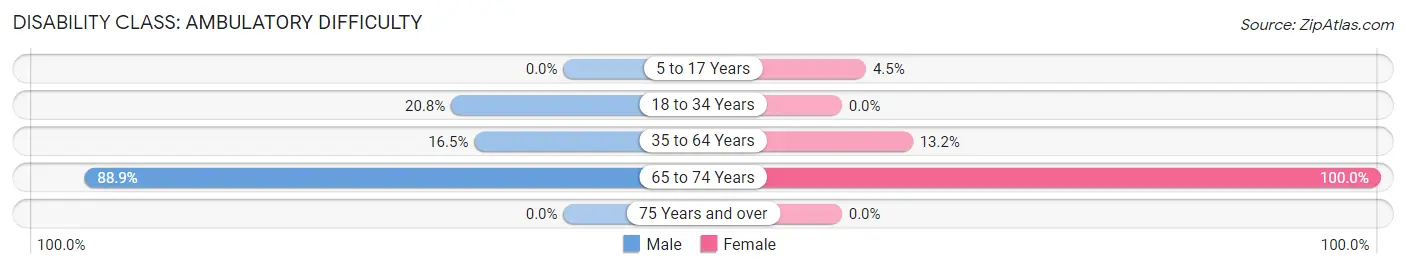
| Age Bracket | Male | Female |
| 5 to 17 Years | 0 (0.0%) | 12 (4.5%) |
| 18 to 34 Years | 15 (20.8%) | 0 (0.0%) |
| 35 to 64 Years | 21 (16.5%) | 10 (13.2%) |
| 65 to 74 Years | 8 (88.9%) | 3 (100.0%) |
| 75 Years and over | 0 (0.0%) | 0 (0.0%) |
Disability Class: Self-Care Difficulty
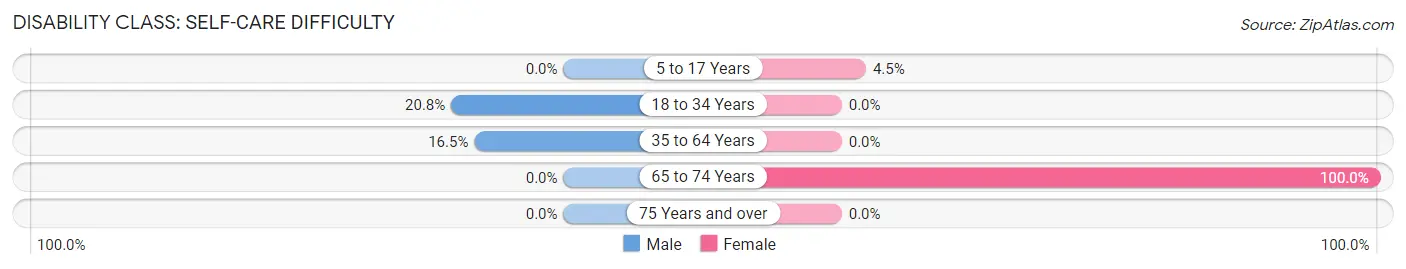
| Age Bracket | Male | Female |
| 5 to 17 Years | 0 (0.0%) | 12 (4.5%) |
| 18 to 34 Years | 15 (20.8%) | 0 (0.0%) |
| 35 to 64 Years | 21 (16.5%) | 0 (0.0%) |
| 65 to 74 Years | 0 (0.0%) | 3 (100.0%) |
| 75 Years and over | 0 (0.0%) | 0 (0.0%) |
Technology Access in Solis
Computing Device Access in Solis
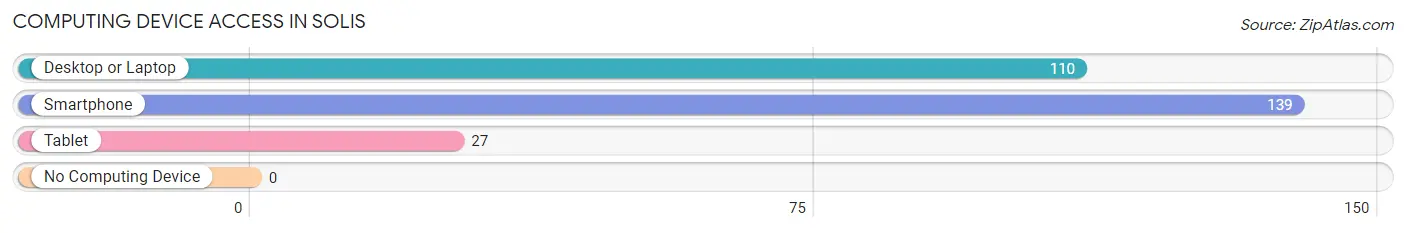
| Device Type | # Households | % Households |
| Desktop or Laptop | 110 | 77.5% |
| Smartphone | 139 | 97.9% |
| Tablet | 27 | 19.0% |
| No Computing Device | 0 | 0.0% |
| Total | 142 | 100.0% |
Internet Access in Solis
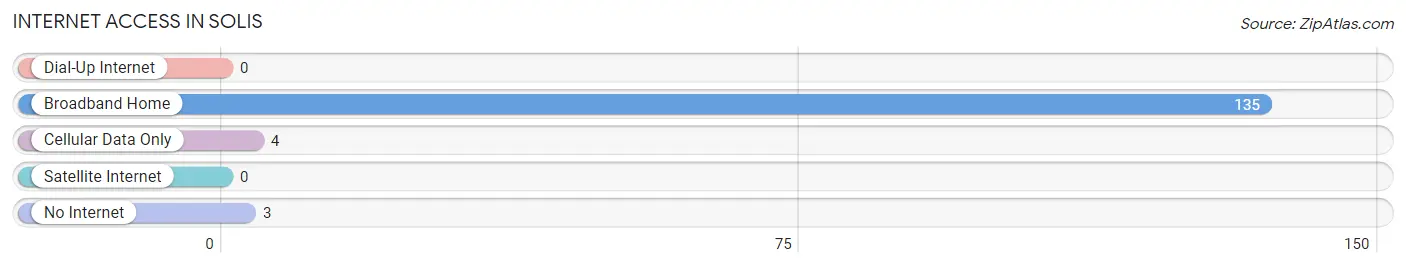
| Internet Type | # Households | % Households |
| Dial-Up Internet | 0 | 0.0% |
| Broadband Home | 135 | 95.1% |
| Cellular Data Only | 4 | 2.8% |
| Satellite Internet | 0 | 0.0% |
| No Internet | 3 | 2.1% |
| Total | 142 | 100.0% |
Solis Summary
Solis is a small unincorporated community located in Starr County, Texas. It is situated on the Rio Grande, approximately 10 miles south of Rio Grande City. The population of Solis was estimated to be around 1,000 in 2020.
History
Solis was founded in the late 19th century by a group of Mexican settlers. The town was named after the Solis family, who were among the first settlers. The town was originally a farming community, but it soon became a trading center for the surrounding area. In the early 20th century, Solis was a popular stop for travelers on the Rio Grande.
Geography
Solis is located in Starr County, Texas, on the Rio Grande. It is situated approximately 10 miles south of Rio Grande City. The town is surrounded by farmland and is located in a semi-arid climate. The average temperature in Solis is around 70 degrees Fahrenheit.
Economy
The economy of Solis is largely based on agriculture. The town is home to several farms, which produce a variety of crops, including cotton, corn, and sorghum. In addition, Solis is home to several small businesses, including restaurants, grocery stores, and auto repair shops.
Demographics
As of 2020, the population of Solis was estimated to be around 1,000. The majority of the population is of Hispanic or Latino descent. The median household income in Solis is around $25,000, and the median home value is around $50,000.
Conclusion
Solis is a small unincorporated community located in Starr County, Texas. It is situated on the Rio Grande, approximately 10 miles south of Rio Grande City. The population of Solis was estimated to be around 1,000 in 2020. The economy of Solis is largely based on agriculture, and the majority of the population is of Hispanic or Latino descent. The median household income in Solis is around $25,000, and the median home value is around $50,000.
Common Questions
What is Per Capita Income in Solis?
Per Capita income in Solis is $13,586.
What is the Median Family Income in Solis?
Median Family Income in Solis is $62,995.
What is the Median Household income in Solis?
Median Household Income in Solis is $70,094.
What is Inequality or Gini Index in Solis?
Inequality or Gini Index in Solis is 0.41.
What is the Total Population of Solis?
Total Population of Solis is 688.
What is the Total Male Population of Solis?
Total Male Population of Solis is 289.
What is the Total Female Population of Solis?
Total Female Population of Solis is 399.
What is the Ratio of Males per 100 Females in Solis?
There are 72.43 Males per 100 Females in Solis.
What is the Ratio of Females per 100 Males in Solis?
There are 138.06 Females per 100 Males in Solis.
What is the Median Population Age in Solis?
Median Population Age in Solis is 17.9 Years.
What is the Average Family Size in Solis
Average Family Size in Solis is 4.9 People.
What is the Average Household Size in Solis
Average Household Size in Solis is 4.8 People.
How Large is the Labor Force in Solis?
There are 204 People in the Labor Forcein in Solis.
What is the Percentage of People in the Labor Force in Solis?
45.2% of People are in the Labor Force in Solis.
What is the Unemployment Rate in Solis?
Unemployment Rate in Solis is 28.4%.