San Carlos I, TX Map & Demographics
San Carlos I Map
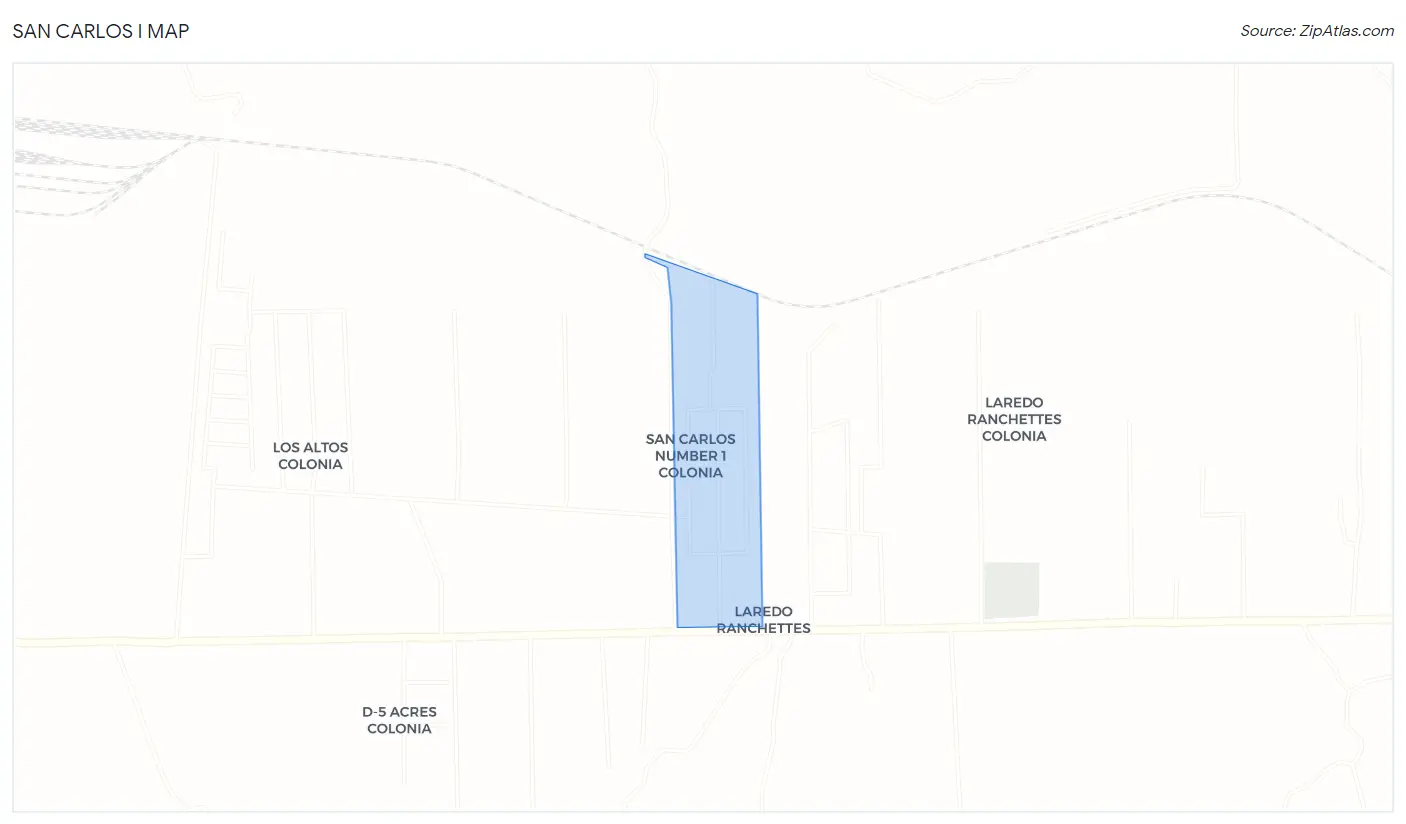
San Carlos I Overview
$9,023
PER CAPITA INCOME
0.23
INEQUALITY / GINI INDEX
233
TOTAL POPULATION
136
MALE POPULATION
97
FEMALE POPULATION
140.21
MALES / 100 FEMALES
71.32
FEMALES / 100 MALES
44.7
MEDIAN AGE
3.9
AVG FAMILY SIZE
4.3
AVG HOUSEHOLD SIZE
119
LABOR FORCE [ PEOPLE ]
60.7%
PERCENT IN LABOR FORCE
Income in San Carlos I
Income Overview in San Carlos I
| Characteristic | Number | Measure |
| Per Capita Income | 233 | $9,023 |
| Median Family Income | 54 | $0 |
| Mean Family Income | 54 | $33,378 |
| Median Household Income | 54 | $0 |
| Mean Household Income | 54 | $36,957 |
| Income Deficit | 54 | $0 |
| Wage / Income Gap (%) | 233 | 0.00% |
| Wage / Income Gap ($) | 233 | 100.00¢ per $1 |
| Gini / Inequality Index | 233 | 0.23 |
Earnings by Sex in San Carlos I
| Sex | Number | Average Earnings |
| Male | 59 (49.6%) | $0 |
| Female | 60 (50.4%) | $0 |
| Total | 119 (100.0%) | $0 |
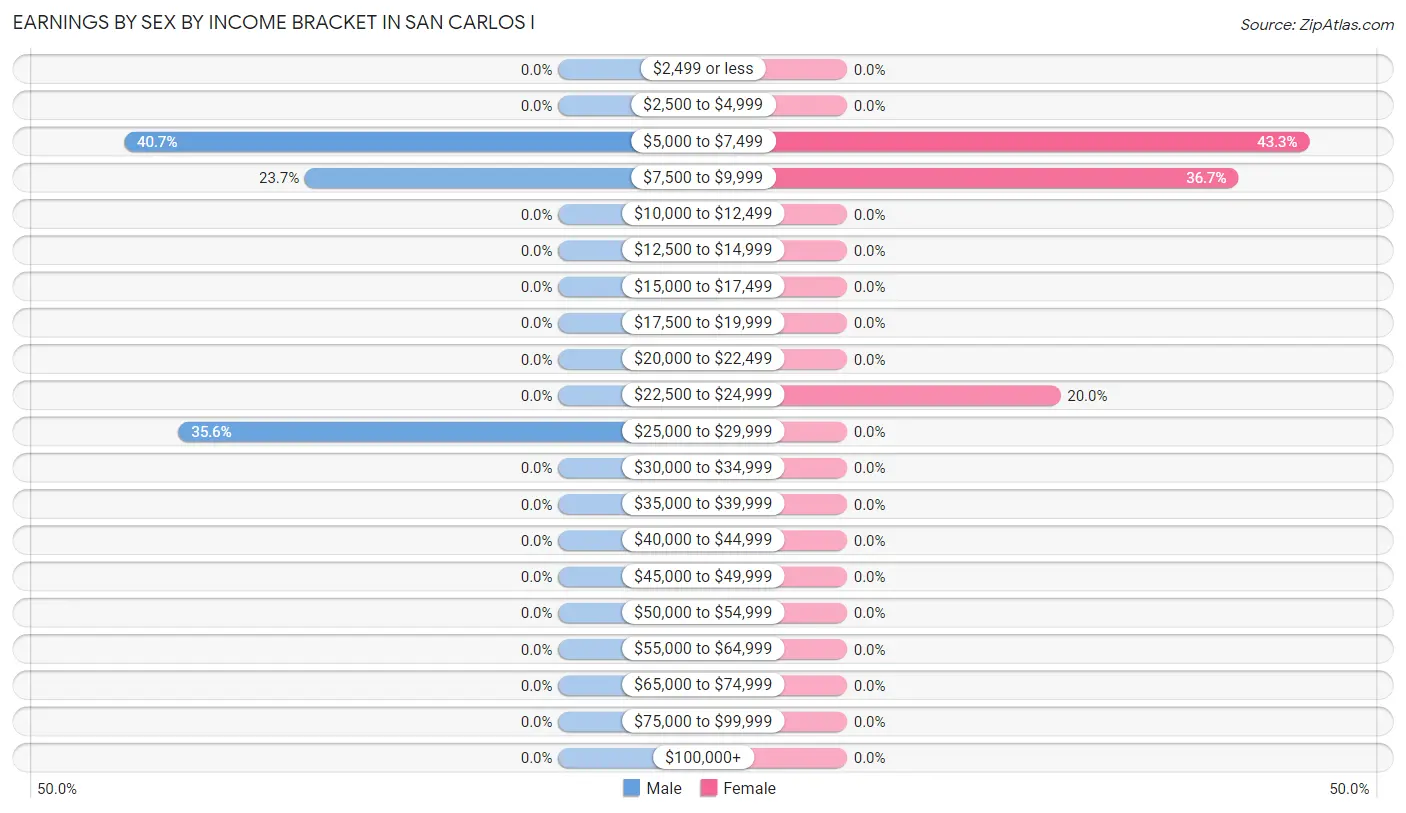
Earnings by Sex by Income Bracket in San Carlos I
The most common earnings brackets in San Carlos I are $5,000 to $7,499 for men (24 | 40.7%) and $5,000 to $7,499 for women (26 | 43.3%).
| Income | Male | Female |
| $2,499 or less | 0 (0.0%) | 0 (0.0%) |
| $2,500 to $4,999 | 0 (0.0%) | 0 (0.0%) |
| $5,000 to $7,499 | 24 (40.7%) | 26 (43.3%) |
| $7,500 to $9,999 | 14 (23.7%) | 22 (36.7%) |
| $10,000 to $12,499 | 0 (0.0%) | 0 (0.0%) |
| $12,500 to $14,999 | 0 (0.0%) | 0 (0.0%) |
| $15,000 to $17,499 | 0 (0.0%) | 0 (0.0%) |
| $17,500 to $19,999 | 0 (0.0%) | 0 (0.0%) |
| $20,000 to $22,499 | 0 (0.0%) | 0 (0.0%) |
| $22,500 to $24,999 | 0 (0.0%) | 12 (20.0%) |
| $25,000 to $29,999 | 21 (35.6%) | 0 (0.0%) |
| $30,000 to $34,999 | 0 (0.0%) | 0 (0.0%) |
| $35,000 to $39,999 | 0 (0.0%) | 0 (0.0%) |
| $40,000 to $44,999 | 0 (0.0%) | 0 (0.0%) |
| $45,000 to $49,999 | 0 (0.0%) | 0 (0.0%) |
| $50,000 to $54,999 | 0 (0.0%) | 0 (0.0%) |
| $55,000 to $64,999 | 0 (0.0%) | 0 (0.0%) |
| $65,000 to $74,999 | 0 (0.0%) | 0 (0.0%) |
| $75,000 to $99,999 | 0 (0.0%) | 0 (0.0%) |
| $100,000+ | 0 (0.0%) | 0 (0.0%) |
| Total | 59 (100.0%) | 60 (100.0%) |
Earnings by Sex by Educational Attainment in San Carlos I
| Educational Attainment | Male Income | Female Income |
| Less than High School | - | - |
| High School Diploma | - | - |
| College or Associate's Degree | - | - |
| Bachelor's Degree | - | - |
| Graduate Degree | - | - |
| Total | - | - |
Family Income in San Carlos I
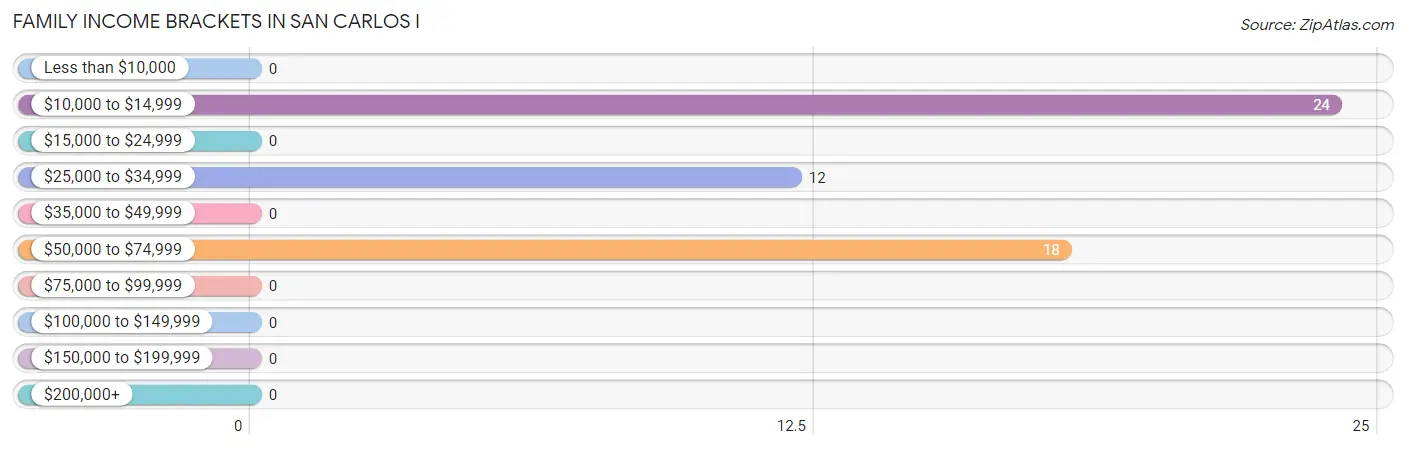
Family Income Brackets in San Carlos I
According to the San Carlos I family income data, there are 24 families falling into the $10,000 to $14,999 income range, which is the most common income bracket and makes up 44.4% of all families.
| Income Bracket | # Families | % Families |
| Less than $10,000 | 0 | 0.0% |
| $10,000 to $14,999 | 24 | 44.4% |
| $15,000 to $24,999 | 0 | 0.0% |
| $25,000 to $34,999 | 12 | 22.2% |
| $35,000 to $49,999 | 0 | 0.0% |
| $50,000 to $74,999 | 18 | 33.3% |
| $75,000 to $99,999 | 0 | 0.0% |
| $100,000 to $149,999 | 0 | 0.0% |
| $150,000 to $199,999 | 0 | 0.0% |
| $200,000+ | 0 | 0.0% |
Family Income by Famaliy Size in San Carlos I
| Income Bracket | # Families | Median Income |
| 2-Person Families | 0 (0.0%) | $0 |
| 3-Person Families | 12 (22.2%) | $0 |
| 4-Person Families | 42 (77.8%) | $0 |
| 5-Person Families | 0 (0.0%) | $0 |
| 6-Person Families | 0 (0.0%) | $0 |
| 7+ Person Families | 0 (0.0%) | $0 |
| Total | 54 (100.0%) | $0 |
Family Income by Number of Earners in San Carlos I
| Number of Earners | # Families | Median Income |
| No Earners | 0 (0.0%) | $0 |
| 1 Earner | 18 (33.3%) | $0 |
| 2 Earners | 36 (66.7%) | $0 |
| 3+ Earners | 0 (0.0%) | $0 |
| Total | 54 (100.0%) | $0 |
Household Income in San Carlos I
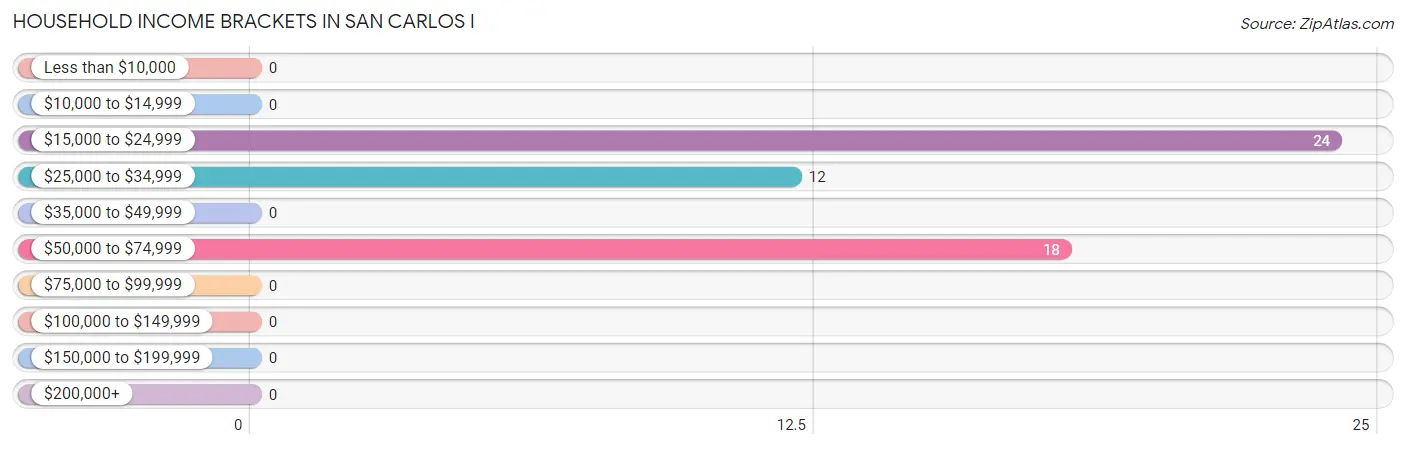
Household Income Brackets in San Carlos I
With 24 households falling in the category, the $15,000 to $24,999 income range is the most frequent in San Carlos I, accounting for 44.4% of all households.
| Income Bracket | # Households | % Households |
| Less than $10,000 | 0 | 0.0% |
| $10,000 to $14,999 | 0 | 0.0% |
| $15,000 to $24,999 | 24 | 44.4% |
| $25,000 to $34,999 | 12 | 22.2% |
| $35,000 to $49,999 | 0 | 0.0% |
| $50,000 to $74,999 | 18 | 33.3% |
| $75,000 to $99,999 | 0 | 0.0% |
| $100,000 to $149,999 | 0 | 0.0% |
| $150,000 to $199,999 | 0 | 0.0% |
| $200,000+ | 0 | 0.0% |
Household Income by Householder Age in San Carlos I
| Income Bracket | # Households | Median Income |
| 15 to 24 Years | 0 (0.0%) | $0 |
| 25 to 44 Years | 24 (44.4%) | $0 |
| 45 to 64 Years | 12 (22.2%) | $0 |
| 65+ Years | 18 (33.3%) | $0 |
| Total | 54 (100.0%) | $0 |
Poverty in San Carlos I
Income Below Poverty by Sex and Age in San Carlos I
With 51.5% poverty level for males and 49.5% for females among the residents of San Carlos I, 16 and 17 year old males and 18 to 24 year old females are the most vulnerable to poverty, with 22 males (100.0%) and 26 females (100.0%) in their respective age groups living below the poverty level.
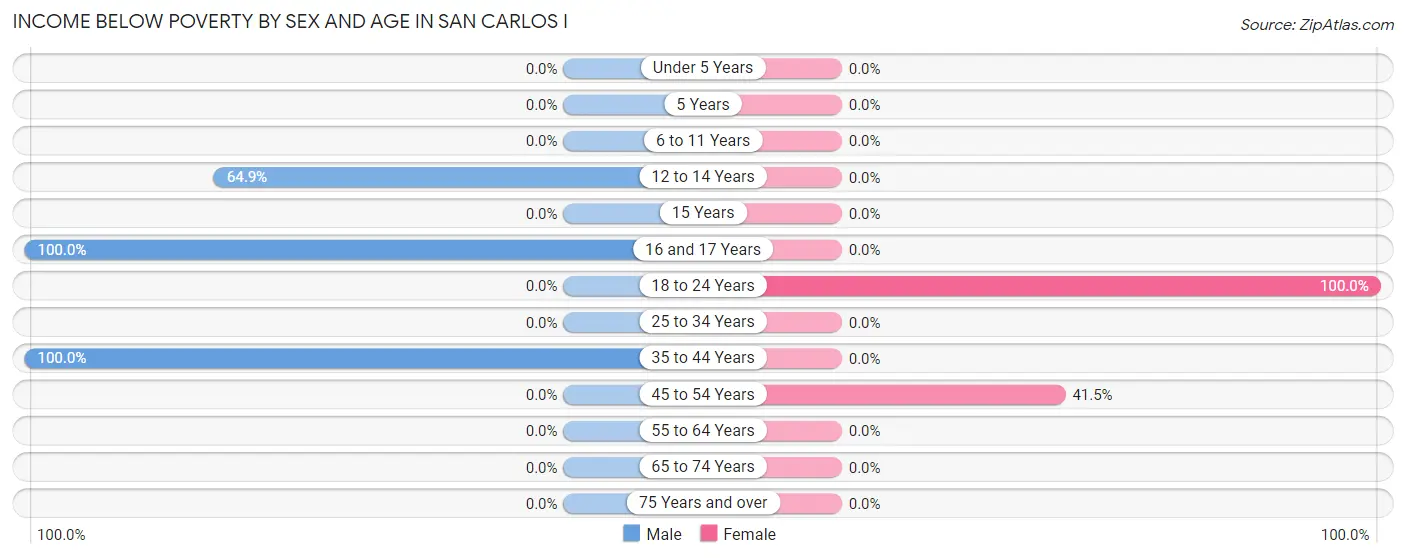
| Age Bracket | Male | Female |
| Under 5 Years | 0 (0.0%) | 0 (0.0%) |
| 5 Years | 0 (0.0%) | 0 (0.0%) |
| 6 to 11 Years | 0 (0.0%) | 0 (0.0%) |
| 12 to 14 Years | 24 (64.9%) | 0 (0.0%) |
| 15 Years | 0 (0.0%) | 0 (0.0%) |
| 16 and 17 Years | 22 (100.0%) | 0 (0.0%) |
| 18 to 24 Years | 0 (0.0%) | 26 (100.0%) |
| 25 to 34 Years | 0 (0.0%) | 0 (0.0%) |
| 35 to 44 Years | 24 (100.0%) | 0 (0.0%) |
| 45 to 54 Years | 0 (0.0%) | 22 (41.5%) |
| 55 to 64 Years | 0 (0.0%) | 0 (0.0%) |
| 65 to 74 Years | 0 (0.0%) | 0 (0.0%) |
| 75 Years and over | 0 (0.0%) | 0 (0.0%) |
| Total | 70 (51.5%) | 48 (49.5%) |
Income Above Poverty by Sex and Age in San Carlos I
According to the poverty statistics in San Carlos I, males aged 18 to 24 years and females aged 65 to 74 years are the age groups that are most secure financially, with 100.0% of males and 100.0% of females in these age groups living above the poverty line.
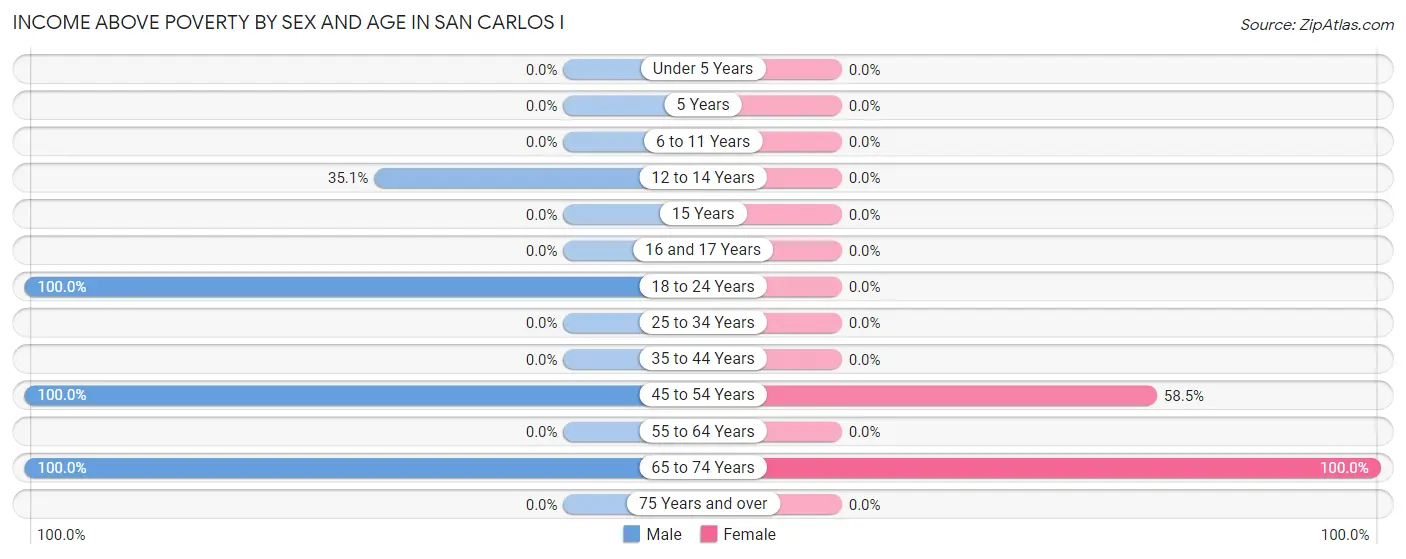
| Age Bracket | Male | Female |
| Under 5 Years | 0 (0.0%) | 0 (0.0%) |
| 5 Years | 0 (0.0%) | 0 (0.0%) |
| 6 to 11 Years | 0 (0.0%) | 0 (0.0%) |
| 12 to 14 Years | 13 (35.1%) | 0 (0.0%) |
| 15 Years | 0 (0.0%) | 0 (0.0%) |
| 16 and 17 Years | 0 (0.0%) | 0 (0.0%) |
| 18 to 24 Years | 14 (100.0%) | 0 (0.0%) |
| 25 to 34 Years | 0 (0.0%) | 0 (0.0%) |
| 35 to 44 Years | 0 (0.0%) | 0 (0.0%) |
| 45 to 54 Years | 21 (100.0%) | 31 (58.5%) |
| 55 to 64 Years | 0 (0.0%) | 0 (0.0%) |
| 65 to 74 Years | 18 (100.0%) | 18 (100.0%) |
| 75 Years and over | 0 (0.0%) | 0 (0.0%) |
| Total | 66 (48.5%) | 49 (50.5%) |
Income Below Poverty Among Married-Couple Families in San Carlos I
| Children | Above Poverty | Below Poverty |
| No Children | 18 (100.0%) | 0 (0.0%) |
| 1 or 2 Children | 0 (0.0%) | 0 (0.0%) |
| 3 or 4 Children | 0 (0.0%) | 0 (0.0%) |
| 5 or more Children | 0 (0.0%) | 0 (0.0%) |
| Total | 18 (100.0%) | 0 (0.0%) |
Income Below Poverty Among Single-Parent Households in San Carlos I
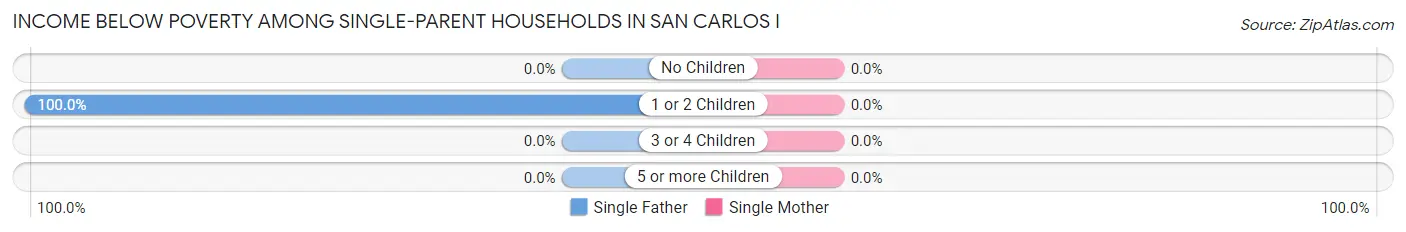
| Children | Single Father | Single Mother |
| No Children | 0 (0.0%) | 0 (0.0%) |
| 1 or 2 Children | 24 (100.0%) | 0 (0.0%) |
| 3 or 4 Children | 0 (0.0%) | 0 (0.0%) |
| 5 or more Children | 0 (0.0%) | 0 (0.0%) |
| Total | 24 (100.0%) | 0 (0.0%) |
Income Below Poverty Among Married-Couple vs Single-Parent Households in San Carlos I
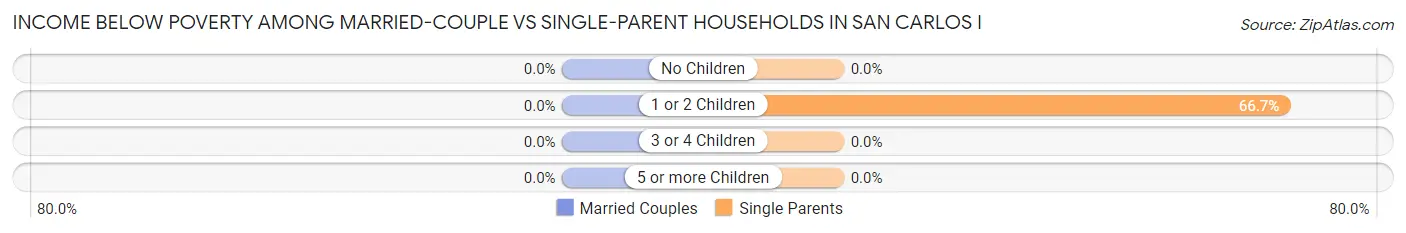
| Children | Married-Couple Families | Single-Parent Households |
| No Children | 0 (0.0%) | 0 (0.0%) |
| 1 or 2 Children | 0 (0.0%) | 24 (66.7%) |
| 3 or 4 Children | 0 (0.0%) | 0 (0.0%) |
| 5 or more Children | 0 (0.0%) | 0 (0.0%) |
| Total | 0 (0.0%) | 24 (66.7%) |
Race in San Carlos I
The most populous races in San Carlos I are Hispanic or Latino (233 | 100.0%), and White / Caucasian (233 | 100.0%).
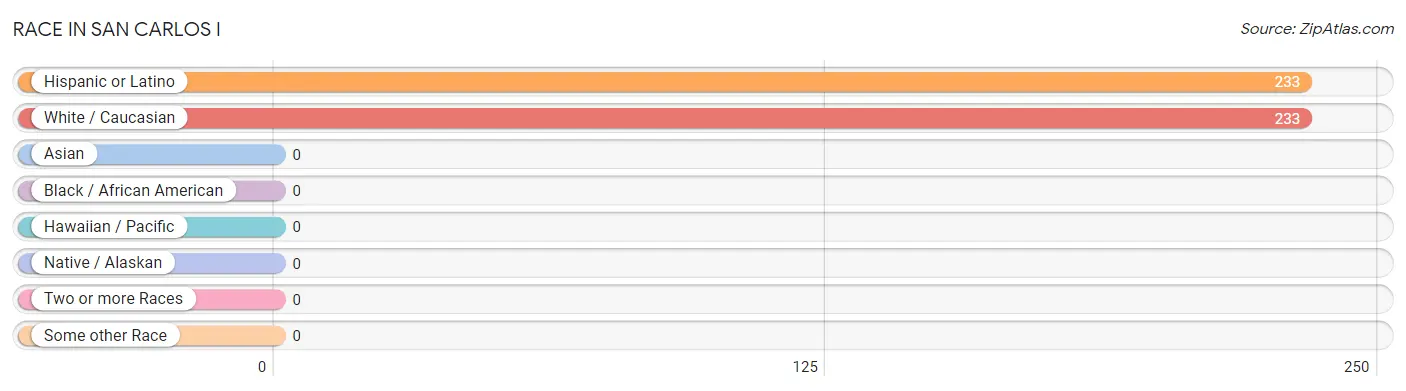
| Race | # Population | % Population |
| Asian | 0 | 0.0% |
| Black / African American | 0 | 0.0% |
| Hawaiian / Pacific | 0 | 0.0% |
| Hispanic or Latino | 233 | 100.0% |
| Native / Alaskan | 0 | 0.0% |
| White / Caucasian | 233 | 100.0% |
| Two or more Races | 0 | 0.0% |
| Some other Race | 0 | 0.0% |
| Total | 233 | 100.0% |
Ancestry in San Carlos I
The most populous ancestries reported in San Carlos I are , and Mexican (157 | 67.4%), together accounting for 67.4% of all San Carlos I residents.

| Ancestry | # Population | % Population |
| Mexican | 157 | 67.4% | View All 1 Rows |
Immigrants in San Carlos I
The most numerous immigrant groups reported in San Carlos I came from Central America (58 | 24.9%), Latin America (58 | 24.9%), and Mexico (58 | 24.9%), together accounting for 74.7% of all San Carlos I residents.
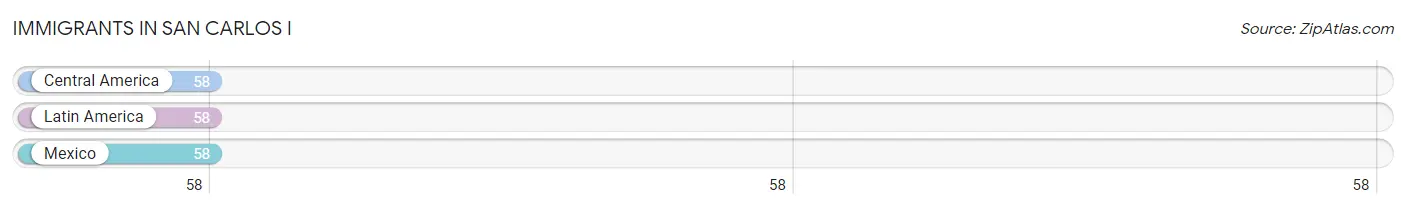
| Immigration Origin | # Population | % Population |
| Central America | 58 | 24.9% |
| Latin America | 58 | 24.9% |
| Mexico | 58 | 24.9% | View All 3 Rows |
Sex and Age in San Carlos I
Sex and Age in San Carlos I
The most populous age groups in San Carlos I are 10 to 14 Years (37 | 27.2%) for men and 45 to 49 Years (53 | 54.6%) for women.
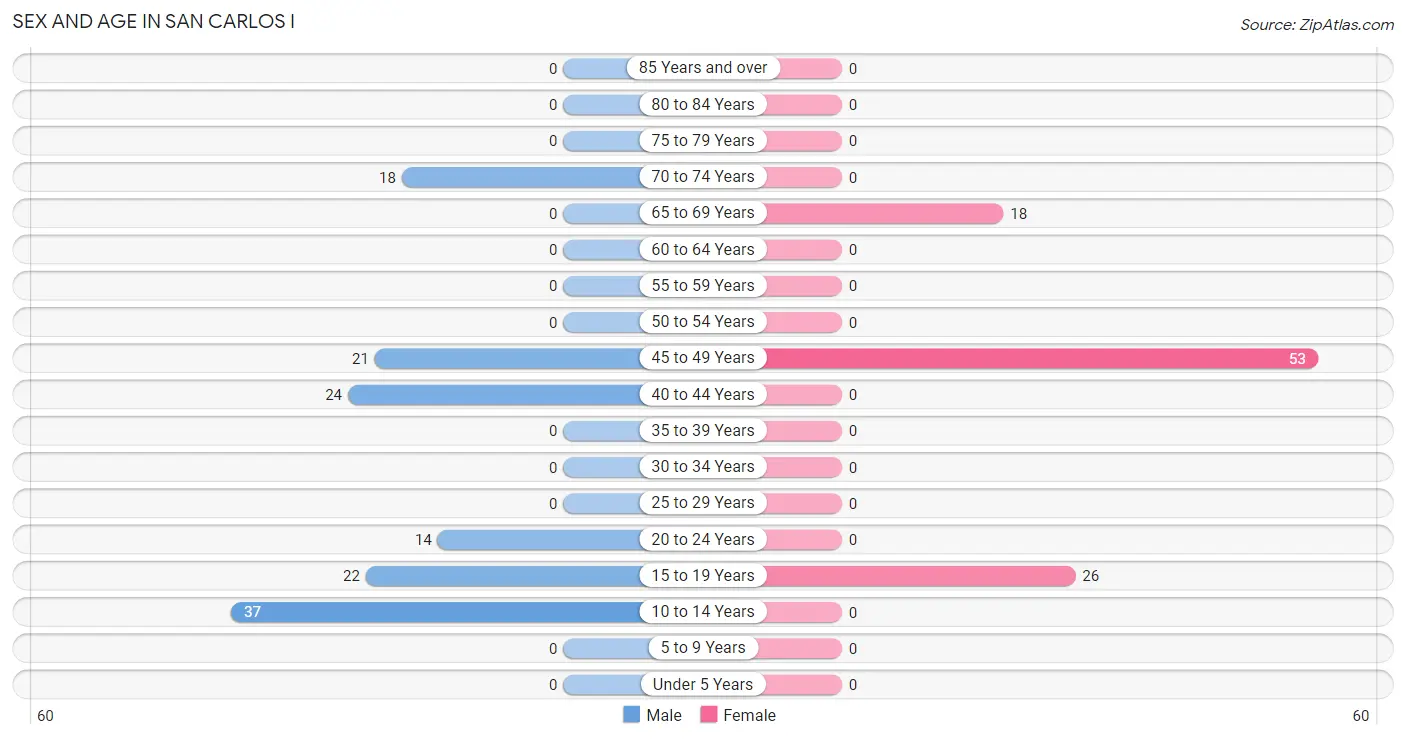
| Age Bracket | Male | Female |
| Under 5 Years | 0 (0.0%) | 0 (0.0%) |
| 5 to 9 Years | 0 (0.0%) | 0 (0.0%) |
| 10 to 14 Years | 37 (27.2%) | 0 (0.0%) |
| 15 to 19 Years | 22 (16.2%) | 26 (26.8%) |
| 20 to 24 Years | 14 (10.3%) | 0 (0.0%) |
| 25 to 29 Years | 0 (0.0%) | 0 (0.0%) |
| 30 to 34 Years | 0 (0.0%) | 0 (0.0%) |
| 35 to 39 Years | 0 (0.0%) | 0 (0.0%) |
| 40 to 44 Years | 24 (17.6%) | 0 (0.0%) |
| 45 to 49 Years | 21 (15.4%) | 53 (54.6%) |
| 50 to 54 Years | 0 (0.0%) | 0 (0.0%) |
| 55 to 59 Years | 0 (0.0%) | 0 (0.0%) |
| 60 to 64 Years | 0 (0.0%) | 0 (0.0%) |
| 65 to 69 Years | 0 (0.0%) | 18 (18.6%) |
| 70 to 74 Years | 18 (13.2%) | 0 (0.0%) |
| 75 to 79 Years | 0 (0.0%) | 0 (0.0%) |
| 80 to 84 Years | 0 (0.0%) | 0 (0.0%) |
| 85 Years and over | 0 (0.0%) | 0 (0.0%) |
| Total | 136 (100.0%) | 97 (100.0%) |
Families and Households in San Carlos I
Median Family Size in San Carlos I
The median family size in San Carlos I is 3.91 persons per family, with married-couple families (18 | 33.3%) accounting for the largest median family size of 4.22 persons per family. On the other hand, single female/mother families (12 | 22.2%) represent the smallest median family size with 3.25 persons per family.
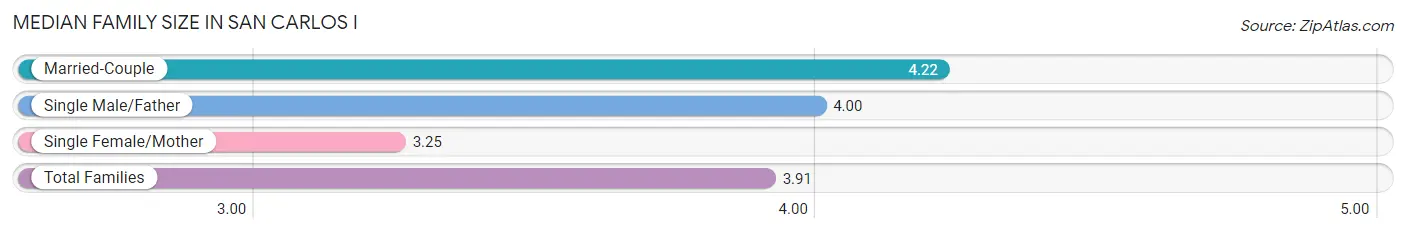
| Family Type | # Families | Family Size |
| Married-Couple | 18 (33.3%) | 4.22 |
| Single Male/Father | 24 (44.4%) | 4.00 |
| Single Female/Mother | 12 (22.2%) | 3.25 |
| Total Families | 54 (100.0%) | 3.91 |
Median Household Size in San Carlos I
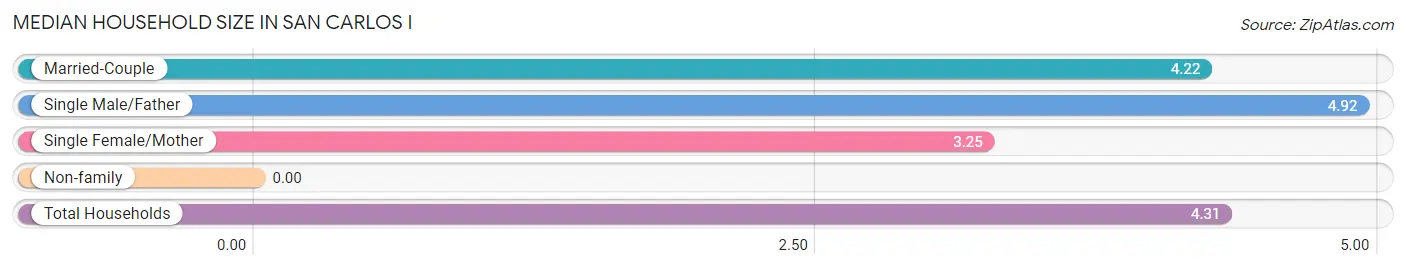
| Household Type | # Households | Household Size |
| Married-Couple | 18 (33.3%) | 4.22 |
| Single Male/Father | 24 (44.4%) | 4.92 |
| Single Female/Mother | 12 (22.2%) | 3.25 |
| Non-family | 0 (0.0%) | - |
| Total Households | 54 (100.0%) | 4.31 |
Household Size by Marriage Status in San Carlos I
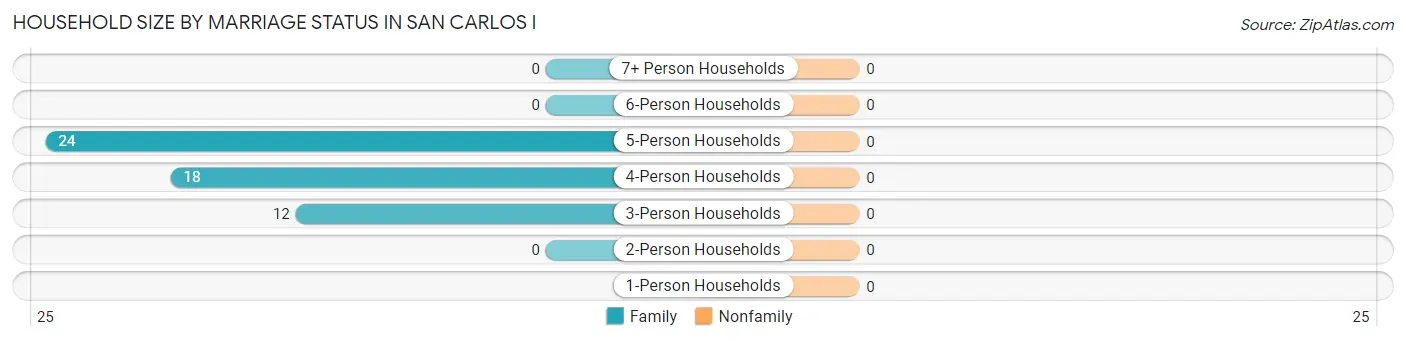
| Household Size | Family Households | Nonfamily Households |
| 1-Person Households | - | 0 (0.0%) |
| 2-Person Households | 0 (0.0%) | 0 (0.0%) |
| 3-Person Households | 12 (22.2%) | 0 (0.0%) |
| 4-Person Households | 18 (33.3%) | 0 (0.0%) |
| 5-Person Households | 24 (44.4%) | 0 (0.0%) |
| 6-Person Households | 0 (0.0%) | 0 (0.0%) |
| 7+ Person Households | 0 (0.0%) | 0 (0.0%) |
| Total | 54 (100.0%) | 0 (0.0%) |
Female Fertility in San Carlos I
Fertility by Age in San Carlos I
| Age Bracket | Women with Births | Births / 1,000 Women |
| 15 to 19 years | 0 (0.0%) | 0.0 |
| 20 to 34 years | 0 (0.0%) | 0.0 |
| 35 to 50 years | 0 (0.0%) | 0.0 |
| Total | 0 (0.0%) | 0.0 |
Fertility by Age by Marriage Status in San Carlos I
| Age Bracket | Married | Unmarried |
| 15 to 19 years | 0 (0.0%) | 0 (0.0%) |
| 20 to 34 years | 0 (0.0%) | 0 (0.0%) |
| 35 to 50 years | 0 (0.0%) | 0 (0.0%) |
| Total | 0 (0.0%) | 0 (0.0%) |
Fertility by Education in San Carlos I
| Educational Attainment | Women with Births | Births / 1,000 Women |
| Less than High School | 0 (0.0%) | 0.0 |
| High School Diploma | 0 (0.0%) | 0.0 |
| College or Associate's Degree | 0 (0.0%) | 0.0 |
| Bachelor's Degree | 0 (0.0%) | 0.0 |
| Graduate Degree | 0 (0.0%) | 0.0 |
| Total | 0 (0.0%) | 0.0 |
Fertility by Education by Marriage Status in San Carlos I
| Educational Attainment | Married | Unmarried |
| Less than High School | 0 (0.0%) | 0 (0.0%) |
| High School Diploma | 0 (0.0%) | 0 (0.0%) |
| College or Associate's Degree | 0 (0.0%) | 0 (0.0%) |
| Bachelor's Degree | 0 (0.0%) | 0 (0.0%) |
| Graduate Degree | 0 (0.0%) | 0 (0.0%) |
| Total | 0 (0.0%) | 0 (0.0%) |
Employment Characteristics in San Carlos I
Employment by Class of Employer in San Carlos I
Among the 119 employed individuals in San Carlos I, private company employees (52 | 43.7%), self-employed (not incorporated) (46 | 38.7%), and local government employees (21 | 17.6%) make up the most common classes of employment.
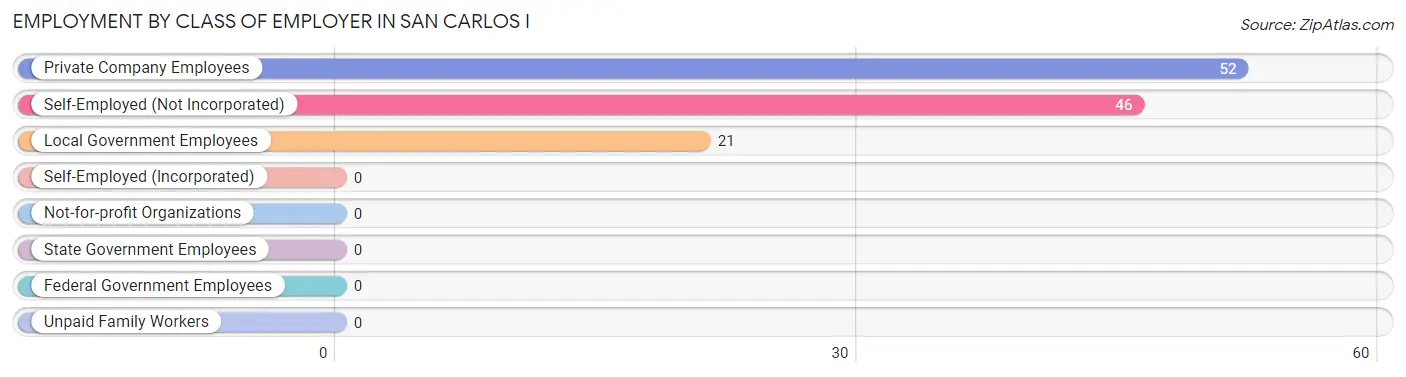
| Employer Class | # Employees | % Employees |
| Private Company Employees | 52 | 43.7% |
| Self-Employed (Incorporated) | 0 | 0.0% |
| Self-Employed (Not Incorporated) | 46 | 38.7% |
| Not-for-profit Organizations | 0 | 0.0% |
| Local Government Employees | 21 | 17.6% |
| State Government Employees | 0 | 0.0% |
| Federal Government Employees | 0 | 0.0% |
| Unpaid Family Workers | 0 | 0.0% |
| Total | 119 | 100.0% |
Employment Status by Age in San Carlos I
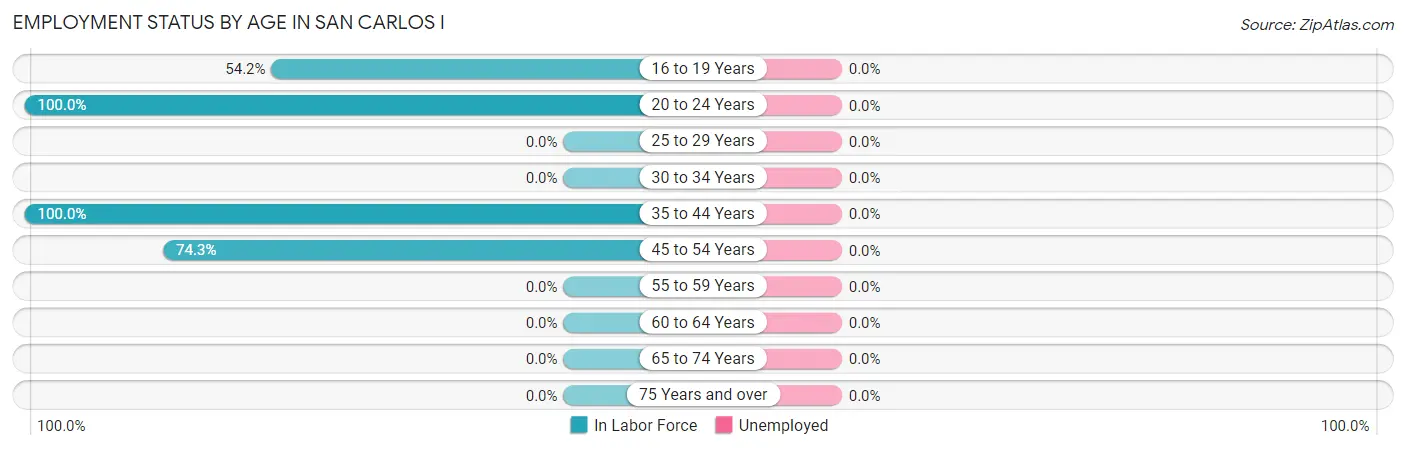
| Age Bracket | In Labor Force | Unemployed |
| 16 to 19 Years | 26 (54.2%) | 0 (0.0%) |
| 20 to 24 Years | 14 (100.0%) | 0 (0.0%) |
| 25 to 29 Years | 0 (0.0%) | 0 (0.0%) |
| 30 to 34 Years | 0 (0.0%) | 0 (0.0%) |
| 35 to 44 Years | 24 (100.0%) | 0 (0.0%) |
| 45 to 54 Years | 55 (74.3%) | 0 (0.0%) |
| 55 to 59 Years | 0 (0.0%) | 0 (0.0%) |
| 60 to 64 Years | 0 (0.0%) | 0 (0.0%) |
| 65 to 74 Years | 0 (0.0%) | 0 (0.0%) |
| 75 Years and over | 0 (0.0%) | 0 (0.0%) |
| Total | 119 (60.7%) | 0 (0.0%) |
Employment Status by Educational Attainment in San Carlos I
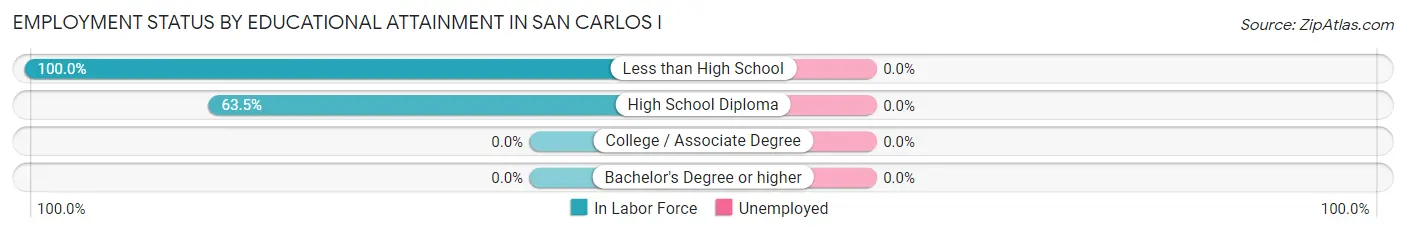
| Educational Attainment | In Labor Force | Unemployed |
| Less than High School | 46 (100.0%) | 0 (0.0%) |
| High School Diploma | 33 (63.5%) | 0 (0.0%) |
| College / Associate Degree | 0 (0.0%) | 0 (0.0%) |
| Bachelor's Degree or higher | 0 (0.0%) | 0 (0.0%) |
| Total | 79 (80.6%) | 0 (0.0%) |
Employment Occupations by Sex in San Carlos I
Management, Business, Science and Arts Occupations
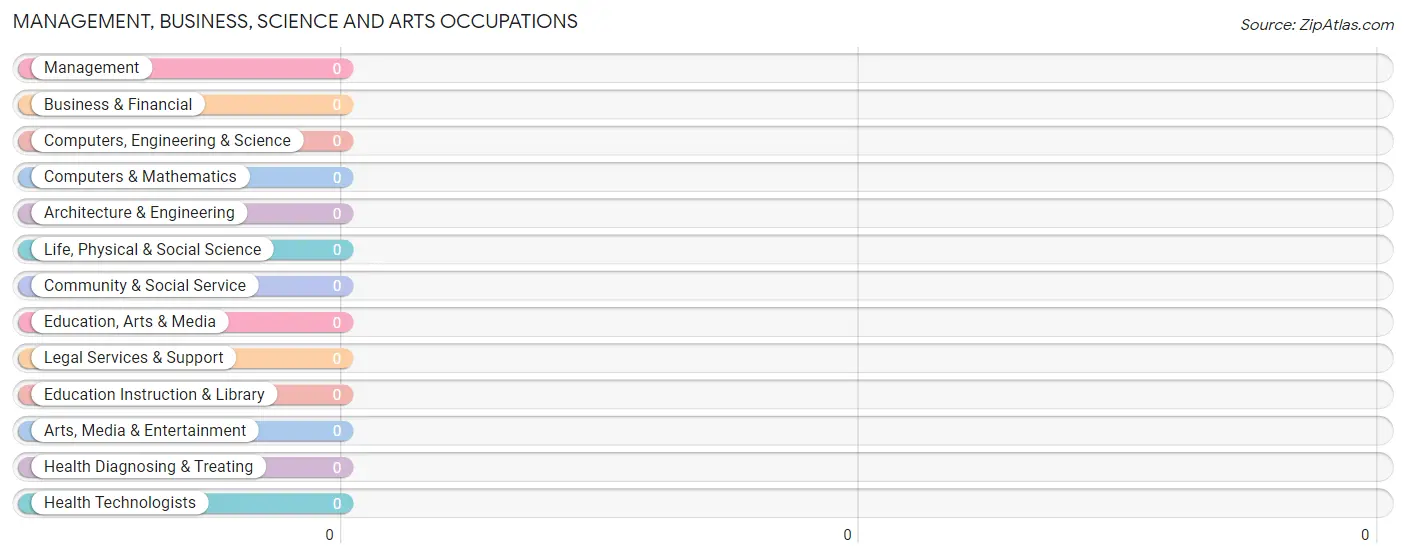
Management, Business, Science and Arts Occupations by Sex
| Occupation | Male | Female |
| Management | 0 (0.0%) | 0 (0.0%) |
| Business & Financial | 0 (0.0%) | 0 (0.0%) |
| Computers, Engineering & Science | 0 (0.0%) | 0 (0.0%) |
| Computers & Mathematics | 0 (0.0%) | 0 (0.0%) |
| Architecture & Engineering | 0 (0.0%) | 0 (0.0%) |
| Life, Physical & Social Science | 0 (0.0%) | 0 (0.0%) |
| Community & Social Service | 0 (0.0%) | 0 (0.0%) |
| Education, Arts & Media | 0 (0.0%) | 0 (0.0%) |
| Legal Services & Support | 0 (0.0%) | 0 (0.0%) |
| Education Instruction & Library | 0 (0.0%) | 0 (0.0%) |
| Arts, Media & Entertainment | 0 (0.0%) | 0 (0.0%) |
| Health Diagnosing & Treating | 0 (0.0%) | 0 (0.0%) |
| Health Technologists | 0 (0.0%) | 0 (0.0%) |
| Total (Category) | 0 (0.0%) | 0 (0.0%) |
| Total (Overall) | 59 (49.6%) | 60 (50.4%) |
Services Occupations
The most common Services occupations in San Carlos I are , and Cleaning & Maintenance (81 | 68.1%).
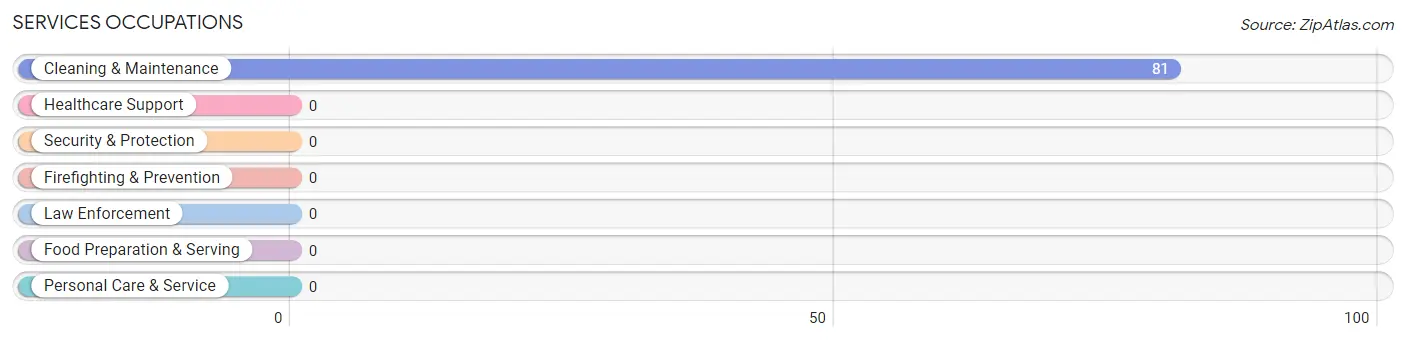
Services Occupations by Sex
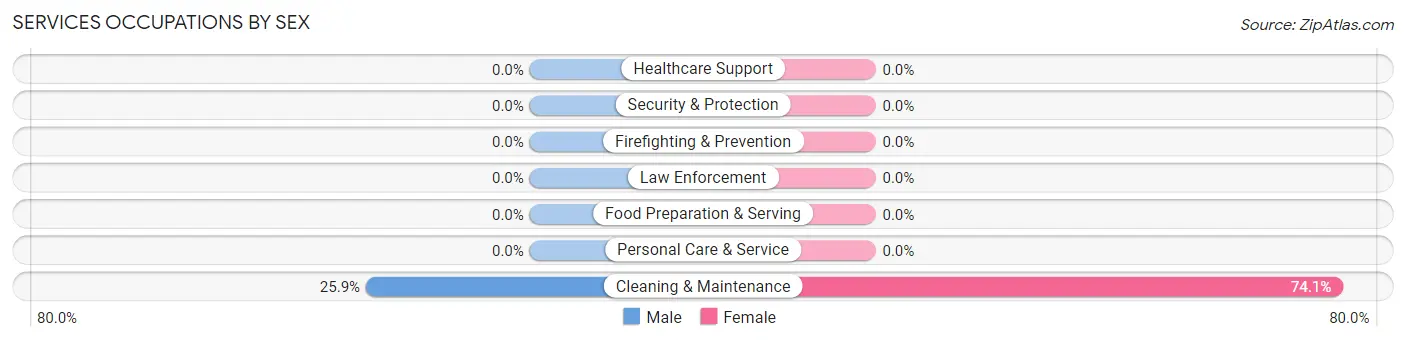
| Occupation | Male | Female |
| Healthcare Support | 0 (0.0%) | 0 (0.0%) |
| Security & Protection | 0 (0.0%) | 0 (0.0%) |
| Firefighting & Prevention | 0 (0.0%) | 0 (0.0%) |
| Law Enforcement | 0 (0.0%) | 0 (0.0%) |
| Food Preparation & Serving | 0 (0.0%) | 0 (0.0%) |
| Cleaning & Maintenance | 21 (25.9%) | 60 (74.1%) |
| Personal Care & Service | 0 (0.0%) | 0 (0.0%) |
| Total (Category) | 21 (25.9%) | 60 (74.1%) |
| Total (Overall) | 59 (49.6%) | 60 (50.4%) |
Sales and Office Occupations
Sales and Office Occupations by Sex
| Occupation | Male | Female |
| Sales & Related | 0 (0.0%) | 0 (0.0%) |
| Office & Administration | 0 (0.0%) | 0 (0.0%) |
| Total (Category) | 0 (0.0%) | 0 (0.0%) |
| Total (Overall) | 59 (49.6%) | 60 (50.4%) |
Natural Resources, Construction and Maintenance Occupations
Natural Resources, Construction and Maintenance Occupations by Sex
| Occupation | Male | Female |
| Farming, Fishing & Forestry | 0 (0.0%) | 0 (0.0%) |
| Construction & Extraction | 0 (0.0%) | 0 (0.0%) |
| Installation, Maintenance & Repair | 0 (0.0%) | 0 (0.0%) |
| Total (Category) | 0 (0.0%) | 0 (0.0%) |
| Total (Overall) | 59 (49.6%) | 60 (50.4%) |
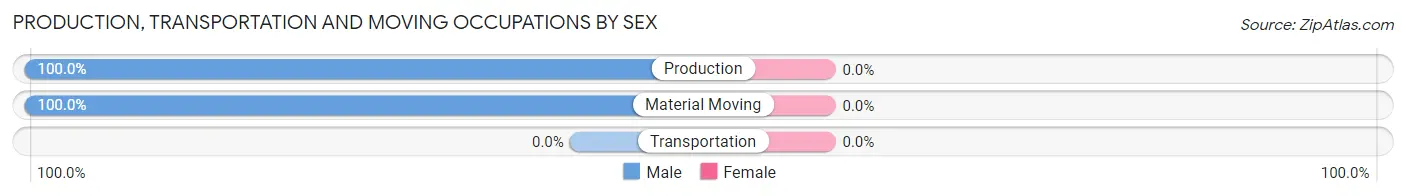
Production, Transportation and Moving Occupations
The most common Production, Transportation and Moving occupations in San Carlos I are Production (24 | 20.2%), and Material Moving (14 | 11.8%).
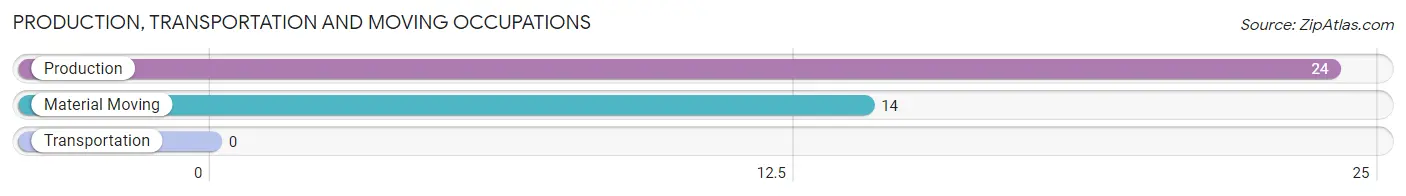
Production, Transportation and Moving Occupations by Sex
| Occupation | Male | Female |
| Production | 24 (100.0%) | 0 (0.0%) |
| Transportation | 0 (0.0%) | 0 (0.0%) |
| Material Moving | 14 (100.0%) | 0 (0.0%) |
| Total (Category) | 38 (100.0%) | 0 (0.0%) |
| Total (Overall) | 59 (49.6%) | 60 (50.4%) |
Employment Industries by Sex in San Carlos I
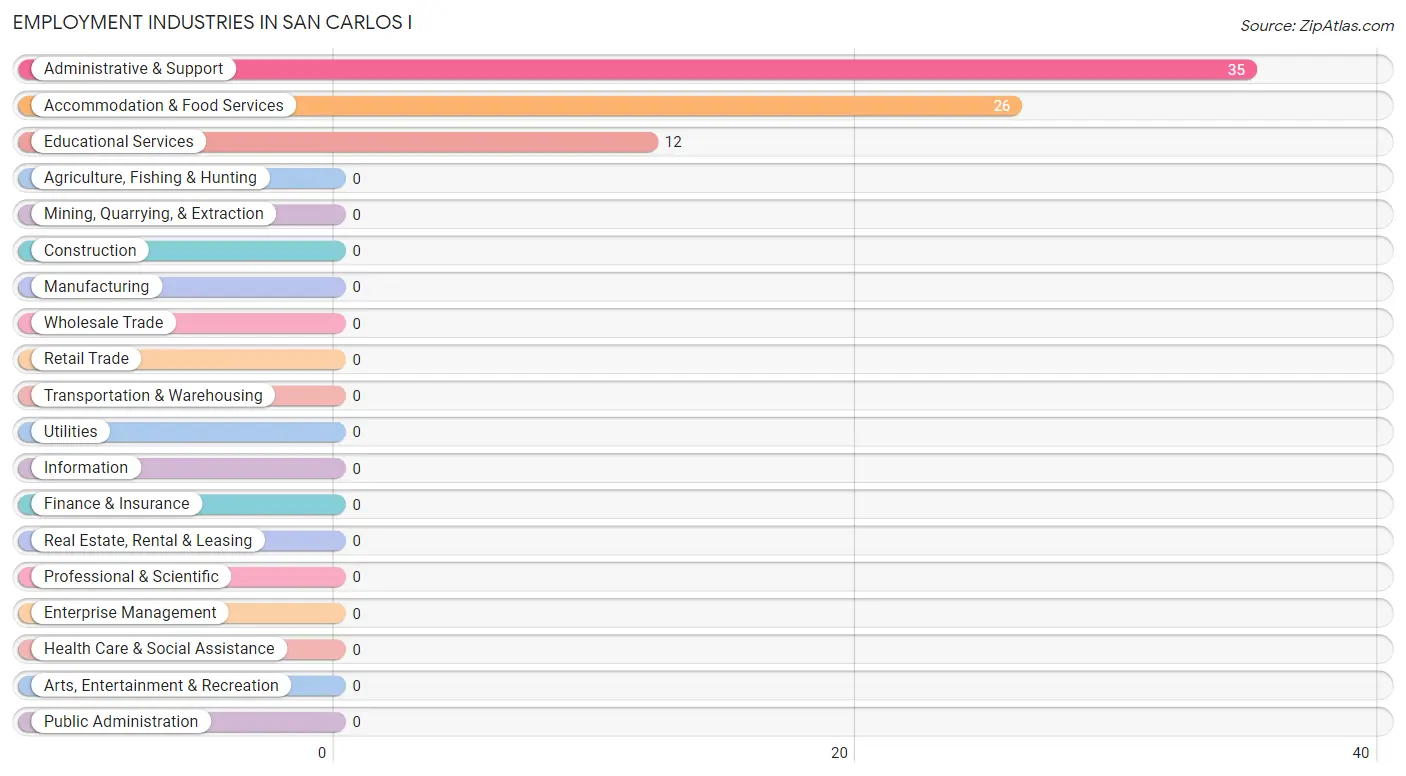
Employment Industries in San Carlos I
The major employment industries in San Carlos I include Administrative & Support (35 | 29.4%), Accommodation & Food Services (26 | 21.8%), and Educational Services (12 | 10.1%).
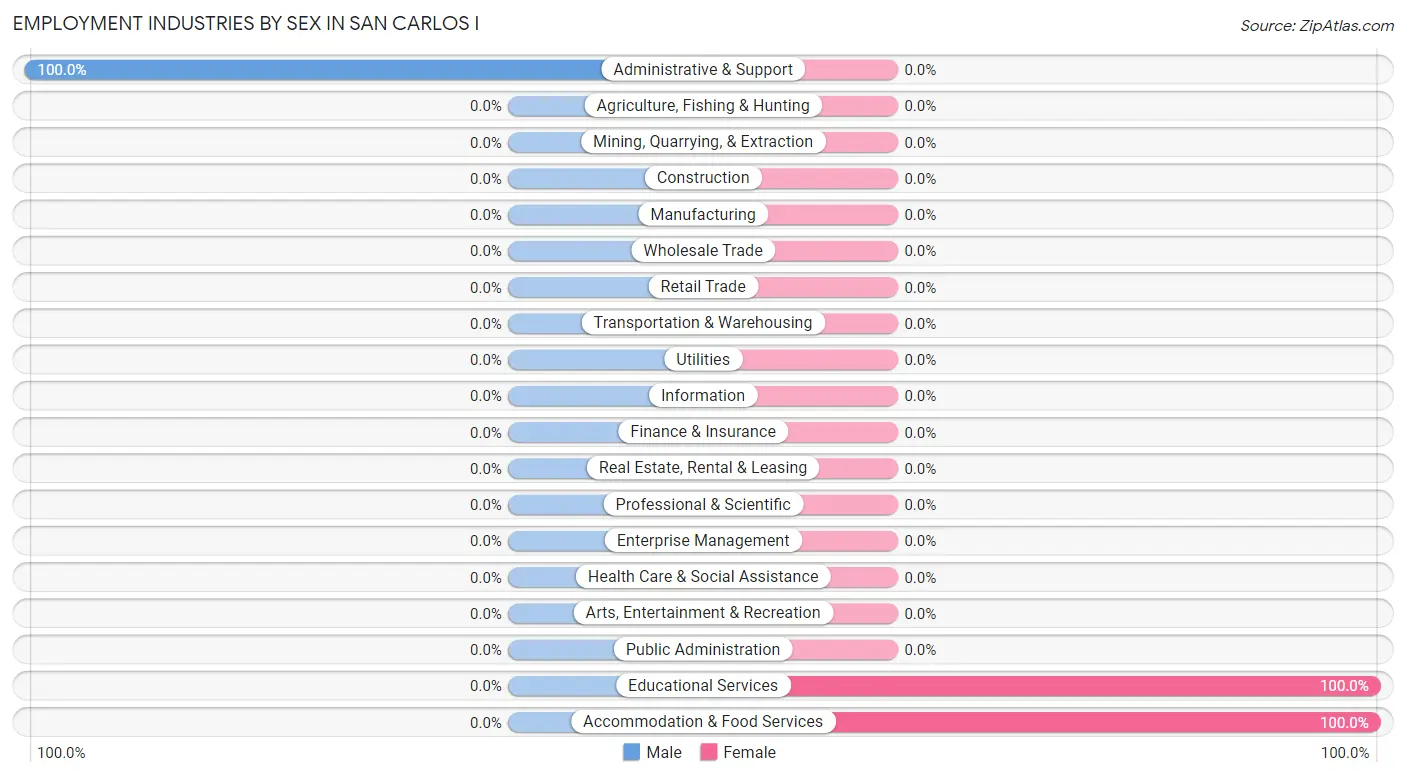
Employment Industries by Sex in San Carlos I
| Industry | Male | Female |
| Agriculture, Fishing & Hunting | 0 (0.0%) | 0 (0.0%) |
| Mining, Quarrying, & Extraction | 0 (0.0%) | 0 (0.0%) |
| Construction | 0 (0.0%) | 0 (0.0%) |
| Manufacturing | 0 (0.0%) | 0 (0.0%) |
| Wholesale Trade | 0 (0.0%) | 0 (0.0%) |
| Retail Trade | 0 (0.0%) | 0 (0.0%) |
| Transportation & Warehousing | 0 (0.0%) | 0 (0.0%) |
| Utilities | 0 (0.0%) | 0 (0.0%) |
| Information | 0 (0.0%) | 0 (0.0%) |
| Finance & Insurance | 0 (0.0%) | 0 (0.0%) |
| Real Estate, Rental & Leasing | 0 (0.0%) | 0 (0.0%) |
| Professional & Scientific | 0 (0.0%) | 0 (0.0%) |
| Enterprise Management | 0 (0.0%) | 0 (0.0%) |
| Administrative & Support | 35 (100.0%) | 0 (0.0%) |
| Educational Services | 0 (0.0%) | 12 (100.0%) |
| Health Care & Social Assistance | 0 (0.0%) | 0 (0.0%) |
| Arts, Entertainment & Recreation | 0 (0.0%) | 0 (0.0%) |
| Accommodation & Food Services | 0 (0.0%) | 26 (100.0%) |
| Public Administration | 0 (0.0%) | 0 (0.0%) |
| Total | 59 (49.6%) | 60 (50.4%) |
Education in San Carlos I
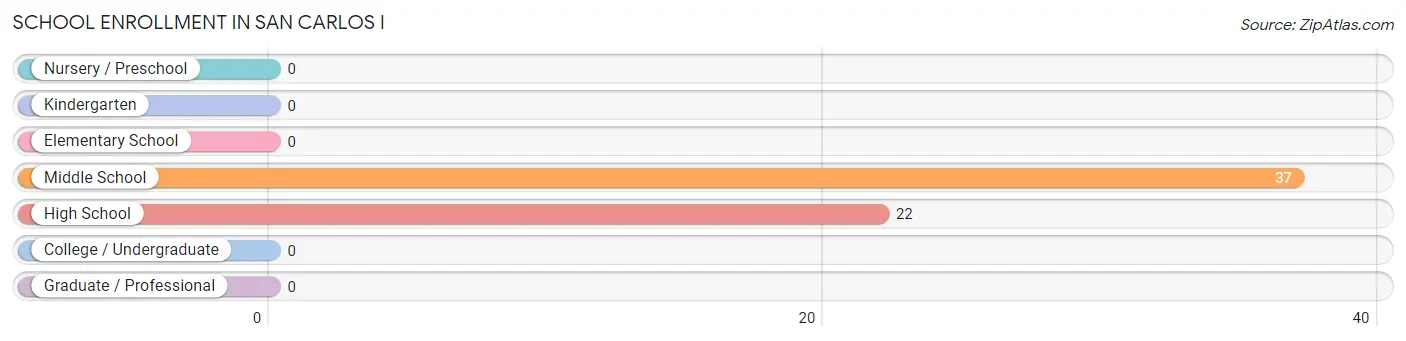
School Enrollment in San Carlos I
The most common levels of schooling among the 59 students in San Carlos I are middle school (37 | 62.7%), and high school (22 | 37.3%).
| School Level | # Students | % Students |
| Nursery / Preschool | 0 | 0.0% |
| Kindergarten | 0 | 0.0% |
| Elementary School | 0 | 0.0% |
| Middle School | 37 | 62.7% |
| High School | 22 | 37.3% |
| College / Undergraduate | 0 | 0.0% |
| Graduate / Professional | 0 | 0.0% |
| Total | 59 | 100.0% |
School Enrollment by Age by Funding Source in San Carlos I
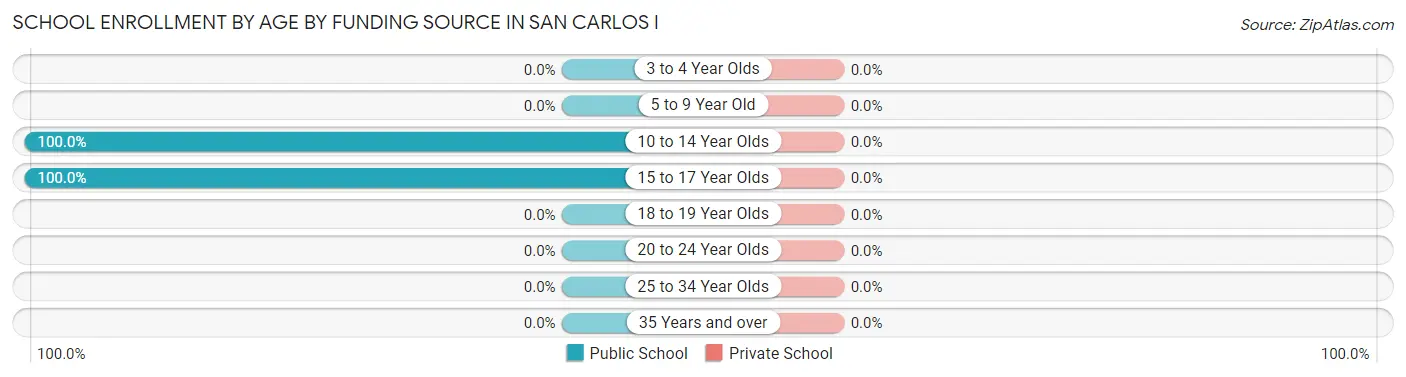
| Age Bracket | Public School | Private School |
| 3 to 4 Year Olds | 0 (0.0%) | 0 (0.0%) |
| 5 to 9 Year Old | 0 (0.0%) | 0 (0.0%) |
| 10 to 14 Year Olds | 37 (100.0%) | 0 (0.0%) |
| 15 to 17 Year Olds | 22 (100.0%) | 0 (0.0%) |
| 18 to 19 Year Olds | 0 (0.0%) | 0 (0.0%) |
| 20 to 24 Year Olds | 0 (0.0%) | 0 (0.0%) |
| 25 to 34 Year Olds | 0 (0.0%) | 0 (0.0%) |
| 35 Years and over | 0 (0.0%) | 0 (0.0%) |
| Total | 59 (100.0%) | 0 (0.0%) |
Educational Attainment by Field of Study in San Carlos I
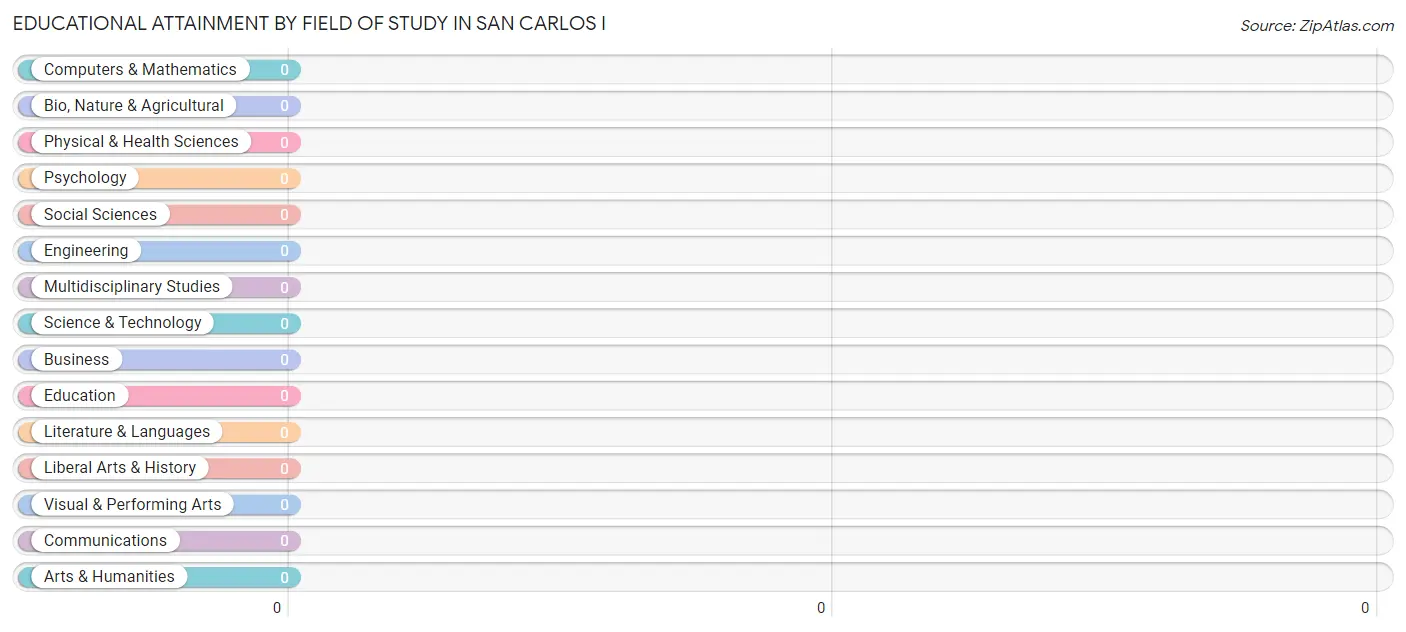
| Field of Study | # Graduates | % Graduates |
| Computers & Mathematics | 0 | 0.0% |
| Bio, Nature & Agricultural | 0 | 0.0% |
| Physical & Health Sciences | 0 | 0.0% |
| Psychology | 0 | 0.0% |
| Social Sciences | 0 | 0.0% |
| Engineering | 0 | 0.0% |
| Multidisciplinary Studies | 0 | 0.0% |
| Science & Technology | 0 | 0.0% |
| Business | 0 | 0.0% |
| Education | 0 | 0.0% |
| Literature & Languages | 0 | 0.0% |
| Liberal Arts & History | 0 | 0.0% |
| Visual & Performing Arts | 0 | 0.0% |
| Communications | 0 | 0.0% |
| Arts & Humanities | 0 | 0.0% |
| Total | 0 | 0.0% |
Transportation & Commute in San Carlos I
Vehicle Availability by Sex in San Carlos I
The most prevalent vehicle ownership categories in San Carlos I are males with 1 vehicle (35, accounting for 59.3%) and females with 1 vehicle (12, making up 58.3%).
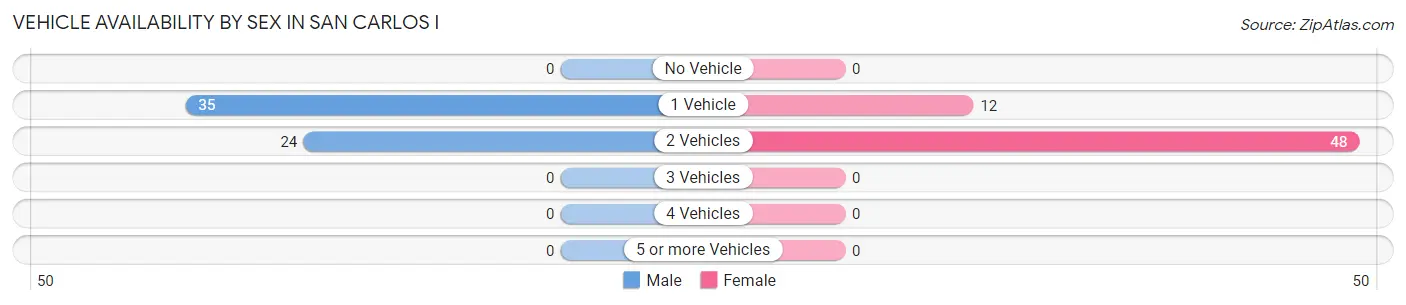
| Vehicles Available | Male | Female |
| No Vehicle | 0 (0.0%) | 0 (0.0%) |
| 1 Vehicle | 35 (59.3%) | 12 (20.0%) |
| 2 Vehicles | 24 (40.7%) | 48 (80.0%) |
| 3 Vehicles | 0 (0.0%) | 0 (0.0%) |
| 4 Vehicles | 0 (0.0%) | 0 (0.0%) |
| 5 or more Vehicles | 0 (0.0%) | 0 (0.0%) |
| Total | 59 (100.0%) | 60 (100.0%) |
Commute Time in San Carlos I
The most frequently occuring commute durations in San Carlos I are 15 to 19 minutes (26 commuters, 27.4%), 30 to 34 minutes (26 commuters, 27.4%), and 20 to 24 minutes (22 commuters, 23.2%).
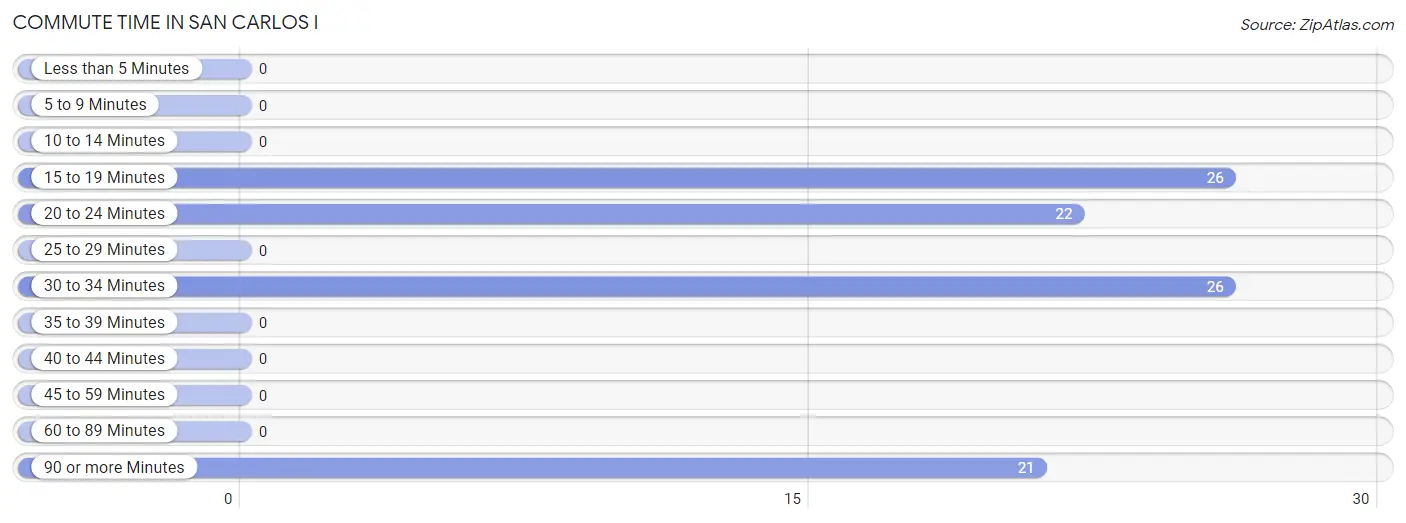
| Commute Time | # Commuters | % Commuters |
| Less than 5 Minutes | 0 | 0.0% |
| 5 to 9 Minutes | 0 | 0.0% |
| 10 to 14 Minutes | 0 | 0.0% |
| 15 to 19 Minutes | 26 | 27.4% |
| 20 to 24 Minutes | 22 | 23.2% |
| 25 to 29 Minutes | 0 | 0.0% |
| 30 to 34 Minutes | 26 | 27.4% |
| 35 to 39 Minutes | 0 | 0.0% |
| 40 to 44 Minutes | 0 | 0.0% |
| 45 to 59 Minutes | 0 | 0.0% |
| 60 to 89 Minutes | 0 | 0.0% |
| 90 or more Minutes | 21 | 22.1% |
Commute Time by Sex in San Carlos I
The most common commute times in San Carlos I are 90 or more minutes (21 commuters, 60.0%) for males and 15 to 19 minutes (26 commuters, 43.3%) for females.
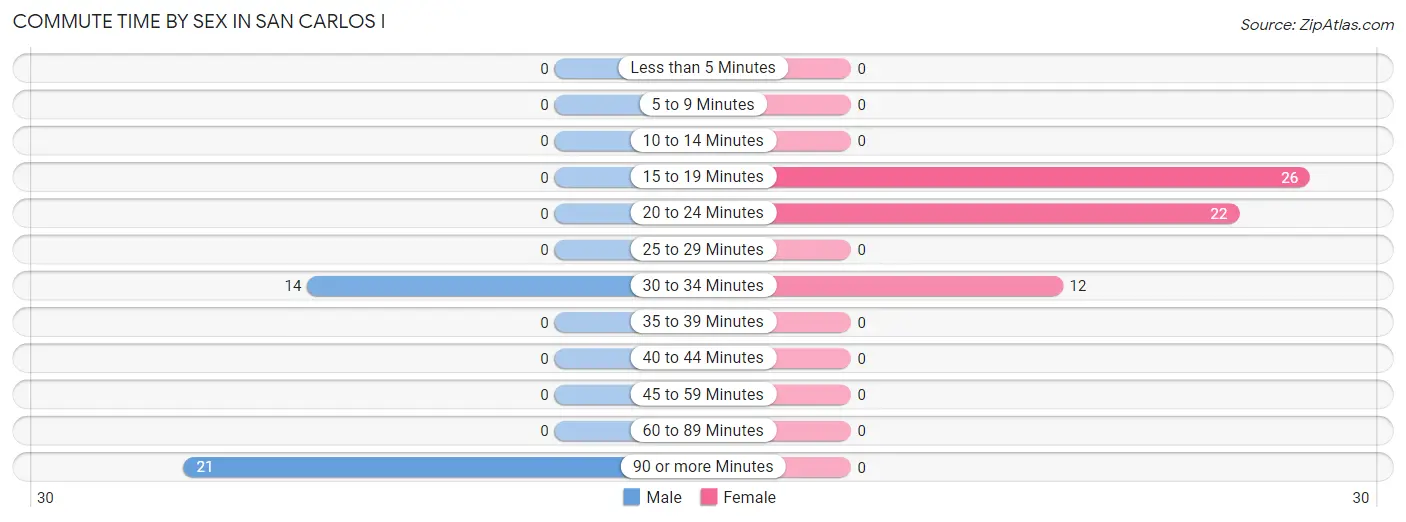
| Commute Time | Male | Female |
| Less than 5 Minutes | 0 (0.0%) | 0 (0.0%) |
| 5 to 9 Minutes | 0 (0.0%) | 0 (0.0%) |
| 10 to 14 Minutes | 0 (0.0%) | 0 (0.0%) |
| 15 to 19 Minutes | 0 (0.0%) | 26 (43.3%) |
| 20 to 24 Minutes | 0 (0.0%) | 22 (36.7%) |
| 25 to 29 Minutes | 0 (0.0%) | 0 (0.0%) |
| 30 to 34 Minutes | 14 (40.0%) | 12 (20.0%) |
| 35 to 39 Minutes | 0 (0.0%) | 0 (0.0%) |
| 40 to 44 Minutes | 0 (0.0%) | 0 (0.0%) |
| 45 to 59 Minutes | 0 (0.0%) | 0 (0.0%) |
| 60 to 89 Minutes | 0 (0.0%) | 0 (0.0%) |
| 90 or more Minutes | 21 (60.0%) | 0 (0.0%) |
Time of Departure to Work by Sex in San Carlos I
The most frequent times of departure to work in San Carlos I are 12:00 AM to 4:59 AM (21, 60.0%) for males and 11:00 AM to 11:59 AM (26, 43.3%) for females.
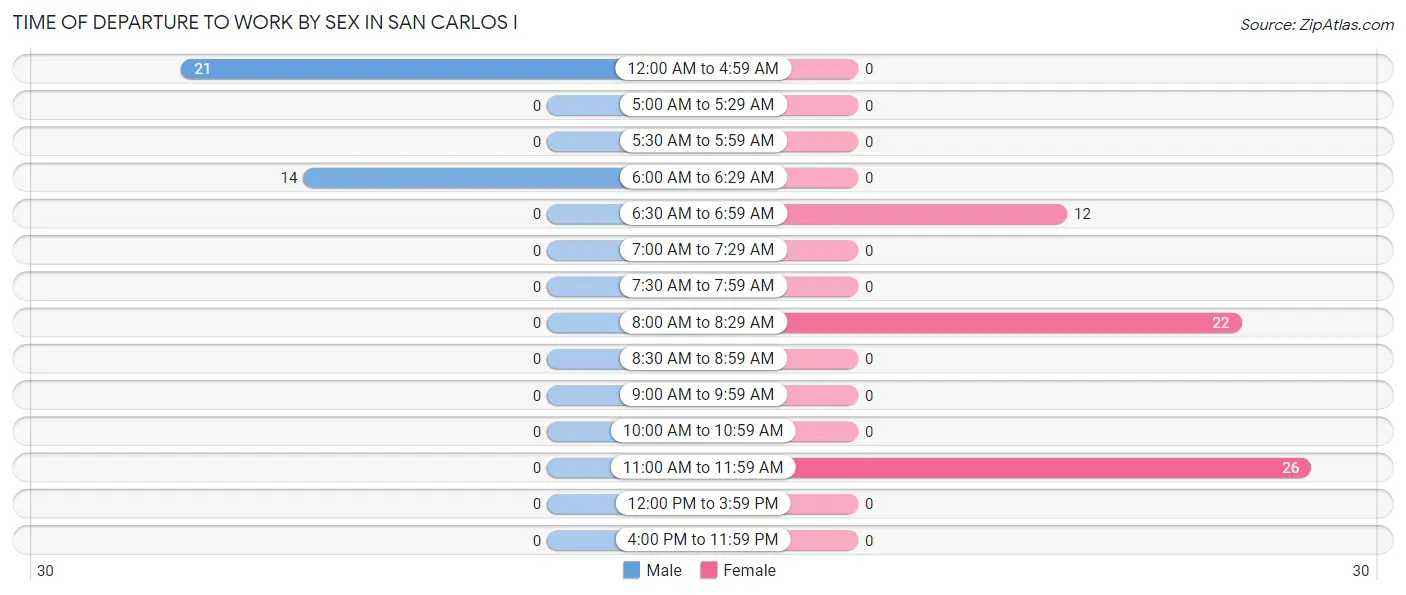
| Time of Departure | Male | Female |
| 12:00 AM to 4:59 AM | 21 (60.0%) | 0 (0.0%) |
| 5:00 AM to 5:29 AM | 0 (0.0%) | 0 (0.0%) |
| 5:30 AM to 5:59 AM | 0 (0.0%) | 0 (0.0%) |
| 6:00 AM to 6:29 AM | 14 (40.0%) | 0 (0.0%) |
| 6:30 AM to 6:59 AM | 0 (0.0%) | 12 (20.0%) |
| 7:00 AM to 7:29 AM | 0 (0.0%) | 0 (0.0%) |
| 7:30 AM to 7:59 AM | 0 (0.0%) | 0 (0.0%) |
| 8:00 AM to 8:29 AM | 0 (0.0%) | 22 (36.7%) |
| 8:30 AM to 8:59 AM | 0 (0.0%) | 0 (0.0%) |
| 9:00 AM to 9:59 AM | 0 (0.0%) | 0 (0.0%) |
| 10:00 AM to 10:59 AM | 0 (0.0%) | 0 (0.0%) |
| 11:00 AM to 11:59 AM | 0 (0.0%) | 26 (43.3%) |
| 12:00 PM to 3:59 PM | 0 (0.0%) | 0 (0.0%) |
| 4:00 PM to 11:59 PM | 0 (0.0%) | 0 (0.0%) |
| Total | 35 (100.0%) | 60 (100.0%) |
Housing Occupancy in San Carlos I
Occupancy by Ownership in San Carlos I
Of the total 54 dwellings in San Carlos I, owner-occupied units account for 30 (55.6%), while renter-occupied units make up 24 (44.4%).
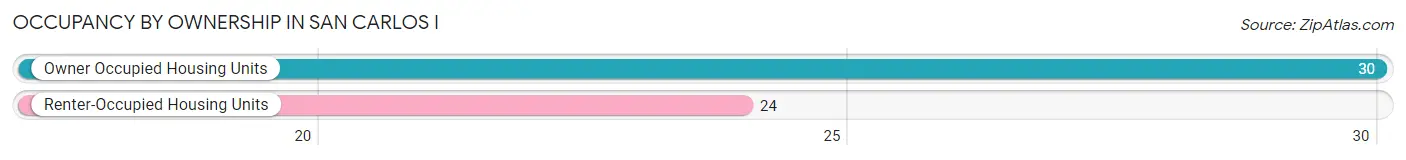
| Occupancy | # Housing Units | % Housing Units |
| Owner Occupied Housing Units | 30 | 55.6% |
| Renter-Occupied Housing Units | 24 | 44.4% |
| Total Occupied Housing Units | 54 | 100.0% |
Occupancy by Household Size in San Carlos I
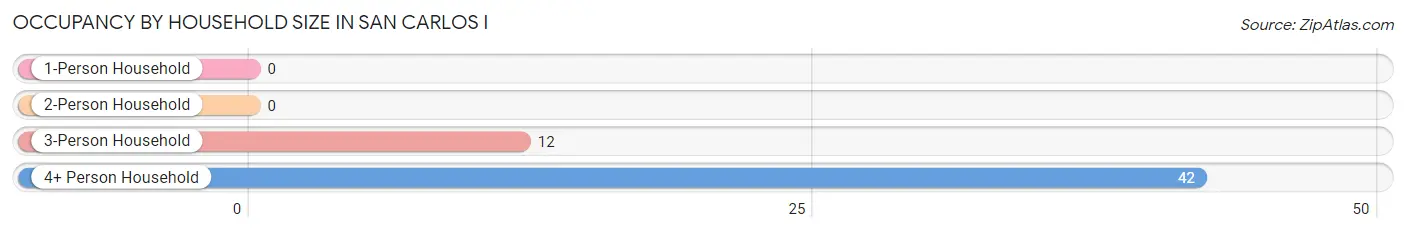
| Household Size | # Housing Units | % Housing Units |
| 1-Person Household | 0 | 0.0% |
| 2-Person Household | 0 | 0.0% |
| 3-Person Household | 12 | 22.2% |
| 4+ Person Household | 42 | 77.8% |
| Total Housing Units | 54 | 100.0% |
Occupancy by Ownership by Household Size in San Carlos I
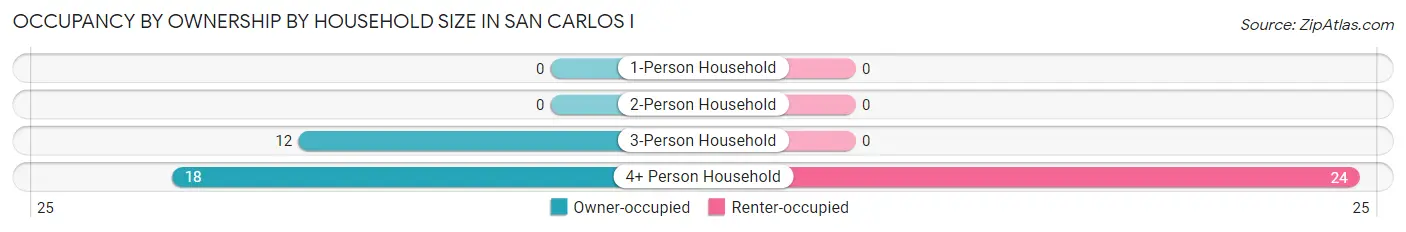
| Household Size | Owner-occupied | Renter-occupied |
| 1-Person Household | 0 (0.0%) | 0 (0.0%) |
| 2-Person Household | 0 (0.0%) | 0 (0.0%) |
| 3-Person Household | 12 (100.0%) | 0 (0.0%) |
| 4+ Person Household | 18 (42.9%) | 24 (57.1%) |
| Total Housing Units | 30 (55.6%) | 24 (44.4%) |
Occupancy by Educational Attainment in San Carlos I
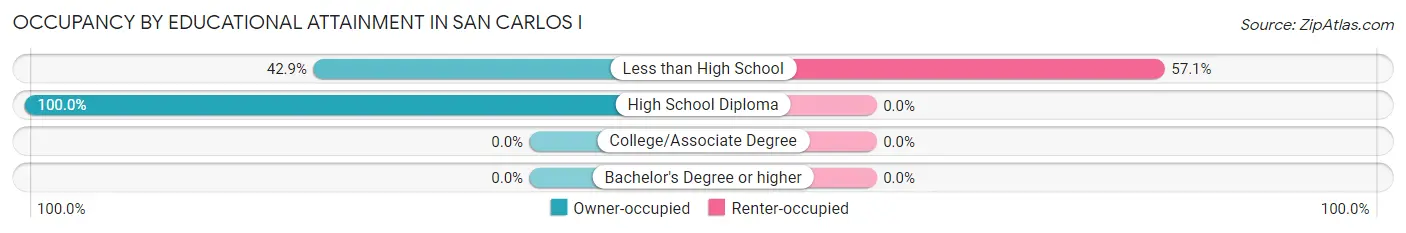
| Household Size | Owner-occupied | Renter-occupied |
| Less than High School | 18 (42.9%) | 24 (57.1%) |
| High School Diploma | 12 (100.0%) | 0 (0.0%) |
| College/Associate Degree | 0 (0.0%) | 0 (0.0%) |
| Bachelor's Degree or higher | 0 (0.0%) | 0 (0.0%) |
Occupancy by Age of Householder in San Carlos I
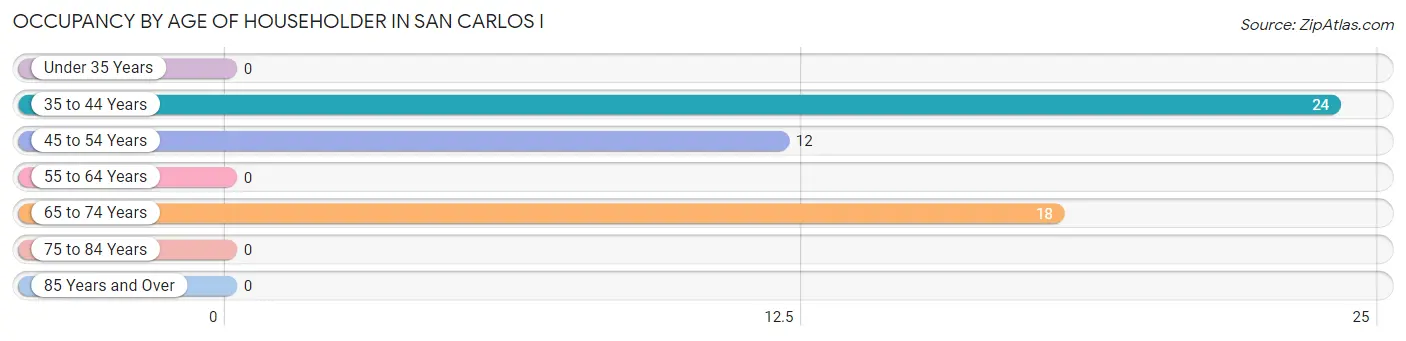
| Age Bracket | # Households | % Households |
| Under 35 Years | 0 | 0.0% |
| 35 to 44 Years | 24 | 44.4% |
| 45 to 54 Years | 12 | 22.2% |
| 55 to 64 Years | 0 | 0.0% |
| 65 to 74 Years | 18 | 33.3% |
| 75 to 84 Years | 0 | 0.0% |
| 85 Years and Over | 0 | 0.0% |
| Total | 54 | 100.0% |
Housing Finances in San Carlos I
Median Income by Occupancy in San Carlos I
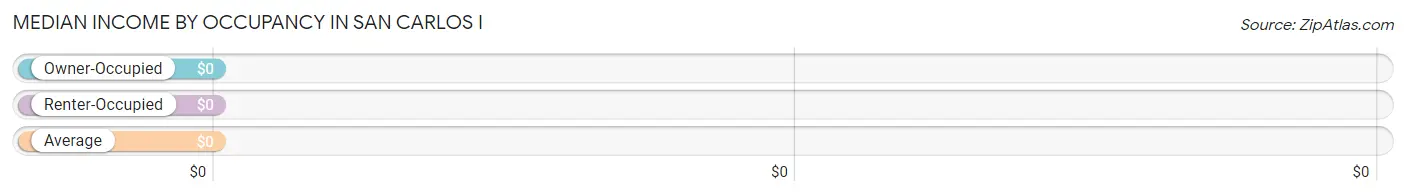
| Occupancy Type | # Households | Median Income |
| Owner-Occupied | 30 (55.6%) | $0 |
| Renter-Occupied | 24 (44.4%) | $0 |
| Average | 54 (100.0%) | $0 |
Occupancy by Householder Income Bracket in San Carlos I
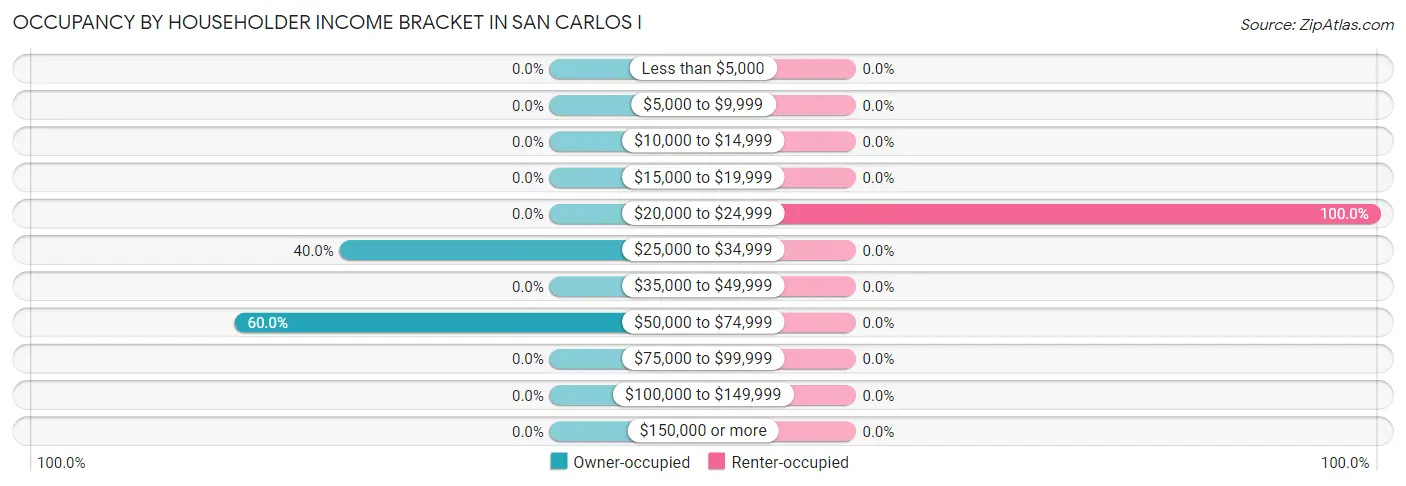
| Income Bracket | Owner-occupied | Renter-occupied |
| Less than $5,000 | 0 (0.0%) | 0 (0.0%) |
| $5,000 to $9,999 | 0 (0.0%) | 0 (0.0%) |
| $10,000 to $14,999 | 0 (0.0%) | 0 (0.0%) |
| $15,000 to $19,999 | 0 (0.0%) | 0 (0.0%) |
| $20,000 to $24,999 | 0 (0.0%) | 24 (100.0%) |
| $25,000 to $34,999 | 12 (40.0%) | 0 (0.0%) |
| $35,000 to $49,999 | 0 (0.0%) | 0 (0.0%) |
| $50,000 to $74,999 | 18 (60.0%) | 0 (0.0%) |
| $75,000 to $99,999 | 0 (0.0%) | 0 (0.0%) |
| $100,000 to $149,999 | 0 (0.0%) | 0 (0.0%) |
| $150,000 or more | 0 (0.0%) | 0 (0.0%) |
| Total | 30 (100.0%) | 24 (100.0%) |
Monthly Housing Cost Tiers in San Carlos I
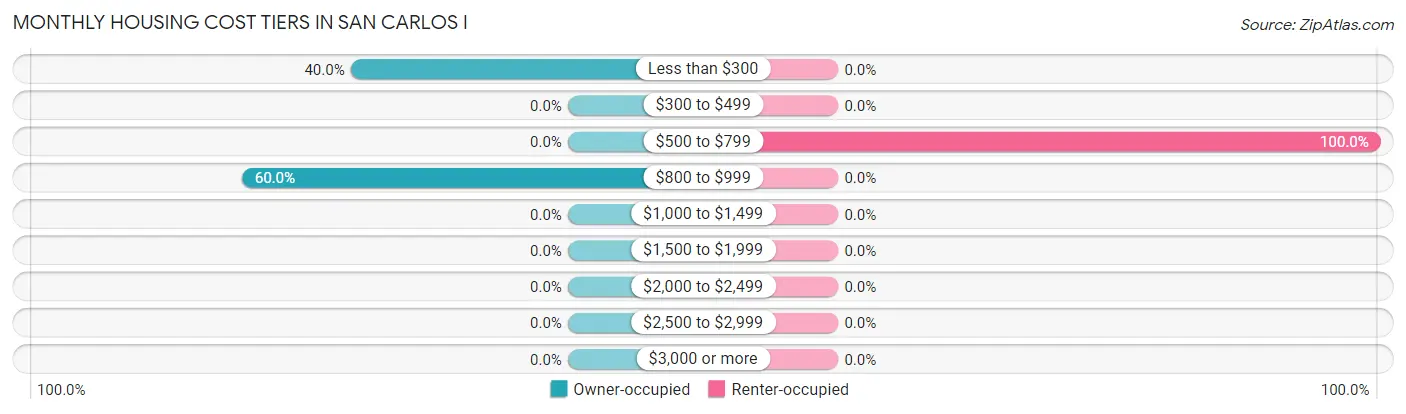
| Monthly Cost | Owner-occupied | Renter-occupied |
| Less than $300 | 12 (40.0%) | 0 (0.0%) |
| $300 to $499 | 0 (0.0%) | 0 (0.0%) |
| $500 to $799 | 0 (0.0%) | 24 (100.0%) |
| $800 to $999 | 18 (60.0%) | 0 (0.0%) |
| $1,000 to $1,499 | 0 (0.0%) | 0 (0.0%) |
| $1,500 to $1,999 | 0 (0.0%) | 0 (0.0%) |
| $2,000 to $2,499 | 0 (0.0%) | 0 (0.0%) |
| $2,500 to $2,999 | 0 (0.0%) | 0 (0.0%) |
| $3,000 or more | 0 (0.0%) | 0 (0.0%) |
| Total | 30 (100.0%) | 24 (100.0%) |
Physical Housing Characteristics in San Carlos I
Housing Structures in San Carlos I
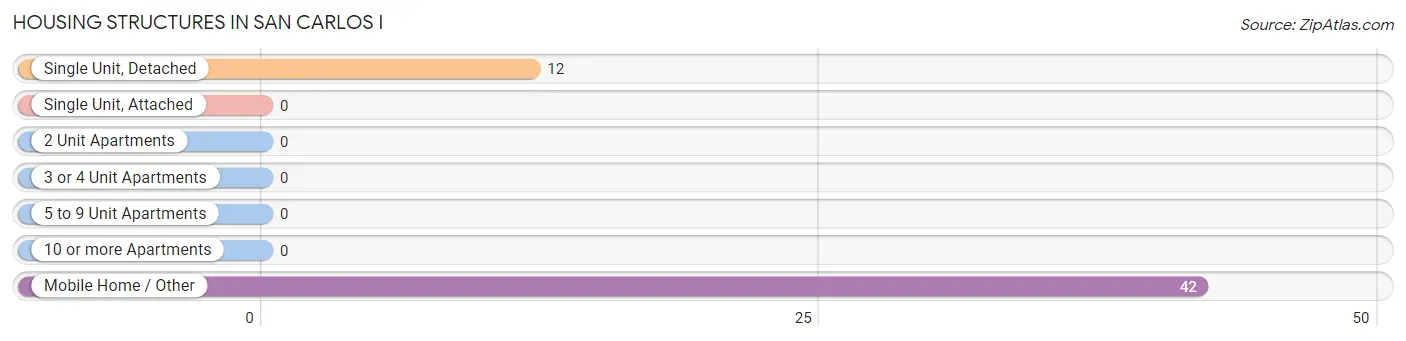
| Structure Type | # Housing Units | % Housing Units |
| Single Unit, Detached | 12 | 22.2% |
| Single Unit, Attached | 0 | 0.0% |
| 2 Unit Apartments | 0 | 0.0% |
| 3 or 4 Unit Apartments | 0 | 0.0% |
| 5 to 9 Unit Apartments | 0 | 0.0% |
| 10 or more Apartments | 0 | 0.0% |
| Mobile Home / Other | 42 | 77.8% |
| Total | 54 | 100.0% |
Housing Structures by Occupancy in San Carlos I
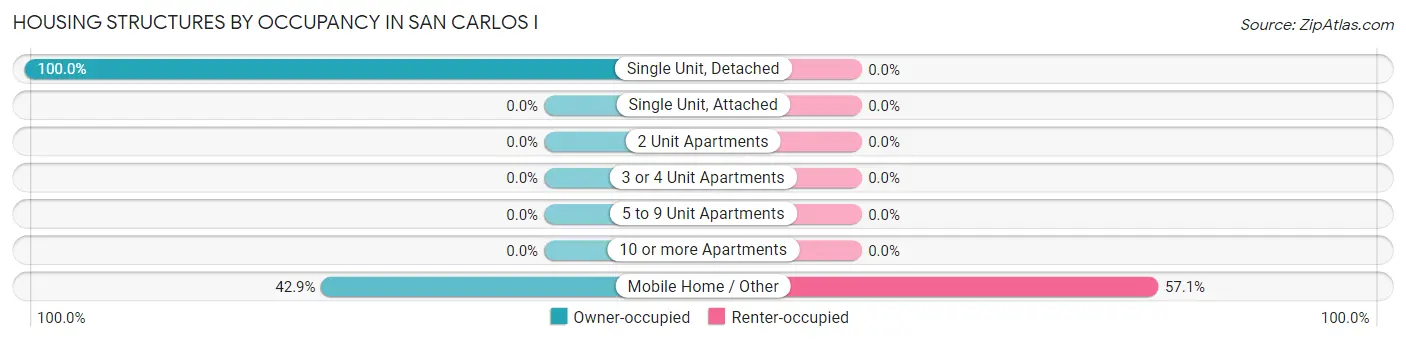
| Structure Type | Owner-occupied | Renter-occupied |
| Single Unit, Detached | 12 (100.0%) | 0 (0.0%) |
| Single Unit, Attached | 0 (0.0%) | 0 (0.0%) |
| 2 Unit Apartments | 0 (0.0%) | 0 (0.0%) |
| 3 or 4 Unit Apartments | 0 (0.0%) | 0 (0.0%) |
| 5 to 9 Unit Apartments | 0 (0.0%) | 0 (0.0%) |
| 10 or more Apartments | 0 (0.0%) | 0 (0.0%) |
| Mobile Home / Other | 18 (42.9%) | 24 (57.1%) |
| Total | 30 (55.6%) | 24 (44.4%) |
Housing Structures by Number of Rooms in San Carlos I
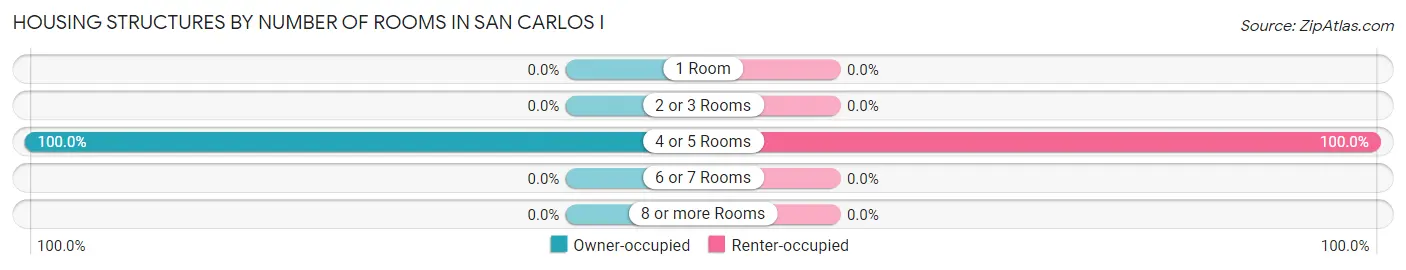
| Number of Rooms | Owner-occupied | Renter-occupied |
| 1 Room | 0 (0.0%) | 0 (0.0%) |
| 2 or 3 Rooms | 0 (0.0%) | 0 (0.0%) |
| 4 or 5 Rooms | 30 (100.0%) | 24 (100.0%) |
| 6 or 7 Rooms | 0 (0.0%) | 0 (0.0%) |
| 8 or more Rooms | 0 (0.0%) | 0 (0.0%) |
| Total | 30 (100.0%) | 24 (100.0%) |
Housing Structure by Heating Type in San Carlos I
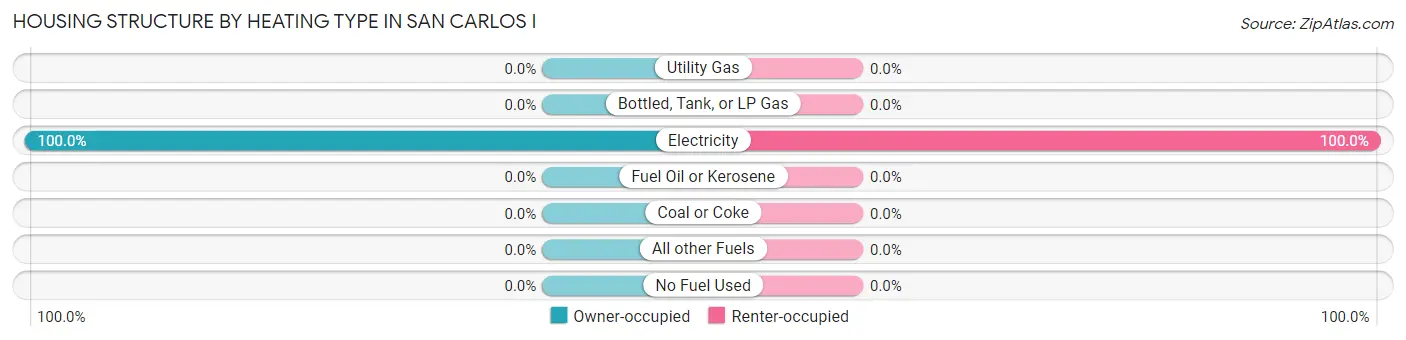
| Heating Type | Owner-occupied | Renter-occupied |
| Utility Gas | 0 (0.0%) | 0 (0.0%) |
| Bottled, Tank, or LP Gas | 0 (0.0%) | 0 (0.0%) |
| Electricity | 30 (100.0%) | 24 (100.0%) |
| Fuel Oil or Kerosene | 0 (0.0%) | 0 (0.0%) |
| Coal or Coke | 0 (0.0%) | 0 (0.0%) |
| All other Fuels | 0 (0.0%) | 0 (0.0%) |
| No Fuel Used | 0 (0.0%) | 0 (0.0%) |
| Total | 30 (100.0%) | 24 (100.0%) |
Household Vehicle Usage in San Carlos I
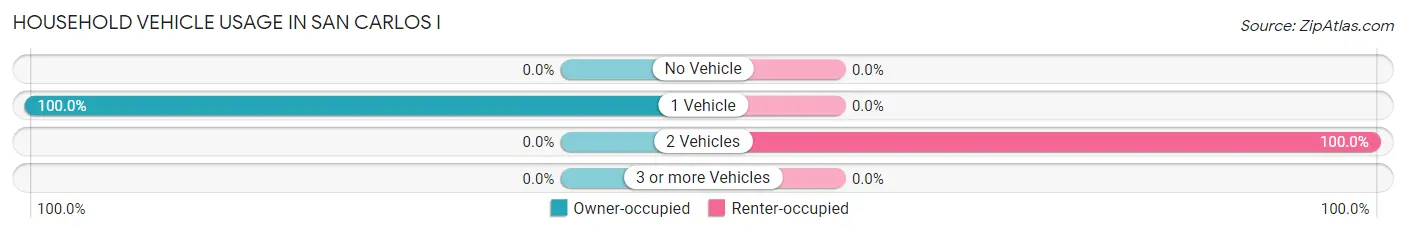
| Vehicles per Household | Owner-occupied | Renter-occupied |
| No Vehicle | 0 (0.0%) | 0 (0.0%) |
| 1 Vehicle | 30 (100.0%) | 0 (0.0%) |
| 2 Vehicles | 0 (0.0%) | 24 (100.0%) |
| 3 or more Vehicles | 0 (0.0%) | 0 (0.0%) |
| Total | 30 (100.0%) | 24 (100.0%) |
Real Estate & Mortgages in San Carlos I
Real Estate and Mortgage Overview in San Carlos I
| Characteristic | Without Mortgage | With Mortgage |
| Housing Units | 30 | 0 |
| Median Property Value | - | - |
| Median Household Income | - | - |
| Monthly Housing Costs | - | - |
| Real Estate Taxes | - | - |
Property Value by Mortgage Status in San Carlos I
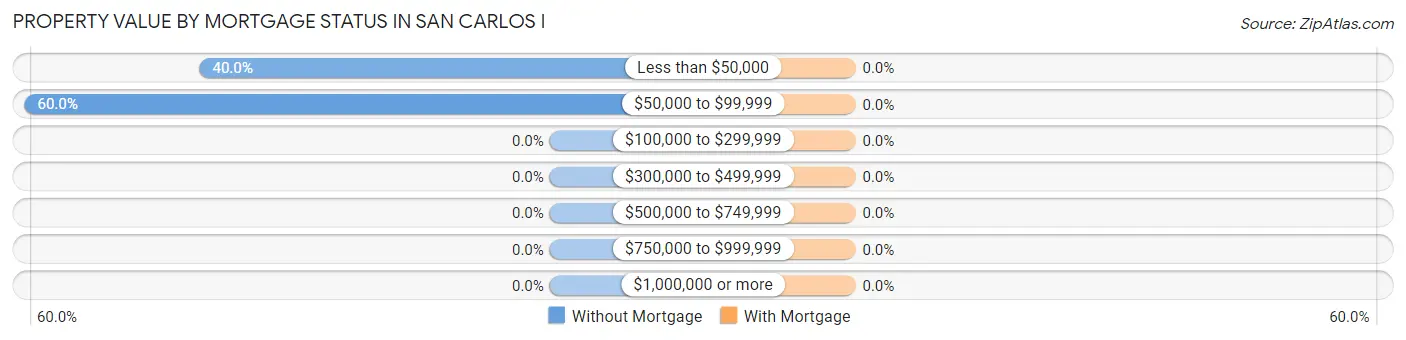
| Property Value | Without Mortgage | With Mortgage |
| Less than $50,000 | 12 (40.0%) | 0 (0.0%) |
| $50,000 to $99,999 | 18 (60.0%) | 0 (0.0%) |
| $100,000 to $299,999 | 0 (0.0%) | 0 (0.0%) |
| $300,000 to $499,999 | 0 (0.0%) | 0 (0.0%) |
| $500,000 to $749,999 | 0 (0.0%) | 0 (0.0%) |
| $750,000 to $999,999 | 0 (0.0%) | 0 (0.0%) |
| $1,000,000 or more | 0 (0.0%) | 0 (0.0%) |
| Total | 30 (100.0%) | 0 (0.0%) |
Household Income by Mortgage Status in San Carlos I
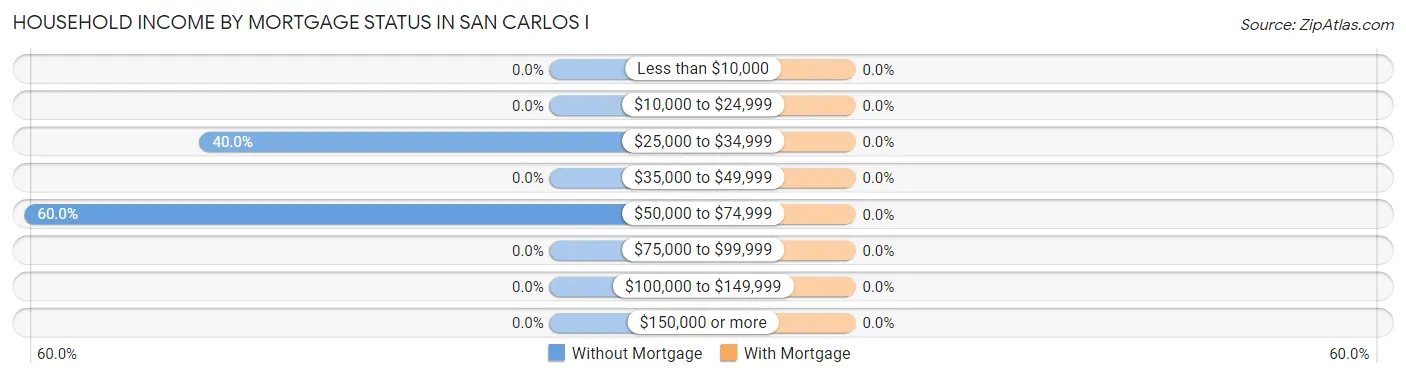
| Household Income | Without Mortgage | With Mortgage |
| Less than $10,000 | 0 (0.0%) | 0 (0.0%) |
| $10,000 to $24,999 | 0 (0.0%) | 0 (0.0%) |
| $25,000 to $34,999 | 12 (40.0%) | 0 (0.0%) |
| $35,000 to $49,999 | 0 (0.0%) | 0 (0.0%) |
| $50,000 to $74,999 | 18 (60.0%) | 0 (0.0%) |
| $75,000 to $99,999 | 0 (0.0%) | 0 (0.0%) |
| $100,000 to $149,999 | 0 (0.0%) | 0 (0.0%) |
| $150,000 or more | 0 (0.0%) | 0 (0.0%) |
| Total | 30 (100.0%) | 0 (0.0%) |
Property Value to Household Income Ratio in San Carlos I
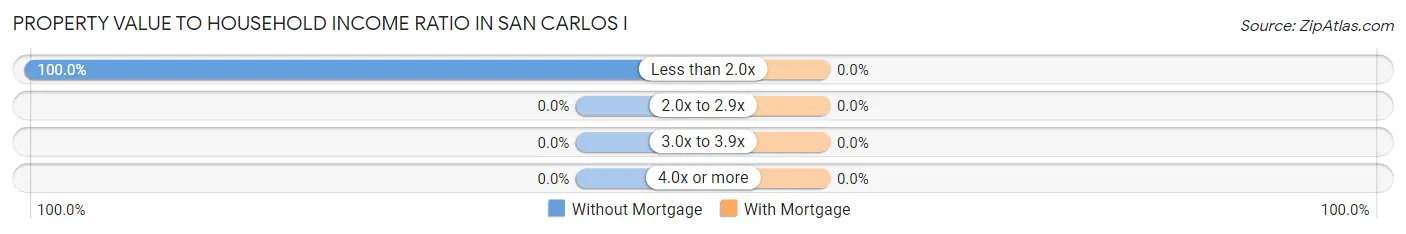
| Value-to-Income Ratio | Without Mortgage | With Mortgage |
| Less than 2.0x | 30 (100.0%) | 0 (0.0%) |
| 2.0x to 2.9x | 0 (0.0%) | 0 (0.0%) |
| 3.0x to 3.9x | 0 (0.0%) | 0 (0.0%) |
| 4.0x or more | 0 (0.0%) | 0 (0.0%) |
| Total | 30 (100.0%) | 0 (0.0%) |
Real Estate Taxes by Mortgage Status in San Carlos I
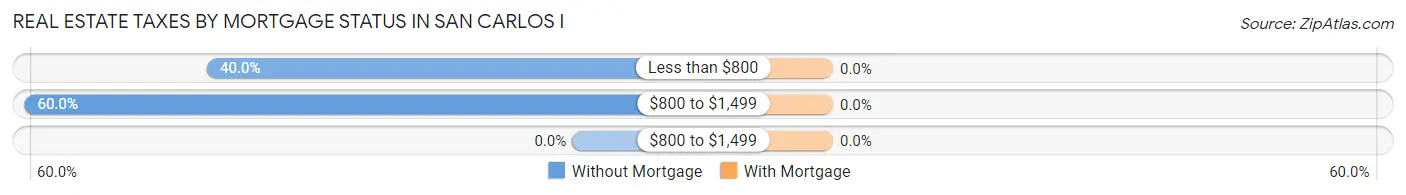
| Property Taxes | Without Mortgage | With Mortgage |
| Less than $800 | 12 (40.0%) | 0 (0.0%) |
| $800 to $1,499 | 18 (60.0%) | 0 (0.0%) |
| $800 to $1,499 | 0 (0.0%) | 0 (0.0%) |
| Total | 30 (100.0%) | 0 (0.0%) |
Health & Disability in San Carlos I
Health Insurance Coverage by Age in San Carlos I
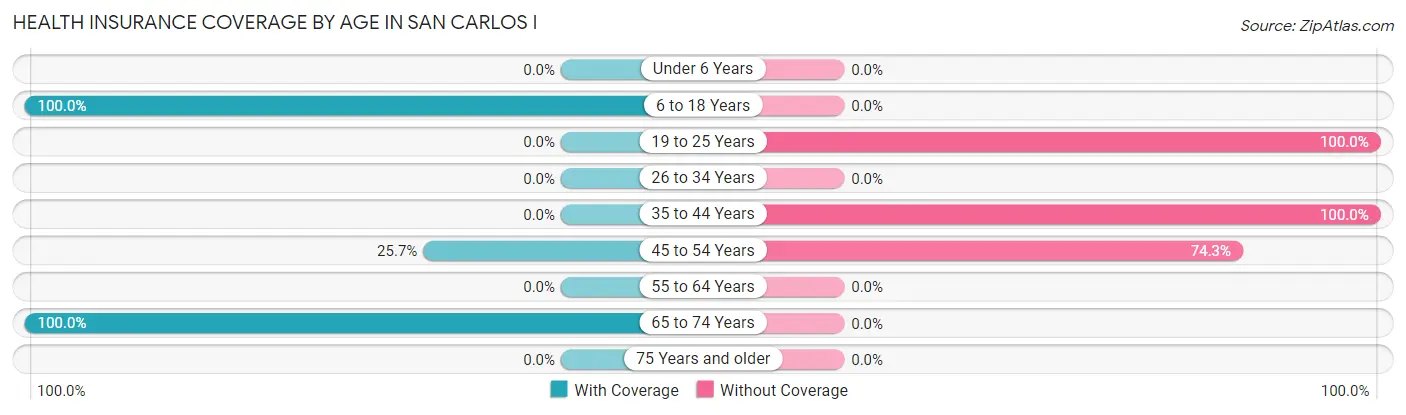
| Age Bracket | With Coverage | Without Coverage |
| Under 6 Years | 0 (0.0%) | 0 (0.0%) |
| 6 to 18 Years | 85 (100.0%) | 0 (0.0%) |
| 19 to 25 Years | 0 (0.0%) | 14 (100.0%) |
| 26 to 34 Years | 0 (0.0%) | 0 (0.0%) |
| 35 to 44 Years | 0 (0.0%) | 24 (100.0%) |
| 45 to 54 Years | 19 (25.7%) | 55 (74.3%) |
| 55 to 64 Years | 0 (0.0%) | 0 (0.0%) |
| 65 to 74 Years | 36 (100.0%) | 0 (0.0%) |
| 75 Years and older | 0 (0.0%) | 0 (0.0%) |
| Total | 140 (60.1%) | 93 (39.9%) |
Health Insurance Coverage by Citizenship Status in San Carlos I
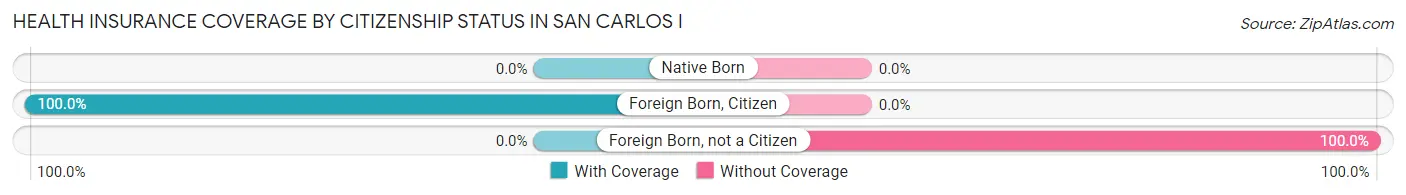
| Citizenship Status | With Coverage | Without Coverage |
| Native Born | 0 (0.0%) | 0 (0.0%) |
| Foreign Born, Citizen | 85 (100.0%) | 0 (0.0%) |
| Foreign Born, not a Citizen | 0 (0.0%) | 14 (100.0%) |
Health Insurance Coverage by Household Income in San Carlos I
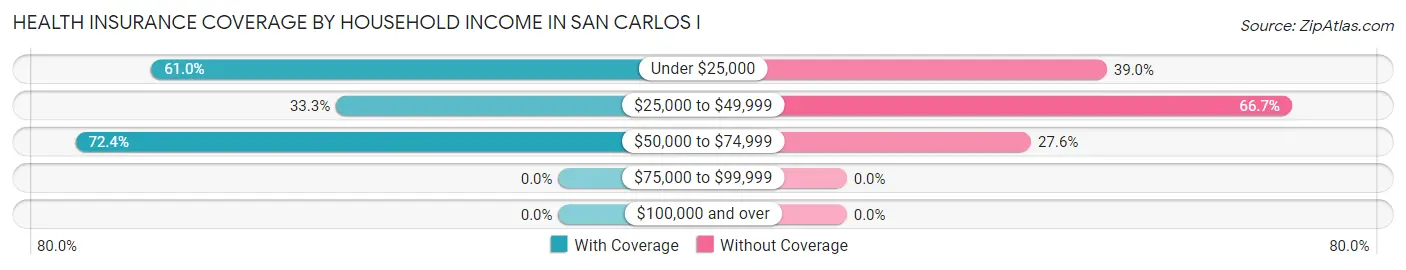
| Household Income | With Coverage | Without Coverage |
| Under $25,000 | 72 (61.0%) | 46 (39.0%) |
| $25,000 to $49,999 | 13 (33.3%) | 26 (66.7%) |
| $50,000 to $74,999 | 55 (72.4%) | 21 (27.6%) |
| $75,000 to $99,999 | 0 (0.0%) | 0 (0.0%) |
| $100,000 and over | 0 (0.0%) | 0 (0.0%) |
Public vs Private Health Insurance Coverage by Age in San Carlos I
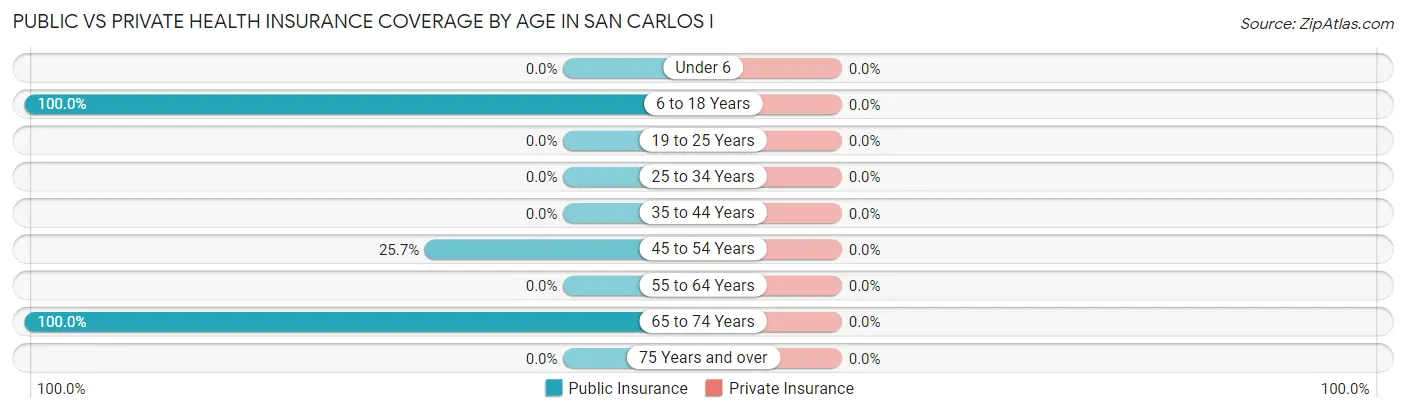
| Age Bracket | Public Insurance | Private Insurance |
| Under 6 | 0 (0.0%) | 0 (0.0%) |
| 6 to 18 Years | 85 (100.0%) | 0 (0.0%) |
| 19 to 25 Years | 0 (0.0%) | 0 (0.0%) |
| 25 to 34 Years | 0 (0.0%) | 0 (0.0%) |
| 35 to 44 Years | 0 (0.0%) | 0 (0.0%) |
| 45 to 54 Years | 19 (25.7%) | 0 (0.0%) |
| 55 to 64 Years | 0 (0.0%) | 0 (0.0%) |
| 65 to 74 Years | 36 (100.0%) | 0 (0.0%) |
| 75 Years and over | 0 (0.0%) | 0 (0.0%) |
| Total | 140 (60.1%) | 0 (0.0%) |
Disability Status by Sex by Age in San Carlos I
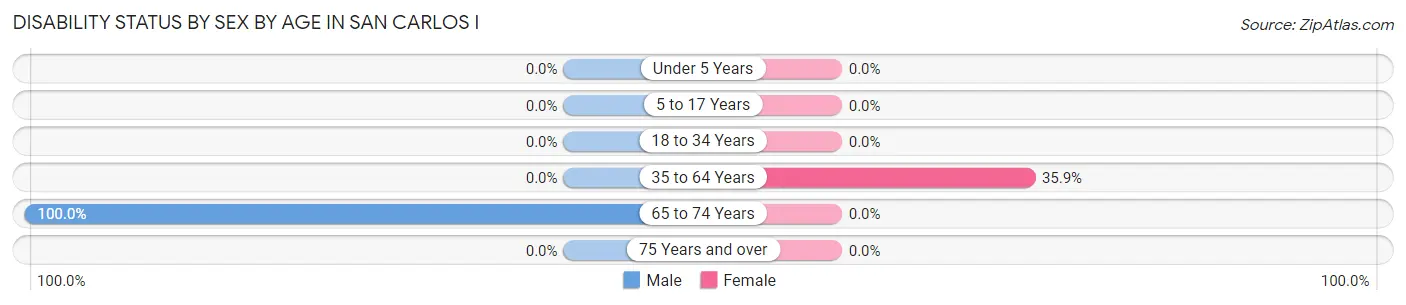
| Age Bracket | Male | Female |
| Under 5 Years | 0 (0.0%) | 0 (0.0%) |
| 5 to 17 Years | 0 (0.0%) | 0 (0.0%) |
| 18 to 34 Years | 0 (0.0%) | 0 (0.0%) |
| 35 to 64 Years | 0 (0.0%) | 19 (35.8%) |
| 65 to 74 Years | 18 (100.0%) | 0 (0.0%) |
| 75 Years and over | 0 (0.0%) | 0 (0.0%) |
Disability Class by Sex by Age in San Carlos I
Disability Class: Hearing Difficulty
| Age Bracket | Male | Female |
| Under 5 Years | 0 (0.0%) | 0 (0.0%) |
| 5 to 17 Years | 0 (0.0%) | 0 (0.0%) |
| 18 to 34 Years | 0 (0.0%) | 0 (0.0%) |
| 35 to 64 Years | 0 (0.0%) | 0 (0.0%) |
| 65 to 74 Years | 0 (0.0%) | 0 (0.0%) |
| 75 Years and over | 0 (0.0%) | 0 (0.0%) |
Disability Class: Vision Difficulty
| Age Bracket | Male | Female |
| Under 5 Years | 0 (0.0%) | 0 (0.0%) |
| 5 to 17 Years | 0 (0.0%) | 0 (0.0%) |
| 18 to 34 Years | 0 (0.0%) | 0 (0.0%) |
| 35 to 64 Years | 0 (0.0%) | 0 (0.0%) |
| 65 to 74 Years | 18 (100.0%) | 0 (0.0%) |
| 75 Years and over | 0 (0.0%) | 0 (0.0%) |
Disability Class: Cognitive Difficulty
| Age Bracket | Male | Female |
| 5 to 17 Years | 0 (0.0%) | 0 (0.0%) |
| 18 to 34 Years | 0 (0.0%) | 0 (0.0%) |
| 35 to 64 Years | 0 (0.0%) | 19 (35.8%) |
| 65 to 74 Years | 0 (0.0%) | 0 (0.0%) |
| 75 Years and over | 0 (0.0%) | 0 (0.0%) |
Disability Class: Ambulatory Difficulty
| Age Bracket | Male | Female |
| 5 to 17 Years | 0 (0.0%) | 0 (0.0%) |
| 18 to 34 Years | 0 (0.0%) | 0 (0.0%) |
| 35 to 64 Years | 0 (0.0%) | 19 (35.8%) |
| 65 to 74 Years | 18 (100.0%) | 0 (0.0%) |
| 75 Years and over | 0 (0.0%) | 0 (0.0%) |
Disability Class: Self-Care Difficulty
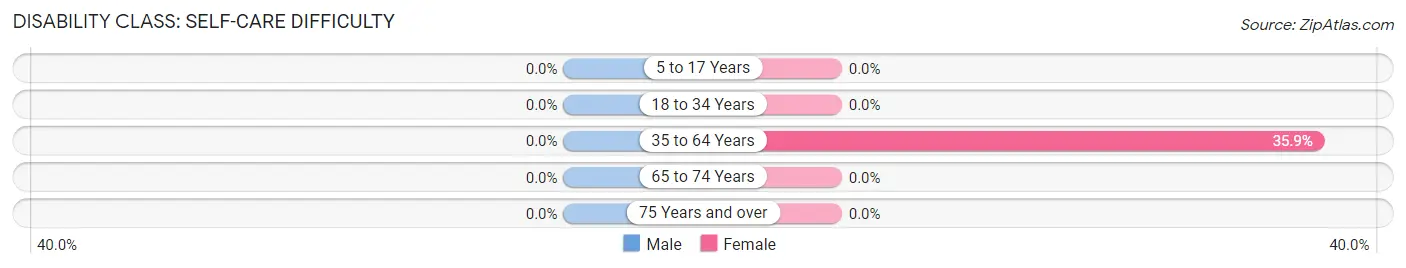
| Age Bracket | Male | Female |
| 5 to 17 Years | 0 (0.0%) | 0 (0.0%) |
| 18 to 34 Years | 0 (0.0%) | 0 (0.0%) |
| 35 to 64 Years | 0 (0.0%) | 19 (35.8%) |
| 65 to 74 Years | 0 (0.0%) | 0 (0.0%) |
| 75 Years and over | 0 (0.0%) | 0 (0.0%) |
Technology Access in San Carlos I
Computing Device Access in San Carlos I
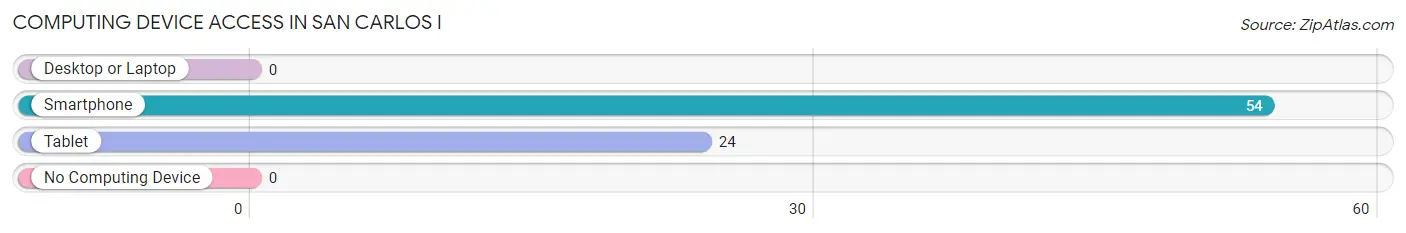
| Device Type | # Households | % Households |
| Desktop or Laptop | 0 | 0.0% |
| Smartphone | 54 | 100.0% |
| Tablet | 24 | 44.4% |
| No Computing Device | 0 | 0.0% |
| Total | 54 | 100.0% |
Internet Access in San Carlos I
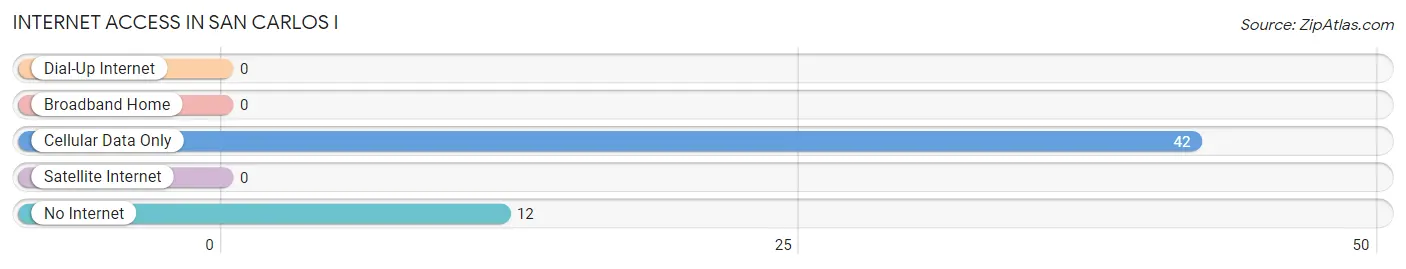
| Internet Type | # Households | % Households |
| Dial-Up Internet | 0 | 0.0% |
| Broadband Home | 0 | 0.0% |
| Cellular Data Only | 42 | 77.8% |
| Satellite Internet | 0 | 0.0% |
| No Internet | 12 | 22.2% |
| Total | 54 | 100.0% |
San Carlos I Summary
San Carlos I, Texas is a small town located in the southeastern part of the state. It is situated in the county of San Patricio, and is part of the Corpus Christi Metropolitan Statistical Area. The town has a population of approximately 1,000 people, and is known for its rural charm and friendly atmosphere.
History
San Carlos I, Texas was founded in 1854 by a group of settlers from Mexico. The town was originally called San Carlos de la Paz, and was named after the Mexican town of San Carlos de la Paz. The settlers were attracted to the area due to its fertile soil and abundant water sources. The town quickly grew and became a thriving agricultural center.
In the late 19th century, San Carlos I, Texas was a major stop on the San Antonio and Aransas Pass Railway. The railway connected the town to other parts of Texas, and allowed for the transportation of goods and people. The railway also helped to spur the growth of the town, as it allowed for the easy transportation of goods and people.
In the early 20th century, San Carlos I, Texas was a major center for the oil industry. The town was home to several oil refineries, and the oil industry helped to bring wealth and prosperity to the town. The oil industry also helped to spur the growth of the town, as it allowed for the easy transportation of goods and people.
Geography
San Carlos I, Texas is located in the southeastern part of the state. It is situated in the county of San Patricio, and is part of the Corpus Christi Metropolitan Statistical Area. The town is located on the banks of the San Patricio River, and is surrounded by rolling hills and lush vegetation. The town is located approximately 30 miles from the Gulf of Mexico, and is close to several major cities, including Corpus Christi and San Antonio.
Economy
San Carlos I, Texas is a small town with a population of approximately 1,000 people. The town is primarily a rural community, and the economy is largely based on agriculture. The town is home to several farms, and the main crops grown in the area are cotton, corn, and sorghum. The town is also home to several small businesses, including restaurants, stores, and other services.
Demographics
As of the 2010 census, the population of San Carlos I, Texas was 1,000 people. The racial makeup of the town was 94.7% White, 0.7% African American, 0.3% Native American, 0.3% Asian, 0.1% Pacific Islander, and 3.8% from other races. The median household income in the town was $31,250, and the median family income was $37,500. The per capita income in the town was $14,845.
Conclusion
San Carlos I, Texas is a small town located in the southeastern part of the state. It is situated in the county of San Patricio, and is part of the Corpus Christi Metropolitan Statistical Area. The town has a population of approximately 1,000 people, and is known for its rural charm and friendly atmosphere. The town is primarily a rural community, and the economy is largely based on agriculture. The town is home to several farms, and the main crops grown in the area are cotton, corn, and sorghum. The town is also home to several small businesses, including restaurants, stores, and other services. As of the 2010 census, the population of San Carlos I, Texas was 1,000 people. The racial makeup of the town was 94.7% White, 0.7% African American, 0.3% Native American, 0.3% Asian, 0.1% Pacific Islander, and 3.8% from other races. The median household income in the town was $31,250, and the median family income was $37,500. The per capita income in the town was $14,845.
Common Questions
What is Per Capita Income in San Carlos I?
Per Capita income in San Carlos I is $9,023.
What is Inequality or Gini Index in San Carlos I?
Inequality or Gini Index in San Carlos I is 0.23.
What is the Total Population of San Carlos I?
Total Population of San Carlos I is 233.
What is the Total Male Population of San Carlos I?
Total Male Population of San Carlos I is 136.
What is the Total Female Population of San Carlos I?
Total Female Population of San Carlos I is 97.
What is the Ratio of Males per 100 Females in San Carlos I?
There are 140.21 Males per 100 Females in San Carlos I.
What is the Ratio of Females per 100 Males in San Carlos I?
There are 71.32 Females per 100 Males in San Carlos I.
What is the Median Population Age in San Carlos I?
Median Population Age in San Carlos I is 44.7 Years.
What is the Average Family Size in San Carlos I
Average Family Size in San Carlos I is 3.9 People.
What is the Average Household Size in San Carlos I
Average Household Size in San Carlos I is 4.3 People.
How Large is the Labor Force in San Carlos I?
There are 119 People in the Labor Forcein in San Carlos I.
What is the Percentage of People in the Labor Force in San Carlos I?
60.7% of People are in the Labor Force in San Carlos I.