Zip Codes with the Highest Percentage of Population Employed in Administrative & Support Services in Waxahachie, TX
RELATED REPORTS & OPTIONS
Administrative & Support Services
Waxahachie
Compare Zip Codes
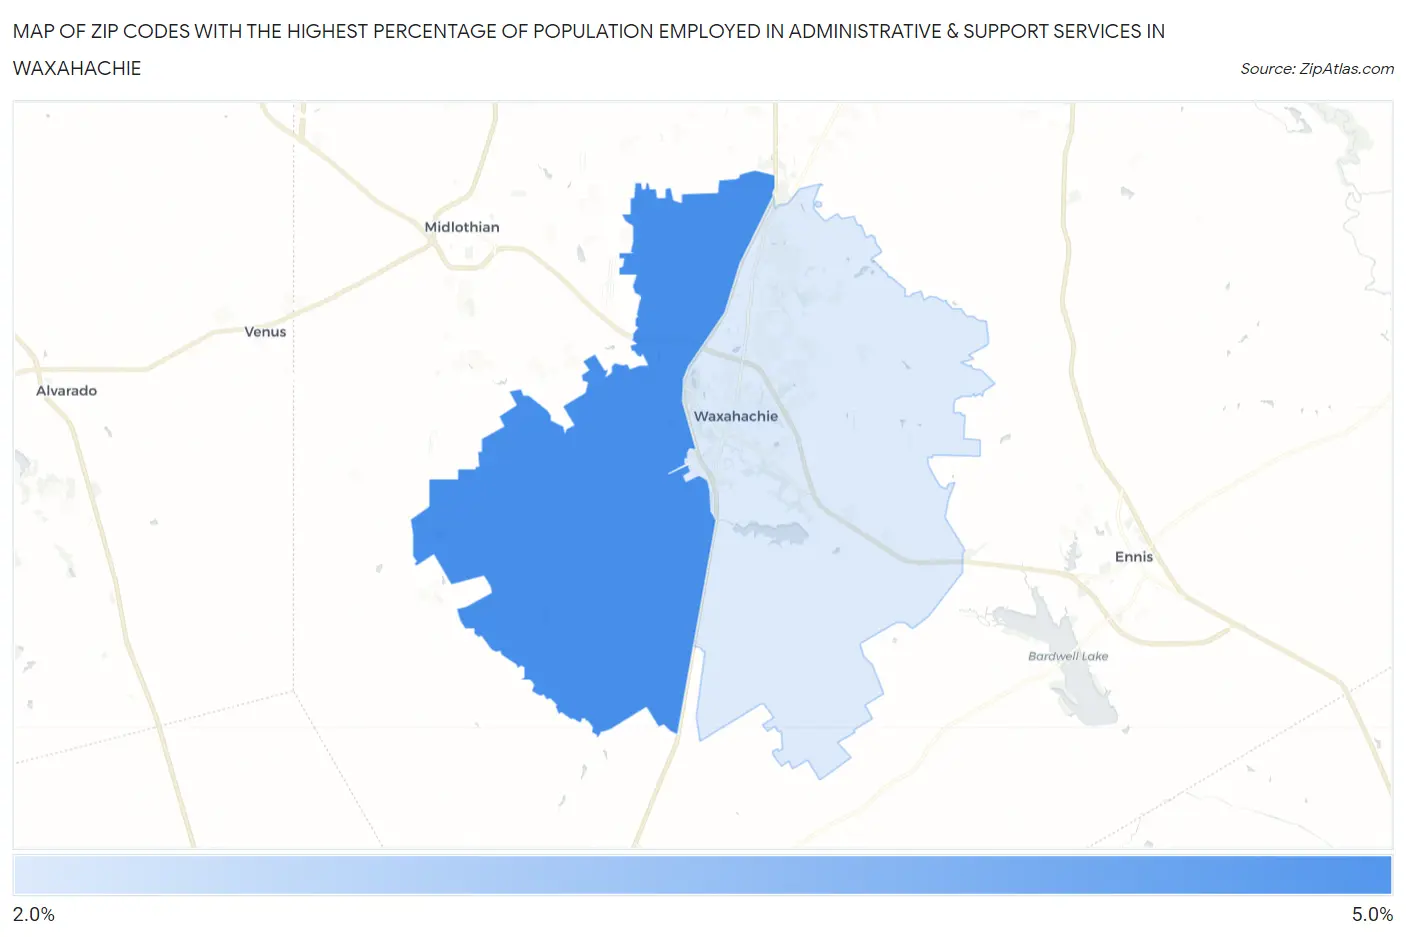
Map of Zip Codes with the Highest Percentage of Population Employed in Administrative & Support Services in Waxahachie
2.3%
4.7%
Zip Codes with the Highest Percentage of Population Employed in Administrative & Support Services in Waxahachie, TX
| Zip Code | % Employed | vs State | vs National | |
| 1. | 75167 | 4.7% | 4.4%(+0.316)#581 | 4.1%(+0.583)#7,930 |
| 2. | 75165 | 2.3% | 4.4%(-2.13)#1,209 | 4.1%(-1.86)#19,249 |
1
Common Questions
What are the Top Zip Codes with the Highest Percentage of Population Employed in Administrative & Support Services in Waxahachie, TX?
Top Zip Codes with the Highest Percentage of Population Employed in Administrative & Support Services in Waxahachie, TX are:
What zip code has the Highest Percentage of Population Employed in Administrative & Support Services in Waxahachie, TX?
75167 has the Highest Percentage of Population Employed in Administrative & Support Services in Waxahachie, TX with 4.7%.
What is the Percentage of Population Employed in Administrative & Support Services in Waxahachie, TX?
Percentage of Population Employed in Administrative & Support Services in Waxahachie is 2.5%.
What is the Percentage of Population Employed in Administrative & Support Services in Texas?
Percentage of Population Employed in Administrative & Support Services in Texas is 4.4%.
What is the Percentage of Population Employed in Administrative & Support Services in the United States?
Percentage of Population Employed in Administrative & Support Services in the United States is 4.1%.