Zip Codes with the Highest Percentage of Population Employed in Administrative & Support Services in Arlington, TX
RELATED REPORTS & OPTIONS
Administrative & Support Services
Arlington
Compare Zip Codes
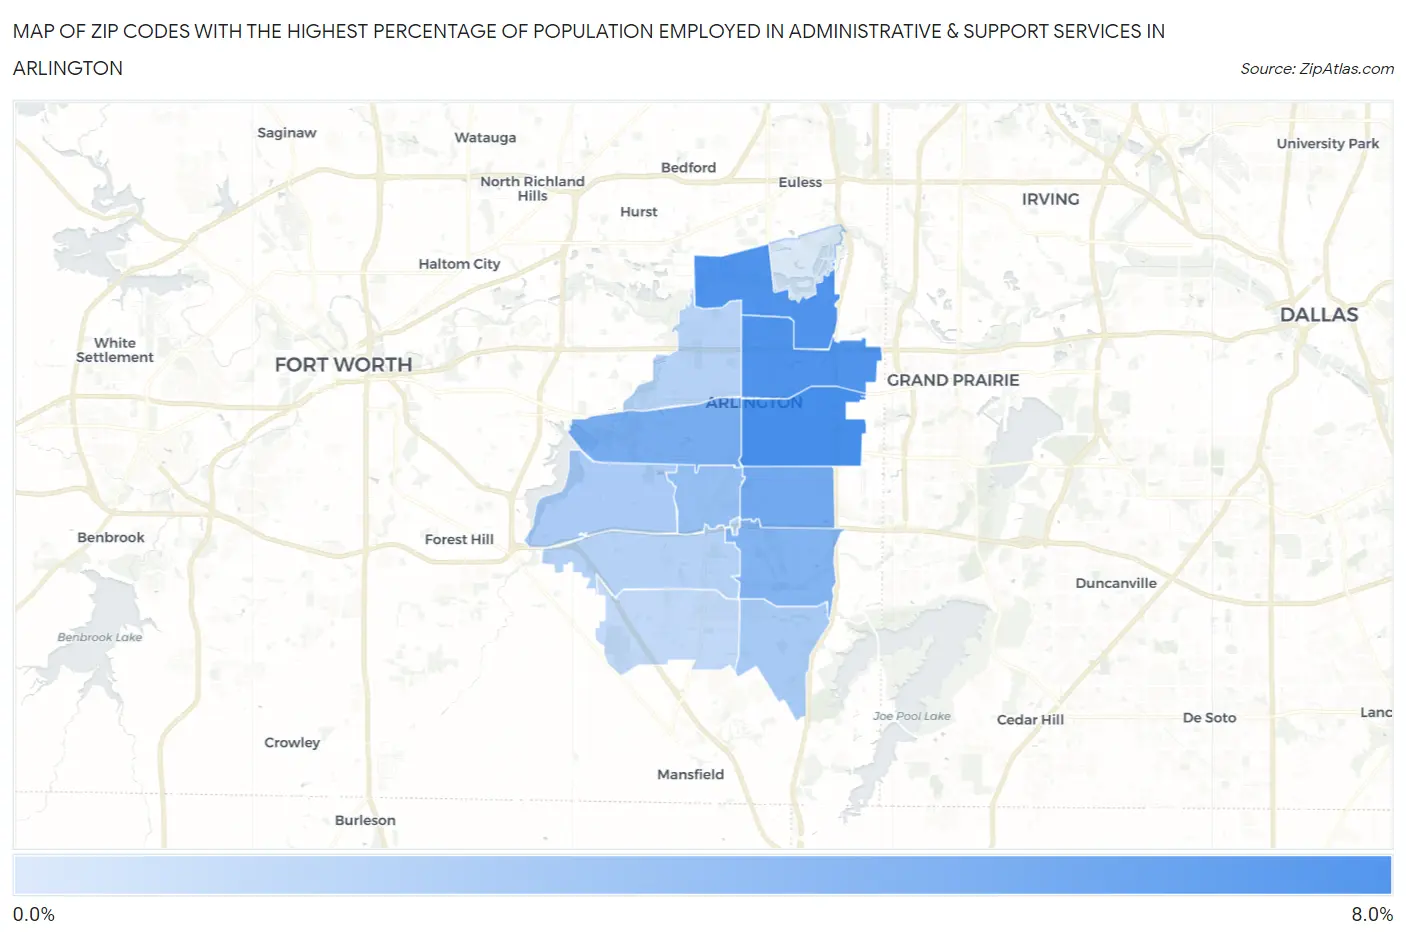
Map of Zip Codes with the Highest Percentage of Population Employed in Administrative & Support Services in Arlington
0.82%
7.3%
Zip Codes with the Highest Percentage of Population Employed in Administrative & Support Services in Arlington, TX
| Zip Code | % Employed | vs State | vs National | |
| 1. | 76010 | 7.3% | 4.4%(+2.91)#204 | 4.1%(+3.18)#2,860 |
| 2. | 76011 | 7.0% | 4.4%(+2.61)#227 | 4.1%(+2.87)#3,190 |
| 3. | 76006 | 6.9% | 4.4%(+2.52)#236 | 4.1%(+2.78)#3,305 |
| 4. | 76014 | 5.4% | 4.4%(+0.991)#442 | 4.1%(+1.26)#6,055 |
| 5. | 76013 | 5.2% | 4.4%(+0.734)#492 | 4.1%(+1.00)#6,709 |
| 6. | 76018 | 4.7% | 4.4%(+0.261)#595 | 4.1%(+0.527)#8,103 |
| 7. | 76015 | 3.8% | 4.4%(-0.582)#784 | 4.1%(-0.316)#11,379 |
| 8. | 76002 | 3.0% | 4.4%(-1.38)#1,022 | 4.1%(-1.11)#15,276 |
| 9. | 76016 | 3.0% | 4.4%(-1.45)#1,047 | 4.1%(-1.18)#15,631 |
| 10. | 76017 | 2.5% | 4.4%(-1.91)#1,161 | 4.1%(-1.64)#18,092 |
| 11. | 76012 | 2.5% | 4.4%(-1.93)#1,165 | 4.1%(-1.66)#18,194 |
| 12. | 76001 | 2.0% | 4.4%(-2.38)#1,269 | 4.1%(-2.11)#20,444 |
| 13. | 76005 | 0.82% | 4.4%(-3.60)#1,482 | 4.1%(-3.33)#25,065 |
1
Common Questions
What are the Top 10 Zip Codes with the Highest Percentage of Population Employed in Administrative & Support Services in Arlington, TX?
Top 10 Zip Codes with the Highest Percentage of Population Employed in Administrative & Support Services in Arlington, TX are:
What zip code has the Highest Percentage of Population Employed in Administrative & Support Services in Arlington, TX?
76010 has the Highest Percentage of Population Employed in Administrative & Support Services in Arlington, TX with 7.3%.
What is the Percentage of Population Employed in Administrative & Support Services in Arlington, TX?
Percentage of Population Employed in Administrative & Support Services in Arlington is 4.5%.
What is the Percentage of Population Employed in Administrative & Support Services in Texas?
Percentage of Population Employed in Administrative & Support Services in Texas is 4.4%.
What is the Percentage of Population Employed in Administrative & Support Services in the United States?
Percentage of Population Employed in Administrative & Support Services in the United States is 4.1%.