Zip Codes with the Highest Percentage of Population Employed in Administrative & Support Services in Pasadena, TX
RELATED REPORTS & OPTIONS
Administrative & Support Services
Pasadena
Compare Zip Codes
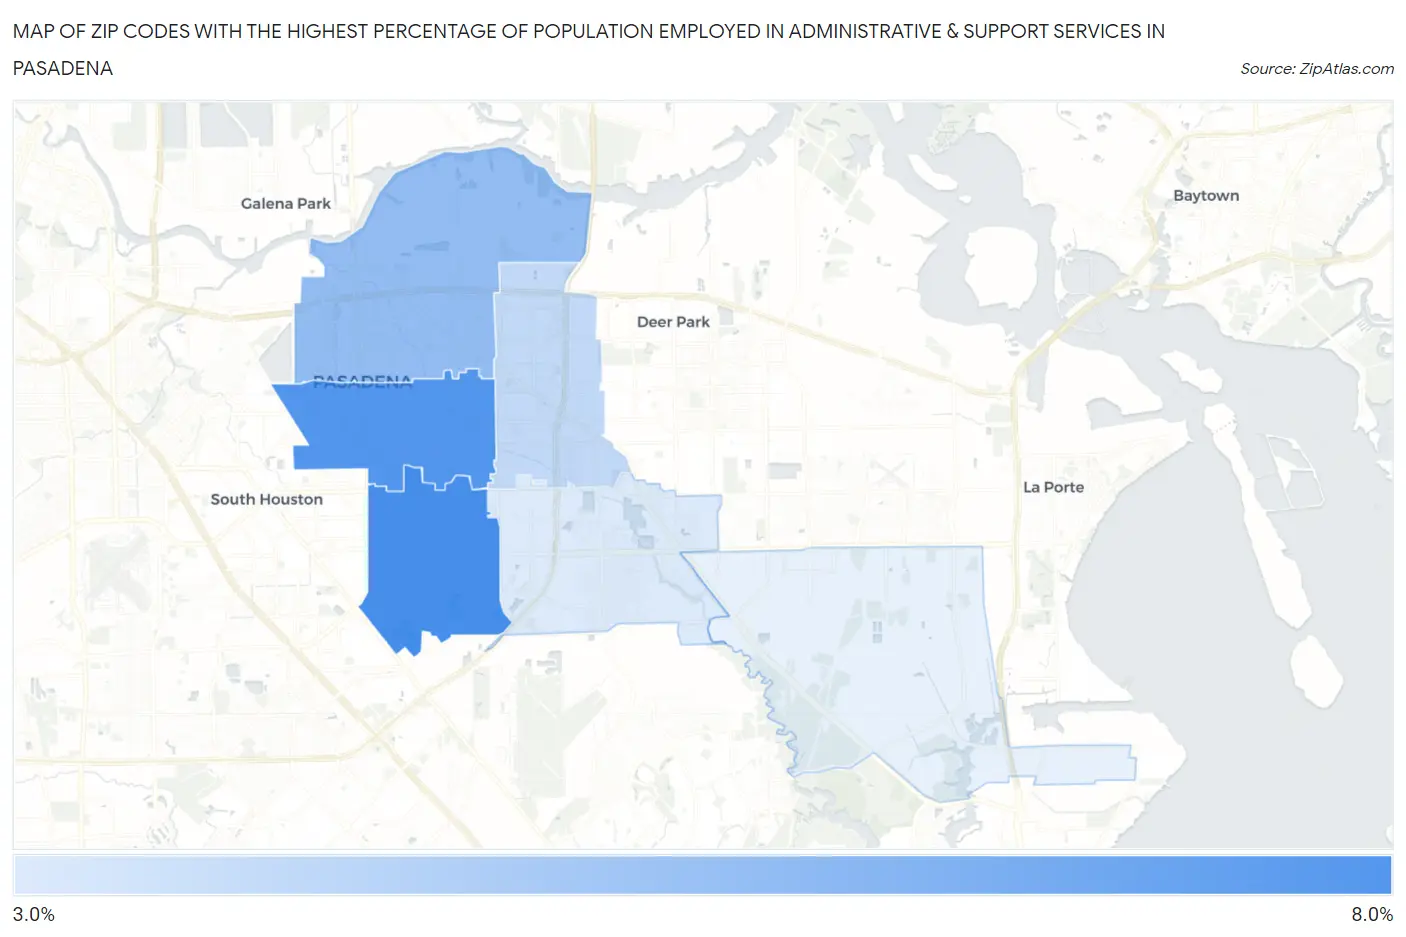
Map of Zip Codes with the Highest Percentage of Population Employed in Administrative & Support Services in Pasadena
3.6%
6.9%
Zip Codes with the Highest Percentage of Population Employed in Administrative & Support Services in Pasadena, TX
| Zip Code | % Employed | vs State | vs National | |
| 1. | 77504 | 6.9% | 4.4%(+2.49)#238 | 4.1%(+2.75)#3,338 |
| 2. | 77502 | 6.6% | 4.4%(+2.23)#273 | 4.1%(+2.49)#3,709 |
| 3. | 77506 | 5.2% | 4.4%(+0.794)#486 | 4.1%(+1.06)#6,577 |
| 4. | 77503 | 4.2% | 4.4%(-0.229)#698 | 4.1%(+0.038)#9,882 |
| 5. | 77505 | 3.6% | 4.4%(-0.831)#855 | 4.1%(-0.565)#12,544 |
1
Common Questions
What are the Top 5 Zip Codes with the Highest Percentage of Population Employed in Administrative & Support Services in Pasadena, TX?
Top 5 Zip Codes with the Highest Percentage of Population Employed in Administrative & Support Services in Pasadena, TX are:
What zip code has the Highest Percentage of Population Employed in Administrative & Support Services in Pasadena, TX?
77504 has the Highest Percentage of Population Employed in Administrative & Support Services in Pasadena, TX with 6.9%.
What is the Percentage of Population Employed in Administrative & Support Services in Pasadena, TX?
Percentage of Population Employed in Administrative & Support Services in Pasadena is 5.1%.
What is the Percentage of Population Employed in Administrative & Support Services in Texas?
Percentage of Population Employed in Administrative & Support Services in Texas is 4.4%.
What is the Percentage of Population Employed in Administrative & Support Services in the United States?
Percentage of Population Employed in Administrative & Support Services in the United States is 4.1%.