Zip Codes with the Highest Percentage of Population Employed in Administrative & Support Services in Mcallen, TX
RELATED REPORTS & OPTIONS
Administrative & Support Services
Mcallen
Compare Zip Codes
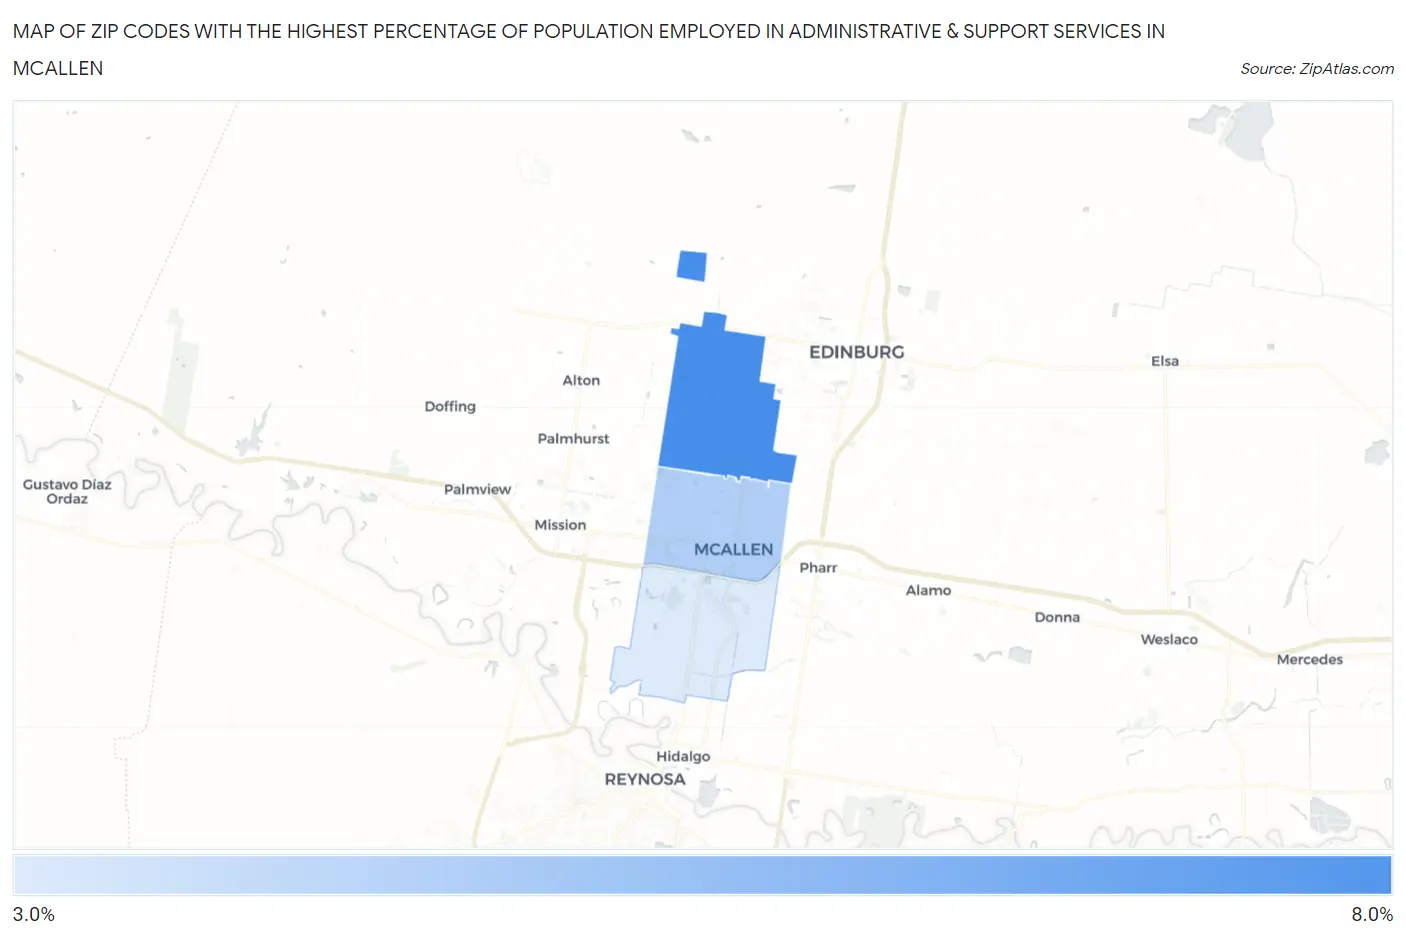
Map of Zip Codes with the Highest Percentage of Population Employed in Administrative & Support Services in Mcallen
3.3%
6.7%
Zip Codes with the Highest Percentage of Population Employed in Administrative & Support Services in Mcallen, TX
| Zip Code | % Employed | vs State | vs National | |
| 1. | 78504 | 6.7% | 4.4%(+2.26)#270 | 4.1%(+2.52)#3,667 |
| 2. | 78501 | 4.2% | 4.4%(-0.176)#682 | 4.1%(+0.091)#9,660 |
| 3. | 78503 | 3.3% | 4.4%(-1.14)#939 | 4.1%(-0.869)#14,046 |
1
Common Questions
What are the Top Zip Codes with the Highest Percentage of Population Employed in Administrative & Support Services in Mcallen, TX?
Top Zip Codes with the Highest Percentage of Population Employed in Administrative & Support Services in Mcallen, TX are:
What zip code has the Highest Percentage of Population Employed in Administrative & Support Services in Mcallen, TX?
78504 has the Highest Percentage of Population Employed in Administrative & Support Services in Mcallen, TX with 6.7%.
What is the Percentage of Population Employed in Administrative & Support Services in Mcallen, TX?
Percentage of Population Employed in Administrative & Support Services in Mcallen is 5.1%.
What is the Percentage of Population Employed in Administrative & Support Services in Texas?
Percentage of Population Employed in Administrative & Support Services in Texas is 4.4%.
What is the Percentage of Population Employed in Administrative & Support Services in the United States?
Percentage of Population Employed in Administrative & Support Services in the United States is 4.1%.