San Felipe, TX Map & Demographics
San Felipe Map
San Felipe Overview
$26,794
PER CAPITA INCOME
$54,250
AVG FAMILY INCOME
$54,013
AVG HOUSEHOLD INCOME
79.4%
WAGE / INCOME GAP [ % ]
20.6¢/ $1
WAGE / INCOME GAP [ $ ]
0.44
INEQUALITY / GINI INDEX
1,039
TOTAL POPULATION
541
MALE POPULATION
498
FEMALE POPULATION
108.63
MALES / 100 FEMALES
92.05
FEMALES / 100 MALES
33.1
MEDIAN AGE
2.9
AVG FAMILY SIZE
2.6
AVG HOUSEHOLD SIZE
416
LABOR FORCE [ PEOPLE ]
60.3%
PERCENT IN LABOR FORCE
3.8%
UNEMPLOYMENT RATE
San Felipe Zip Codes
San Felipe Area Codes
Income in San Felipe
Income Overview in San Felipe
Per Capita Income in San Felipe is $26,794, while median incomes of families and households are $54,250 and $54,013 respectively.
| Characteristic | Number | Measure |
| Per Capita Income | 1,039 | $26,794 |
| Median Family Income | 322 | $54,250 |
| Mean Family Income | 322 | $74,919 |
| Median Household Income | 397 | $54,013 |
| Mean Household Income | 397 | $71,018 |
| Income Deficit | 322 | $0 |
| Wage / Income Gap (%) | 1,039 | 79.43% |
| Wage / Income Gap ($) | 1,039 | 20.57¢ per $1 |
| Gini / Inequality Index | 1,039 | 0.44 |
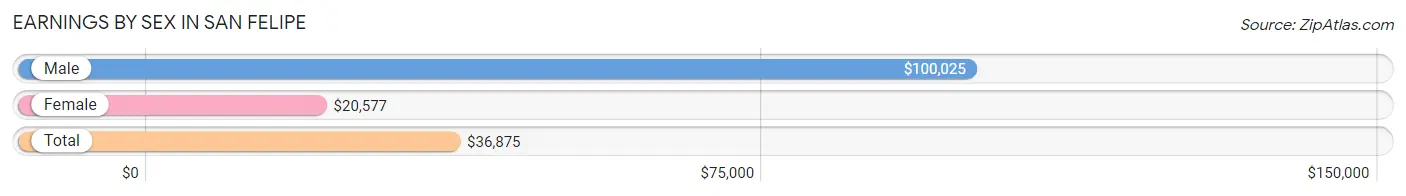
Earnings by Sex in San Felipe
Average Earnings in San Felipe are $36,875, $100,025 for men and $20,577 for women, a difference of 79.4%.
| Sex | Number | Average Earnings |
| Male | 225 (53.2%) | $100,025 |
| Female | 198 (46.8%) | $20,577 |
| Total | 423 (100.0%) | $36,875 |
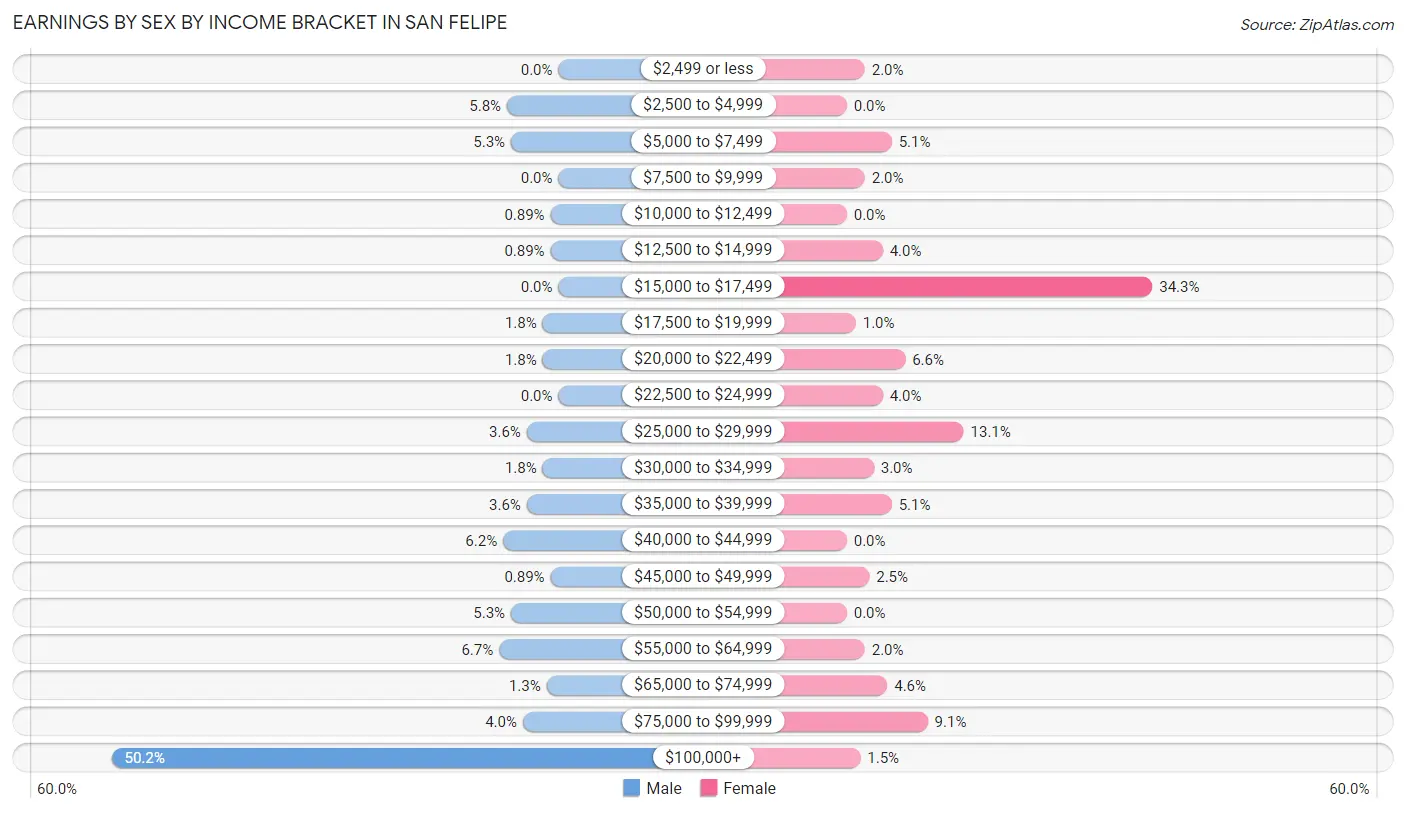
Earnings by Sex by Income Bracket in San Felipe
The most common earnings brackets in San Felipe are $100,000+ for men (113 | 50.2%) and $15,000 to $17,499 for women (68 | 34.3%).
| Income | Male | Female |
| $2,499 or less | 0 (0.0%) | 4 (2.0%) |
| $2,500 to $4,999 | 13 (5.8%) | 0 (0.0%) |
| $5,000 to $7,499 | 12 (5.3%) | 10 (5.1%) |
| $7,500 to $9,999 | 0 (0.0%) | 4 (2.0%) |
| $10,000 to $12,499 | 2 (0.9%) | 0 (0.0%) |
| $12,500 to $14,999 | 2 (0.9%) | 8 (4.0%) |
| $15,000 to $17,499 | 0 (0.0%) | 68 (34.3%) |
| $17,500 to $19,999 | 4 (1.8%) | 2 (1.0%) |
| $20,000 to $22,499 | 4 (1.8%) | 13 (6.6%) |
| $22,500 to $24,999 | 0 (0.0%) | 8 (4.0%) |
| $25,000 to $29,999 | 8 (3.6%) | 26 (13.1%) |
| $30,000 to $34,999 | 4 (1.8%) | 6 (3.0%) |
| $35,000 to $39,999 | 8 (3.6%) | 10 (5.1%) |
| $40,000 to $44,999 | 14 (6.2%) | 0 (0.0%) |
| $45,000 to $49,999 | 2 (0.9%) | 5 (2.5%) |
| $50,000 to $54,999 | 12 (5.3%) | 0 (0.0%) |
| $55,000 to $64,999 | 15 (6.7%) | 4 (2.0%) |
| $65,000 to $74,999 | 3 (1.3%) | 9 (4.5%) |
| $75,000 to $99,999 | 9 (4.0%) | 18 (9.1%) |
| $100,000+ | 113 (50.2%) | 3 (1.5%) |
| Total | 225 (100.0%) | 198 (100.0%) |
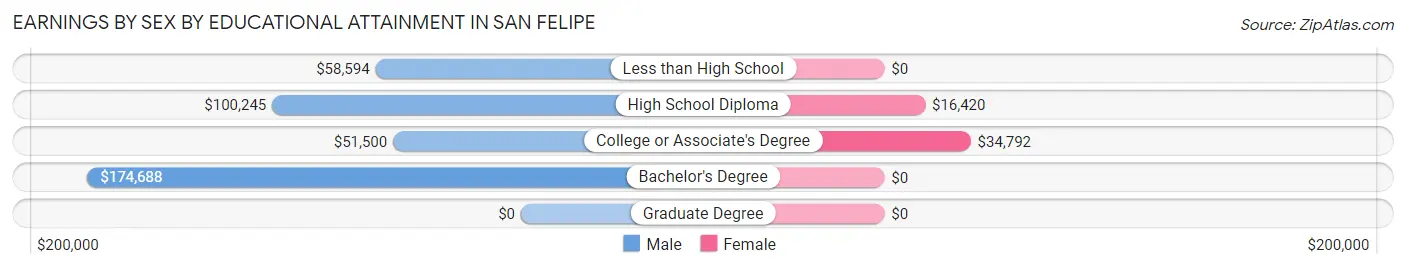
Earnings by Sex by Educational Attainment in San Felipe
| Educational Attainment | Male Income | Female Income |
| Less than High School | $58,594 | $0 |
| High School Diploma | $100,245 | $16,420 |
| College or Associate's Degree | $51,500 | $34,792 |
| Bachelor's Degree | $174,688 | $0 |
| Graduate Degree | - | - |
| Total | $100,074 | $0 |
Family Income in San Felipe
Family Income Brackets in San Felipe
According to the San Felipe family income data, there are 97 families falling into the $100,000 to $149,999 income range, which is the most common income bracket and makes up 30.1% of all families.
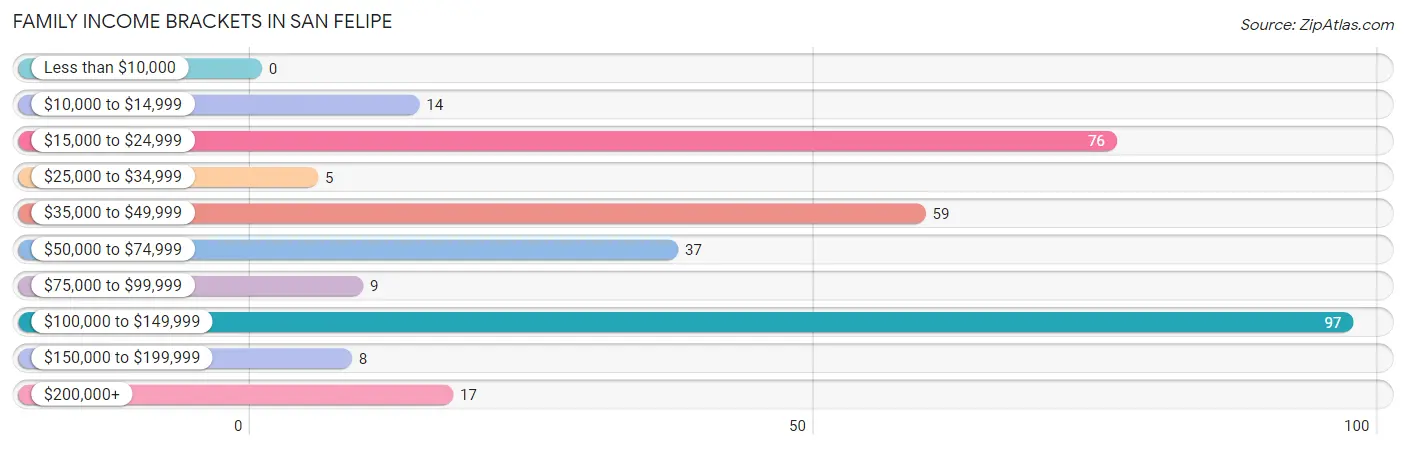
| Income Bracket | # Families | % Families |
| Less than $10,000 | 0 | 0.0% |
| $10,000 to $14,999 | 14 | 4.3% |
| $15,000 to $24,999 | 76 | 23.6% |
| $25,000 to $34,999 | 5 | 1.6% |
| $35,000 to $49,999 | 59 | 18.3% |
| $50,000 to $74,999 | 37 | 11.5% |
| $75,000 to $99,999 | 9 | 2.8% |
| $100,000 to $149,999 | 97 | 30.1% |
| $150,000 to $199,999 | 8 | 2.5% |
| $200,000+ | 17 | 5.3% |
Family Income by Famaliy Size in San Felipe
3-person families (128 | 39.8%) account for the highest median family income in San Felipe with $100,294 per family, while 3-person families (128 | 39.8%) have the highest median income of $33,431 per family member.
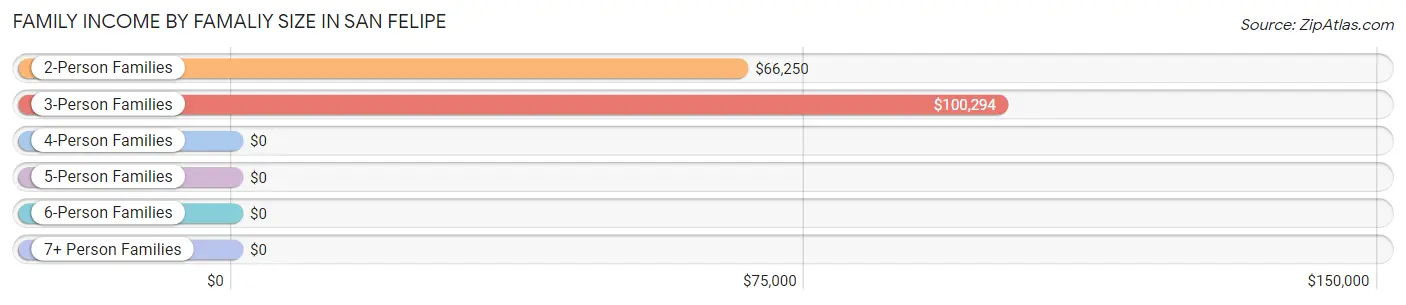
| Income Bracket | # Families | Median Income |
| 2-Person Families | 70 (21.7%) | $66,250 |
| 3-Person Families | 128 (39.8%) | $100,294 |
| 4-Person Families | 105 (32.6%) | $0 |
| 5-Person Families | 9 (2.8%) | $0 |
| 6-Person Families | 7 (2.2%) | $0 |
| 7+ Person Families | 3 (0.9%) | $0 |
| Total | 322 (100.0%) | $54,250 |
Family Income by Number of Earners in San Felipe
The median family income in San Felipe is $54,250, with families comprising 3+ earners (10) having the highest median family income of $133,750, while families with no earners (13) have the lowest median family income of $24,821, accounting for 3.1% and 4.0% of families, respectively.
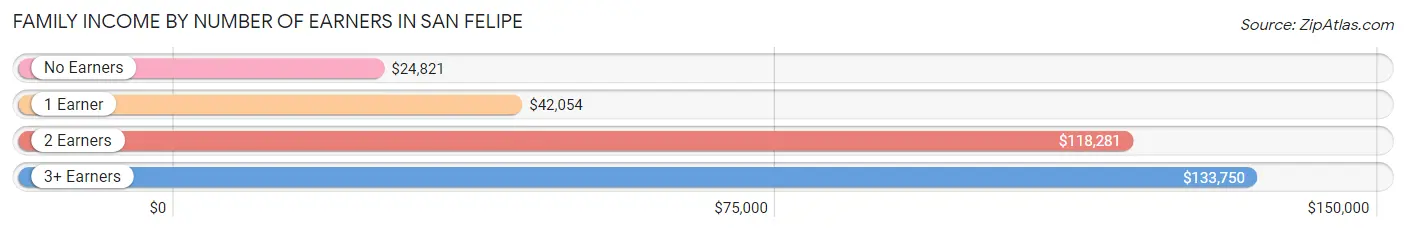
| Number of Earners | # Families | Median Income |
| No Earners | 13 (4.0%) | $24,821 |
| 1 Earner | 231 (71.7%) | $42,054 |
| 2 Earners | 68 (21.1%) | $118,281 |
| 3+ Earners | 10 (3.1%) | $133,750 |
| Total | 322 (100.0%) | $54,250 |
Household Income in San Felipe
Household Income Brackets in San Felipe
With 110 households falling in the category, the $100,000 to $149,999 income range is the most frequent in San Felipe, accounting for 27.7% of all households. In contrast, only 7 households (1.8%) fall into the less than $10,000 income bracket, making it the least populous group.
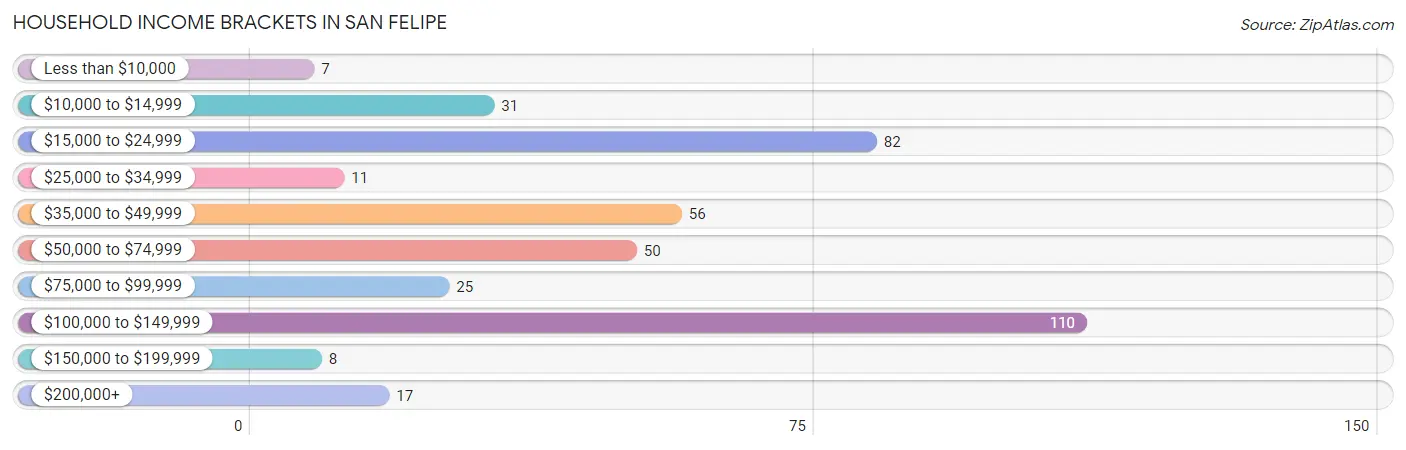
| Income Bracket | # Households | % Households |
| Less than $10,000 | 7 | 1.8% |
| $10,000 to $14,999 | 31 | 7.8% |
| $15,000 to $24,999 | 82 | 20.7% |
| $25,000 to $34,999 | 11 | 2.8% |
| $35,000 to $49,999 | 56 | 14.1% |
| $50,000 to $74,999 | 50 | 12.6% |
| $75,000 to $99,999 | 25 | 6.3% |
| $100,000 to $149,999 | 110 | 27.7% |
| $150,000 to $199,999 | 8 | 2.0% |
| $200,000+ | 17 | 4.3% |
Household Income by Householder Age in San Felipe
The median household income in San Felipe is $54,013, with the highest median household income of $100,613 found in the 25 to 44 years age bracket for the primary householder. A total of 133 households (33.5%) fall into this category.
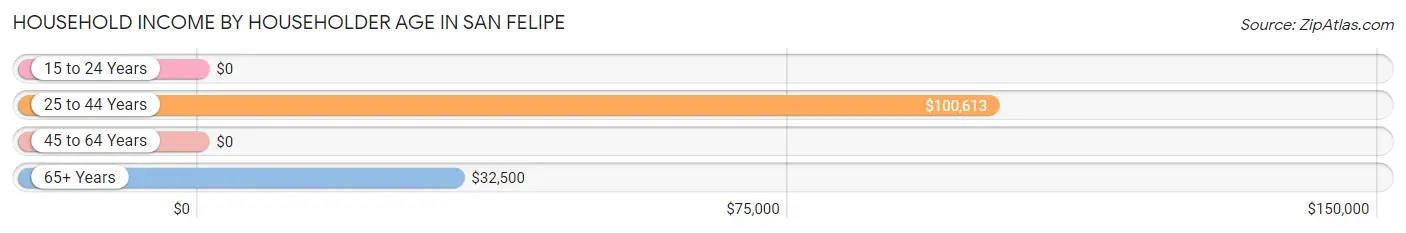
| Income Bracket | # Households | Median Income |
| 15 to 24 Years | 0 (0.0%) | $0 |
| 25 to 44 Years | 133 (33.5%) | $100,613 |
| 45 to 64 Years | 178 (44.8%) | $0 |
| 65+ Years | 86 (21.7%) | $32,500 |
| Total | 397 (100.0%) | $54,013 |
Poverty in San Felipe
Income Below Poverty by Sex and Age in San Felipe
With 19.7% poverty level for males and 25.7% for females among the residents of San Felipe, 12 to 14 year old males and 45 to 54 year old females are the most vulnerable to poverty, with 84 males (75.0%) and 67 females (74.4%) in their respective age groups living below the poverty level.
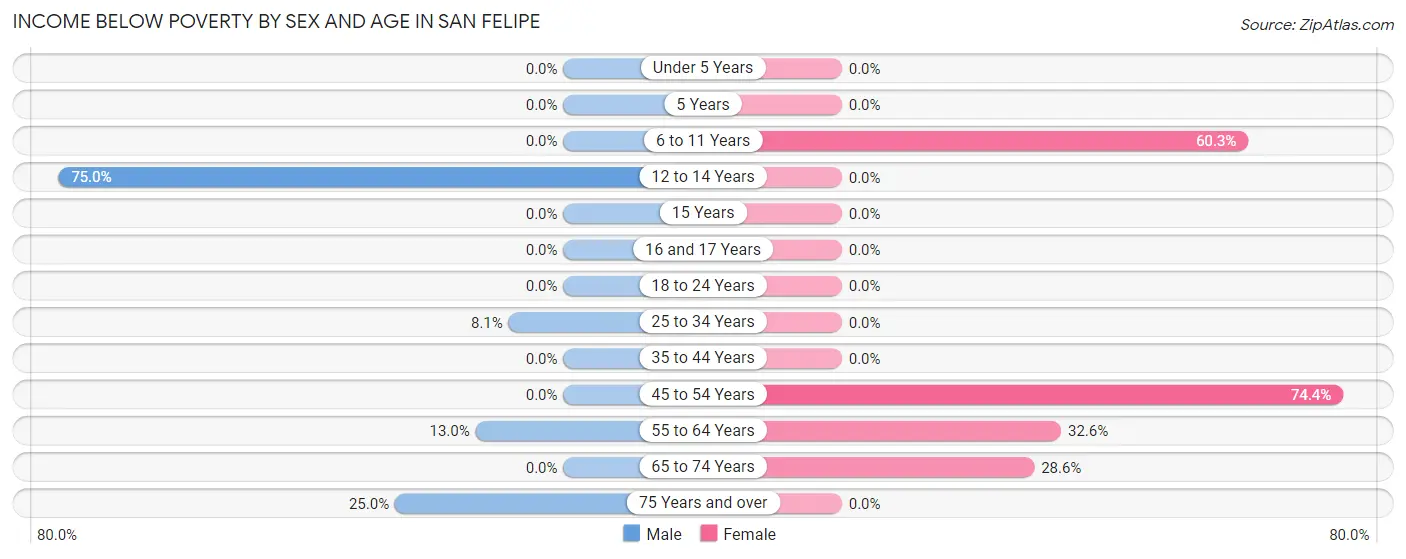
| Age Bracket | Male | Female |
| Under 5 Years | 0 (0.0%) | 0 (0.0%) |
| 5 Years | 0 (0.0%) | 0 (0.0%) |
| 6 to 11 Years | 0 (0.0%) | 35 (60.3%) |
| 12 to 14 Years | 84 (75.0%) | 0 (0.0%) |
| 15 Years | 0 (0.0%) | 0 (0.0%) |
| 16 and 17 Years | 0 (0.0%) | 0 (0.0%) |
| 18 to 24 Years | 0 (0.0%) | 0 (0.0%) |
| 25 to 34 Years | 10 (8.1%) | 0 (0.0%) |
| 35 to 44 Years | 0 (0.0%) | 0 (0.0%) |
| 45 to 54 Years | 0 (0.0%) | 67 (74.4%) |
| 55 to 64 Years | 6 (13.0%) | 14 (32.6%) |
| 65 to 74 Years | 0 (0.0%) | 12 (28.6%) |
| 75 Years and over | 6 (25.0%) | 0 (0.0%) |
| Total | 106 (19.7%) | 128 (25.7%) |
Income Above Poverty by Sex and Age in San Felipe
According to the poverty statistics in San Felipe, males aged under 5 years and females aged under 5 years are the age groups that are most secure financially, with 100.0% of males and 100.0% of females in these age groups living above the poverty line.
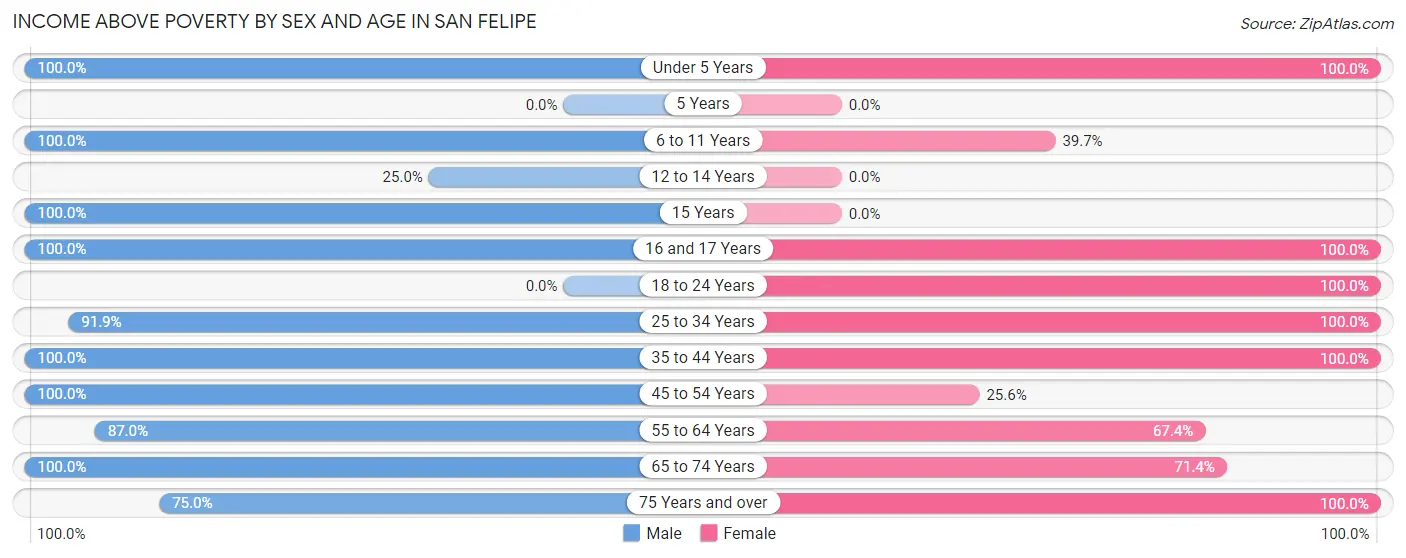
| Age Bracket | Male | Female |
| Under 5 Years | 38 (100.0%) | 66 (100.0%) |
| 5 Years | 0 (0.0%) | 0 (0.0%) |
| 6 to 11 Years | 71 (100.0%) | 23 (39.7%) |
| 12 to 14 Years | 28 (25.0%) | 0 (0.0%) |
| 15 Years | 2 (100.0%) | 0 (0.0%) |
| 16 and 17 Years | 6 (100.0%) | 15 (100.0%) |
| 18 to 24 Years | 0 (0.0%) | 40 (100.0%) |
| 25 to 34 Years | 113 (91.9%) | 68 (100.0%) |
| 35 to 44 Years | 24 (100.0%) | 49 (100.0%) |
| 45 to 54 Years | 56 (100.0%) | 23 (25.6%) |
| 55 to 64 Years | 40 (87.0%) | 29 (67.4%) |
| 65 to 74 Years | 37 (100.0%) | 30 (71.4%) |
| 75 Years and over | 18 (75.0%) | 27 (100.0%) |
| Total | 433 (80.3%) | 370 (74.3%) |
Income Below Poverty Among Married-Couple Families in San Felipe
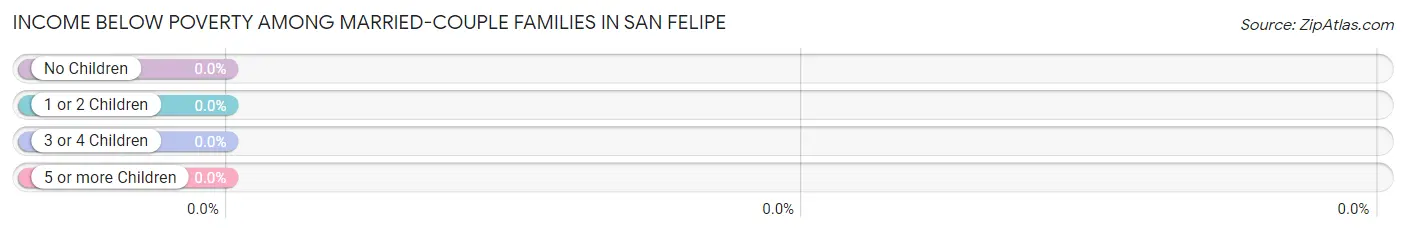
| Children | Above Poverty | Below Poverty |
| No Children | 57 (100.0%) | 0 (0.0%) |
| 1 or 2 Children | 100 (100.0%) | 0 (0.0%) |
| 3 or 4 Children | 19 (100.0%) | 0 (0.0%) |
| 5 or more Children | 0 (0.0%) | 0 (0.0%) |
| Total | 176 (100.0%) | 0 (0.0%) |
Income Below Poverty Among Single-Parent Households in San Felipe
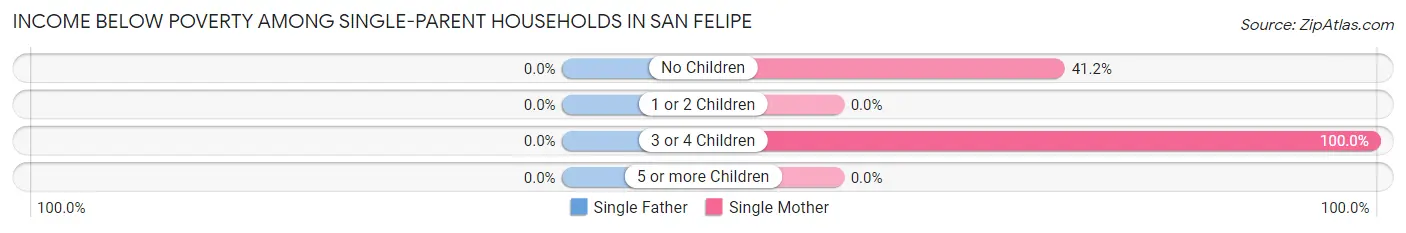
| Children | Single Father | Single Mother |
| No Children | 0 (0.0%) | 14 (41.2%) |
| 1 or 2 Children | 0 (0.0%) | 0 (0.0%) |
| 3 or 4 Children | 0 (0.0%) | 66 (100.0%) |
| 5 or more Children | 0 (0.0%) | 0 (0.0%) |
| Total | 0 (0.0%) | 80 (62.5%) |
Income Below Poverty Among Married-Couple vs Single-Parent Households in San Felipe
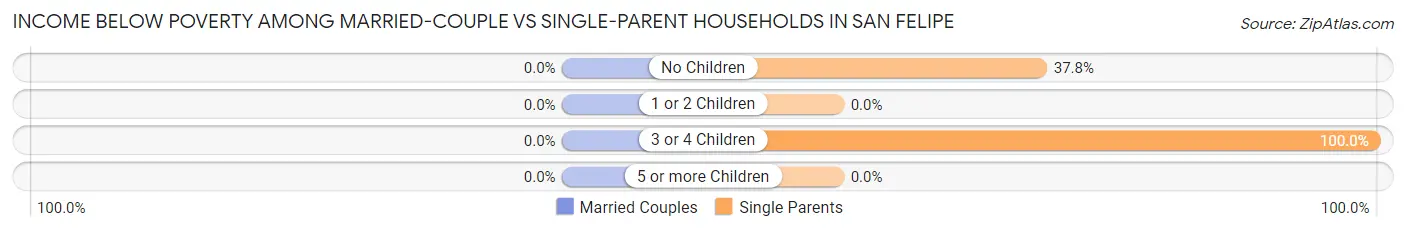
| Children | Married-Couple Families | Single-Parent Households |
| No Children | 0 (0.0%) | 14 (37.8%) |
| 1 or 2 Children | 0 (0.0%) | 0 (0.0%) |
| 3 or 4 Children | 0 (0.0%) | 66 (100.0%) |
| 5 or more Children | 0 (0.0%) | 0 (0.0%) |
| Total | 0 (0.0%) | 80 (54.8%) |
Race in San Felipe
The most populous races in San Felipe are White / Caucasian (467 | 45.0%), Black / African American (376 | 36.2%), and Hispanic or Latino (211 | 20.3%).
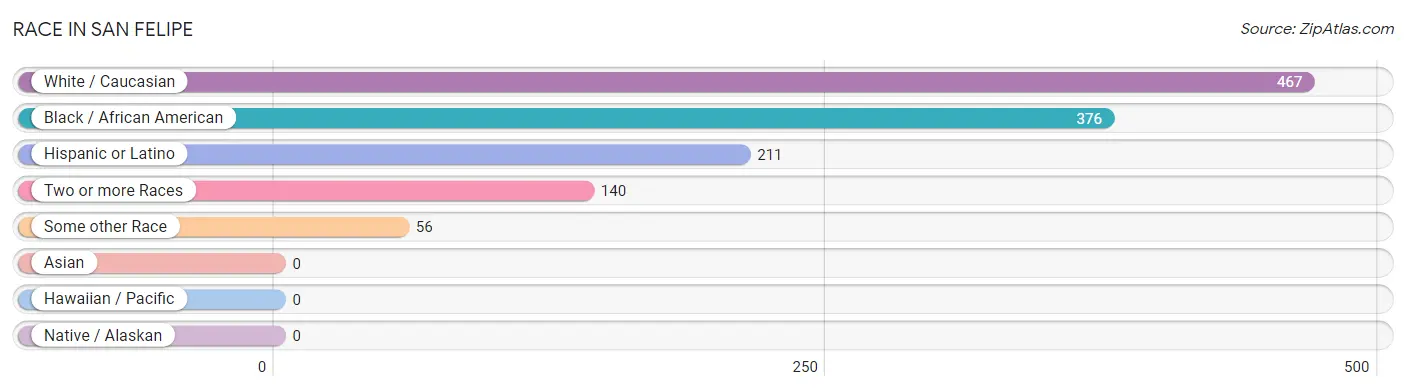
| Race | # Population | % Population |
| Asian | 0 | 0.0% |
| Black / African American | 376 | 36.2% |
| Hawaiian / Pacific | 0 | 0.0% |
| Hispanic or Latino | 211 | 20.3% |
| Native / Alaskan | 0 | 0.0% |
| White / Caucasian | 467 | 45.0% |
| Two or more Races | 140 | 13.5% |
| Some other Race | 56 | 5.4% |
| Total | 1,039 | 100.0% |
Ancestry in San Felipe
The most populous ancestries reported in San Felipe are Mexican (169 | 16.3%), German (120 | 11.6%), English (76 | 7.3%), American (40 | 3.8%), and Scotch-Irish (40 | 3.8%), together accounting for 42.8% of all San Felipe residents.
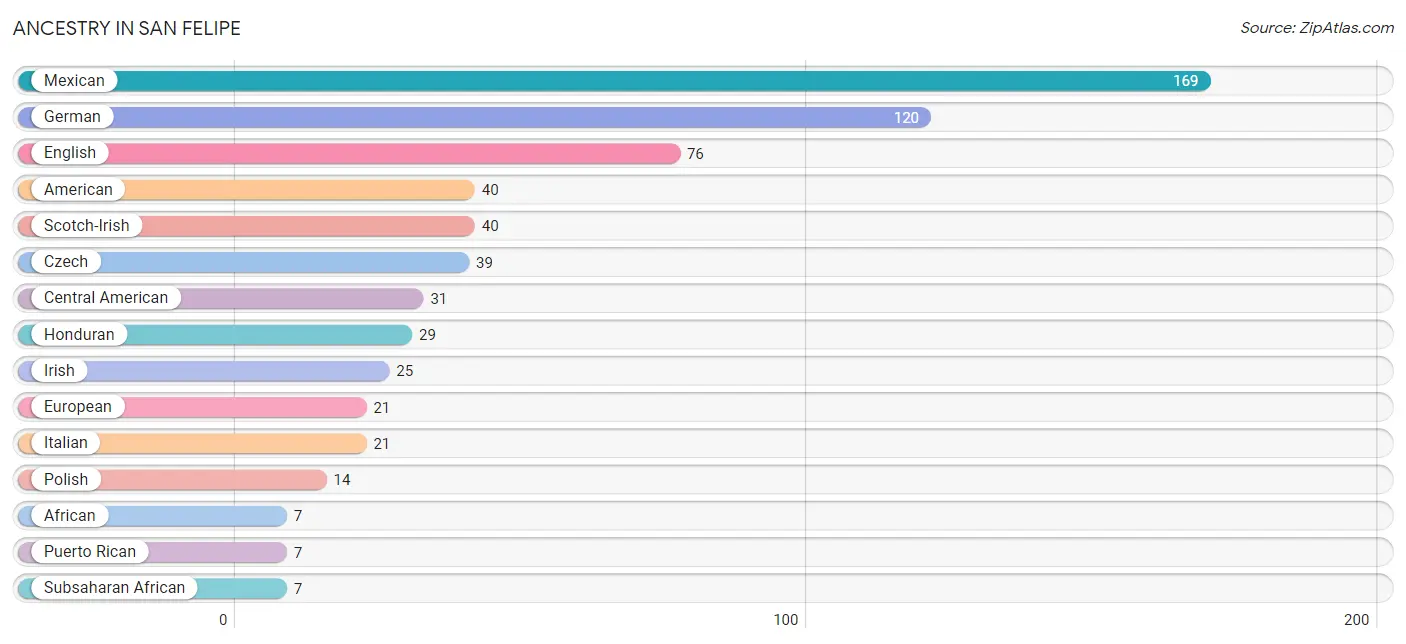
| Ancestry | # Population | % Population |
| African | 7 | 0.7% |
| American | 40 | 3.8% |
| Central American | 31 | 3.0% |
| Cuban | 1 | 0.1% |
| Czech | 39 | 3.7% |
| Dutch | 5 | 0.5% |
| English | 76 | 7.3% |
| European | 21 | 2.0% |
| French | 2 | 0.2% |
| German | 120 | 11.6% |
| Honduran | 29 | 2.8% |
| Irish | 25 | 2.4% |
| Italian | 21 | 2.0% |
| Mexican | 169 | 16.3% |
| Polish | 14 | 1.3% |
| Puerto Rican | 7 | 0.7% |
| Salvadoran | 2 | 0.2% |
| Scotch-Irish | 40 | 3.8% |
| Spaniard | 1 | 0.1% |
| Subsaharan African | 7 | 0.7% | View All 20 Rows |
Immigrants in San Felipe
The most numerous immigrant groups reported in San Felipe came from Latin America (118 | 11.4%), Central America (117 | 11.3%), Mexico (86 | 8.3%), Honduras (29 | 2.8%), and Eastern Europe (13 | 1.3%), together accounting for 34.9% of all San Felipe residents.
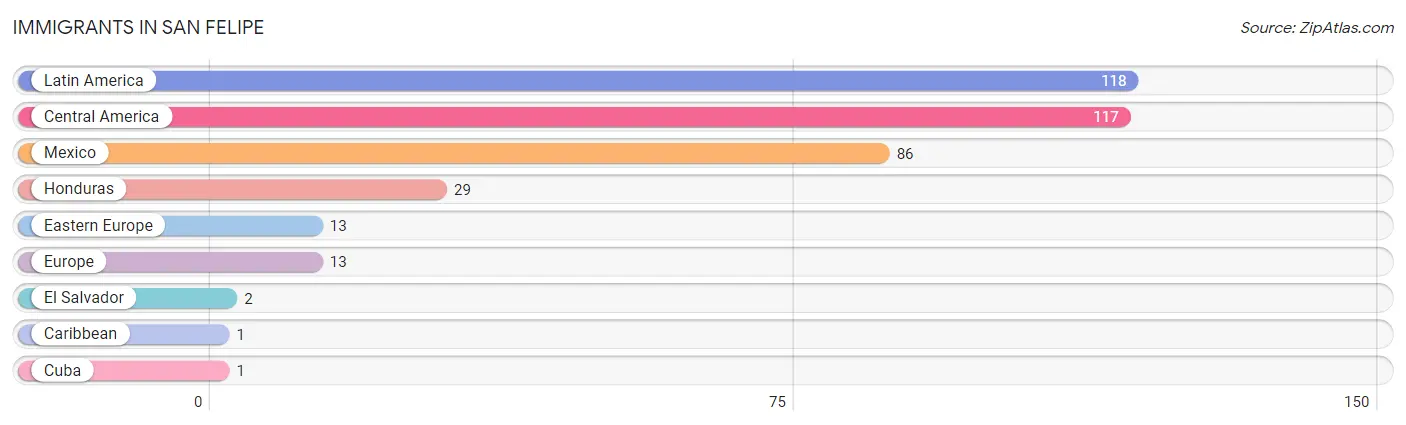
| Immigration Origin | # Population | % Population |
| Caribbean | 1 | 0.1% |
| Central America | 117 | 11.3% |
| Cuba | 1 | 0.1% |
| Eastern Europe | 13 | 1.3% |
| El Salvador | 2 | 0.2% |
| Europe | 13 | 1.3% |
| Honduras | 29 | 2.8% |
| Latin America | 118 | 11.4% |
| Mexico | 86 | 8.3% | View All 9 Rows |
Sex and Age in San Felipe
Sex and Age in San Felipe
The most populous age groups in San Felipe are 10 to 14 Years (124 | 22.9%) for men and 50 to 54 Years (86 | 17.3%) for women.
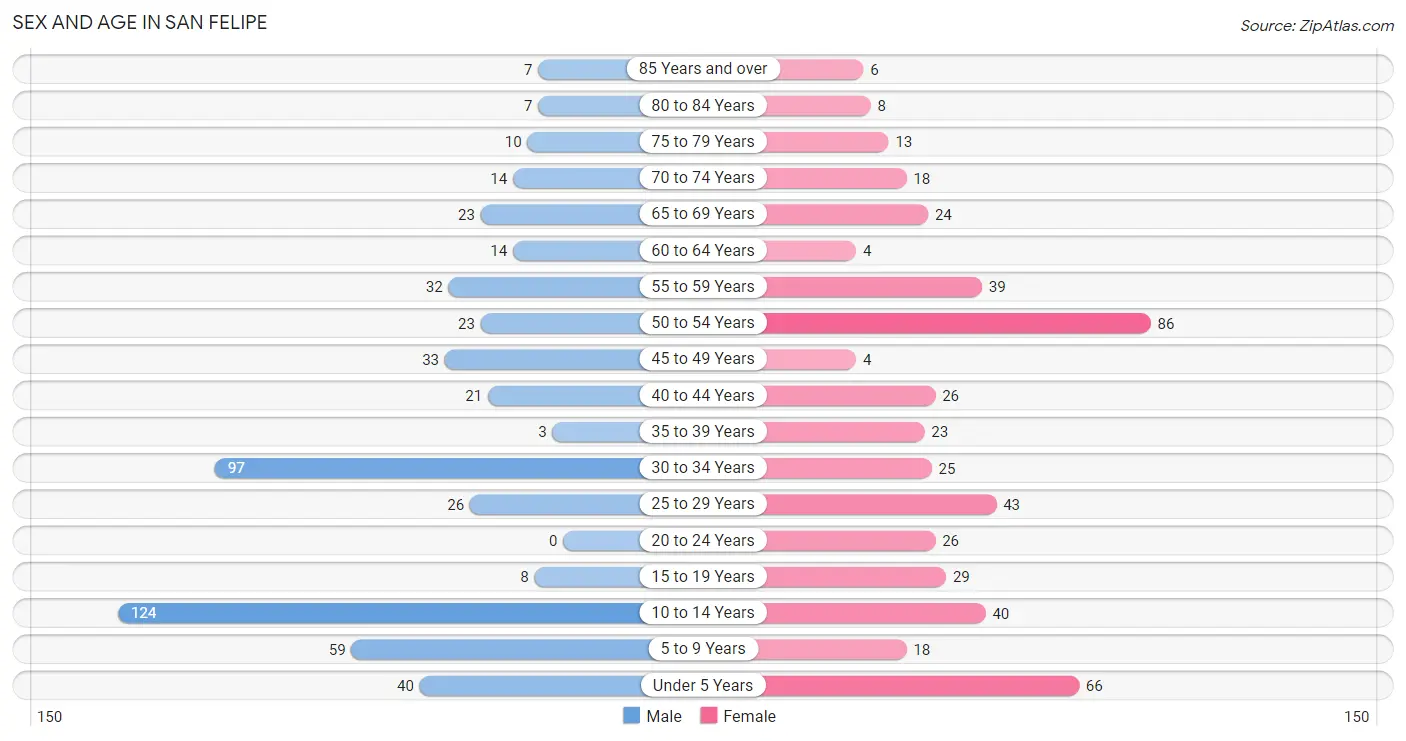
| Age Bracket | Male | Female |
| Under 5 Years | 40 (7.4%) | 66 (13.3%) |
| 5 to 9 Years | 59 (10.9%) | 18 (3.6%) |
| 10 to 14 Years | 124 (22.9%) | 40 (8.0%) |
| 15 to 19 Years | 8 (1.5%) | 29 (5.8%) |
| 20 to 24 Years | 0 (0.0%) | 26 (5.2%) |
| 25 to 29 Years | 26 (4.8%) | 43 (8.6%) |
| 30 to 34 Years | 97 (17.9%) | 25 (5.0%) |
| 35 to 39 Years | 3 (0.5%) | 23 (4.6%) |
| 40 to 44 Years | 21 (3.9%) | 26 (5.2%) |
| 45 to 49 Years | 33 (6.1%) | 4 (0.8%) |
| 50 to 54 Years | 23 (4.3%) | 86 (17.3%) |
| 55 to 59 Years | 32 (5.9%) | 39 (7.8%) |
| 60 to 64 Years | 14 (2.6%) | 4 (0.8%) |
| 65 to 69 Years | 23 (4.3%) | 24 (4.8%) |
| 70 to 74 Years | 14 (2.6%) | 18 (3.6%) |
| 75 to 79 Years | 10 (1.8%) | 13 (2.6%) |
| 80 to 84 Years | 7 (1.3%) | 8 (1.6%) |
| 85 Years and over | 7 (1.3%) | 6 (1.2%) |
| Total | 541 (100.0%) | 498 (100.0%) |
Families and Households in San Felipe
Median Family Size in San Felipe
The median family size in San Felipe is 2.93 persons per family, with single female/mother families (128 | 39.8%) accounting for the largest median family size of 3.07 persons per family. On the other hand, single male/father families (18 | 5.6%) represent the smallest median family size with 2.06 persons per family.
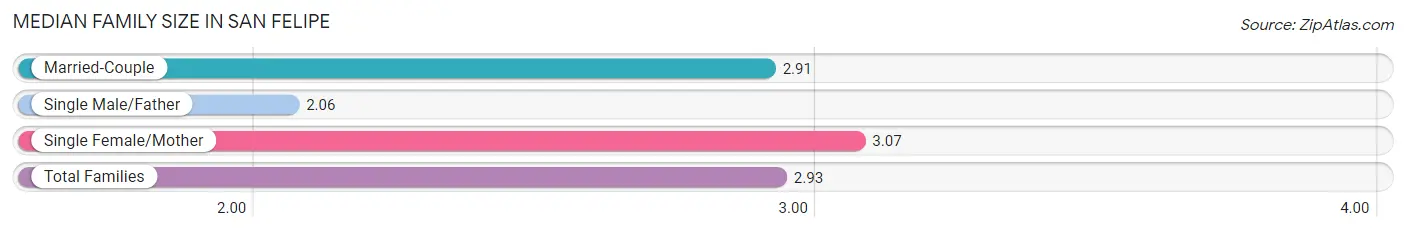
| Family Type | # Families | Family Size |
| Married-Couple | 176 (54.7%) | 2.91 |
| Single Male/Father | 18 (5.6%) | 2.06 |
| Single Female/Mother | 128 (39.8%) | 3.07 |
| Total Families | 322 (100.0%) | 2.93 |
Median Household Size in San Felipe
The median household size in San Felipe is 2.62 persons per household, with single female/mother households (128 | 32.2%) accounting for the largest median household size of 3.16 persons per household. non-family households (75 | 18.9%) represent the smallest median household size with 1.12 persons per household.
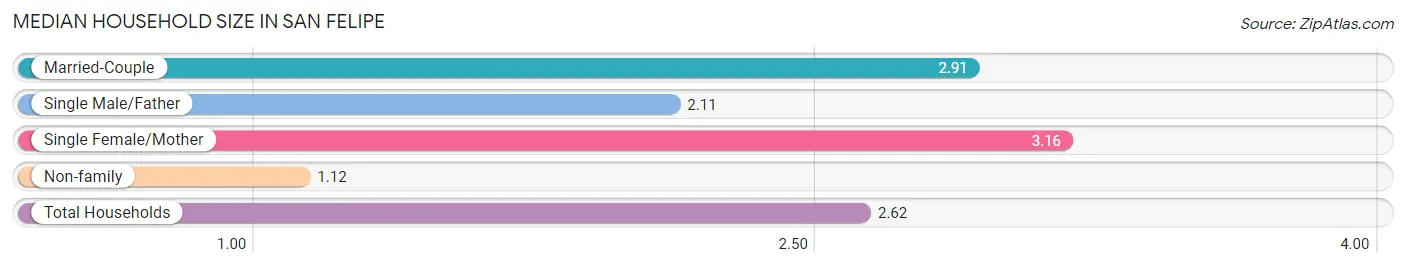
| Household Type | # Households | Household Size |
| Married-Couple | 176 (44.3%) | 2.91 |
| Single Male/Father | 18 (4.5%) | 2.11 |
| Single Female/Mother | 128 (32.2%) | 3.16 |
| Non-family | 75 (18.9%) | 1.12 |
| Total Households | 397 (100.0%) | 2.62 |
Household Size by Marriage Status in San Felipe
Out of a total of 397 households in San Felipe, 322 (81.1%) are family households, while 75 (18.9%) are nonfamily households. The most numerous type of family households are 3-person households, comprising 122, and the most common type of nonfamily households are 1-person households, comprising 66.
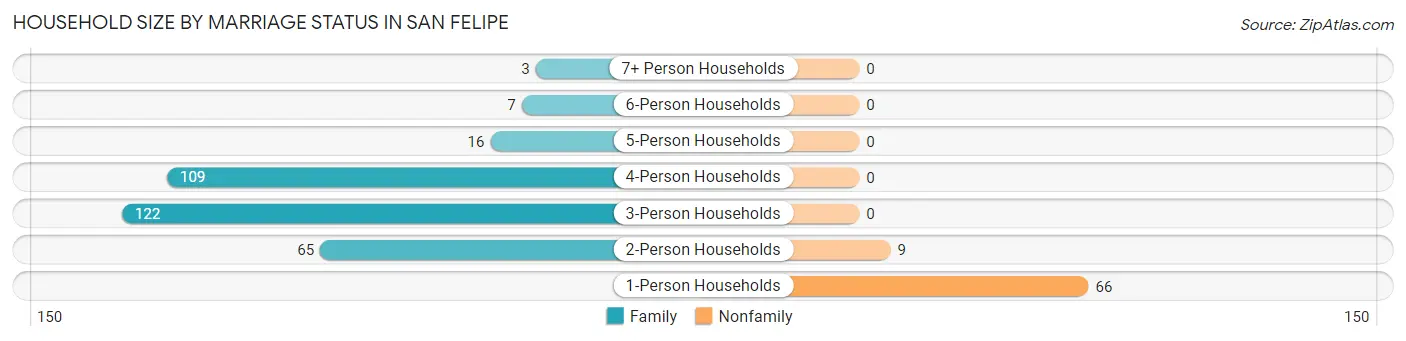
| Household Size | Family Households | Nonfamily Households |
| 1-Person Households | - | 66 (16.6%) |
| 2-Person Households | 65 (16.4%) | 9 (2.3%) |
| 3-Person Households | 122 (30.7%) | 0 (0.0%) |
| 4-Person Households | 109 (27.5%) | 0 (0.0%) |
| 5-Person Households | 16 (4.0%) | 0 (0.0%) |
| 6-Person Households | 7 (1.8%) | 0 (0.0%) |
| 7+ Person Households | 3 (0.8%) | 0 (0.0%) |
| Total | 322 (81.1%) | 75 (18.9%) |
Female Fertility in San Felipe
Fertility by Age in San Felipe
Average fertility rate in San Felipe is 239.0 births per 1,000 women. Women in the age bracket of 20 to 34 years have the highest fertility rate with 479.0 births per 1,000 women. Women in the age bracket of 20 to 34 years acount for 100.0% of all women with births.
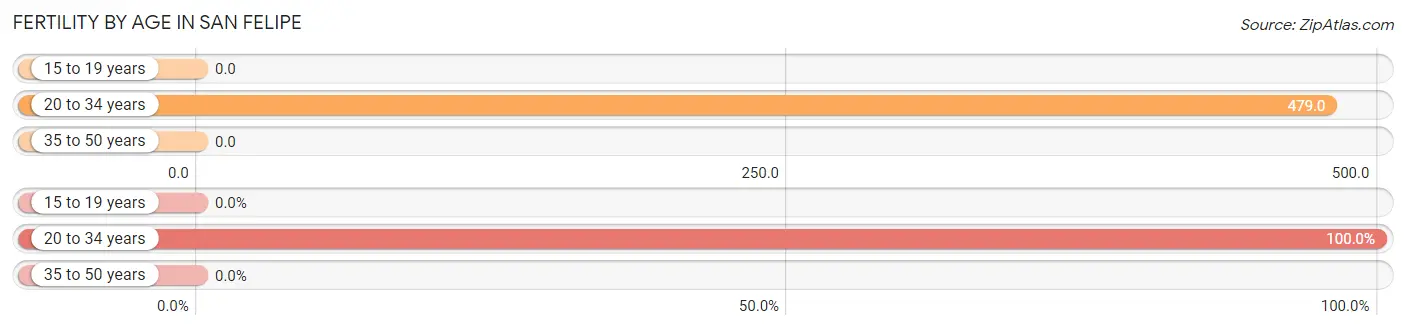
| Age Bracket | Women with Births | Births / 1,000 Women |
| 15 to 19 years | 0 (0.0%) | 0.0 |
| 20 to 34 years | 45 (100.0%) | 479.0 |
| 35 to 50 years | 0 (0.0%) | 0.0 |
| Total | 45 (100.0%) | 239.0 |
Fertility by Age by Marriage Status in San Felipe
95.6% of women with births (45) in San Felipe are married. The highest percentage of unmarried women with births falls into 20 to 34 years age bracket with 4.4% of them unmarried at the time of birth, while the lowest percentage of unmarried women with births belong to 20 to 34 years age bracket with 4.4% of them unmarried.
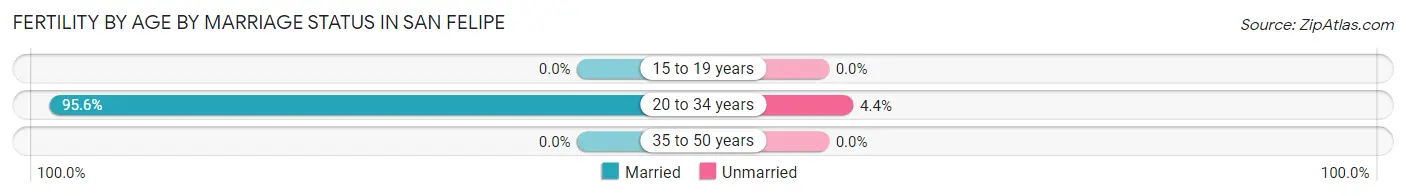
| Age Bracket | Married | Unmarried |
| 15 to 19 years | 0 (0.0%) | 0 (0.0%) |
| 20 to 34 years | 43 (95.6%) | 2 (4.4%) |
| 35 to 50 years | 0 (0.0%) | 0 (0.0%) |
| Total | 43 (95.6%) | 2 (4.4%) |
Fertility by Education in San Felipe
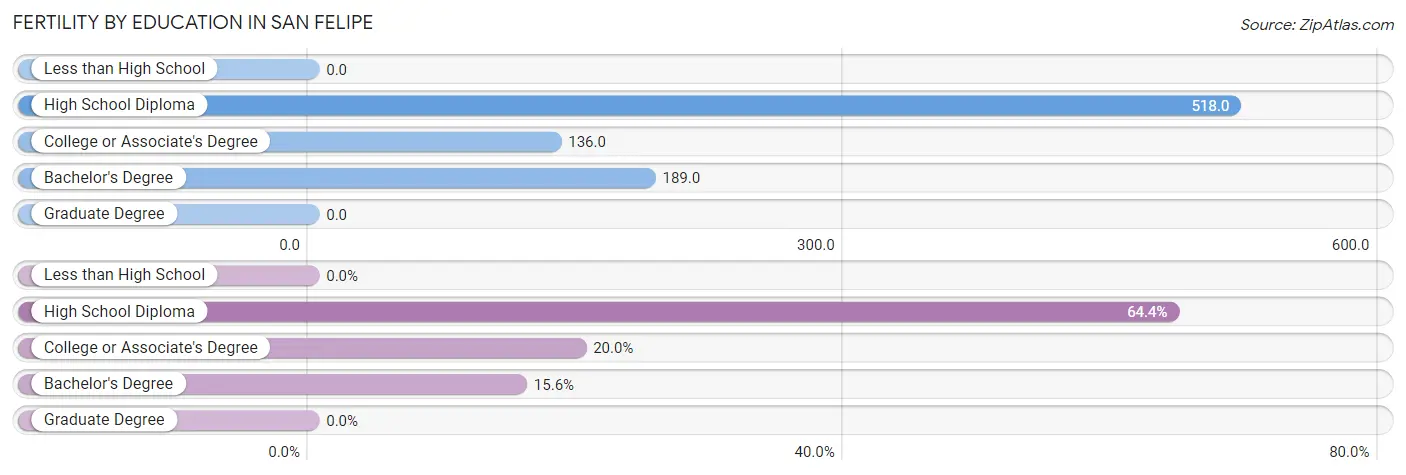
| Educational Attainment | Women with Births | Births / 1,000 Women |
| Less than High School | 0 (0.0%) | 0.0 |
| High School Diploma | 29 (64.4%) | 518.0 |
| College or Associate's Degree | 9 (20.0%) | 136.0 |
| Bachelor's Degree | 7 (15.6%) | 189.0 |
| Graduate Degree | 0 (0.0%) | 0.0 |
| Total | 45 (100.0%) | 239.0 |
Fertility by Education by Marriage Status in San Felipe
4.4% of women with births in San Felipe are unmarried. Women with the educational attainment of high school diploma are most likely to be married with 100.0% of them married at childbirth, while women with the educational attainment of college or associate's degree are least likely to be married with 22.2% of them unmarried at childbirth.
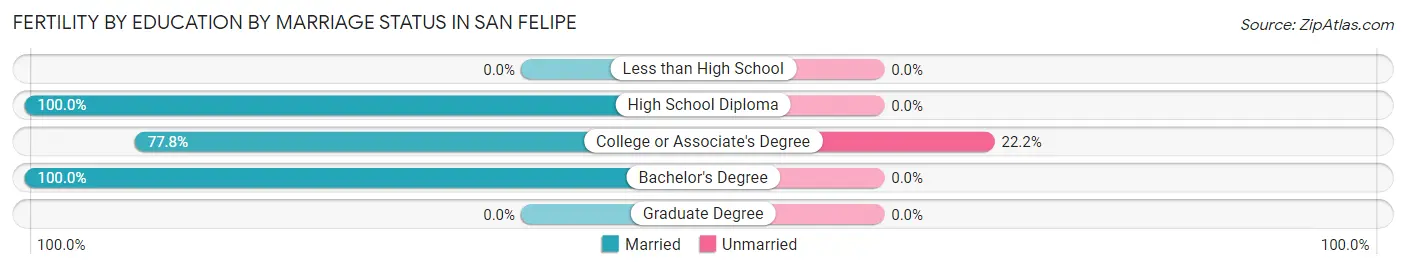
| Educational Attainment | Married | Unmarried |
| Less than High School | 0 (0.0%) | 0 (0.0%) |
| High School Diploma | 29 (100.0%) | 0 (0.0%) |
| College or Associate's Degree | 7 (77.8%) | 2 (22.2%) |
| Bachelor's Degree | 7 (100.0%) | 0 (0.0%) |
| Graduate Degree | 0 (0.0%) | 0 (0.0%) |
| Total | 43 (95.6%) | 2 (4.4%) |
Employment Characteristics in San Felipe
Employment by Class of Employer in San Felipe
Among the 400 employed individuals in San Felipe, private company employees (346 | 86.5%), self-employed (incorporated) (18 | 4.5%), and local government employees (14 | 3.5%) make up the most common classes of employment.
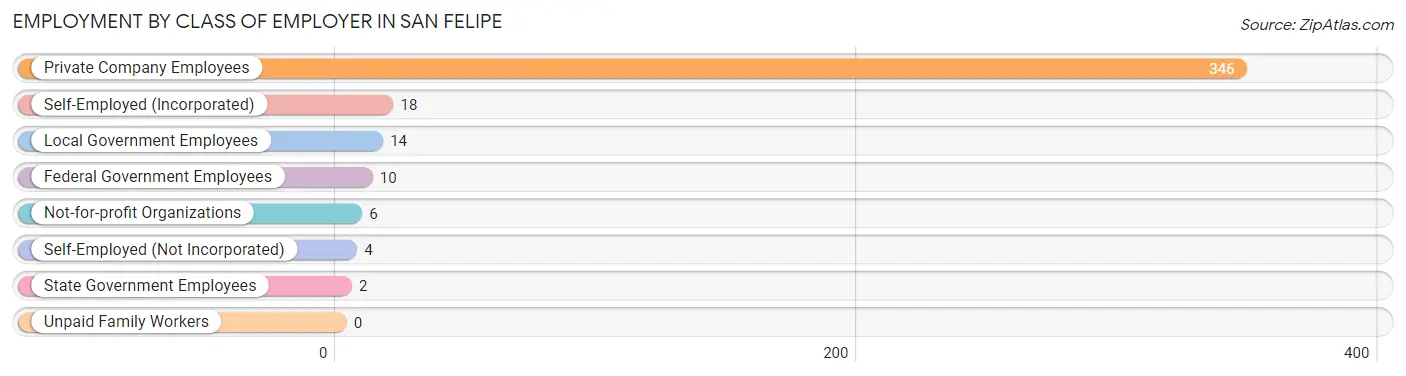
| Employer Class | # Employees | % Employees |
| Private Company Employees | 346 | 86.5% |
| Self-Employed (Incorporated) | 18 | 4.5% |
| Self-Employed (Not Incorporated) | 4 | 1.0% |
| Not-for-profit Organizations | 6 | 1.5% |
| Local Government Employees | 14 | 3.5% |
| State Government Employees | 2 | 0.5% |
| Federal Government Employees | 10 | 2.5% |
| Unpaid Family Workers | 0 | 0.0% |
| Total | 400 | 100.0% |
Employment Status by Age in San Felipe
According to the labor force statistics for San Felipe, out of the total population over 16 years of age (690), 60.3% or 416 individuals are in the labor force, with 3.8% or 16 of them unemployed. The age group with the highest labor force participation rate is 20 to 24 years, with 100.0% or 26 individuals in the labor force. Within the labor force, the 35 to 44 years age range has the highest percentage of unemployed individuals, with 9.6% or 7 of them being unemployed.
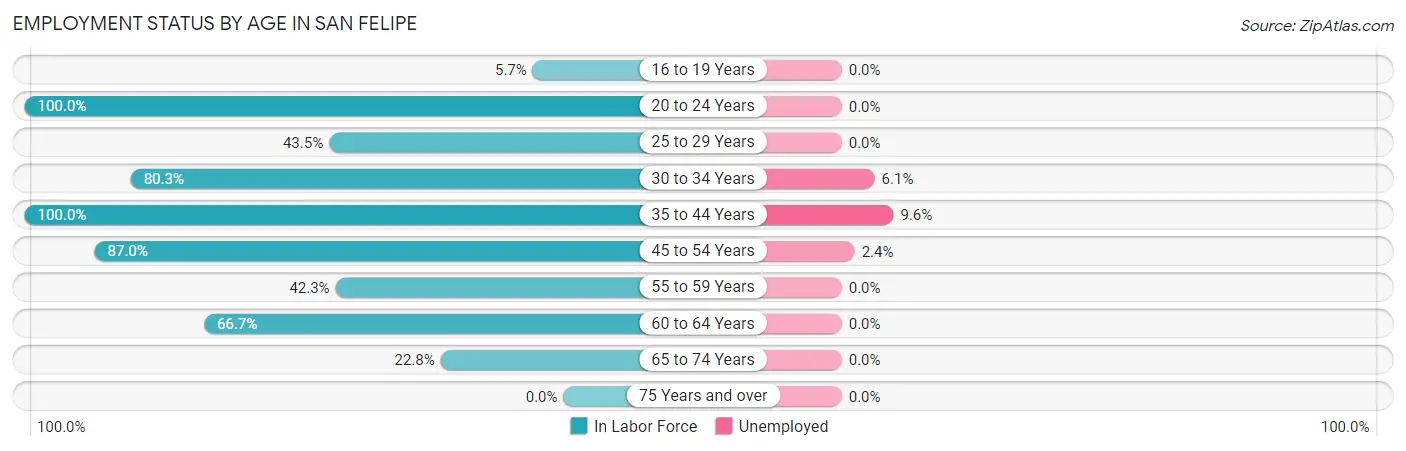
| Age Bracket | In Labor Force | Unemployed |
| 16 to 19 Years | 2 (5.7%) | 0 (0.0%) |
| 20 to 24 Years | 26 (100.0%) | 0 (0.0%) |
| 25 to 29 Years | 30 (43.5%) | 0 (0.0%) |
| 30 to 34 Years | 98 (80.3%) | 6 (6.1%) |
| 35 to 44 Years | 73 (100.0%) | 7 (9.6%) |
| 45 to 54 Years | 127 (87.0%) | 3 (2.4%) |
| 55 to 59 Years | 30 (42.3%) | 0 (0.0%) |
| 60 to 64 Years | 12 (66.7%) | 0 (0.0%) |
| 65 to 74 Years | 18 (22.8%) | 0 (0.0%) |
| 75 Years and over | 0 (0.0%) | 0 (0.0%) |
| Total | 416 (60.3%) | 16 (3.8%) |
Employment Status by Educational Attainment in San Felipe
According to labor force statistics for San Felipe, 74.1% of individuals (370) out of the total population between 25 and 64 years of age (499) are in the labor force, with 4.3% or 16 of them being unemployed. The group with the highest labor force participation rate are those with the educational attainment of bachelor's degree or higher, with 80.7% or 88 individuals in the labor force. Within the labor force, individuals with college / associate degree education have the highest percentage of unemployment, with 13.3% or 10 of them being unemployed.
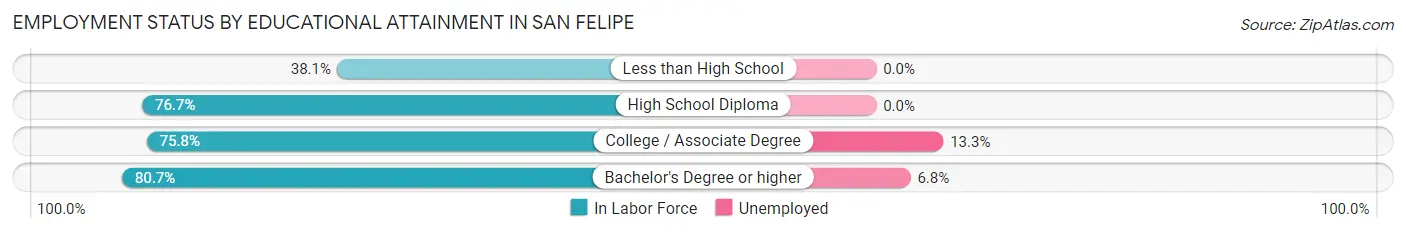
| Educational Attainment | In Labor Force | Unemployed |
| Less than High School | 16 (38.1%) | 0 (0.0%) |
| High School Diploma | 191 (76.7%) | 0 (0.0%) |
| College / Associate Degree | 75 (75.8%) | 13 (13.3%) |
| Bachelor's Degree or higher | 88 (80.7%) | 7 (6.8%) |
| Total | 370 (74.1%) | 21 (4.3%) |
Employment Occupations by Sex in San Felipe
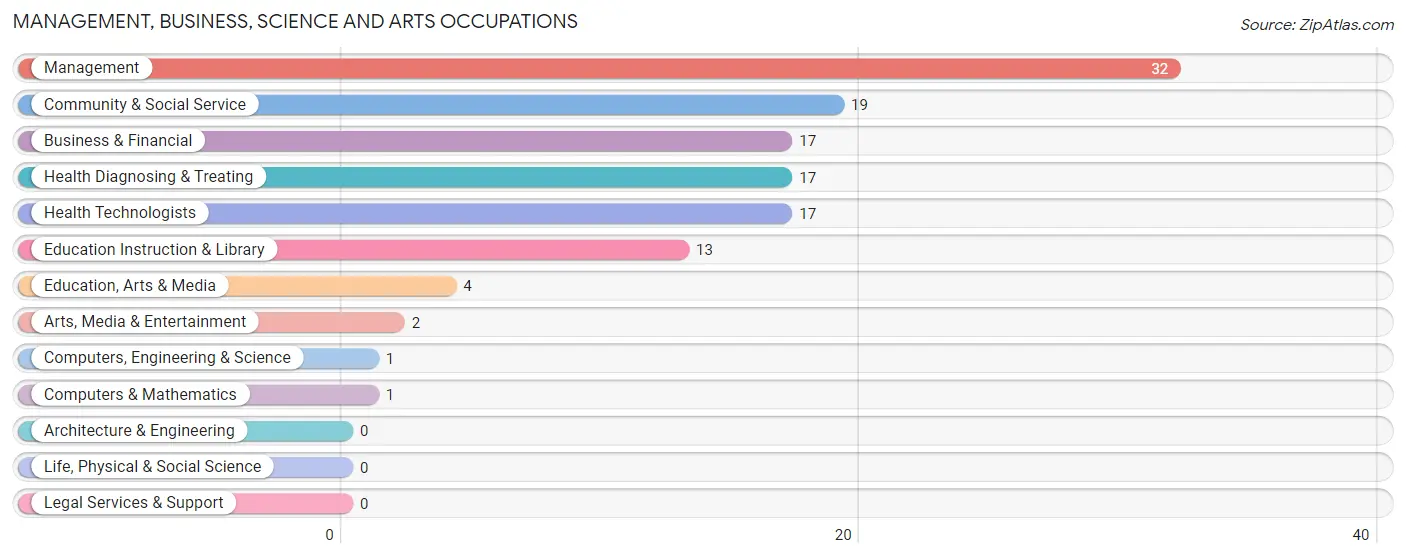
Management, Business, Science and Arts Occupations
The most common Management, Business, Science and Arts occupations in San Felipe are Management (32 | 8.0%), Community & Social Service (19 | 4.8%), Business & Financial (17 | 4.3%), Health Diagnosing & Treating (17 | 4.3%), and Health Technologists (17 | 4.3%).
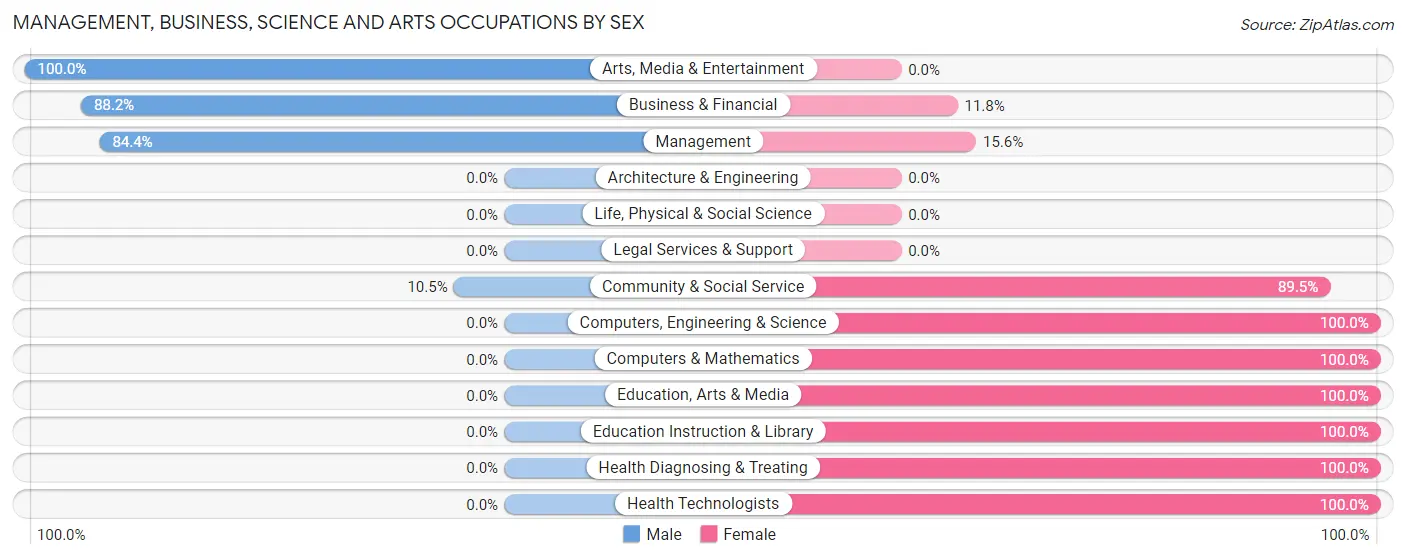
Management, Business, Science and Arts Occupations by Sex
Within the Management, Business, Science and Arts occupations in San Felipe, the most male-oriented occupations are Arts, Media & Entertainment (100.0%), Business & Financial (88.2%), and Management (84.4%), while the most female-oriented occupations are Computers, Engineering & Science (100.0%), Computers & Mathematics (100.0%), and Education, Arts & Media (100.0%).
| Occupation | Male | Female |
| Management | 27 (84.4%) | 5 (15.6%) |
| Business & Financial | 15 (88.2%) | 2 (11.8%) |
| Computers, Engineering & Science | 0 (0.0%) | 1 (100.0%) |
| Computers & Mathematics | 0 (0.0%) | 1 (100.0%) |
| Architecture & Engineering | 0 (0.0%) | 0 (0.0%) |
| Life, Physical & Social Science | 0 (0.0%) | 0 (0.0%) |
| Community & Social Service | 2 (10.5%) | 17 (89.5%) |
| Education, Arts & Media | 0 (0.0%) | 4 (100.0%) |
| Legal Services & Support | 0 (0.0%) | 0 (0.0%) |
| Education Instruction & Library | 0 (0.0%) | 13 (100.0%) |
| Arts, Media & Entertainment | 2 (100.0%) | 0 (0.0%) |
| Health Diagnosing & Treating | 0 (0.0%) | 17 (100.0%) |
| Health Technologists | 0 (0.0%) | 17 (100.0%) |
| Total (Category) | 44 (51.2%) | 42 (48.8%) |
| Total (Overall) | 222 (55.5%) | 178 (44.5%) |
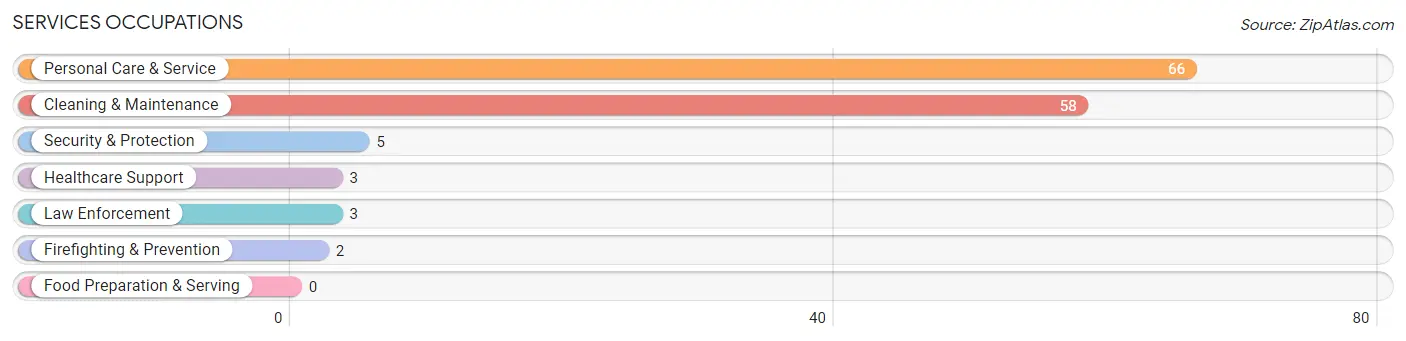
Services Occupations
The most common Services occupations in San Felipe are Personal Care & Service (66 | 16.5%), Cleaning & Maintenance (58 | 14.5%), Security & Protection (5 | 1.3%), Healthcare Support (3 | 0.7%), and Law Enforcement (3 | 0.7%).
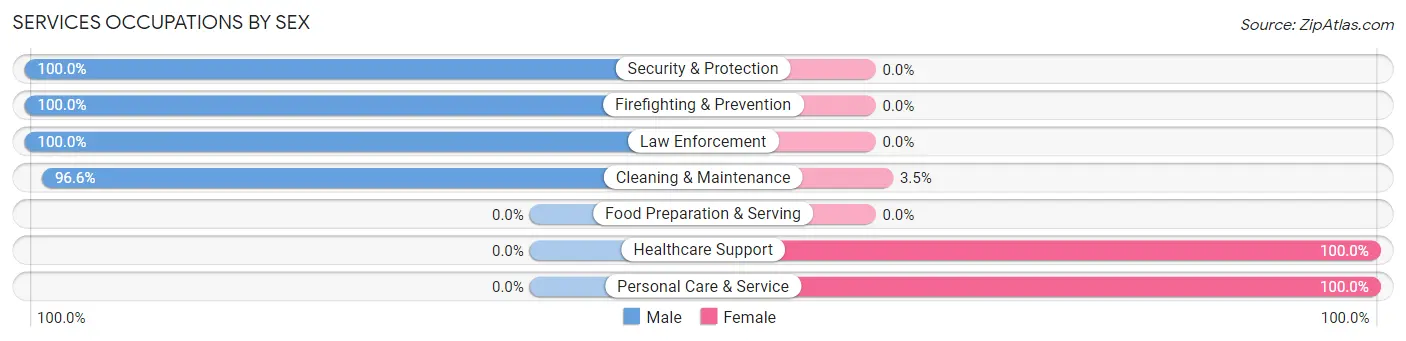
Services Occupations by Sex
Within the Services occupations in San Felipe, the most male-oriented occupations are Security & Protection (100.0%), Firefighting & Prevention (100.0%), and Law Enforcement (100.0%), while the most female-oriented occupations are Healthcare Support (100.0%), Personal Care & Service (100.0%), and Cleaning & Maintenance (3.5%).
| Occupation | Male | Female |
| Healthcare Support | 0 (0.0%) | 3 (100.0%) |
| Security & Protection | 5 (100.0%) | 0 (0.0%) |
| Firefighting & Prevention | 2 (100.0%) | 0 (0.0%) |
| Law Enforcement | 3 (100.0%) | 0 (0.0%) |
| Food Preparation & Serving | 0 (0.0%) | 0 (0.0%) |
| Cleaning & Maintenance | 56 (96.6%) | 2 (3.5%) |
| Personal Care & Service | 0 (0.0%) | 66 (100.0%) |
| Total (Category) | 61 (46.2%) | 71 (53.8%) |
| Total (Overall) | 222 (55.5%) | 178 (44.5%) |
Sales and Office Occupations
The most common Sales and Office occupations in San Felipe are Sales & Related (59 | 14.7%), and Office & Administration (31 | 7.7%).
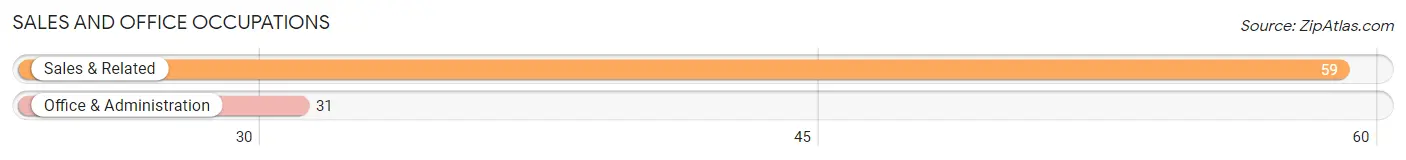
Sales and Office Occupations by Sex
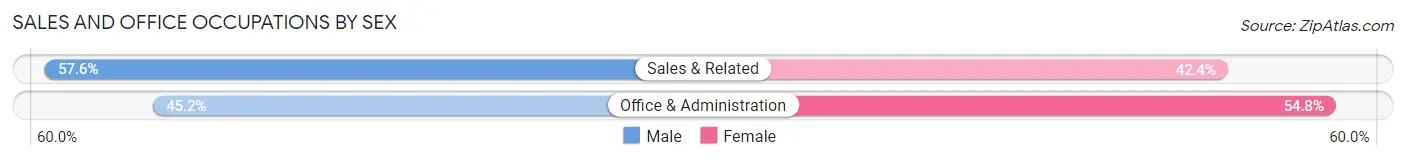
| Occupation | Male | Female |
| Sales & Related | 34 (57.6%) | 25 (42.4%) |
| Office & Administration | 14 (45.2%) | 17 (54.8%) |
| Total (Category) | 48 (53.3%) | 42 (46.7%) |
| Total (Overall) | 222 (55.5%) | 178 (44.5%) |
Natural Resources, Construction and Maintenance Occupations
The most common Natural Resources, Construction and Maintenance occupations in San Felipe are Installation, Maintenance & Repair (29 | 7.2%), and Construction & Extraction (4 | 1.0%).
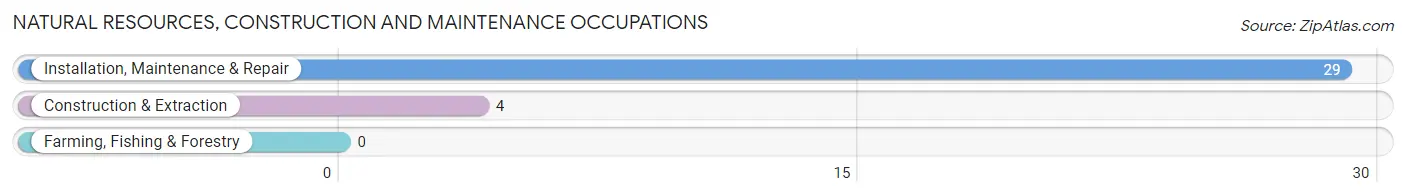
Natural Resources, Construction and Maintenance Occupations by Sex
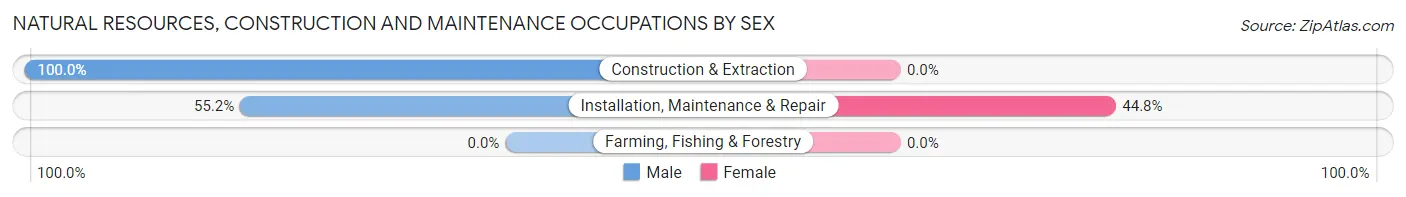
| Occupation | Male | Female |
| Farming, Fishing & Forestry | 0 (0.0%) | 0 (0.0%) |
| Construction & Extraction | 4 (100.0%) | 0 (0.0%) |
| Installation, Maintenance & Repair | 16 (55.2%) | 13 (44.8%) |
| Total (Category) | 20 (60.6%) | 13 (39.4%) |
| Total (Overall) | 222 (55.5%) | 178 (44.5%) |
Production, Transportation and Moving Occupations
The most common Production, Transportation and Moving occupations in San Felipe are Material Moving (32 | 8.0%), Transportation (16 | 4.0%), and Production (11 | 2.8%).
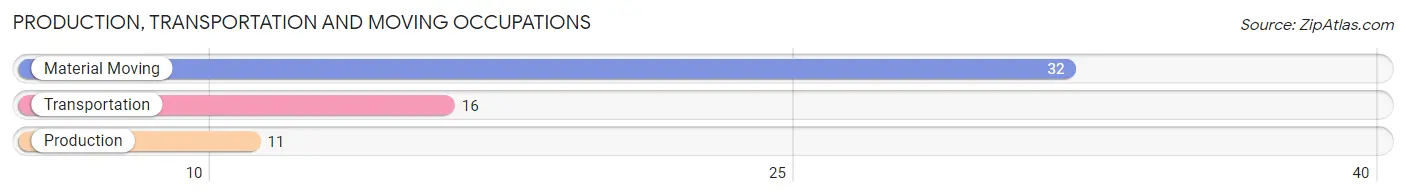
Production, Transportation and Moving Occupations by Sex
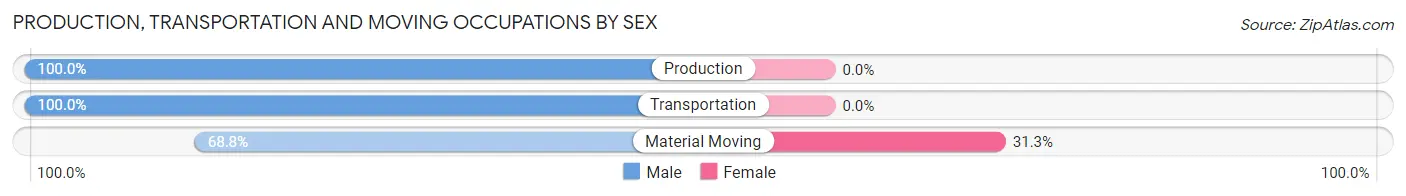
| Occupation | Male | Female |
| Production | 11 (100.0%) | 0 (0.0%) |
| Transportation | 16 (100.0%) | 0 (0.0%) |
| Material Moving | 22 (68.8%) | 10 (31.2%) |
| Total (Category) | 49 (83.1%) | 10 (17.0%) |
| Total (Overall) | 222 (55.5%) | 178 (44.5%) |
Employment Industries by Sex in San Felipe
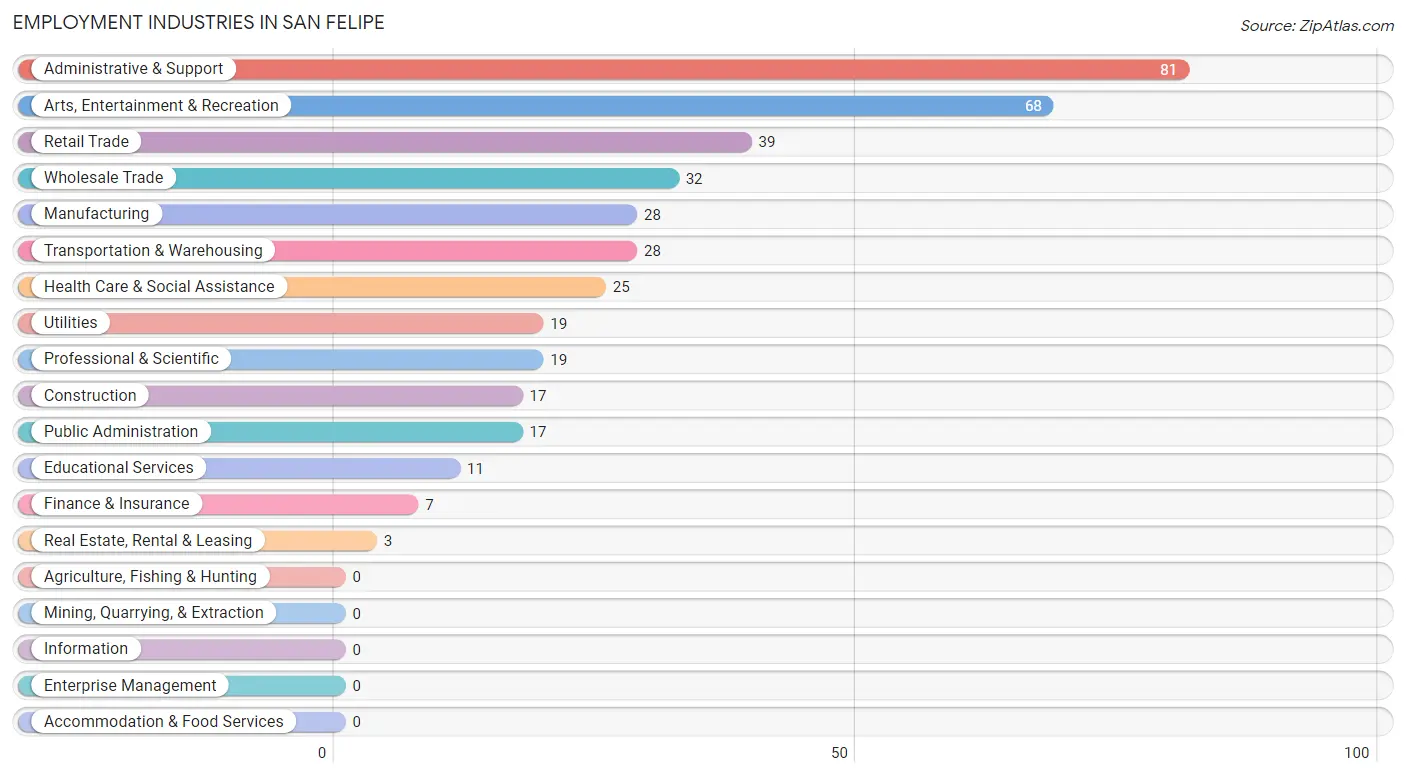
Employment Industries in San Felipe
The major employment industries in San Felipe include Administrative & Support (81 | 20.3%), Arts, Entertainment & Recreation (68 | 17.0%), Retail Trade (39 | 9.8%), Wholesale Trade (32 | 8.0%), and Manufacturing (28 | 7.0%).
Employment Industries by Sex in San Felipe
The San Felipe industries that see more men than women are Finance & Insurance (100.0%), Real Estate, Rental & Leasing (100.0%), and Professional & Scientific (100.0%), whereas the industries that tend to have a higher number of women are Health Care & Social Assistance (100.0%), Arts, Entertainment & Recreation (97.1%), and Retail Trade (82.1%).
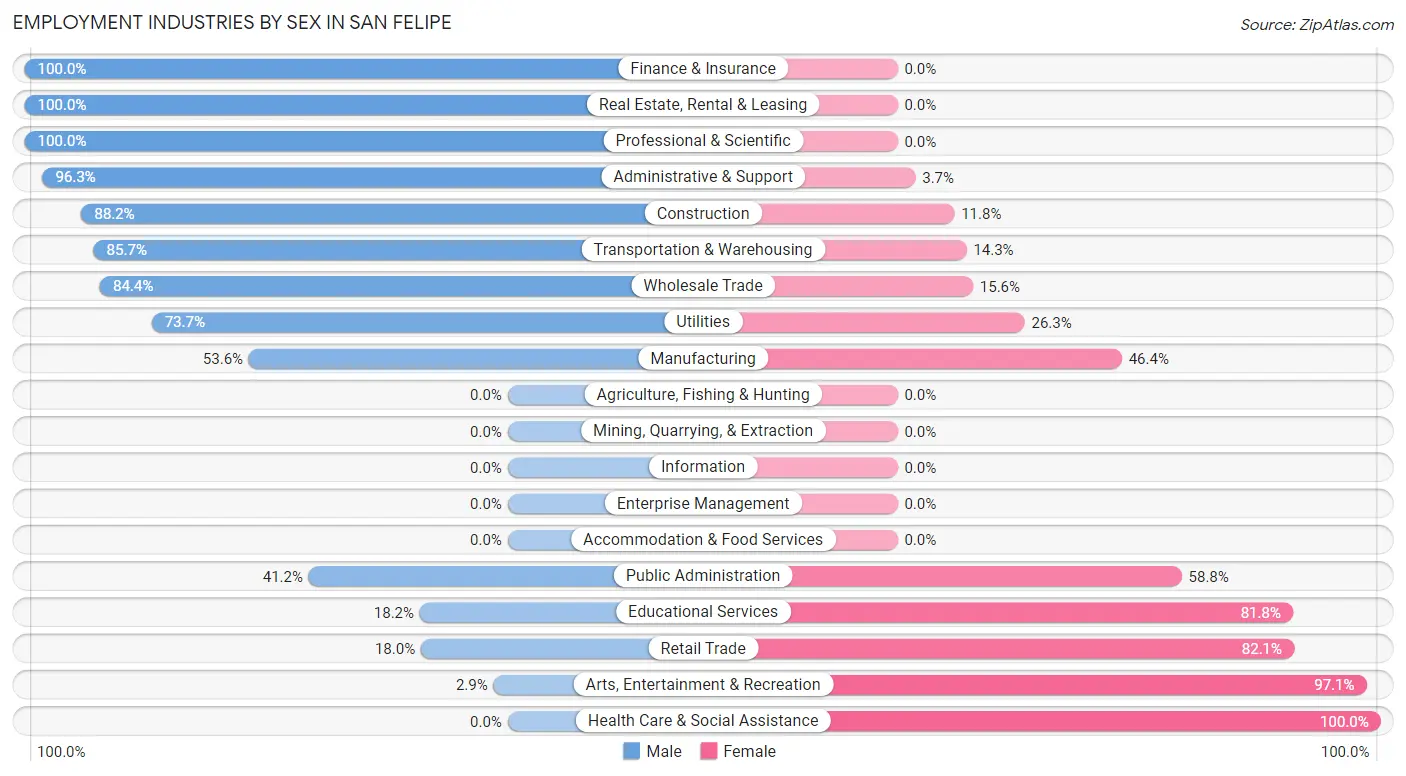
| Industry | Male | Female |
| Agriculture, Fishing & Hunting | 0 (0.0%) | 0 (0.0%) |
| Mining, Quarrying, & Extraction | 0 (0.0%) | 0 (0.0%) |
| Construction | 15 (88.2%) | 2 (11.8%) |
| Manufacturing | 15 (53.6%) | 13 (46.4%) |
| Wholesale Trade | 27 (84.4%) | 5 (15.6%) |
| Retail Trade | 7 (17.9%) | 32 (82.1%) |
| Transportation & Warehousing | 24 (85.7%) | 4 (14.3%) |
| Utilities | 14 (73.7%) | 5 (26.3%) |
| Information | 0 (0.0%) | 0 (0.0%) |
| Finance & Insurance | 7 (100.0%) | 0 (0.0%) |
| Real Estate, Rental & Leasing | 3 (100.0%) | 0 (0.0%) |
| Professional & Scientific | 19 (100.0%) | 0 (0.0%) |
| Enterprise Management | 0 (0.0%) | 0 (0.0%) |
| Administrative & Support | 78 (96.3%) | 3 (3.7%) |
| Educational Services | 2 (18.2%) | 9 (81.8%) |
| Health Care & Social Assistance | 0 (0.0%) | 25 (100.0%) |
| Arts, Entertainment & Recreation | 2 (2.9%) | 66 (97.1%) |
| Accommodation & Food Services | 0 (0.0%) | 0 (0.0%) |
| Public Administration | 7 (41.2%) | 10 (58.8%) |
| Total | 222 (55.5%) | 178 (44.5%) |
Education in San Felipe
School Enrollment in San Felipe
The most common levels of schooling among the 312 students in San Felipe are middle school (124 | 39.7%), elementary school (103 | 33.0%), and college / undergraduate (32 | 10.3%).
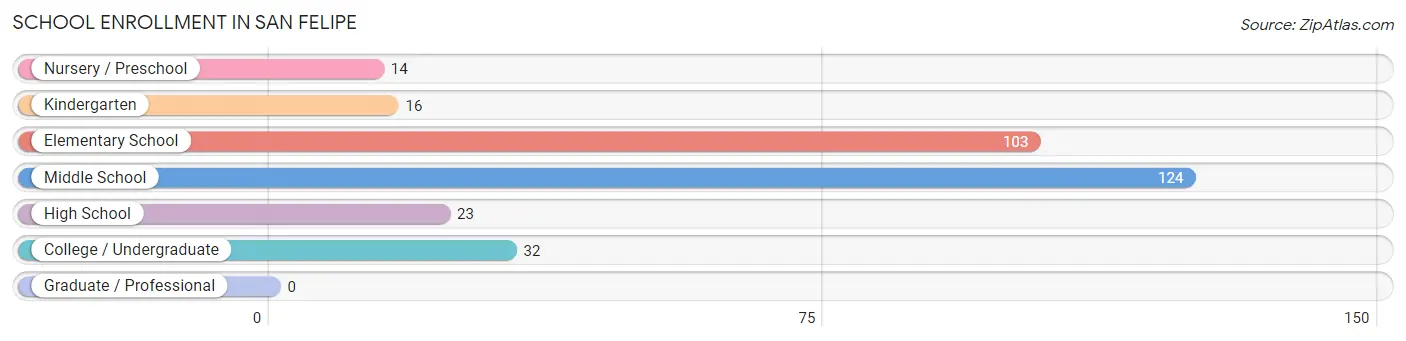
| School Level | # Students | % Students |
| Nursery / Preschool | 14 | 4.5% |
| Kindergarten | 16 | 5.1% |
| Elementary School | 103 | 33.0% |
| Middle School | 124 | 39.7% |
| High School | 23 | 7.4% |
| College / Undergraduate | 32 | 10.3% |
| Graduate / Professional | 0 | 0.0% |
| Total | 312 | 100.0% |
School Enrollment by Age by Funding Source in San Felipe
Out of a total of 312 students who are enrolled in schools in San Felipe, 17 (5.4%) attend a private institution, while the remaining 295 (94.6%) are enrolled in public schools. The age group of 3 to 4 year olds has the highest likelihood of being enrolled in private schools, with 8 (50.0% in the age bracket) enrolled. Conversely, the age group of 10 to 14 year olds has the lowest likelihood of being enrolled in a private school, with 164 (100.0% in the age bracket) attending a public institution.
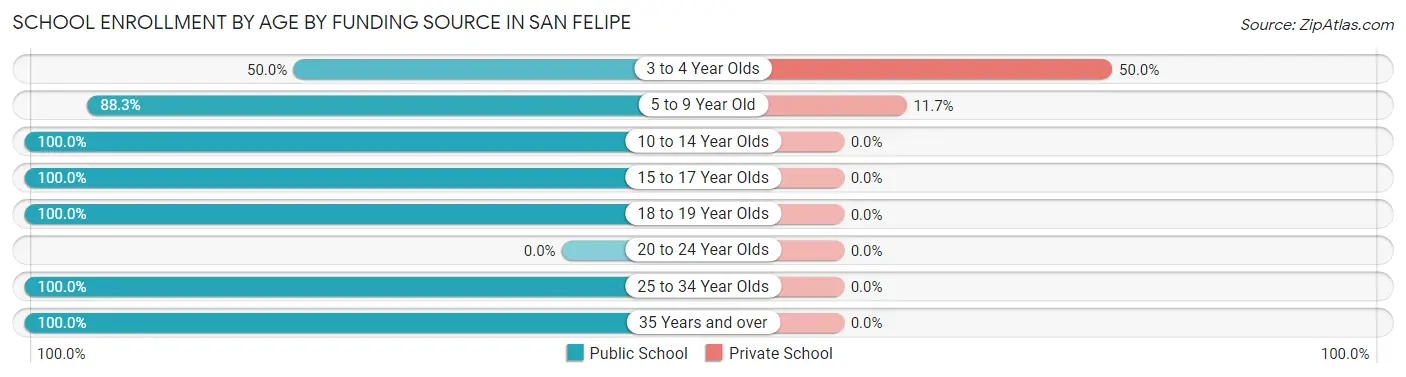
| Age Bracket | Public School | Private School |
| 3 to 4 Year Olds | 8 (50.0%) | 8 (50.0%) |
| 5 to 9 Year Old | 68 (88.3%) | 9 (11.7%) |
| 10 to 14 Year Olds | 164 (100.0%) | 0 (0.0%) |
| 15 to 17 Year Olds | 23 (100.0%) | 0 (0.0%) |
| 18 to 19 Year Olds | 14 (100.0%) | 0 (0.0%) |
| 20 to 24 Year Olds | 0 (0.0%) | 0 (0.0%) |
| 25 to 34 Year Olds | 9 (100.0%) | 0 (0.0%) |
| 35 Years and over | 9 (100.0%) | 0 (0.0%) |
| Total | 295 (94.6%) | 17 (5.4%) |
Educational Attainment by Field of Study in San Felipe
Education (43 | 31.2%), science & technology (24 | 17.4%), business (18 | 13.0%), arts & humanities (18 | 13.0%), and social sciences (13 | 9.4%) are the most common fields of study among 138 individuals in San Felipe who have obtained a bachelor's degree or higher.
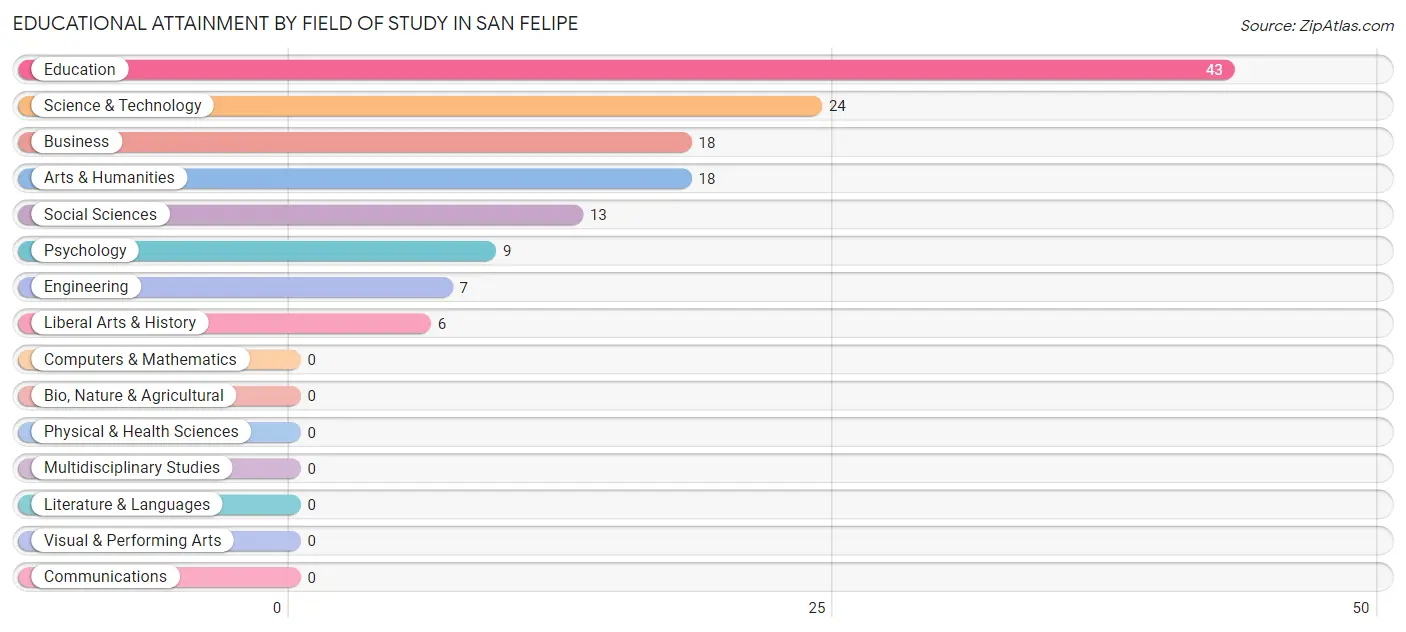
| Field of Study | # Graduates | % Graduates |
| Computers & Mathematics | 0 | 0.0% |
| Bio, Nature & Agricultural | 0 | 0.0% |
| Physical & Health Sciences | 0 | 0.0% |
| Psychology | 9 | 6.5% |
| Social Sciences | 13 | 9.4% |
| Engineering | 7 | 5.1% |
| Multidisciplinary Studies | 0 | 0.0% |
| Science & Technology | 24 | 17.4% |
| Business | 18 | 13.0% |
| Education | 43 | 31.2% |
| Literature & Languages | 0 | 0.0% |
| Liberal Arts & History | 6 | 4.3% |
| Visual & Performing Arts | 0 | 0.0% |
| Communications | 0 | 0.0% |
| Arts & Humanities | 18 | 13.0% |
| Total | 138 | 100.0% |
Transportation & Commute in San Felipe
Vehicle Availability by Sex in San Felipe
The most prevalent vehicle ownership categories in San Felipe are males with 2 vehicles (131, accounting for 59.0%) and females with 2 vehicles (37, making up 73.6%).
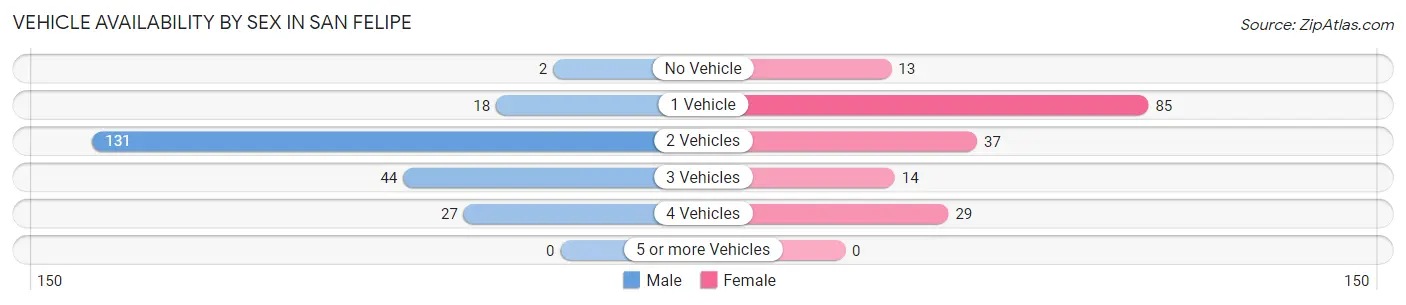
| Vehicles Available | Male | Female |
| No Vehicle | 2 (0.9%) | 13 (7.3%) |
| 1 Vehicle | 18 (8.1%) | 85 (47.7%) |
| 2 Vehicles | 131 (59.0%) | 37 (20.8%) |
| 3 Vehicles | 44 (19.8%) | 14 (7.9%) |
| 4 Vehicles | 27 (12.2%) | 29 (16.3%) |
| 5 or more Vehicles | 0 (0.0%) | 0 (0.0%) |
| Total | 222 (100.0%) | 178 (100.0%) |
Commute Time in San Felipe
The most frequently occuring commute durations in San Felipe are 45 to 59 minutes (101 commuters, 26.4%), 40 to 44 minutes (67 commuters, 17.5%), and 15 to 19 minutes (49 commuters, 12.8%).
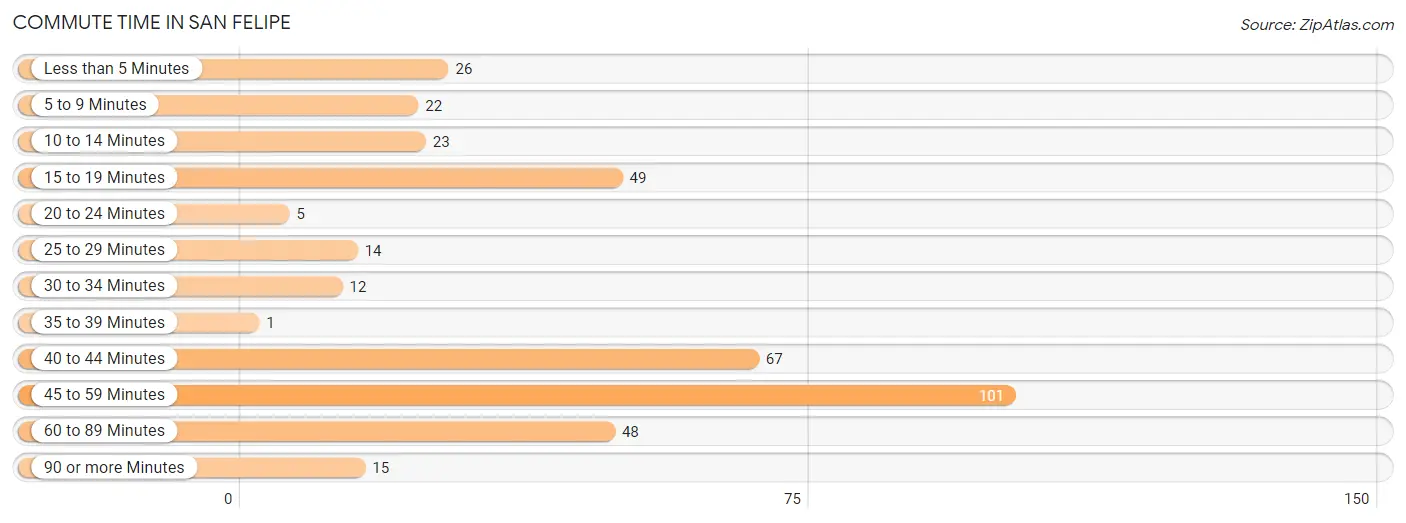
| Commute Time | # Commuters | % Commuters |
| Less than 5 Minutes | 26 | 6.8% |
| 5 to 9 Minutes | 22 | 5.7% |
| 10 to 14 Minutes | 23 | 6.0% |
| 15 to 19 Minutes | 49 | 12.8% |
| 20 to 24 Minutes | 5 | 1.3% |
| 25 to 29 Minutes | 14 | 3.7% |
| 30 to 34 Minutes | 12 | 3.1% |
| 35 to 39 Minutes | 1 | 0.3% |
| 40 to 44 Minutes | 67 | 17.5% |
| 45 to 59 Minutes | 101 | 26.4% |
| 60 to 89 Minutes | 48 | 12.5% |
| 90 or more Minutes | 15 | 3.9% |
Commute Time by Sex in San Felipe
The most common commute times in San Felipe are 45 to 59 minutes (66 commuters, 32.0%) for males and 40 to 44 minutes (66 commuters, 37.3%) for females.
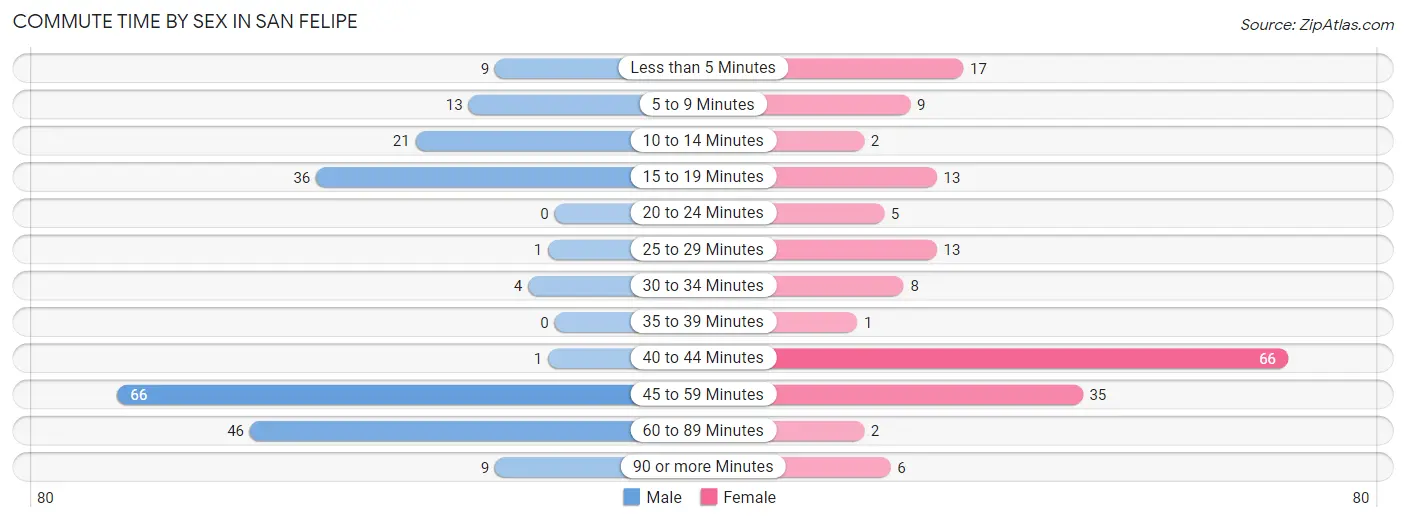
| Commute Time | Male | Female |
| Less than 5 Minutes | 9 (4.4%) | 17 (9.6%) |
| 5 to 9 Minutes | 13 (6.3%) | 9 (5.1%) |
| 10 to 14 Minutes | 21 (10.2%) | 2 (1.1%) |
| 15 to 19 Minutes | 36 (17.5%) | 13 (7.3%) |
| 20 to 24 Minutes | 0 (0.0%) | 5 (2.8%) |
| 25 to 29 Minutes | 1 (0.5%) | 13 (7.3%) |
| 30 to 34 Minutes | 4 (1.9%) | 8 (4.5%) |
| 35 to 39 Minutes | 0 (0.0%) | 1 (0.6%) |
| 40 to 44 Minutes | 1 (0.5%) | 66 (37.3%) |
| 45 to 59 Minutes | 66 (32.0%) | 35 (19.8%) |
| 60 to 89 Minutes | 46 (22.3%) | 2 (1.1%) |
| 90 or more Minutes | 9 (4.4%) | 6 (3.4%) |
Time of Departure to Work by Sex in San Felipe
The most frequent times of departure to work in San Felipe are 6:00 AM to 6:29 AM (65, 31.6%) for males and 7:00 AM to 7:29 AM (79, 44.6%) for females.
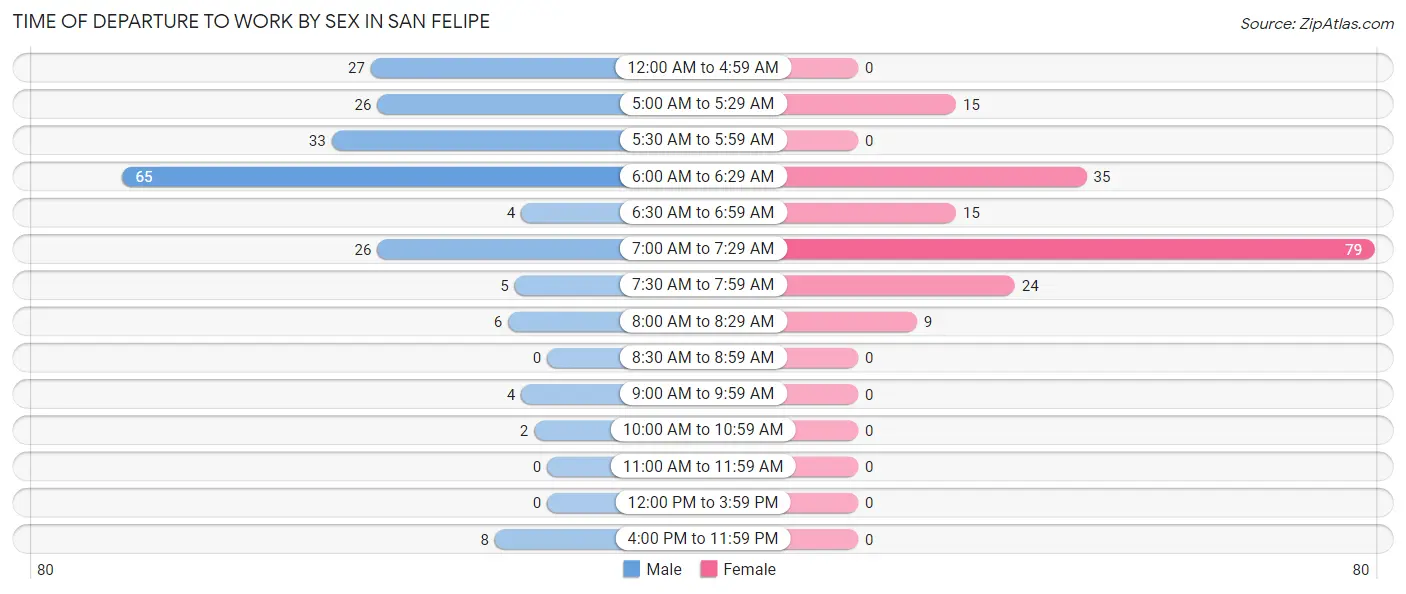
| Time of Departure | Male | Female |
| 12:00 AM to 4:59 AM | 27 (13.1%) | 0 (0.0%) |
| 5:00 AM to 5:29 AM | 26 (12.6%) | 15 (8.5%) |
| 5:30 AM to 5:59 AM | 33 (16.0%) | 0 (0.0%) |
| 6:00 AM to 6:29 AM | 65 (31.6%) | 35 (19.8%) |
| 6:30 AM to 6:59 AM | 4 (1.9%) | 15 (8.5%) |
| 7:00 AM to 7:29 AM | 26 (12.6%) | 79 (44.6%) |
| 7:30 AM to 7:59 AM | 5 (2.4%) | 24 (13.6%) |
| 8:00 AM to 8:29 AM | 6 (2.9%) | 9 (5.1%) |
| 8:30 AM to 8:59 AM | 0 (0.0%) | 0 (0.0%) |
| 9:00 AM to 9:59 AM | 4 (1.9%) | 0 (0.0%) |
| 10:00 AM to 10:59 AM | 2 (1.0%) | 0 (0.0%) |
| 11:00 AM to 11:59 AM | 0 (0.0%) | 0 (0.0%) |
| 12:00 PM to 3:59 PM | 0 (0.0%) | 0 (0.0%) |
| 4:00 PM to 11:59 PM | 8 (3.9%) | 0 (0.0%) |
| Total | 206 (100.0%) | 177 (100.0%) |
Housing Occupancy in San Felipe
Occupancy by Ownership in San Felipe
Of the total 397 dwellings in San Felipe, owner-occupied units account for 338 (85.1%), while renter-occupied units make up 59 (14.9%).
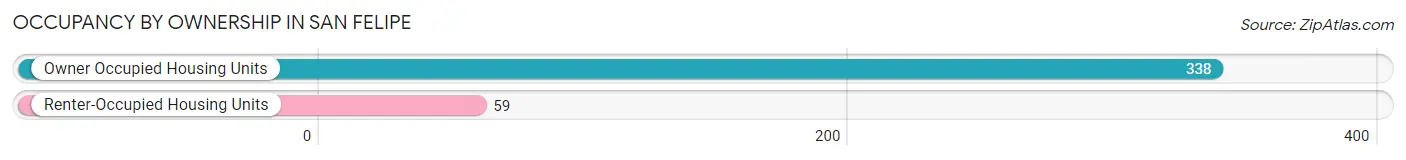
| Occupancy | # Housing Units | % Housing Units |
| Owner Occupied Housing Units | 338 | 85.1% |
| Renter-Occupied Housing Units | 59 | 14.9% |
| Total Occupied Housing Units | 397 | 100.0% |
Occupancy by Household Size in San Felipe
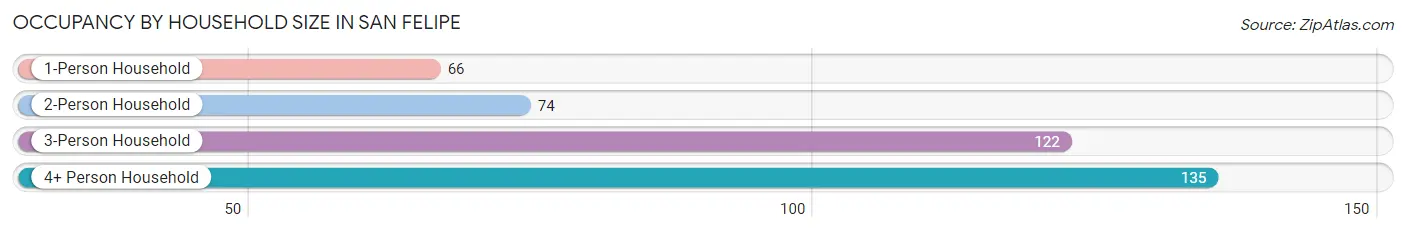
| Household Size | # Housing Units | % Housing Units |
| 1-Person Household | 66 | 16.6% |
| 2-Person Household | 74 | 18.6% |
| 3-Person Household | 122 | 30.7% |
| 4+ Person Household | 135 | 34.0% |
| Total Housing Units | 397 | 100.0% |
Occupancy by Ownership by Household Size in San Felipe
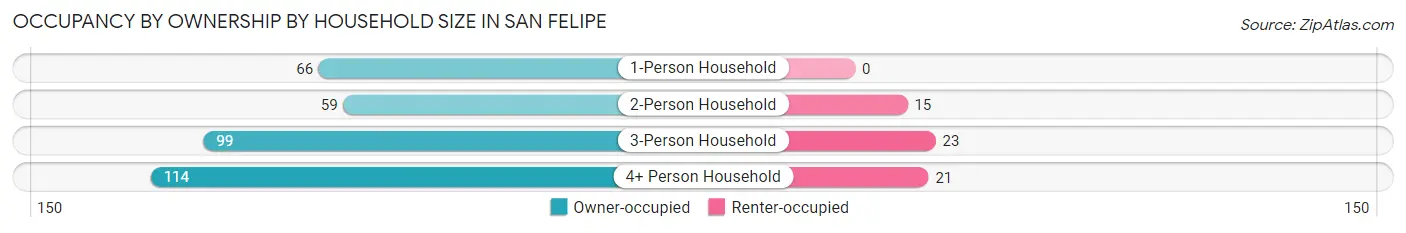
| Household Size | Owner-occupied | Renter-occupied |
| 1-Person Household | 66 (100.0%) | 0 (0.0%) |
| 2-Person Household | 59 (79.7%) | 15 (20.3%) |
| 3-Person Household | 99 (81.1%) | 23 (18.9%) |
| 4+ Person Household | 114 (84.4%) | 21 (15.6%) |
| Total Housing Units | 338 (85.1%) | 59 (14.9%) |
Occupancy by Educational Attainment in San Felipe
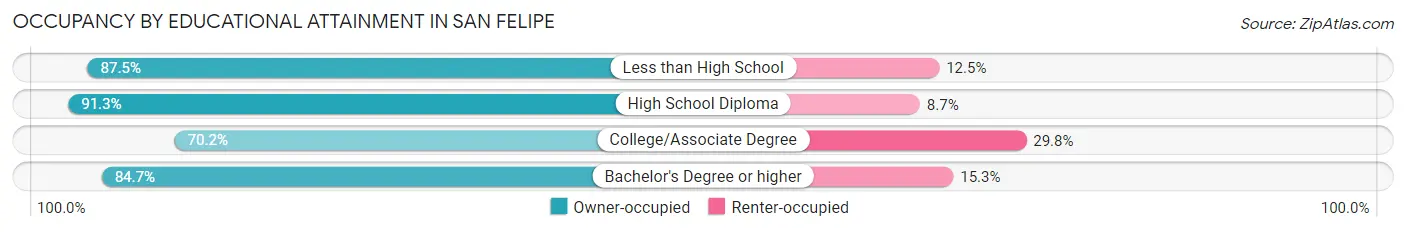
| Household Size | Owner-occupied | Renter-occupied |
| Less than High School | 28 (87.5%) | 4 (12.5%) |
| High School Diploma | 179 (91.3%) | 17 (8.7%) |
| College/Associate Degree | 59 (70.2%) | 25 (29.8%) |
| Bachelor's Degree or higher | 72 (84.7%) | 13 (15.3%) |
Occupancy by Age of Householder in San Felipe
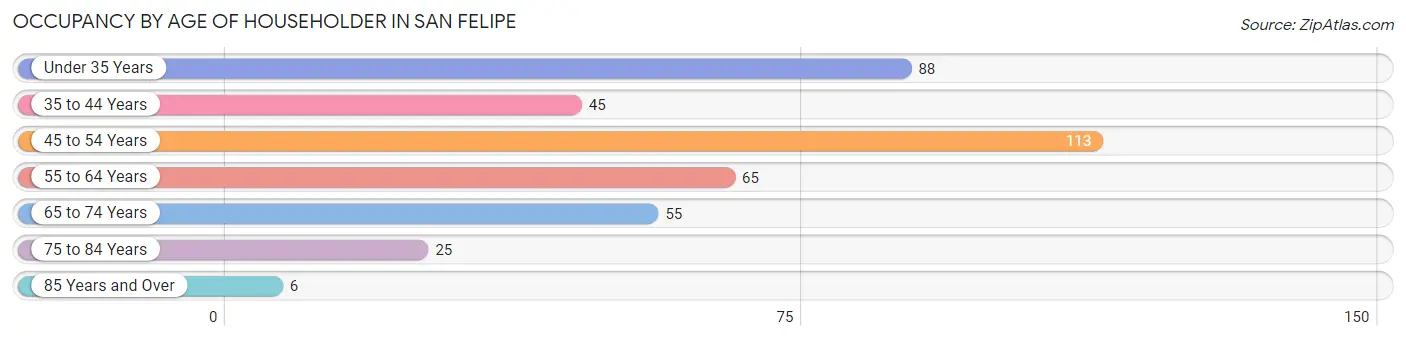
| Age Bracket | # Households | % Households |
| Under 35 Years | 88 | 22.2% |
| 35 to 44 Years | 45 | 11.3% |
| 45 to 54 Years | 113 | 28.5% |
| 55 to 64 Years | 65 | 16.4% |
| 65 to 74 Years | 55 | 13.9% |
| 75 to 84 Years | 25 | 6.3% |
| 85 Years and Over | 6 | 1.5% |
| Total | 397 | 100.0% |
Housing Finances in San Felipe
Median Income by Occupancy in San Felipe
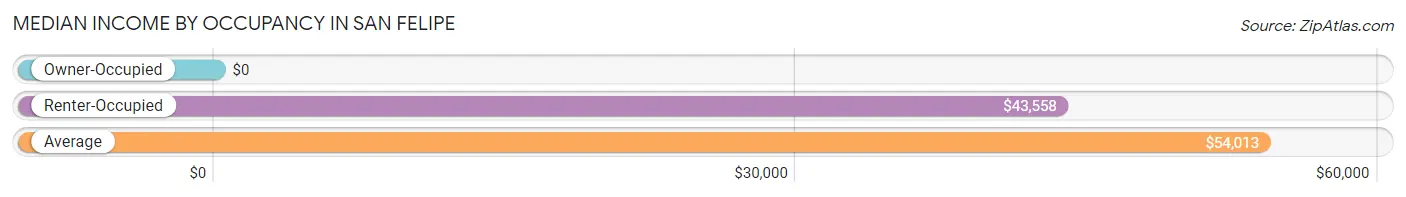
| Occupancy Type | # Households | Median Income |
| Owner-Occupied | 338 (85.1%) | $0 |
| Renter-Occupied | 59 (14.9%) | $43,558 |
| Average | 397 (100.0%) | $54,013 |
Occupancy by Householder Income Bracket in San Felipe
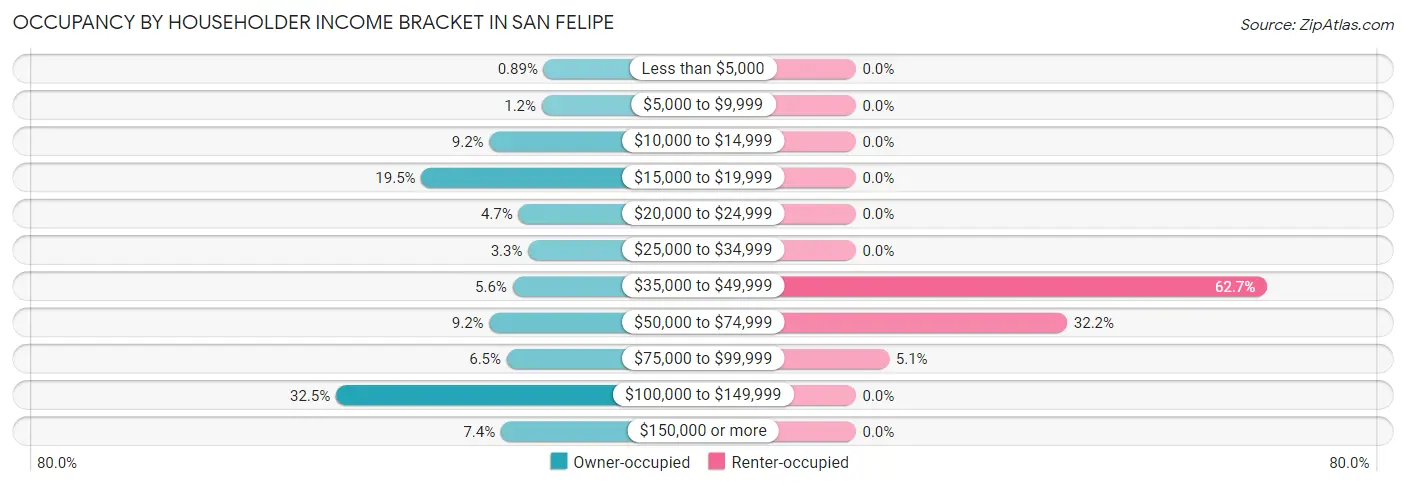
| Income Bracket | Owner-occupied | Renter-occupied |
| Less than $5,000 | 3 (0.9%) | 0 (0.0%) |
| $5,000 to $9,999 | 4 (1.2%) | 0 (0.0%) |
| $10,000 to $14,999 | 31 (9.2%) | 0 (0.0%) |
| $15,000 to $19,999 | 66 (19.5%) | 0 (0.0%) |
| $20,000 to $24,999 | 16 (4.7%) | 0 (0.0%) |
| $25,000 to $34,999 | 11 (3.3%) | 0 (0.0%) |
| $35,000 to $49,999 | 19 (5.6%) | 37 (62.7%) |
| $50,000 to $74,999 | 31 (9.2%) | 19 (32.2%) |
| $75,000 to $99,999 | 22 (6.5%) | 3 (5.1%) |
| $100,000 to $149,999 | 110 (32.5%) | 0 (0.0%) |
| $150,000 or more | 25 (7.4%) | 0 (0.0%) |
| Total | 338 (100.0%) | 59 (100.0%) |
Monthly Housing Cost Tiers in San Felipe
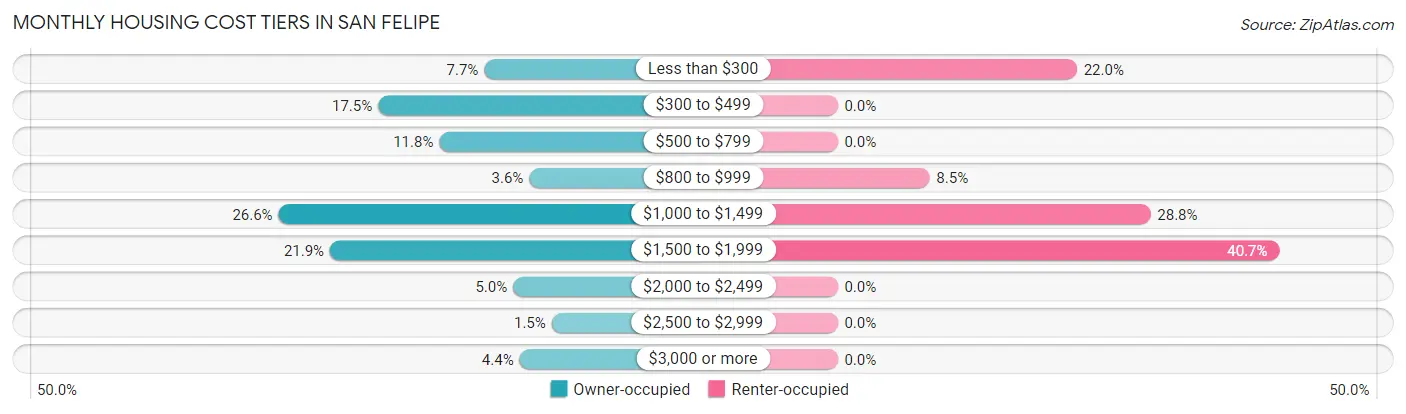
| Monthly Cost | Owner-occupied | Renter-occupied |
| Less than $300 | 26 (7.7%) | 13 (22.0%) |
| $300 to $499 | 59 (17.5%) | 0 (0.0%) |
| $500 to $799 | 40 (11.8%) | 0 (0.0%) |
| $800 to $999 | 12 (3.5%) | 5 (8.5%) |
| $1,000 to $1,499 | 90 (26.6%) | 17 (28.8%) |
| $1,500 to $1,999 | 74 (21.9%) | 24 (40.7%) |
| $2,000 to $2,499 | 17 (5.0%) | 0 (0.0%) |
| $2,500 to $2,999 | 5 (1.5%) | 0 (0.0%) |
| $3,000 or more | 15 (4.4%) | 0 (0.0%) |
| Total | 338 (100.0%) | 59 (100.0%) |
Physical Housing Characteristics in San Felipe
Housing Structures in San Felipe
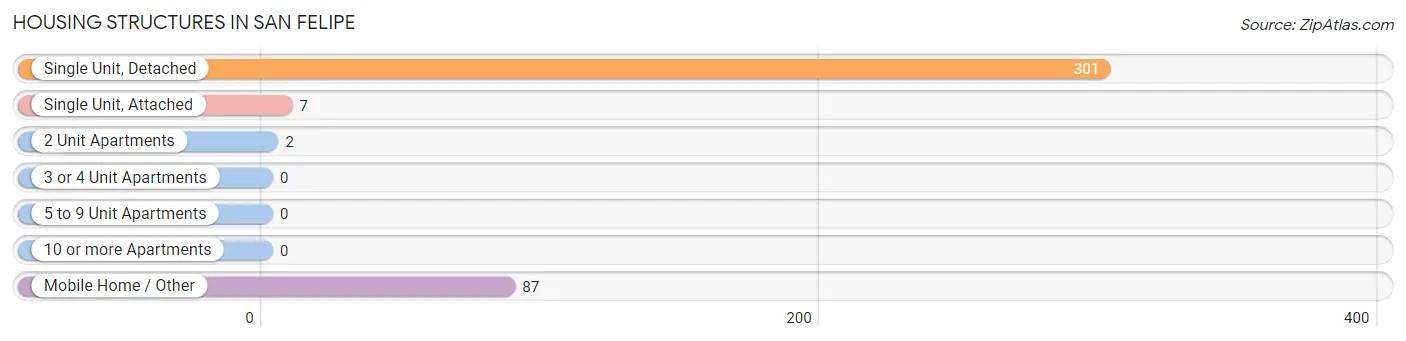
| Structure Type | # Housing Units | % Housing Units |
| Single Unit, Detached | 301 | 75.8% |
| Single Unit, Attached | 7 | 1.8% |
| 2 Unit Apartments | 2 | 0.5% |
| 3 or 4 Unit Apartments | 0 | 0.0% |
| 5 to 9 Unit Apartments | 0 | 0.0% |
| 10 or more Apartments | 0 | 0.0% |
| Mobile Home / Other | 87 | 21.9% |
| Total | 397 | 100.0% |
Housing Structures by Occupancy in San Felipe
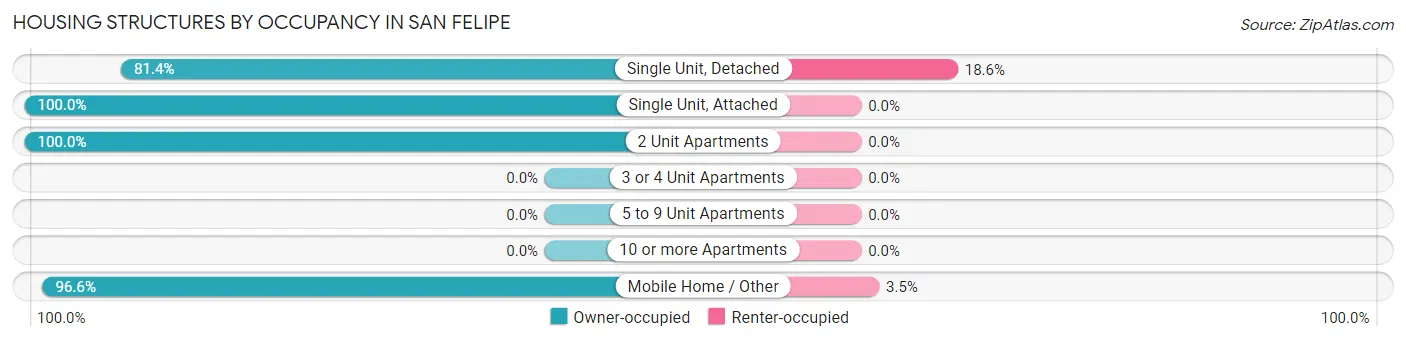
| Structure Type | Owner-occupied | Renter-occupied |
| Single Unit, Detached | 245 (81.4%) | 56 (18.6%) |
| Single Unit, Attached | 7 (100.0%) | 0 (0.0%) |
| 2 Unit Apartments | 2 (100.0%) | 0 (0.0%) |
| 3 or 4 Unit Apartments | 0 (0.0%) | 0 (0.0%) |
| 5 to 9 Unit Apartments | 0 (0.0%) | 0 (0.0%) |
| 10 or more Apartments | 0 (0.0%) | 0 (0.0%) |
| Mobile Home / Other | 84 (96.6%) | 3 (3.5%) |
| Total | 338 (85.1%) | 59 (14.9%) |
Housing Structures by Number of Rooms in San Felipe
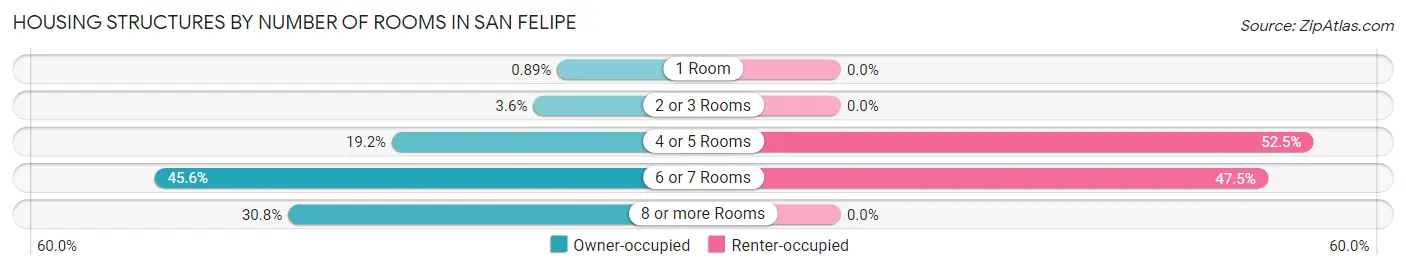
| Number of Rooms | Owner-occupied | Renter-occupied |
| 1 Room | 3 (0.9%) | 0 (0.0%) |
| 2 or 3 Rooms | 12 (3.5%) | 0 (0.0%) |
| 4 or 5 Rooms | 65 (19.2%) | 31 (52.5%) |
| 6 or 7 Rooms | 154 (45.6%) | 28 (47.5%) |
| 8 or more Rooms | 104 (30.8%) | 0 (0.0%) |
| Total | 338 (100.0%) | 59 (100.0%) |
Housing Structure by Heating Type in San Felipe
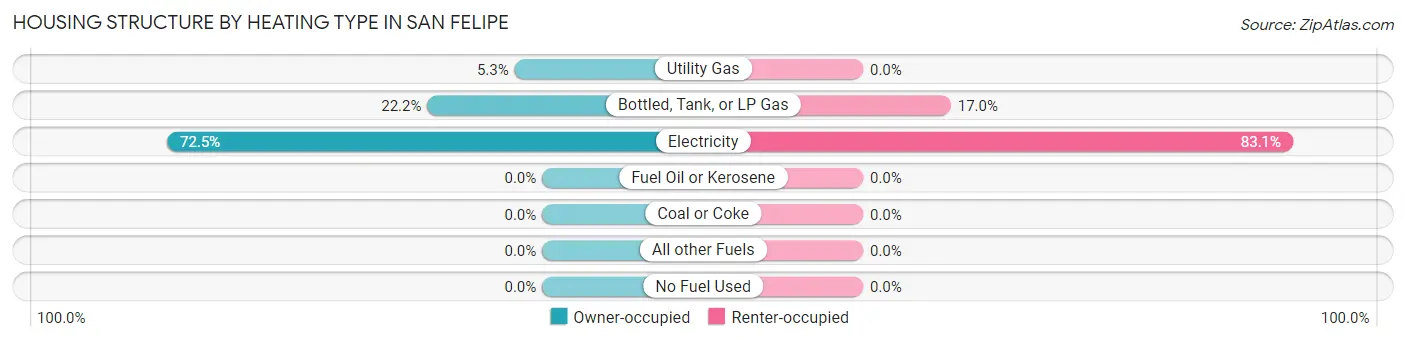
| Heating Type | Owner-occupied | Renter-occupied |
| Utility Gas | 18 (5.3%) | 0 (0.0%) |
| Bottled, Tank, or LP Gas | 75 (22.2%) | 10 (17.0%) |
| Electricity | 245 (72.5%) | 49 (83.1%) |
| Fuel Oil or Kerosene | 0 (0.0%) | 0 (0.0%) |
| Coal or Coke | 0 (0.0%) | 0 (0.0%) |
| All other Fuels | 0 (0.0%) | 0 (0.0%) |
| No Fuel Used | 0 (0.0%) | 0 (0.0%) |
| Total | 338 (100.0%) | 59 (100.0%) |
Household Vehicle Usage in San Felipe
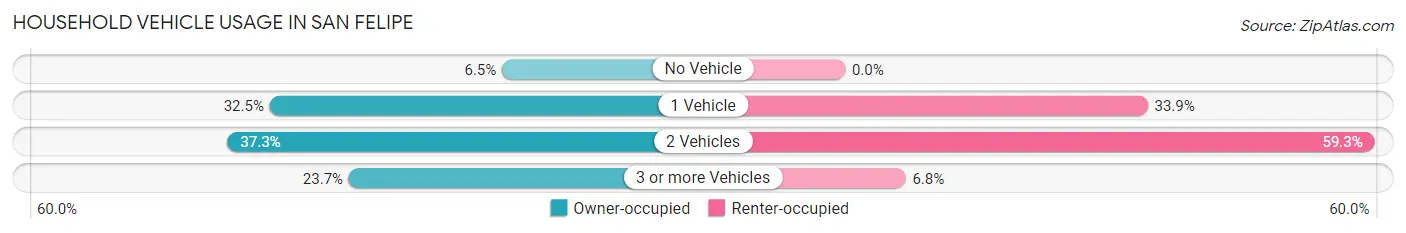
| Vehicles per Household | Owner-occupied | Renter-occupied |
| No Vehicle | 22 (6.5%) | 0 (0.0%) |
| 1 Vehicle | 110 (32.5%) | 20 (33.9%) |
| 2 Vehicles | 126 (37.3%) | 35 (59.3%) |
| 3 or more Vehicles | 80 (23.7%) | 4 (6.8%) |
| Total | 338 (100.0%) | 59 (100.0%) |
Real Estate & Mortgages in San Felipe
Real Estate and Mortgage Overview in San Felipe
| Characteristic | Without Mortgage | With Mortgage |
| Housing Units | 130 | 208 |
| Median Property Value | $117,000 | $246,300 |
| Median Household Income | $45,417 | $23 |
| Monthly Housing Costs | $394 | $15 |
| Real Estate Taxes | $1,568 | $0 |
Property Value by Mortgage Status in San Felipe
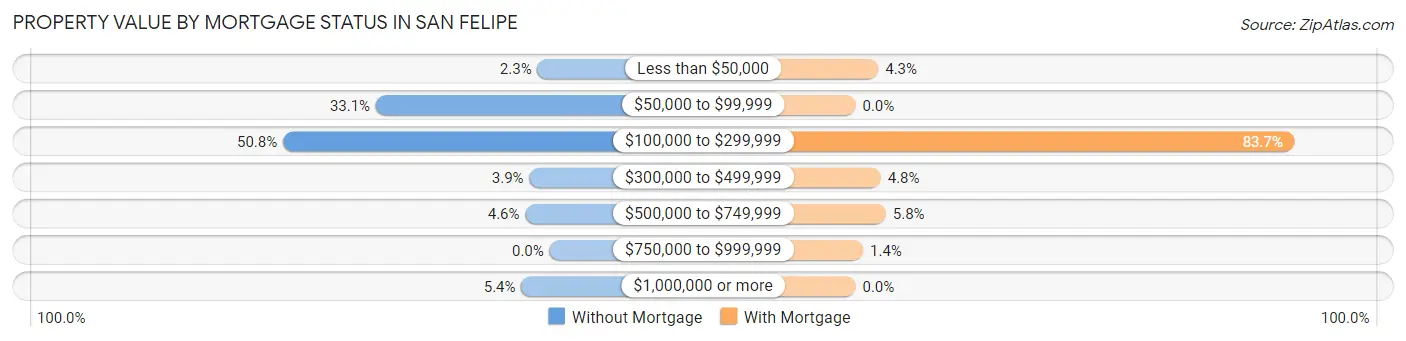
| Property Value | Without Mortgage | With Mortgage |
| Less than $50,000 | 3 (2.3%) | 9 (4.3%) |
| $50,000 to $99,999 | 43 (33.1%) | 0 (0.0%) |
| $100,000 to $299,999 | 66 (50.8%) | 174 (83.7%) |
| $300,000 to $499,999 | 5 (3.8%) | 10 (4.8%) |
| $500,000 to $749,999 | 6 (4.6%) | 12 (5.8%) |
| $750,000 to $999,999 | 0 (0.0%) | 3 (1.4%) |
| $1,000,000 or more | 7 (5.4%) | 0 (0.0%) |
| Total | 130 (100.0%) | 208 (100.0%) |
Household Income by Mortgage Status in San Felipe
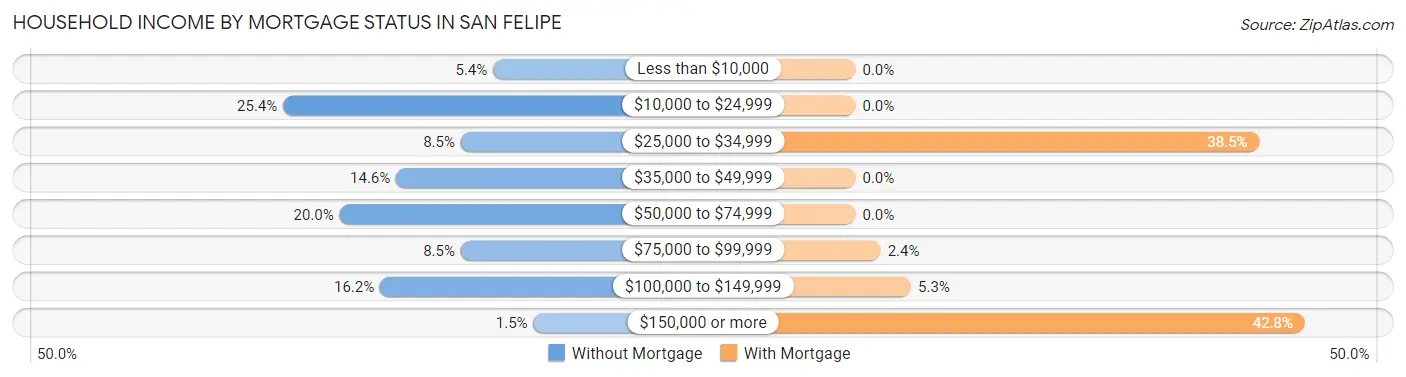
| Household Income | Without Mortgage | With Mortgage |
| Less than $10,000 | 7 (5.4%) | 0 (0.0%) |
| $10,000 to $24,999 | 33 (25.4%) | 0 (0.0%) |
| $25,000 to $34,999 | 11 (8.5%) | 80 (38.5%) |
| $35,000 to $49,999 | 19 (14.6%) | 0 (0.0%) |
| $50,000 to $74,999 | 26 (20.0%) | 0 (0.0%) |
| $75,000 to $99,999 | 11 (8.5%) | 5 (2.4%) |
| $100,000 to $149,999 | 21 (16.2%) | 11 (5.3%) |
| $150,000 or more | 2 (1.5%) | 89 (42.8%) |
| Total | 130 (100.0%) | 208 (100.0%) |
Property Value to Household Income Ratio in San Felipe
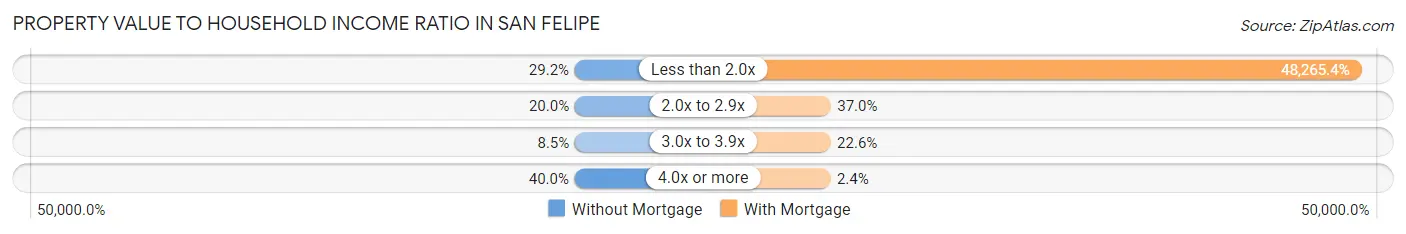
| Value-to-Income Ratio | Without Mortgage | With Mortgage |
| Less than 2.0x | 38 (29.2%) | 100,392 (48,265.4%) |
| 2.0x to 2.9x | 26 (20.0%) | 77 (37.0%) |
| 3.0x to 3.9x | 11 (8.5%) | 47 (22.6%) |
| 4.0x or more | 52 (40.0%) | 5 (2.4%) |
| Total | 130 (100.0%) | 208 (100.0%) |
Real Estate Taxes by Mortgage Status in San Felipe
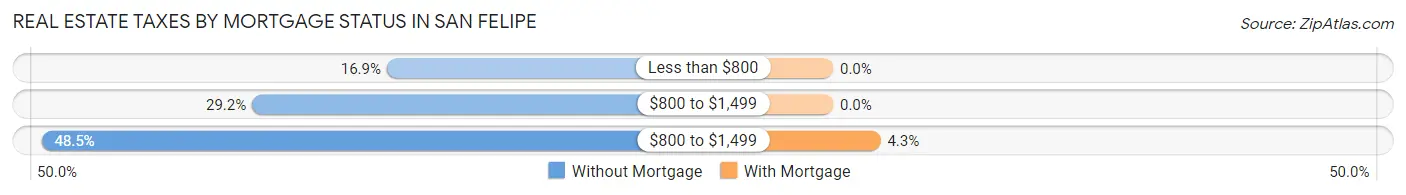
| Property Taxes | Without Mortgage | With Mortgage |
| Less than $800 | 22 (16.9%) | 0 (0.0%) |
| $800 to $1,499 | 38 (29.2%) | 0 (0.0%) |
| $800 to $1,499 | 63 (48.5%) | 9 (4.3%) |
| Total | 130 (100.0%) | 208 (100.0%) |
Health & Disability in San Felipe
Health Insurance Coverage by Age in San Felipe
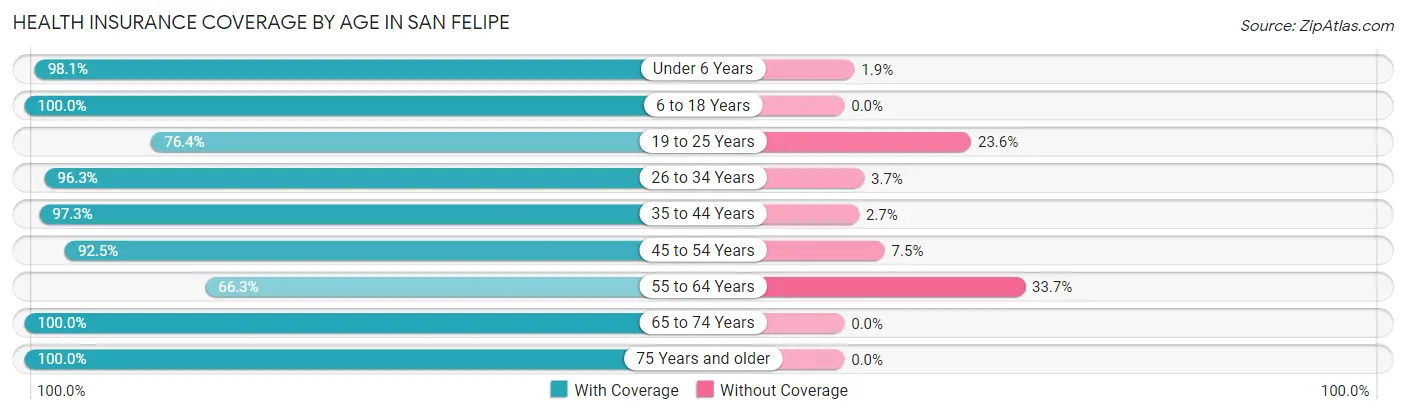
| Age Bracket | With Coverage | Without Coverage |
| Under 6 Years | 104 (98.1%) | 2 (1.9%) |
| 6 to 18 Years | 278 (100.0%) | 0 (0.0%) |
| 19 to 25 Years | 42 (76.4%) | 13 (23.6%) |
| 26 to 34 Years | 156 (96.3%) | 6 (3.7%) |
| 35 to 44 Years | 71 (97.3%) | 2 (2.7%) |
| 45 to 54 Years | 135 (92.5%) | 11 (7.5%) |
| 55 to 64 Years | 59 (66.3%) | 30 (33.7%) |
| 65 to 74 Years | 79 (100.0%) | 0 (0.0%) |
| 75 Years and older | 51 (100.0%) | 0 (0.0%) |
| Total | 975 (93.8%) | 64 (6.2%) |
Health Insurance Coverage by Citizenship Status in San Felipe
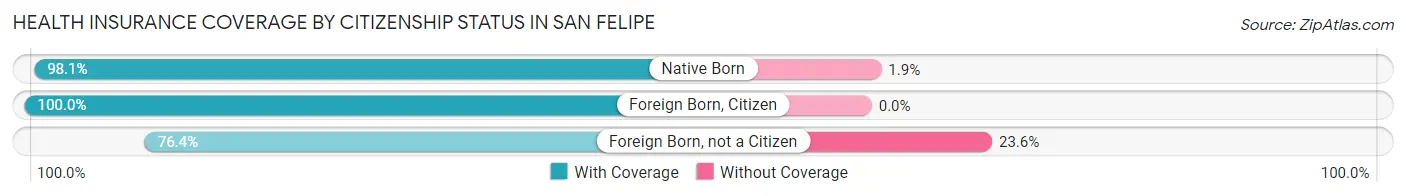
| Citizenship Status | With Coverage | Without Coverage |
| Native Born | 104 (98.1%) | 2 (1.9%) |
| Foreign Born, Citizen | 278 (100.0%) | 0 (0.0%) |
| Foreign Born, not a Citizen | 42 (76.4%) | 13 (23.6%) |
Health Insurance Coverage by Household Income in San Felipe
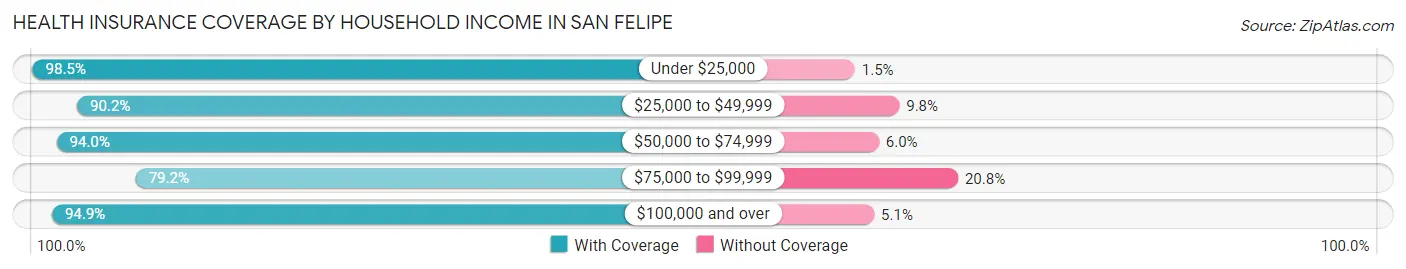
| Household Income | With Coverage | Without Coverage |
| Under $25,000 | 261 (98.5%) | 4 (1.5%) |
| $25,000 to $49,999 | 156 (90.2%) | 17 (9.8%) |
| $50,000 to $74,999 | 94 (94.0%) | 6 (6.0%) |
| $75,000 to $99,999 | 57 (79.2%) | 15 (20.8%) |
| $100,000 and over | 407 (94.9%) | 22 (5.1%) |
Public vs Private Health Insurance Coverage by Age in San Felipe
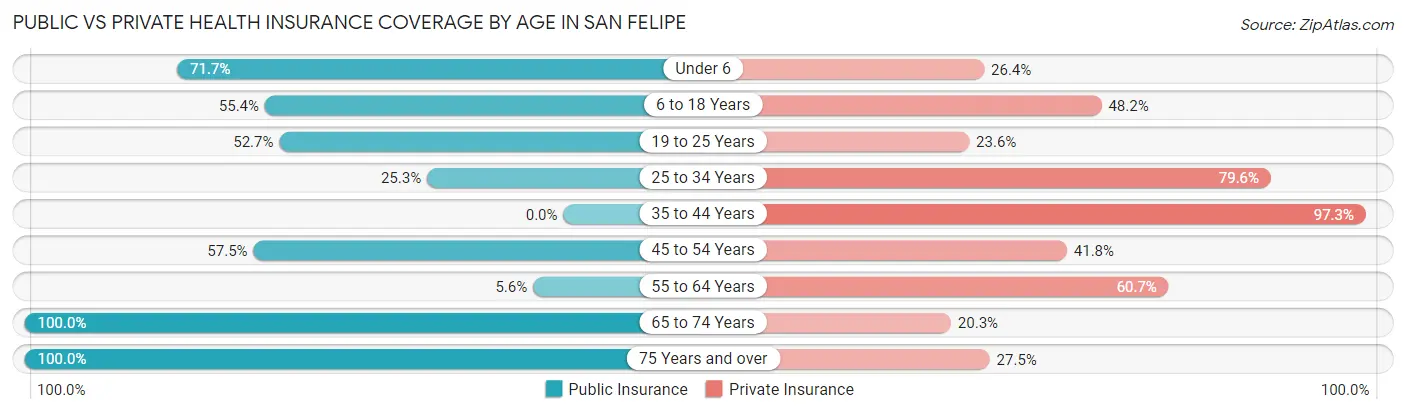
| Age Bracket | Public Insurance | Private Insurance |
| Under 6 | 76 (71.7%) | 28 (26.4%) |
| 6 to 18 Years | 154 (55.4%) | 134 (48.2%) |
| 19 to 25 Years | 29 (52.7%) | 13 (23.6%) |
| 25 to 34 Years | 41 (25.3%) | 129 (79.6%) |
| 35 to 44 Years | 0 (0.0%) | 71 (97.3%) |
| 45 to 54 Years | 84 (57.5%) | 61 (41.8%) |
| 55 to 64 Years | 5 (5.6%) | 54 (60.7%) |
| 65 to 74 Years | 79 (100.0%) | 16 (20.3%) |
| 75 Years and over | 51 (100.0%) | 14 (27.5%) |
| Total | 519 (49.9%) | 520 (50.0%) |
Disability Status by Sex by Age in San Felipe
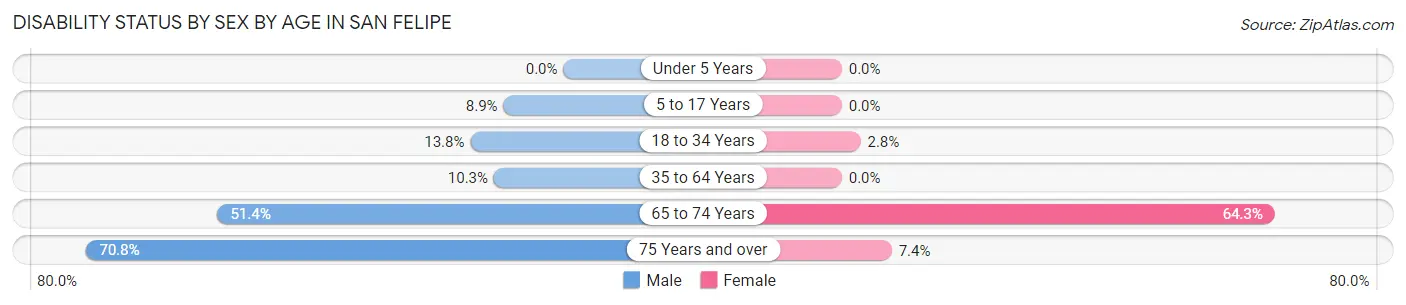
| Age Bracket | Male | Female |
| Under 5 Years | 0 (0.0%) | 0 (0.0%) |
| 5 to 17 Years | 17 (8.9%) | 0 (0.0%) |
| 18 to 34 Years | 17 (13.8%) | 3 (2.8%) |
| 35 to 64 Years | 13 (10.3%) | 0 (0.0%) |
| 65 to 74 Years | 19 (51.3%) | 27 (64.3%) |
| 75 Years and over | 17 (70.8%) | 2 (7.4%) |
Disability Class by Sex by Age in San Felipe
Disability Class: Hearing Difficulty
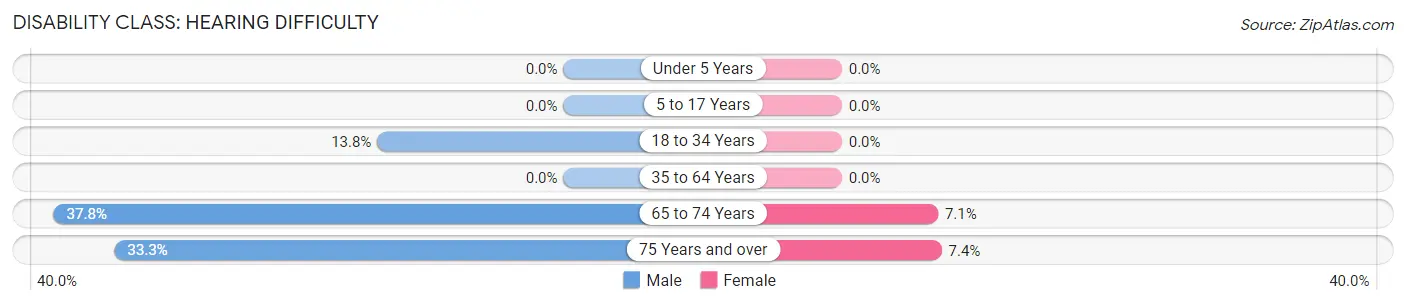
| Age Bracket | Male | Female |
| Under 5 Years | 0 (0.0%) | 0 (0.0%) |
| 5 to 17 Years | 0 (0.0%) | 0 (0.0%) |
| 18 to 34 Years | 17 (13.8%) | 0 (0.0%) |
| 35 to 64 Years | 0 (0.0%) | 0 (0.0%) |
| 65 to 74 Years | 14 (37.8%) | 3 (7.1%) |
| 75 Years and over | 8 (33.3%) | 2 (7.4%) |
Disability Class: Vision Difficulty
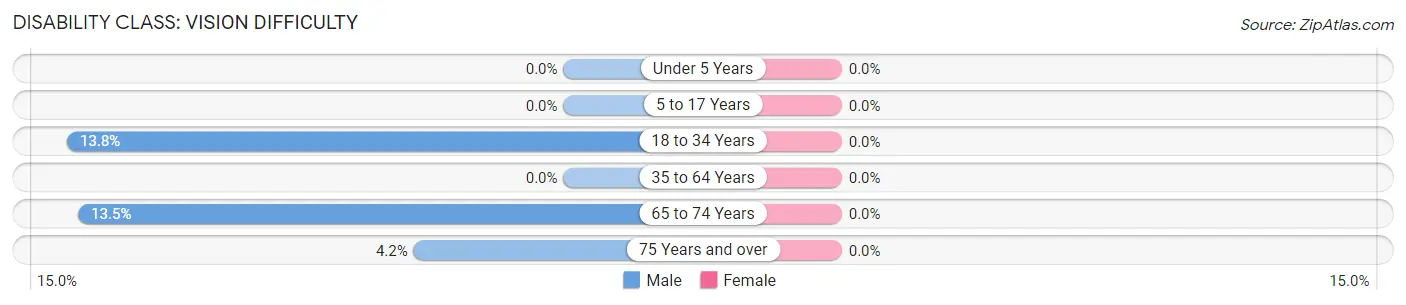
| Age Bracket | Male | Female |
| Under 5 Years | 0 (0.0%) | 0 (0.0%) |
| 5 to 17 Years | 0 (0.0%) | 0 (0.0%) |
| 18 to 34 Years | 17 (13.8%) | 0 (0.0%) |
| 35 to 64 Years | 0 (0.0%) | 0 (0.0%) |
| 65 to 74 Years | 5 (13.5%) | 0 (0.0%) |
| 75 Years and over | 1 (4.2%) | 0 (0.0%) |
Disability Class: Cognitive Difficulty
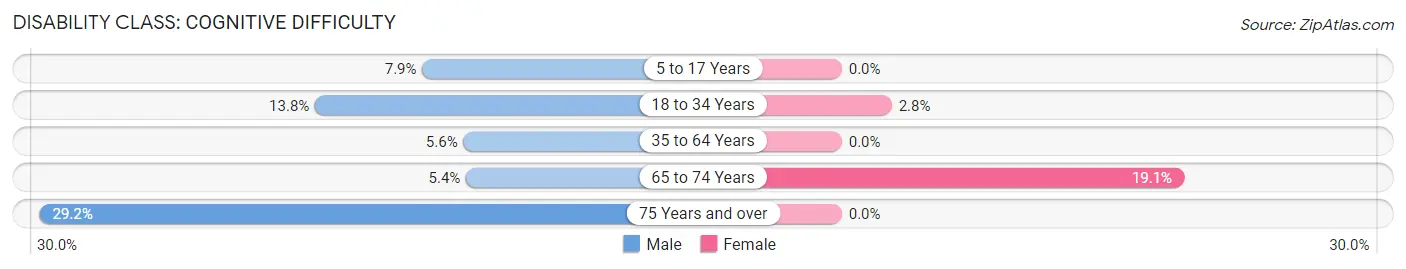
| Age Bracket | Male | Female |
| 5 to 17 Years | 15 (7.9%) | 0 (0.0%) |
| 18 to 34 Years | 17 (13.8%) | 3 (2.8%) |
| 35 to 64 Years | 7 (5.6%) | 0 (0.0%) |
| 65 to 74 Years | 2 (5.4%) | 8 (19.1%) |
| 75 Years and over | 7 (29.2%) | 0 (0.0%) |
Disability Class: Ambulatory Difficulty
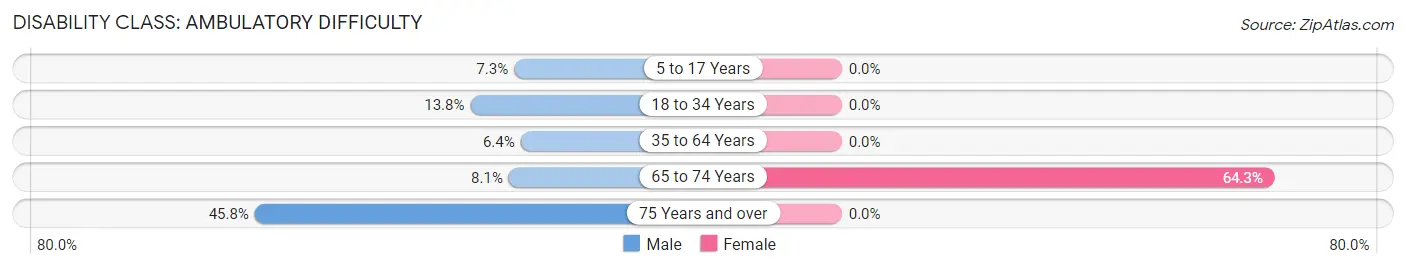
| Age Bracket | Male | Female |
| 5 to 17 Years | 14 (7.3%) | 0 (0.0%) |
| 18 to 34 Years | 17 (13.8%) | 0 (0.0%) |
| 35 to 64 Years | 8 (6.4%) | 0 (0.0%) |
| 65 to 74 Years | 3 (8.1%) | 27 (64.3%) |
| 75 Years and over | 11 (45.8%) | 0 (0.0%) |
Disability Class: Self-Care Difficulty
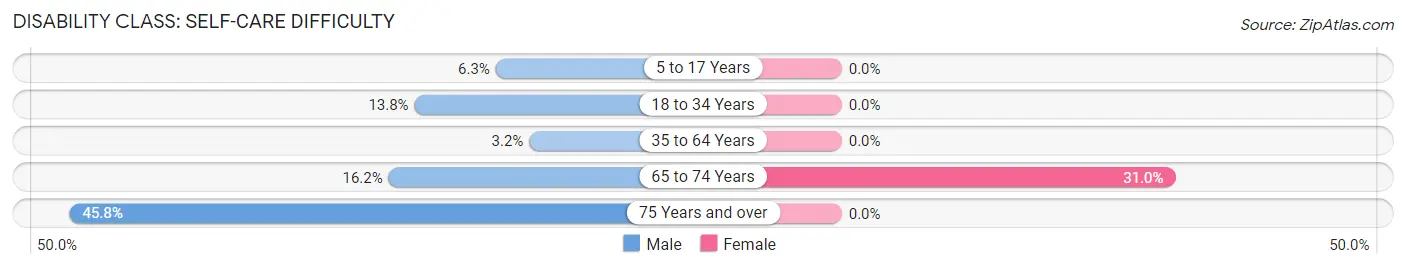
| Age Bracket | Male | Female |
| 5 to 17 Years | 12 (6.3%) | 0 (0.0%) |
| 18 to 34 Years | 17 (13.8%) | 0 (0.0%) |
| 35 to 64 Years | 4 (3.2%) | 0 (0.0%) |
| 65 to 74 Years | 6 (16.2%) | 13 (30.9%) |
| 75 Years and over | 11 (45.8%) | 0 (0.0%) |
Technology Access in San Felipe
Computing Device Access in San Felipe
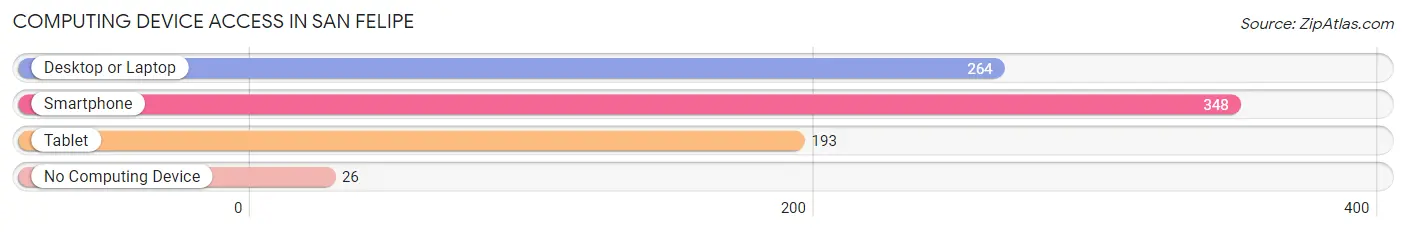
| Device Type | # Households | % Households |
| Desktop or Laptop | 264 | 66.5% |
| Smartphone | 348 | 87.7% |
| Tablet | 193 | 48.6% |
| No Computing Device | 26 | 6.6% |
| Total | 397 | 100.0% |
Internet Access in San Felipe
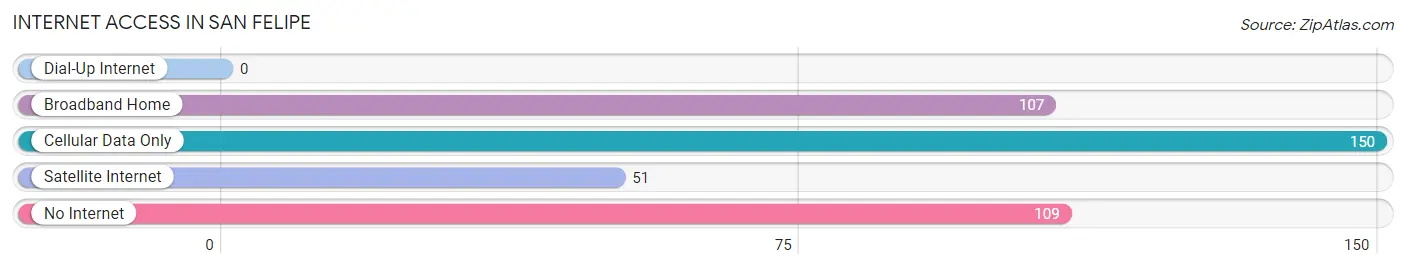
| Internet Type | # Households | % Households |
| Dial-Up Internet | 0 | 0.0% |
| Broadband Home | 107 | 27.0% |
| Cellular Data Only | 150 | 37.8% |
| Satellite Internet | 51 | 12.9% |
| No Internet | 109 | 27.5% |
| Total | 397 | 100.0% |
San Felipe Summary
History
The city of San Felipe, Texas is located in Austin County, Texas, and is part of the Greater Houston metropolitan area. The city was founded in 1824 by Stephen F. Austin, who named it after Saint Philip, the patron saint of Spain. The city was originally a trading post for the local Native American tribes, and was later used as a stopover for travelers heading to Houston.
In 1836, the city was the site of the Battle of San Jacinto, which was a decisive victory for the Texan forces in the Texas Revolution. After the battle, the city became a popular destination for settlers, and the population grew rapidly. By the late 1800s, the city had become a major center for cotton production, and the economy was largely based on agriculture.
In the early 1900s, the city began to diversify its economy, and the population continued to grow. In the 1950s, the city was incorporated, and the population reached its peak in the 1970s. Since then, the population has declined slightly, but the city remains an important part of the Greater Houston area.
Geography
San Felipe is located in Austin County, Texas, and is part of the Greater Houston metropolitan area. The city is situated on the banks of the San Jacinto River, and is surrounded by rolling hills and wooded areas. The city is located about 40 miles west of downtown Houston, and is accessible via Interstate 10.
The climate in San Felipe is generally mild, with hot summers and mild winters. The average annual temperature is around 70 degrees Fahrenheit, and the average annual precipitation is around 40 inches.
Economy
The economy of San Felipe is largely based on agriculture and tourism. The city is home to several large farms, and the surrounding area is known for its production of cotton, corn, and other crops. The city is also home to several wineries, and the local wine industry is a major contributor to the economy.
In addition to agriculture, the city is home to several businesses, including manufacturing, retail, and service industries. The city is also home to several educational institutions, including a community college and a technical school.
Demographics
As of the 2010 census, the population of San Felipe was 2,837. The population is largely Hispanic, with around 75% of the population identifying as Hispanic or Latino. The median household income is around $35,000, and the median age is around 35 years old. The city is home to a large number of families, with around 40% of households having children under the age of 18.
Conclusion
San Felipe, Texas is a small city located in Austin County, Texas, and is part of the Greater Houston metropolitan area. The city was founded in 1824, and has a long history of agriculture and tourism. The population is largely Hispanic, and the economy is largely based on agriculture and tourism. The city is home to several businesses, educational institutions, and wineries, and is an important part of the Greater Houston area.
Common Questions
What is Per Capita Income in San Felipe?
Per Capita income in San Felipe is $26,794.
What is the Median Family Income in San Felipe?
Median Family Income in San Felipe is $54,250.
What is the Median Household income in San Felipe?
Median Household Income in San Felipe is $54,013.
What is Income or Wage Gap in San Felipe?
Income or Wage Gap in San Felipe is 79.4%.
Women in San Felipe earn 20.6 cents for every dollar earned by a man.
What is Inequality or Gini Index in San Felipe?
Inequality or Gini Index in San Felipe is 0.44.
What is the Total Population of San Felipe?
Total Population of San Felipe is 1,039.
What is the Total Male Population of San Felipe?
Total Male Population of San Felipe is 541.
What is the Total Female Population of San Felipe?
Total Female Population of San Felipe is 498.
What is the Ratio of Males per 100 Females in San Felipe?
There are 108.63 Males per 100 Females in San Felipe.
What is the Ratio of Females per 100 Males in San Felipe?
There are 92.05 Females per 100 Males in San Felipe.
What is the Median Population Age in San Felipe?
Median Population Age in San Felipe is 33.1 Years.
What is the Average Family Size in San Felipe
Average Family Size in San Felipe is 2.9 People.
What is the Average Household Size in San Felipe
Average Household Size in San Felipe is 2.6 People.
How Large is the Labor Force in San Felipe?
There are 416 People in the Labor Forcein in San Felipe.
What is the Percentage of People in the Labor Force in San Felipe?
60.3% of People are in the Labor Force in San Felipe.
What is the Unemployment Rate in San Felipe?
Unemployment Rate in San Felipe is 3.8%.