Zip Codes with the Highest Percentage of Population Employed in Administrative & Support Services in Granbury, TX
RELATED REPORTS & OPTIONS
Administrative & Support Services
Granbury
Compare Zip Codes
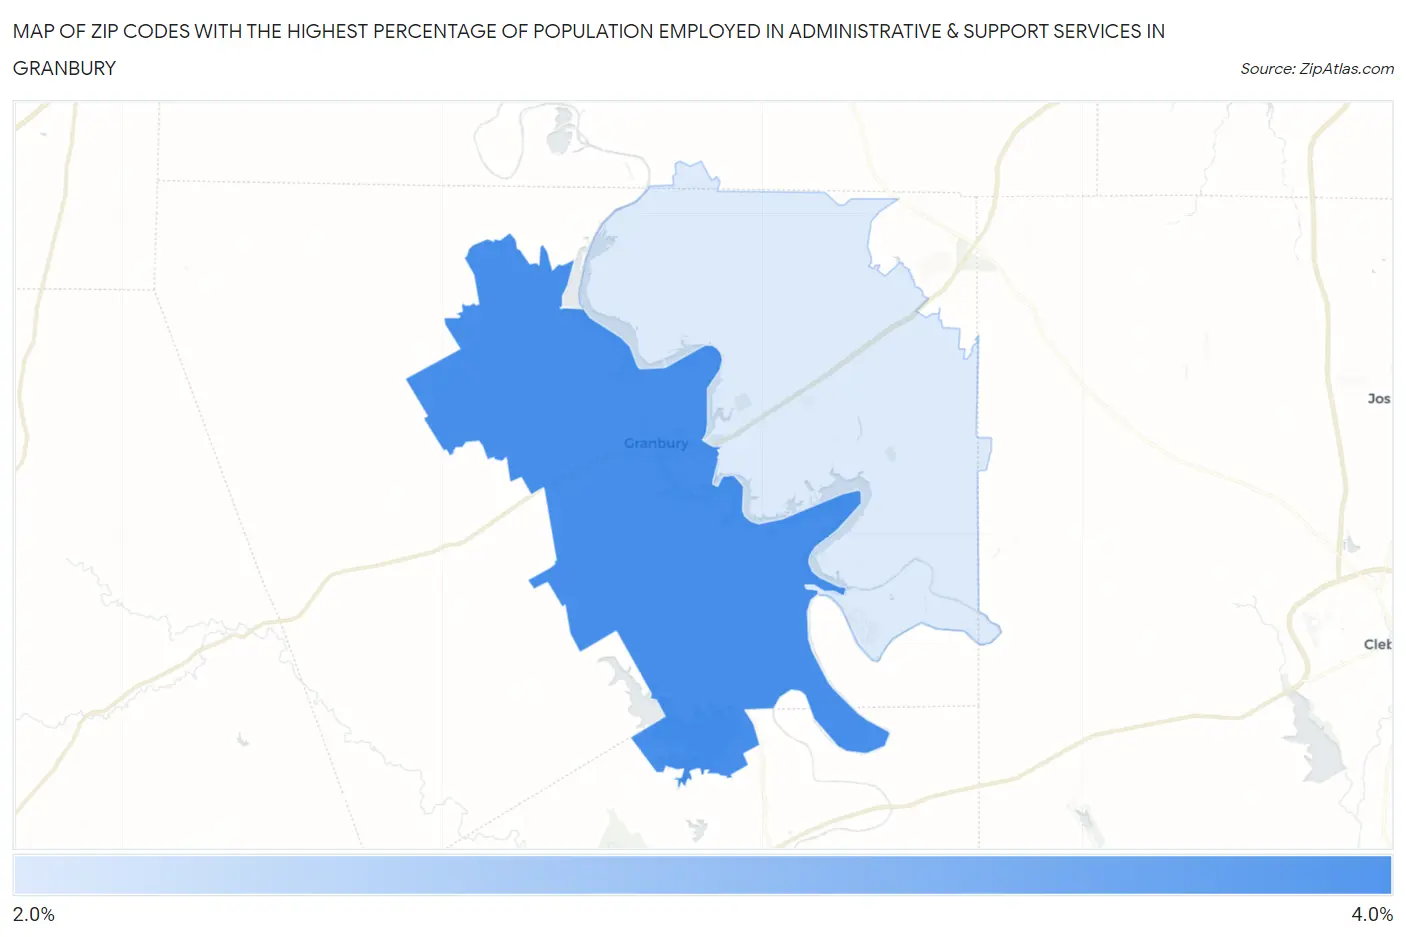
Map of Zip Codes with the Highest Percentage of Population Employed in Administrative & Support Services in Granbury
2.1%
3.8%
Zip Codes with the Highest Percentage of Population Employed in Administrative & Support Services in Granbury, TX
| Zip Code | % Employed | vs State | vs National | |
| 1. | 76048 | 3.8% | 4.4%(-0.623)#794 | 4.1%(-0.356)#11,564 |
| 2. | 76049 | 2.1% | 4.4%(-2.31)#1,250 | 4.1%(-2.05)#20,121 |
1
Common Questions
What are the Top Zip Codes with the Highest Percentage of Population Employed in Administrative & Support Services in Granbury, TX?
Top Zip Codes with the Highest Percentage of Population Employed in Administrative & Support Services in Granbury, TX are:
What zip code has the Highest Percentage of Population Employed in Administrative & Support Services in Granbury, TX?
76048 has the Highest Percentage of Population Employed in Administrative & Support Services in Granbury, TX with 3.8%.
What is the Percentage of Population Employed in Administrative & Support Services in Granbury, TX?
Percentage of Population Employed in Administrative & Support Services in Granbury is 3.0%.
What is the Percentage of Population Employed in Administrative & Support Services in Texas?
Percentage of Population Employed in Administrative & Support Services in Texas is 4.4%.
What is the Percentage of Population Employed in Administrative & Support Services in the United States?
Percentage of Population Employed in Administrative & Support Services in the United States is 4.1%.