Zip Codes with the Highest Percentage of Population Employed in Administrative & Support Services in Amarillo, TX
RELATED REPORTS & OPTIONS
Administrative & Support Services
Amarillo
Compare Zip Codes
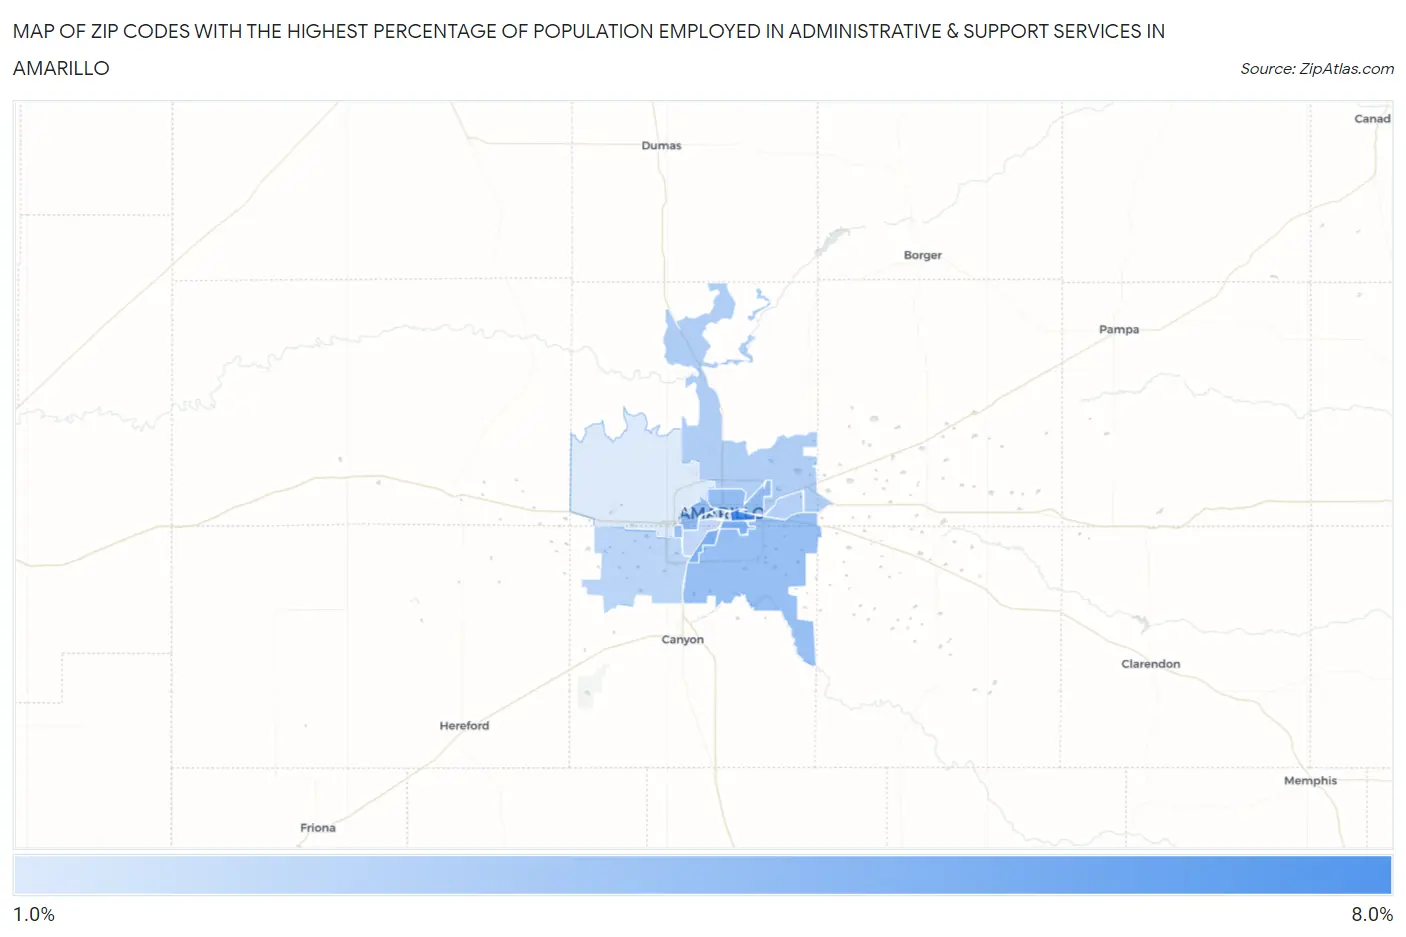
Map of Zip Codes with the Highest Percentage of Population Employed in Administrative & Support Services in Amarillo
1.7%
7.4%
Zip Codes with the Highest Percentage of Population Employed in Administrative & Support Services in Amarillo, TX
| Zip Code | % Employed | vs State | vs National | |
| 1. | 79104 | 7.4% | 4.4%(+2.99)#196 | 4.1%(+3.25)#2,790 |
| 2. | 79110 | 5.4% | 4.4%(+0.948)#450 | 4.1%(+1.21)#6,160 |
| 3. | 79103 | 5.3% | 4.4%(+0.881)#458 | 4.1%(+1.15)#6,332 |
| 4. | 79106 | 4.5% | 4.4%(+0.117)#621 | 4.1%(+0.384)#8,614 |
| 5. | 79107 | 4.5% | 4.4%(+0.051)#632 | 4.1%(+0.317)#8,828 |
| 6. | 79118 | 4.3% | 4.4%(-0.141)#671 | 4.1%(+0.125)#9,541 |
| 7. | 79121 | 4.1% | 4.4%(-0.329)#723 | 4.1%(-0.062)#10,291 |
| 8. | 79108 | 3.5% | 4.4%(-0.959)#890 | 4.1%(-0.693)#13,178 |
| 9. | 79111 | 3.2% | 4.4%(-1.19)#957 | 4.1%(-0.919)#14,299 |
| 10. | 79101 | 3.2% | 4.4%(-1.23)#976 | 4.1%(-0.960)#14,523 |
| 11. | 79119 | 3.0% | 4.4%(-1.41)#1,029 | 4.1%(-1.14)#15,430 |
| 12. | 79102 | 2.8% | 4.4%(-1.61)#1,081 | 4.1%(-1.34)#16,491 |
| 13. | 79109 | 2.8% | 4.4%(-1.66)#1,095 | 4.1%(-1.40)#16,814 |
| 14. | 79124 | 1.7% | 4.4%(-2.70)#1,342 | 4.1%(-2.44)#21,898 |
1
Common Questions
What are the Top 10 Zip Codes with the Highest Percentage of Population Employed in Administrative & Support Services in Amarillo, TX?
Top 10 Zip Codes with the Highest Percentage of Population Employed in Administrative & Support Services in Amarillo, TX are:
What zip code has the Highest Percentage of Population Employed in Administrative & Support Services in Amarillo, TX?
79104 has the Highest Percentage of Population Employed in Administrative & Support Services in Amarillo, TX with 7.4%.
What is the Percentage of Population Employed in Administrative & Support Services in Amarillo, TX?
Percentage of Population Employed in Administrative & Support Services in Amarillo is 4.0%.
What is the Percentage of Population Employed in Administrative & Support Services in Texas?
Percentage of Population Employed in Administrative & Support Services in Texas is 4.4%.
What is the Percentage of Population Employed in Administrative & Support Services in the United States?
Percentage of Population Employed in Administrative & Support Services in the United States is 4.1%.