Cottonwood Shores, TX Map & Demographics
Cottonwood Shores Map
Cottonwood Shores Overview
$22,296
PER CAPITA INCOME
$62,431
AVG FAMILY INCOME
$60,817
AVG HOUSEHOLD INCOME
13.2%
WAGE / INCOME GAP [ % ]
86.8¢/ $1
WAGE / INCOME GAP [ $ ]
0.33
INEQUALITY / GINI INDEX
1,481
TOTAL POPULATION
727
MALE POPULATION
754
FEMALE POPULATION
96.42
MALES / 100 FEMALES
103.71
FEMALES / 100 MALES
34.8
MEDIAN AGE
4.0
AVG FAMILY SIZE
3.4
AVG HOUSEHOLD SIZE
864
LABOR FORCE [ PEOPLE ]
75.5%
PERCENT IN LABOR FORCE
2.5%
UNEMPLOYMENT RATE
Cottonwood Shores Area Codes
Income in Cottonwood Shores
Income Overview in Cottonwood Shores
Per Capita Income in Cottonwood Shores is $22,296, while median incomes of families and households are $62,431 and $60,817 respectively.
| Characteristic | Number | Measure |
| Per Capita Income | 1,481 | $22,296 |
| Median Family Income | 315 | $62,431 |
| Mean Family Income | 315 | $73,343 |
| Median Household Income | 439 | $60,817 |
| Mean Household Income | 439 | $70,374 |
| Income Deficit | 315 | $0 |
| Wage / Income Gap (%) | 1,481 | 13.16% |
| Wage / Income Gap ($) | 1,481 | 86.84¢ per $1 |
| Gini / Inequality Index | 1,481 | 0.33 |
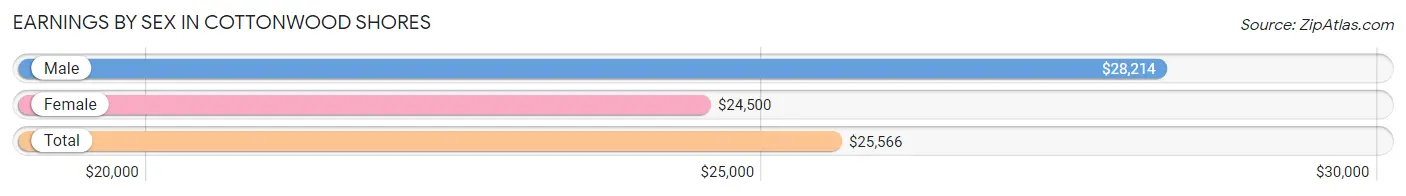
Earnings by Sex in Cottonwood Shores
Average Earnings in Cottonwood Shores are $25,566, $28,214 for men and $24,500 for women, a difference of 13.2%.
| Sex | Number | Average Earnings |
| Male | 444 (50.2%) | $28,214 |
| Female | 440 (49.8%) | $24,500 |
| Total | 884 (100.0%) | $25,566 |
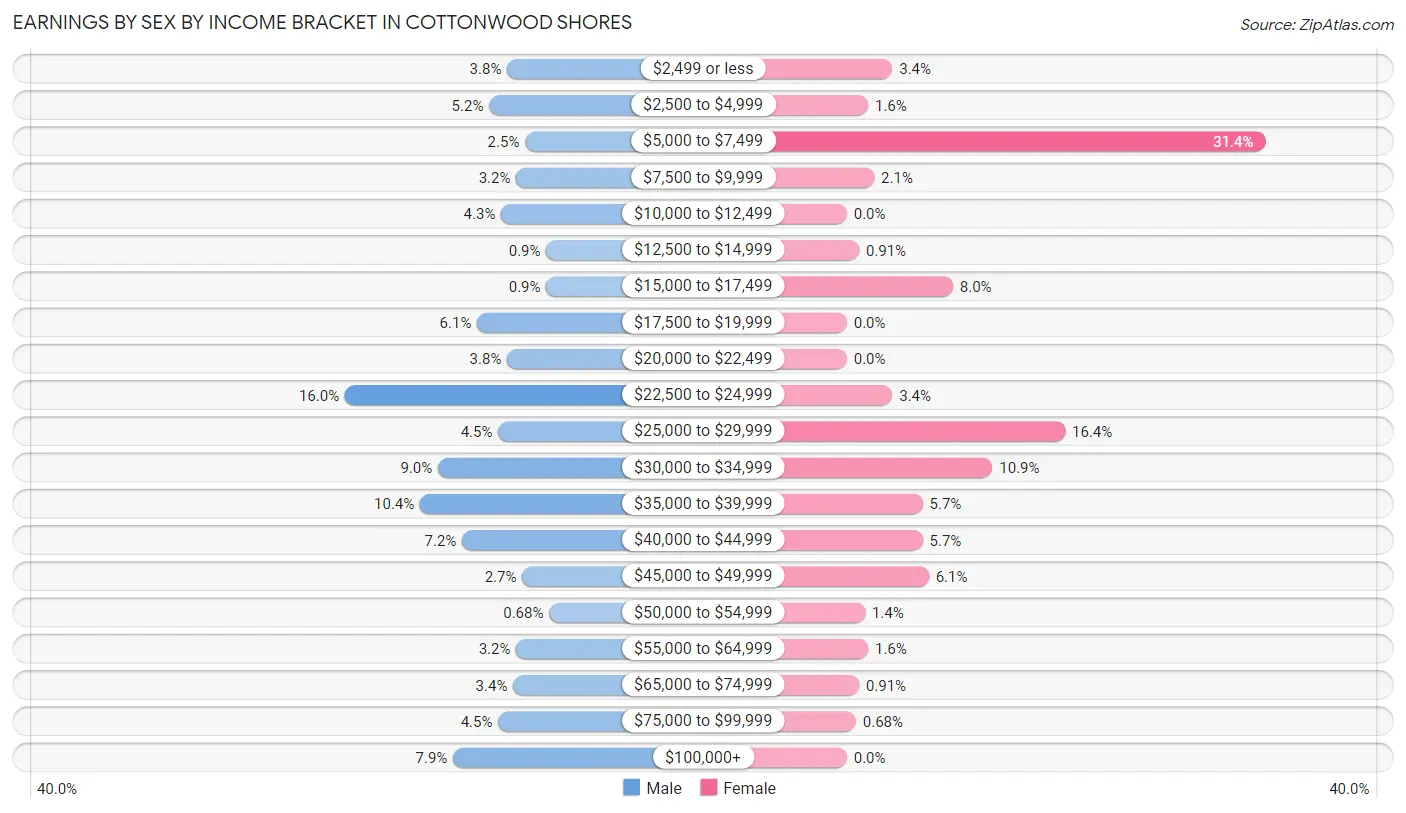
Earnings by Sex by Income Bracket in Cottonwood Shores
The most common earnings brackets in Cottonwood Shores are $22,500 to $24,999 for men (71 | 16.0%) and $5,000 to $7,499 for women (138 | 31.4%).
| Income | Male | Female |
| $2,499 or less | 17 (3.8%) | 15 (3.4%) |
| $2,500 to $4,999 | 23 (5.2%) | 7 (1.6%) |
| $5,000 to $7,499 | 11 (2.5%) | 138 (31.4%) |
| $7,500 to $9,999 | 14 (3.2%) | 9 (2.1%) |
| $10,000 to $12,499 | 19 (4.3%) | 0 (0.0%) |
| $12,500 to $14,999 | 4 (0.9%) | 4 (0.9%) |
| $15,000 to $17,499 | 4 (0.9%) | 35 (8.0%) |
| $17,500 to $19,999 | 27 (6.1%) | 0 (0.0%) |
| $20,000 to $22,499 | 17 (3.8%) | 0 (0.0%) |
| $22,500 to $24,999 | 71 (16.0%) | 15 (3.4%) |
| $25,000 to $29,999 | 20 (4.5%) | 72 (16.4%) |
| $30,000 to $34,999 | 40 (9.0%) | 48 (10.9%) |
| $35,000 to $39,999 | 46 (10.4%) | 25 (5.7%) |
| $40,000 to $44,999 | 32 (7.2%) | 25 (5.7%) |
| $45,000 to $49,999 | 12 (2.7%) | 27 (6.1%) |
| $50,000 to $54,999 | 3 (0.7%) | 6 (1.4%) |
| $55,000 to $64,999 | 14 (3.2%) | 7 (1.6%) |
| $65,000 to $74,999 | 15 (3.4%) | 4 (0.9%) |
| $75,000 to $99,999 | 20 (4.5%) | 3 (0.7%) |
| $100,000+ | 35 (7.9%) | 0 (0.0%) |
| Total | 444 (100.0%) | 440 (100.0%) |
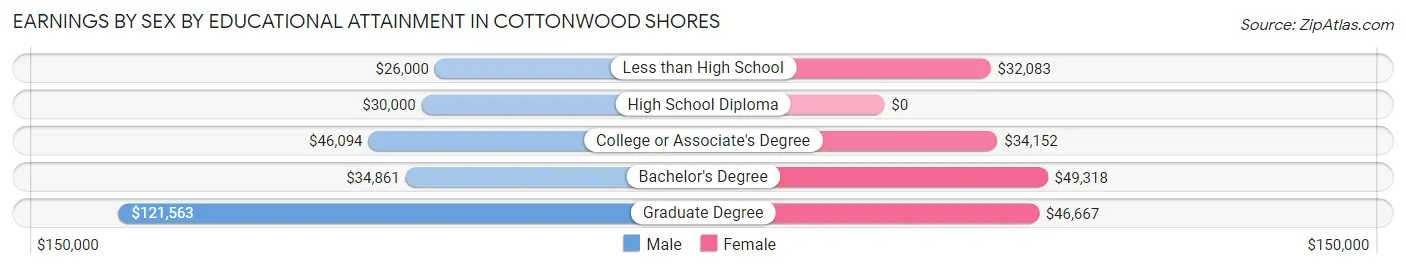
Earnings by Sex by Educational Attainment in Cottonwood Shores
Average earnings in Cottonwood Shores are $34,181 for men and $27,031 for women, a difference of 20.9%. Men with an educational attainment of graduate degree enjoy the highest average annual earnings of $121,563, while those with less than high school education earn the least with $26,000. Women with an educational attainment of bachelor's degree earn the most with the average annual earnings of $49,318, while those with less than high school education have the smallest earnings of $32,083.
| Educational Attainment | Male Income | Female Income |
| Less than High School | $26,000 | $32,083 |
| High School Diploma | $30,000 | $0 |
| College or Associate's Degree | $46,094 | $34,152 |
| Bachelor's Degree | $34,861 | $49,318 |
| Graduate Degree | $121,563 | $46,667 |
| Total | $34,181 | $27,031 |
Family Income in Cottonwood Shores
Family Income Brackets in Cottonwood Shores
According to the Cottonwood Shores family income data, there are 103 families falling into the $35,000 to $49,999 income range, which is the most common income bracket and makes up 32.7% of all families.
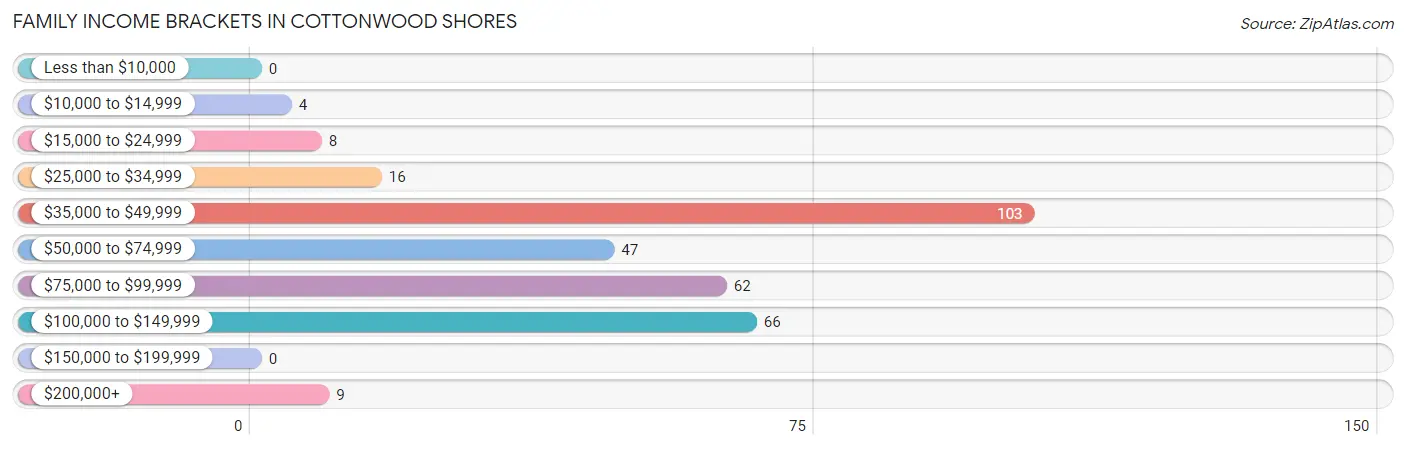
| Income Bracket | # Families | % Families |
| Less than $10,000 | 0 | 0.0% |
| $10,000 to $14,999 | 4 | 1.3% |
| $15,000 to $24,999 | 8 | 2.5% |
| $25,000 to $34,999 | 16 | 5.1% |
| $35,000 to $49,999 | 103 | 32.7% |
| $50,000 to $74,999 | 47 | 14.9% |
| $75,000 to $99,999 | 62 | 19.7% |
| $100,000 to $149,999 | 66 | 21.0% |
| $150,000 to $199,999 | 0 | 0.0% |
| $200,000+ | 9 | 2.9% |
Family Income by Famaliy Size in Cottonwood Shores
6-person families (30 | 9.5%) account for the highest median family income in Cottonwood Shores with $111,042 per family, while 2-person families (130 | 41.3%) have the highest median income of $31,072 per family member.
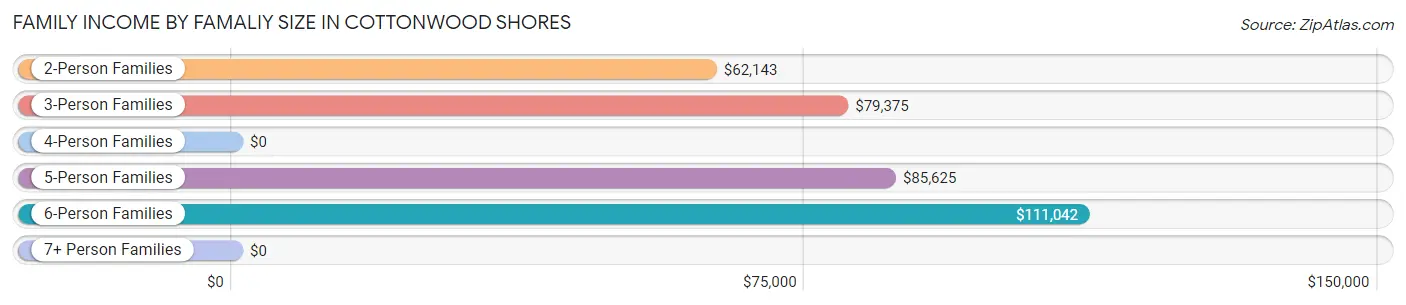
| Income Bracket | # Families | Median Income |
| 2-Person Families | 130 (41.3%) | $62,143 |
| 3-Person Families | 50 (15.9%) | $79,375 |
| 4-Person Families | 28 (8.9%) | $0 |
| 5-Person Families | 24 (7.6%) | $85,625 |
| 6-Person Families | 30 (9.5%) | $111,042 |
| 7+ Person Families | 53 (16.8%) | $0 |
| Total | 315 (100.0%) | $62,431 |
Family Income by Number of Earners in Cottonwood Shores
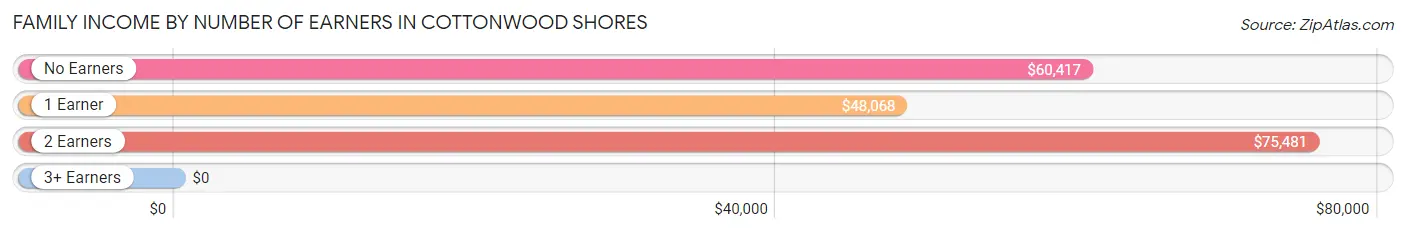
| Number of Earners | # Families | Median Income |
| No Earners | 23 (7.3%) | $60,417 |
| 1 Earner | 71 (22.5%) | $48,068 |
| 2 Earners | 111 (35.2%) | $75,481 |
| 3+ Earners | 110 (34.9%) | $0 |
| Total | 315 (100.0%) | $62,431 |
Household Income in Cottonwood Shores
Household Income Brackets in Cottonwood Shores
With 113 households falling in the category, the $35,000 to $49,999 income range is the most frequent in Cottonwood Shores, accounting for 25.7% of all households. In contrast, only 9 households (2.1%) fall into the $200,000+ income bracket, making it the least populous group.
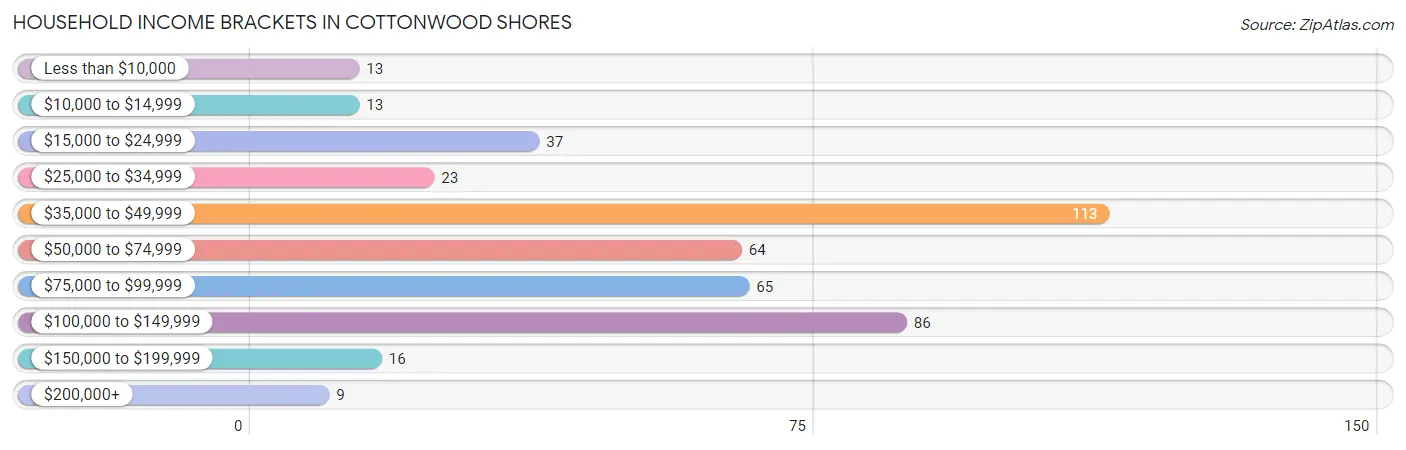
| Income Bracket | # Households | % Households |
| Less than $10,000 | 13 | 3.0% |
| $10,000 to $14,999 | 13 | 3.0% |
| $15,000 to $24,999 | 37 | 8.4% |
| $25,000 to $34,999 | 23 | 5.2% |
| $35,000 to $49,999 | 113 | 25.7% |
| $50,000 to $74,999 | 64 | 14.6% |
| $75,000 to $99,999 | 65 | 14.8% |
| $100,000 to $149,999 | 86 | 19.6% |
| $150,000 to $199,999 | 16 | 3.6% |
| $200,000+ | 9 | 2.1% |
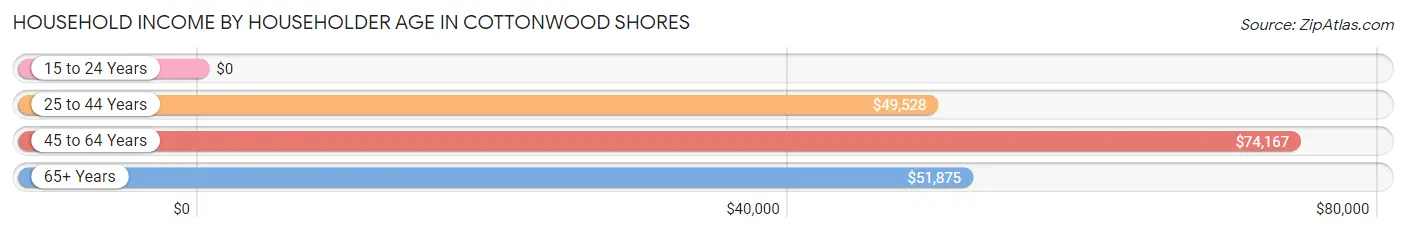
Household Income by Householder Age in Cottonwood Shores
The median household income in Cottonwood Shores is $60,817, with the highest median household income of $74,167 found in the 45 to 64 years age bracket for the primary householder. A total of 178 households (40.6%) fall into this category. Meanwhile, the 15 to 24 years age bracket for the primary householder has the lowest median household income of $0, with 6 households (1.4%) in this group.
| Income Bracket | # Households | Median Income |
| 15 to 24 Years | 6 (1.4%) | $0 |
| 25 to 44 Years | 152 (34.6%) | $49,528 |
| 45 to 64 Years | 178 (40.6%) | $74,167 |
| 65+ Years | 103 (23.5%) | $51,875 |
| Total | 439 (100.0%) | $60,817 |
Poverty in Cottonwood Shores
Income Below Poverty by Sex and Age in Cottonwood Shores
With 5.0% poverty level for males and 6.8% for females among the residents of Cottonwood Shores, 55 to 64 year old males and 65 to 74 year old females are the most vulnerable to poverty, with 16 males (16.8%) and 10 females (22.2%) in their respective age groups living below the poverty level.
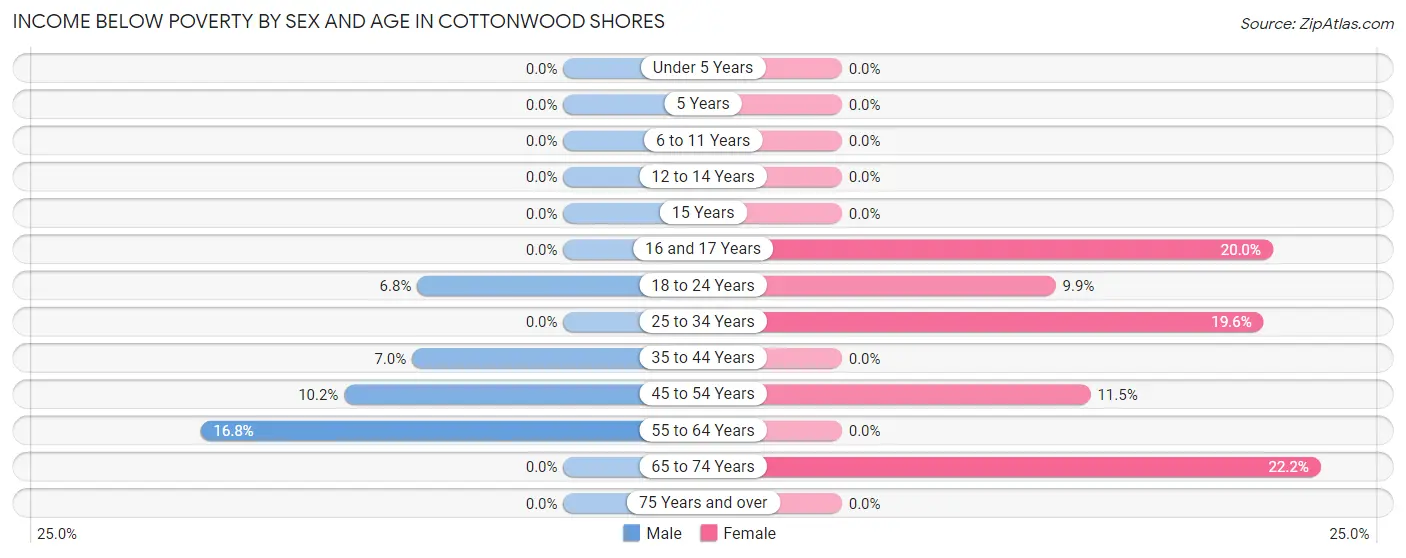
| Age Bracket | Male | Female |
| Under 5 Years | 0 (0.0%) | 0 (0.0%) |
| 5 Years | 0 (0.0%) | 0 (0.0%) |
| 6 to 11 Years | 0 (0.0%) | 0 (0.0%) |
| 12 to 14 Years | 0 (0.0%) | 0 (0.0%) |
| 15 Years | 0 (0.0%) | 0 (0.0%) |
| 16 and 17 Years | 0 (0.0%) | 1 (20.0%) |
| 18 to 24 Years | 4 (6.8%) | 13 (9.9%) |
| 25 to 34 Years | 0 (0.0%) | 18 (19.6%) |
| 35 to 44 Years | 4 (7.0%) | 0 (0.0%) |
| 45 to 54 Years | 12 (10.2%) | 9 (11.5%) |
| 55 to 64 Years | 16 (16.8%) | 0 (0.0%) |
| 65 to 74 Years | 0 (0.0%) | 10 (22.2%) |
| 75 Years and over | 0 (0.0%) | 0 (0.0%) |
| Total | 36 (5.0%) | 51 (6.8%) |
Income Above Poverty by Sex and Age in Cottonwood Shores
According to the poverty statistics in Cottonwood Shores, males aged under 5 years and females aged under 5 years are the age groups that are most secure financially, with 100.0% of males and 100.0% of females in these age groups living above the poverty line.
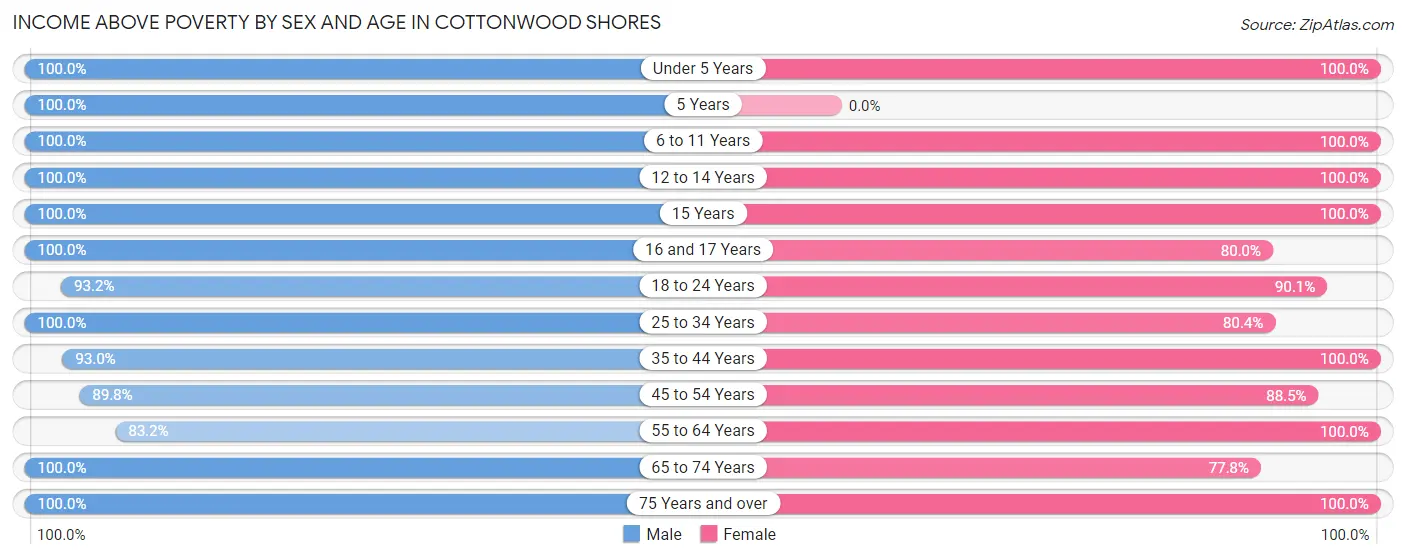
| Age Bracket | Male | Female |
| Under 5 Years | 84 (100.0%) | 56 (100.0%) |
| 5 Years | 33 (100.0%) | 0 (0.0%) |
| 6 to 11 Years | 40 (100.0%) | 32 (100.0%) |
| 12 to 14 Years | 43 (100.0%) | 28 (100.0%) |
| 15 Years | 10 (100.0%) | 10 (100.0%) |
| 16 and 17 Years | 19 (100.0%) | 4 (80.0%) |
| 18 to 24 Years | 55 (93.2%) | 118 (90.1%) |
| 25 to 34 Years | 100 (100.0%) | 74 (80.4%) |
| 35 to 44 Years | 53 (93.0%) | 115 (100.0%) |
| 45 to 54 Years | 106 (89.8%) | 69 (88.5%) |
| 55 to 64 Years | 79 (83.2%) | 125 (100.0%) |
| 65 to 74 Years | 42 (100.0%) | 35 (77.8%) |
| 75 Years and over | 27 (100.0%) | 37 (100.0%) |
| Total | 691 (95.1%) | 703 (93.2%) |
Income Below Poverty Among Married-Couple Families in Cottonwood Shores
The poverty statistics for married-couple families in Cottonwood Shores show that 1.7% or 3 of the total 172 families live below the poverty line. Families with 1 or 2 children have the highest poverty rate of 3.5%, comprising of 3 families. On the other hand, families with no children have the lowest poverty rate of 0.0%, which includes 0 families.
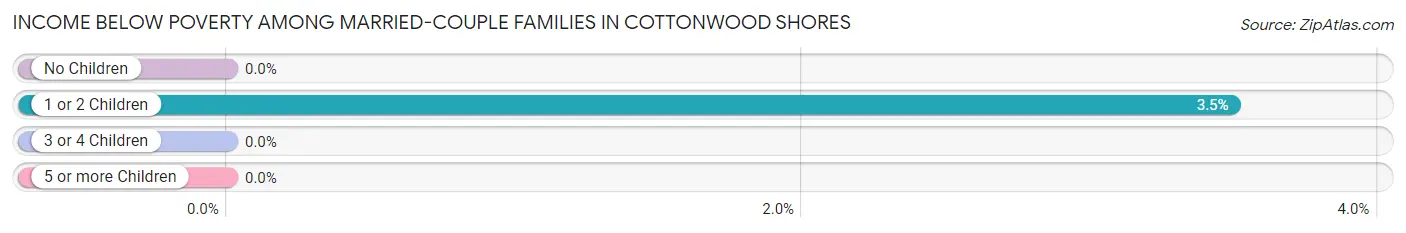
| Children | Above Poverty | Below Poverty |
| No Children | 70 (100.0%) | 0 (0.0%) |
| 1 or 2 Children | 83 (96.5%) | 3 (3.5%) |
| 3 or 4 Children | 16 (100.0%) | 0 (0.0%) |
| 5 or more Children | 0 (0.0%) | 0 (0.0%) |
| Total | 169 (98.3%) | 3 (1.7%) |
Income Below Poverty Among Single-Parent Households in Cottonwood Shores
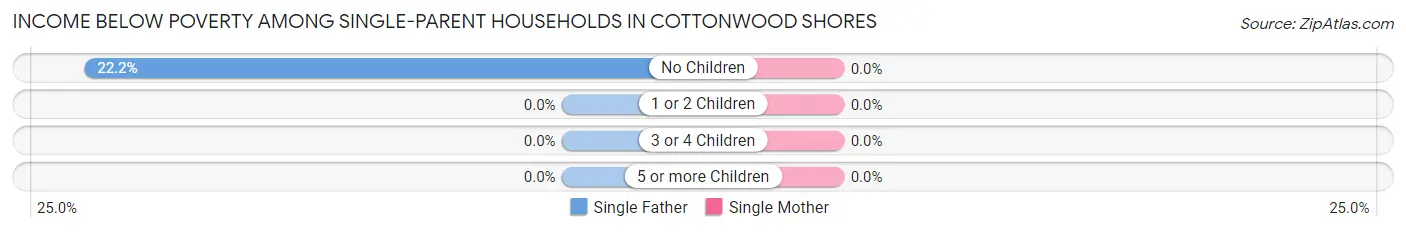
| Children | Single Father | Single Mother |
| No Children | 4 (22.2%) | 0 (0.0%) |
| 1 or 2 Children | 0 (0.0%) | 0 (0.0%) |
| 3 or 4 Children | 0 (0.0%) | 0 (0.0%) |
| 5 or more Children | 0 (0.0%) | 0 (0.0%) |
| Total | 4 (11.8%) | 0 (0.0%) |
Income Below Poverty Among Married-Couple vs Single-Parent Households in Cottonwood Shores
The poverty data for Cottonwood Shores shows that 3 of the married-couple family households (1.7%) and 4 of the single-parent households (2.8%) are living below the poverty level. Within the married-couple family households, those with 1 or 2 children have the highest poverty rate, with 3 households (3.5%) falling below the poverty line. Among the single-parent households, those with no children have the highest poverty rate, with 4 household (6.7%) living below poverty.
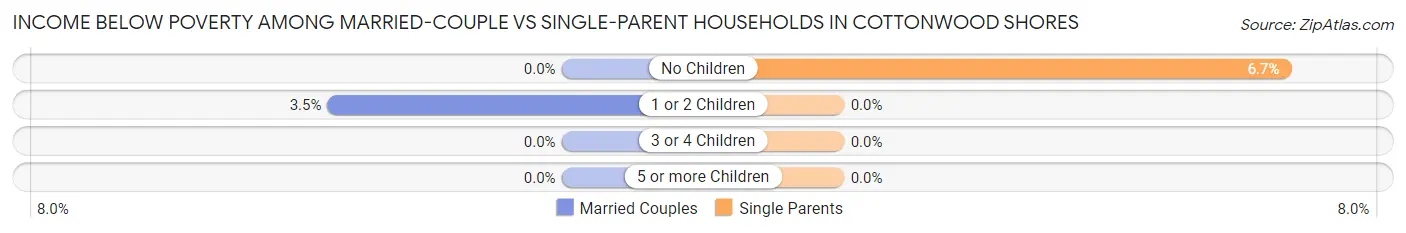
| Children | Married-Couple Families | Single-Parent Households |
| No Children | 0 (0.0%) | 4 (6.7%) |
| 1 or 2 Children | 3 (3.5%) | 0 (0.0%) |
| 3 or 4 Children | 0 (0.0%) | 0 (0.0%) |
| 5 or more Children | 0 (0.0%) | 0 (0.0%) |
| Total | 3 (1.7%) | 4 (2.8%) |
Race in Cottonwood Shores
The most populous races in Cottonwood Shores are White / Caucasian (1,140 | 77.0%), Hispanic or Latino (665 | 44.9%), and Two or more Races (236 | 15.9%).
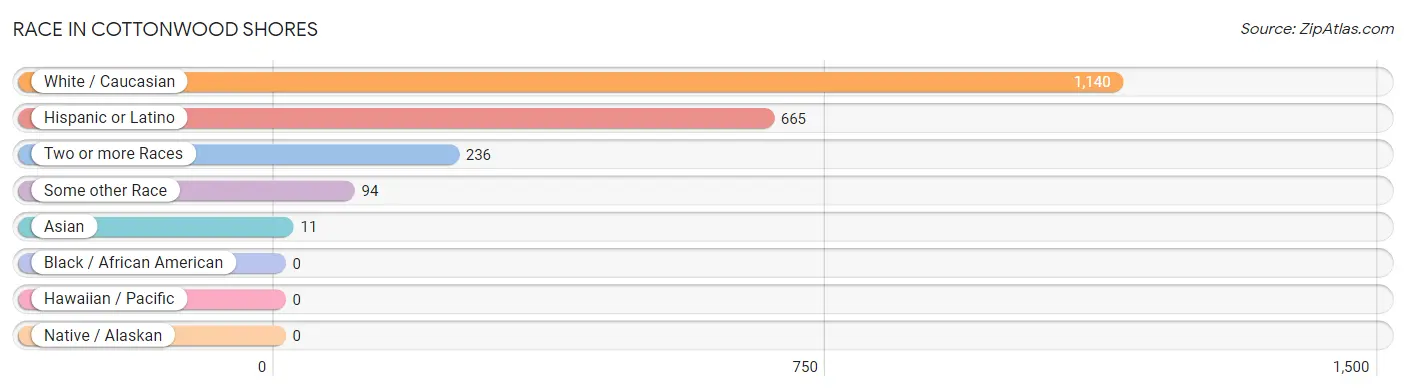
| Race | # Population | % Population |
| Asian | 11 | 0.7% |
| Black / African American | 0 | 0.0% |
| Hawaiian / Pacific | 0 | 0.0% |
| Hispanic or Latino | 665 | 44.9% |
| Native / Alaskan | 0 | 0.0% |
| White / Caucasian | 1,140 | 77.0% |
| Two or more Races | 236 | 15.9% |
| Some other Race | 94 | 6.4% |
| Total | 1,481 | 100.0% |
Ancestry in Cottonwood Shores
The most populous ancestries reported in Cottonwood Shores are Mexican (631 | 42.6%), Irish (282 | 19.0%), German (213 | 14.4%), English (105 | 7.1%), and American (44 | 3.0%), together accounting for 86.1% of all Cottonwood Shores residents.
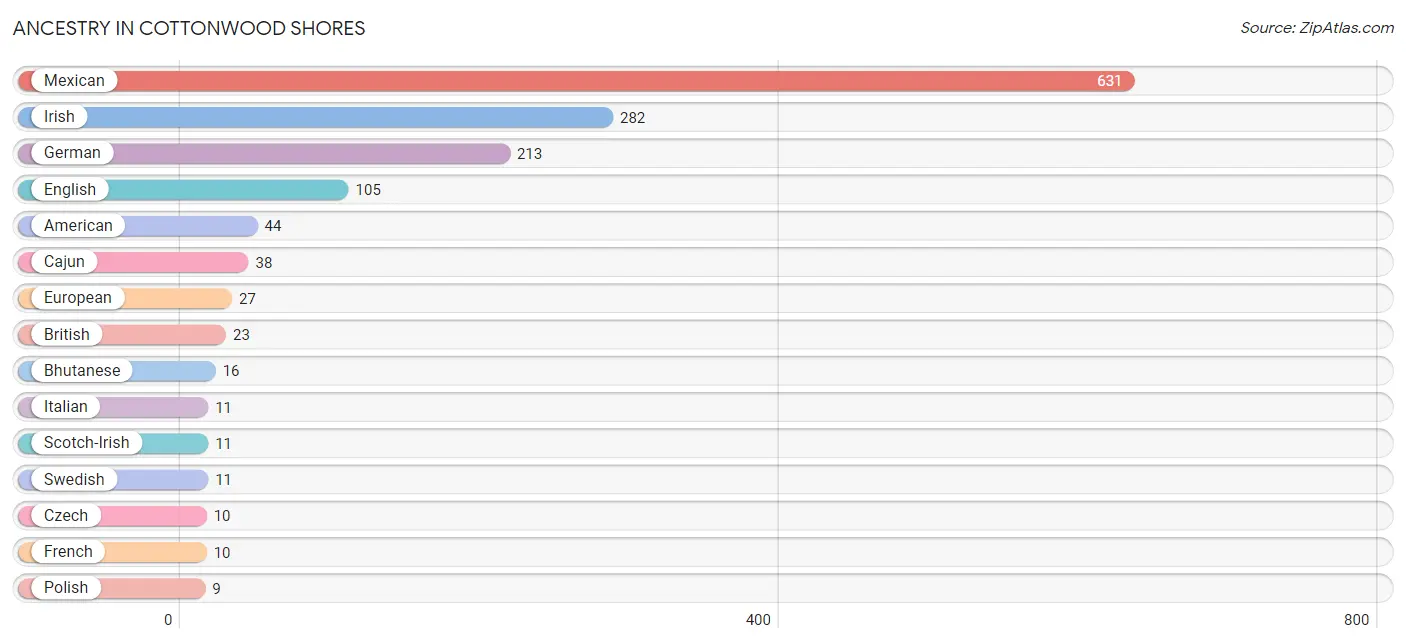
| Ancestry | # Population | % Population |
| American | 44 | 3.0% |
| Bhutanese | 16 | 1.1% |
| British | 23 | 1.5% |
| Cajun | 38 | 2.6% |
| Czech | 10 | 0.7% |
| Dutch | 6 | 0.4% |
| English | 105 | 7.1% |
| European | 27 | 1.8% |
| Finnish | 2 | 0.1% |
| French | 10 | 0.7% |
| German | 213 | 14.4% |
| Indian (Asian) | 6 | 0.4% |
| Irish | 282 | 19.0% |
| Italian | 11 | 0.7% |
| Mexican | 631 | 42.6% |
| Mexican American Indian | 4 | 0.3% |
| Norwegian | 7 | 0.5% |
| Polish | 9 | 0.6% |
| Puerto Rican | 4 | 0.3% |
| Scandinavian | 8 | 0.5% |
| Scotch-Irish | 11 | 0.7% |
| Swedish | 11 | 0.7% |
| Swiss | 6 | 0.4% | View All 23 Rows |
Immigrants in Cottonwood Shores
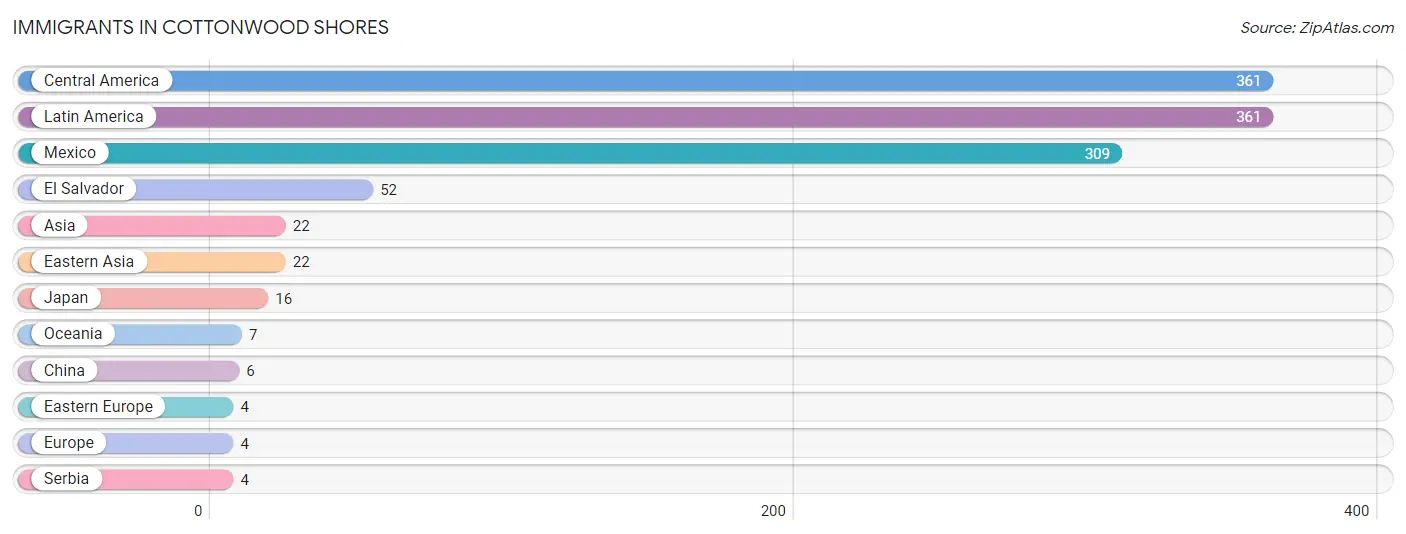
The most numerous immigrant groups reported in Cottonwood Shores came from Central America (361 | 24.4%), Latin America (361 | 24.4%), Mexico (309 | 20.9%), El Salvador (52 | 3.5%), and Asia (22 | 1.5%), together accounting for 74.6% of all Cottonwood Shores residents.
| Immigration Origin | # Population | % Population |
| Asia | 22 | 1.5% |
| Central America | 361 | 24.4% |
| China | 6 | 0.4% |
| Eastern Asia | 22 | 1.5% |
| Eastern Europe | 4 | 0.3% |
| El Salvador | 52 | 3.5% |
| Europe | 4 | 0.3% |
| Japan | 16 | 1.1% |
| Latin America | 361 | 24.4% |
| Mexico | 309 | 20.9% |
| Oceania | 7 | 0.5% |
| Serbia | 4 | 0.3% | View All 12 Rows |
Sex and Age in Cottonwood Shores
Sex and Age in Cottonwood Shores
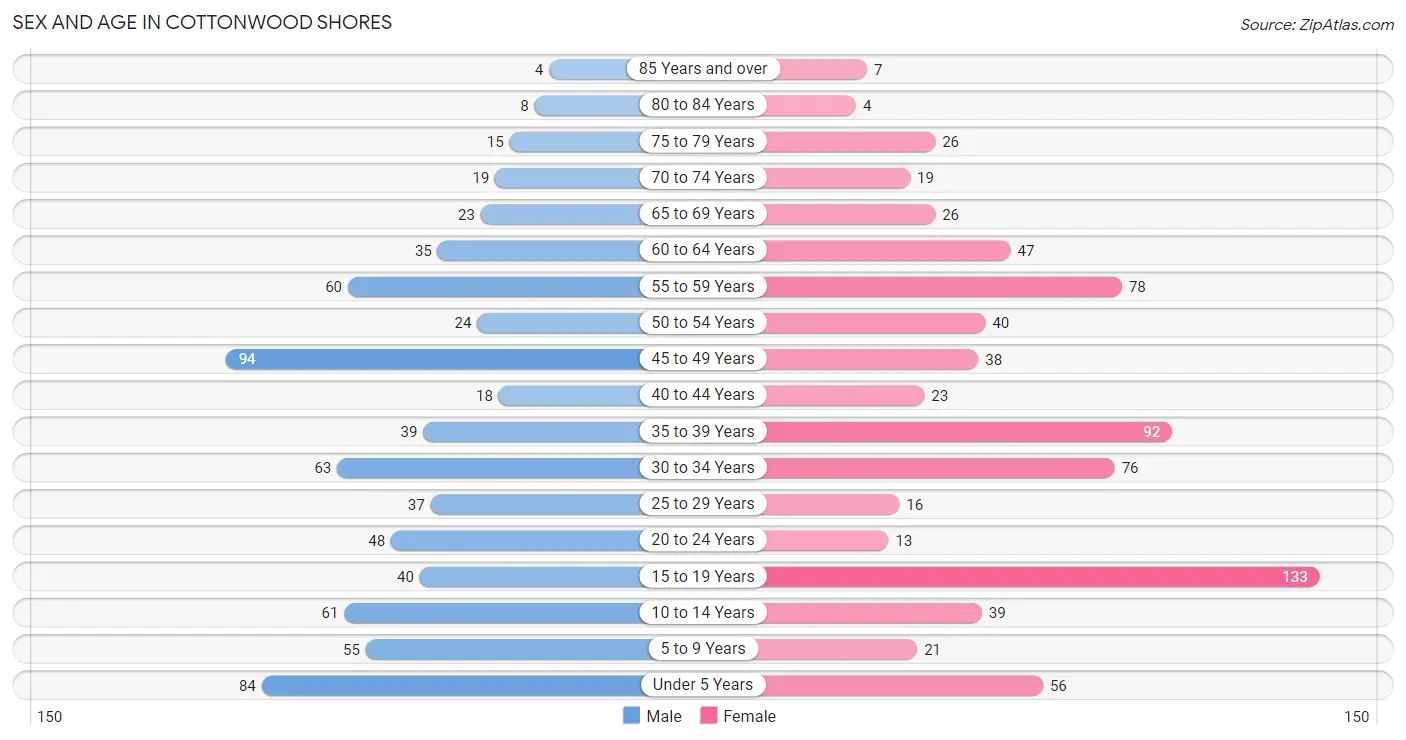
The most populous age groups in Cottonwood Shores are 45 to 49 Years (94 | 12.9%) for men and 15 to 19 Years (133 | 17.6%) for women.
| Age Bracket | Male | Female |
| Under 5 Years | 84 (11.6%) | 56 (7.4%) |
| 5 to 9 Years | 55 (7.6%) | 21 (2.8%) |
| 10 to 14 Years | 61 (8.4%) | 39 (5.2%) |
| 15 to 19 Years | 40 (5.5%) | 133 (17.6%) |
| 20 to 24 Years | 48 (6.6%) | 13 (1.7%) |
| 25 to 29 Years | 37 (5.1%) | 16 (2.1%) |
| 30 to 34 Years | 63 (8.7%) | 76 (10.1%) |
| 35 to 39 Years | 39 (5.4%) | 92 (12.2%) |
| 40 to 44 Years | 18 (2.5%) | 23 (3.0%) |
| 45 to 49 Years | 94 (12.9%) | 38 (5.0%) |
| 50 to 54 Years | 24 (3.3%) | 40 (5.3%) |
| 55 to 59 Years | 60 (8.3%) | 78 (10.3%) |
| 60 to 64 Years | 35 (4.8%) | 47 (6.2%) |
| 65 to 69 Years | 23 (3.2%) | 26 (3.5%) |
| 70 to 74 Years | 19 (2.6%) | 19 (2.5%) |
| 75 to 79 Years | 15 (2.1%) | 26 (3.5%) |
| 80 to 84 Years | 8 (1.1%) | 4 (0.5%) |
| 85 Years and over | 4 (0.5%) | 7 (0.9%) |
| Total | 727 (100.0%) | 754 (100.0%) |
Families and Households in Cottonwood Shores
Median Family Size in Cottonwood Shores
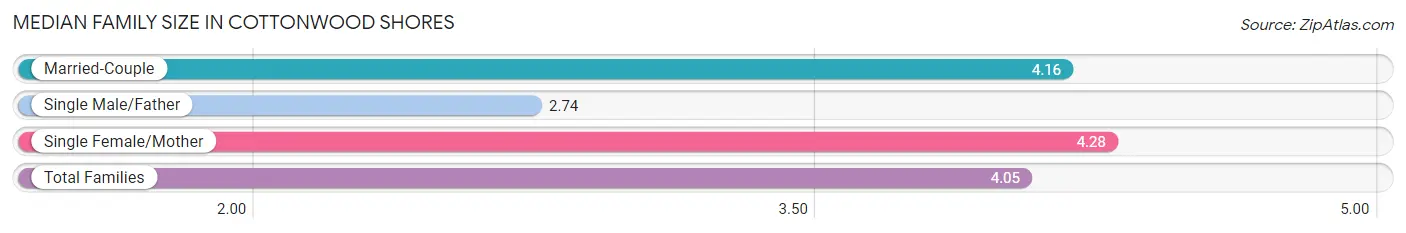
The median family size in Cottonwood Shores is 4.05 persons per family, with single female/mother families (109 | 34.6%) accounting for the largest median family size of 4.28 persons per family. On the other hand, single male/father families (34 | 10.8%) represent the smallest median family size with 2.74 persons per family.
| Family Type | # Families | Family Size |
| Married-Couple | 172 (54.6%) | 4.16 |
| Single Male/Father | 34 (10.8%) | 2.74 |
| Single Female/Mother | 109 (34.6%) | 4.28 |
| Total Families | 315 (100.0%) | 4.05 |
Median Household Size in Cottonwood Shores
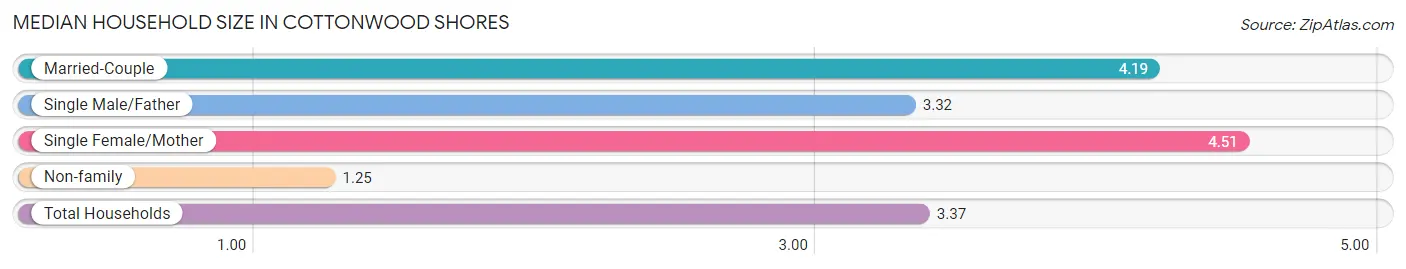
The median household size in Cottonwood Shores is 3.37 persons per household, with single female/mother households (109 | 24.8%) accounting for the largest median household size of 4.51 persons per household. non-family households (124 | 28.2%) represent the smallest median household size with 1.25 persons per household.
| Household Type | # Households | Household Size |
| Married-Couple | 172 (39.2%) | 4.19 |
| Single Male/Father | 34 (7.7%) | 3.32 |
| Single Female/Mother | 109 (24.8%) | 4.51 |
| Non-family | 124 (28.2%) | 1.25 |
| Total Households | 439 (100.0%) | 3.37 |
Household Size by Marriage Status in Cottonwood Shores
Out of a total of 439 households in Cottonwood Shores, 315 (71.8%) are family households, while 124 (28.2%) are nonfamily households. The most numerous type of family households are 2-person households, comprising 94, and the most common type of nonfamily households are 1-person households, comprising 99.
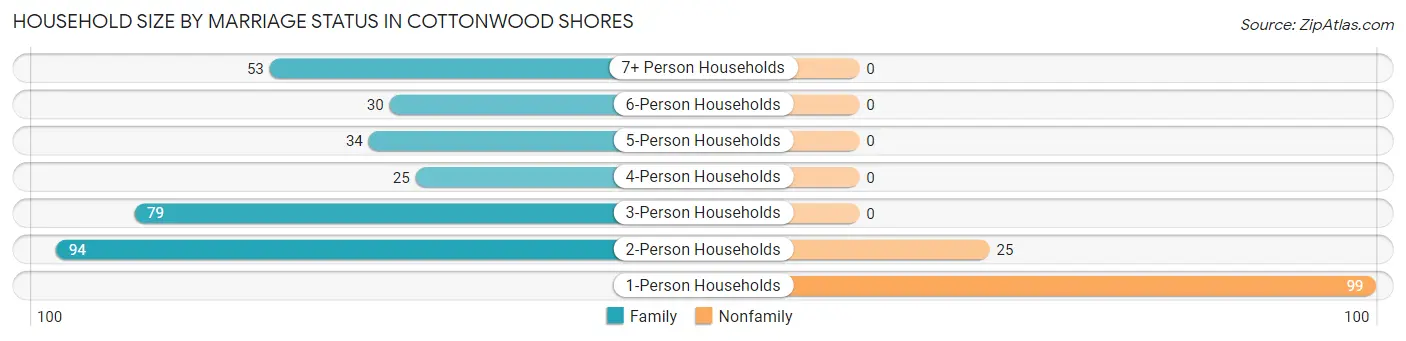
| Household Size | Family Households | Nonfamily Households |
| 1-Person Households | - | 99 (22.6%) |
| 2-Person Households | 94 (21.4%) | 25 (5.7%) |
| 3-Person Households | 79 (18.0%) | 0 (0.0%) |
| 4-Person Households | 25 (5.7%) | 0 (0.0%) |
| 5-Person Households | 34 (7.7%) | 0 (0.0%) |
| 6-Person Households | 30 (6.8%) | 0 (0.0%) |
| 7+ Person Households | 53 (12.1%) | 0 (0.0%) |
| Total | 315 (71.8%) | 124 (28.2%) |
Female Fertility in Cottonwood Shores
Fertility by Age in Cottonwood Shores
Average fertility rate in Cottonwood Shores is 15.0 births per 1,000 women. Women in the age bracket of 15 to 19 years have the highest fertility rate with 45.0 births per 1,000 women. Women in the age bracket of 15 to 19 years acount for 100.0% of all women with births.
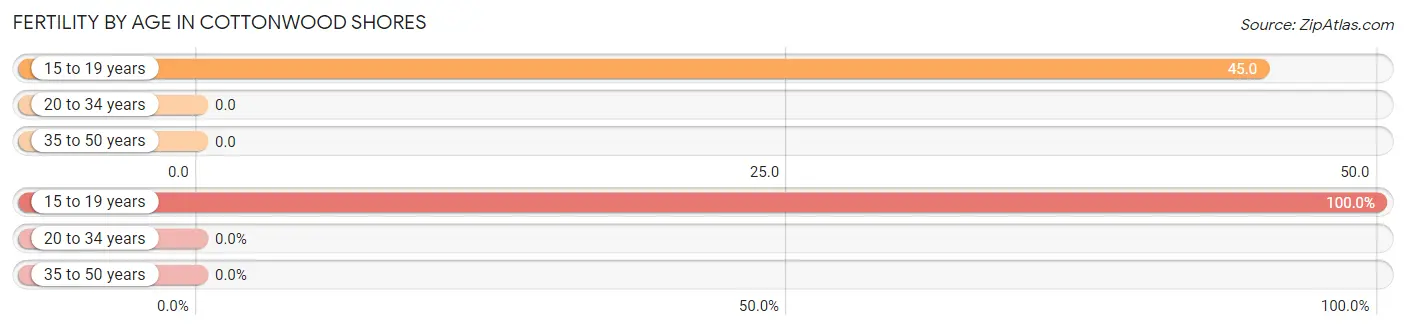
| Age Bracket | Women with Births | Births / 1,000 Women |
| 15 to 19 years | 6 (100.0%) | 45.0 |
| 20 to 34 years | 0 (0.0%) | 0.0 |
| 35 to 50 years | 0 (0.0%) | 0.0 |
| Total | 6 (100.0%) | 15.0 |
Fertility by Age by Marriage Status in Cottonwood Shores
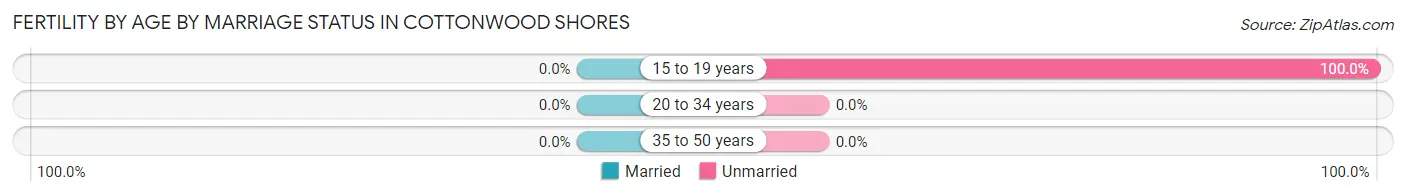
| Age Bracket | Married | Unmarried |
| 15 to 19 years | 0 (0.0%) | 6 (100.0%) |
| 20 to 34 years | 0 (0.0%) | 0 (0.0%) |
| 35 to 50 years | 0 (0.0%) | 0 (0.0%) |
| Total | 0 (0.0%) | 6 (100.0%) |
Fertility by Education in Cottonwood Shores
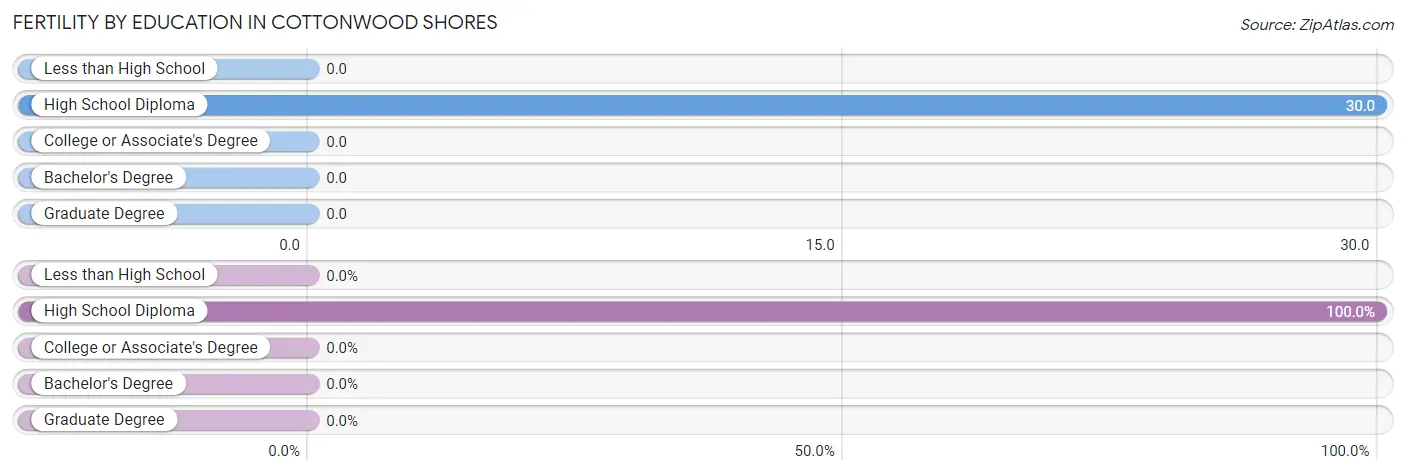
| Educational Attainment | Women with Births | Births / 1,000 Women |
| Less than High School | 0 (0.0%) | 0.0 |
| High School Diploma | 6 (100.0%) | 30.0 |
| College or Associate's Degree | 0 (0.0%) | 0.0 |
| Bachelor's Degree | 0 (0.0%) | 0.0 |
| Graduate Degree | 0 (0.0%) | 0.0 |
| Total | 6 (100.0%) | 15.0 |
Fertility by Education by Marriage Status in Cottonwood Shores
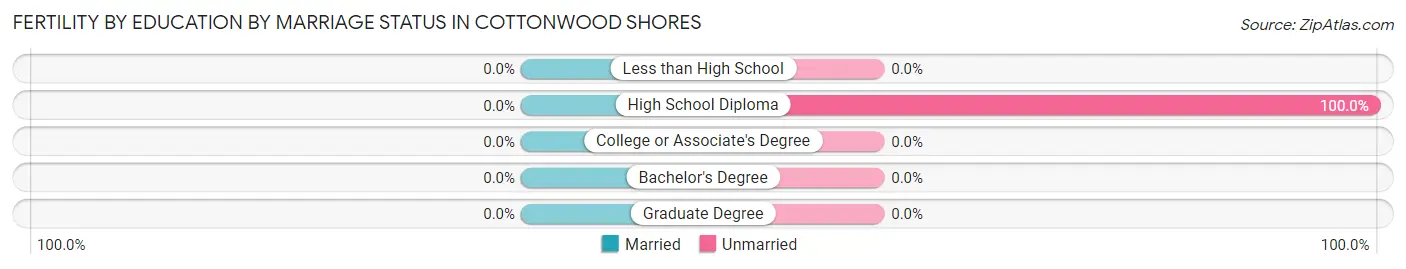
| Educational Attainment | Married | Unmarried |
| Less than High School | 0 (0.0%) | 0 (0.0%) |
| High School Diploma | 0 (0.0%) | 6 (100.0%) |
| College or Associate's Degree | 0 (0.0%) | 0 (0.0%) |
| Bachelor's Degree | 0 (0.0%) | 0 (0.0%) |
| Graduate Degree | 0 (0.0%) | 0 (0.0%) |
| Total | 0 (0.0%) | 6 (100.0%) |
Employment Characteristics in Cottonwood Shores
Employment by Class of Employer in Cottonwood Shores
Among the 842 employed individuals in Cottonwood Shores, private company employees (546 | 64.8%), self-employed (not incorporated) (160 | 19.0%), and local government employees (76 | 9.0%) make up the most common classes of employment.
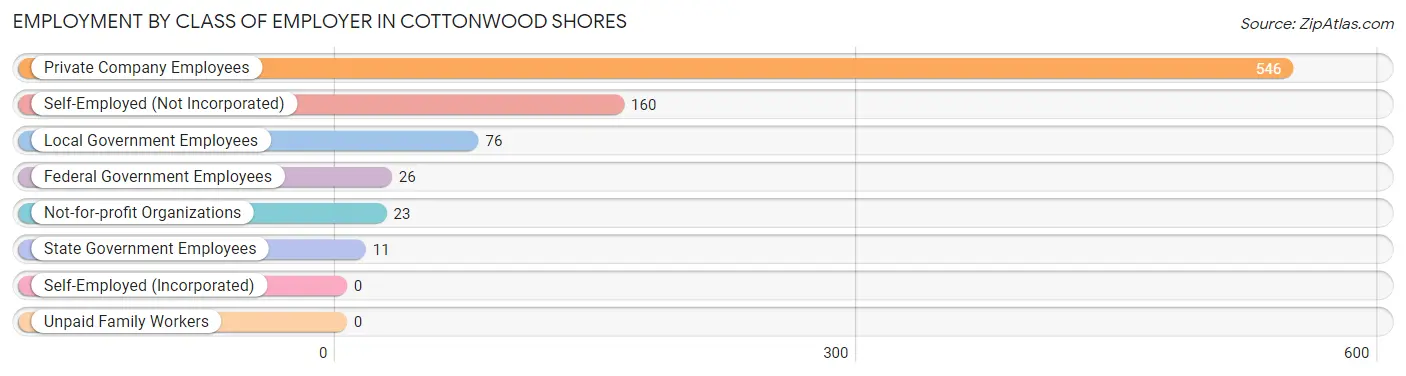
| Employer Class | # Employees | % Employees |
| Private Company Employees | 546 | 64.8% |
| Self-Employed (Incorporated) | 0 | 0.0% |
| Self-Employed (Not Incorporated) | 160 | 19.0% |
| Not-for-profit Organizations | 23 | 2.7% |
| Local Government Employees | 76 | 9.0% |
| State Government Employees | 11 | 1.3% |
| Federal Government Employees | 26 | 3.1% |
| Unpaid Family Workers | 0 | 0.0% |
| Total | 842 | 100.0% |
Employment Status by Age in Cottonwood Shores
According to the labor force statistics for Cottonwood Shores, out of the total population over 16 years of age (1,145), 75.5% or 864 individuals are in the labor force, with 2.5% or 22 of them unemployed. The age group with the highest labor force participation rate is 25 to 29 years, with 94.3% or 50 individuals in the labor force. Within the labor force, the 25 to 29 years age range has the highest percentage of unemployed individuals, with 18.0% or 9 of them being unemployed.
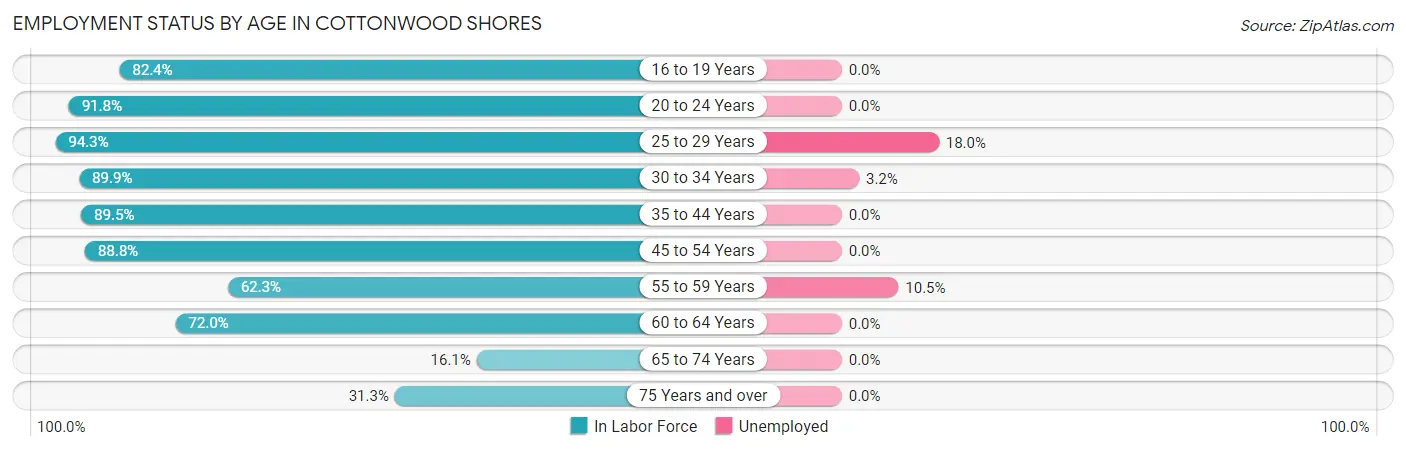
| Age Bracket | In Labor Force | Unemployed |
| 16 to 19 Years | 126 (82.4%) | 0 (0.0%) |
| 20 to 24 Years | 56 (91.8%) | 0 (0.0%) |
| 25 to 29 Years | 50 (94.3%) | 9 (18.0%) |
| 30 to 34 Years | 125 (89.9%) | 4 (3.2%) |
| 35 to 44 Years | 154 (89.5%) | 0 (0.0%) |
| 45 to 54 Years | 174 (88.8%) | 0 (0.0%) |
| 55 to 59 Years | 86 (62.3%) | 9 (10.5%) |
| 60 to 64 Years | 59 (72.0%) | 0 (0.0%) |
| 65 to 74 Years | 14 (16.1%) | 0 (0.0%) |
| 75 Years and over | 20 (31.3%) | 0 (0.0%) |
| Total | 864 (75.5%) | 22 (2.5%) |
Employment Status by Educational Attainment in Cottonwood Shores
According to labor force statistics for Cottonwood Shores, 83.1% of individuals (648) out of the total population between 25 and 64 years of age (780) are in the labor force, with 3.4% or 22 of them being unemployed. The group with the highest labor force participation rate are those with the educational attainment of bachelor's degree or higher, with 89.1% or 98 individuals in the labor force. Within the labor force, individuals with bachelor's degree or higher education have the highest percentage of unemployment, with 9.2% or 9 of them being unemployed.
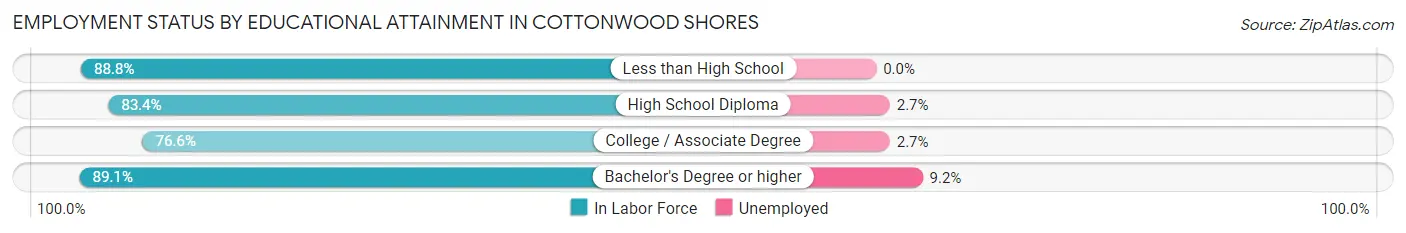
| Educational Attainment | In Labor Force | Unemployed |
| Less than High School | 71 (88.8%) | 0 (0.0%) |
| High School Diploma | 332 (83.4%) | 11 (2.7%) |
| College / Associate Degree | 147 (76.6%) | 5 (2.7%) |
| Bachelor's Degree or higher | 98 (89.1%) | 10 (9.2%) |
| Total | 648 (83.1%) | 27 (3.4%) |
Employment Occupations by Sex in Cottonwood Shores
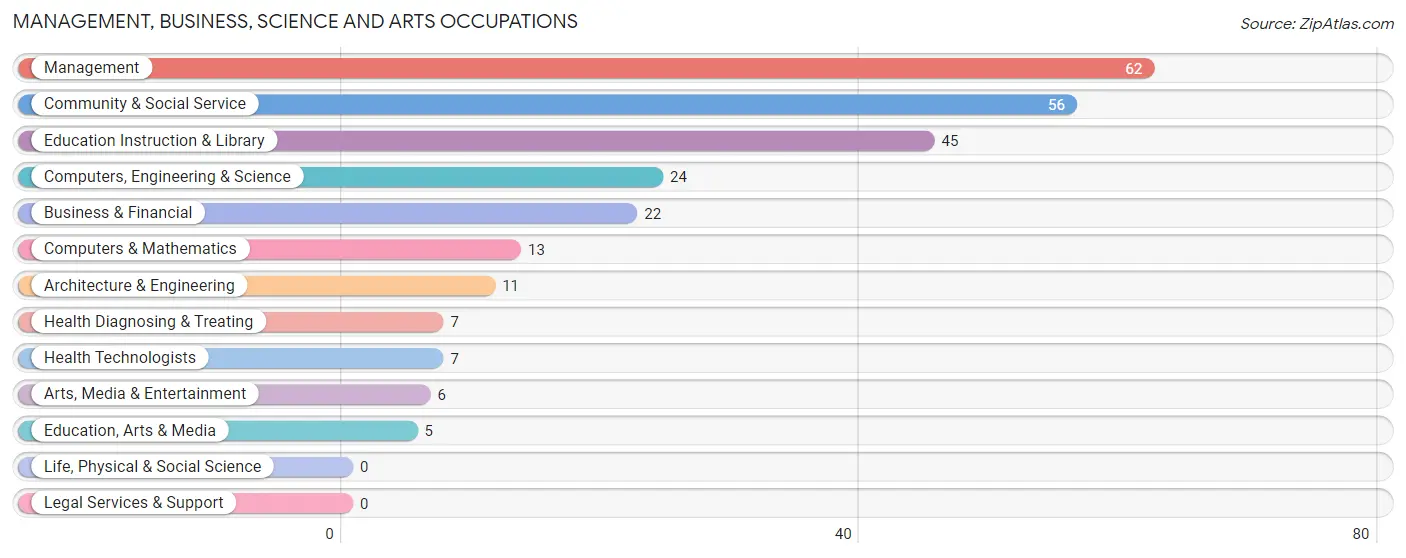
Management, Business, Science and Arts Occupations
The most common Management, Business, Science and Arts occupations in Cottonwood Shores are Management (62 | 7.4%), Community & Social Service (56 | 6.7%), Education Instruction & Library (45 | 5.3%), Computers, Engineering & Science (24 | 2.9%), and Business & Financial (22 | 2.6%).
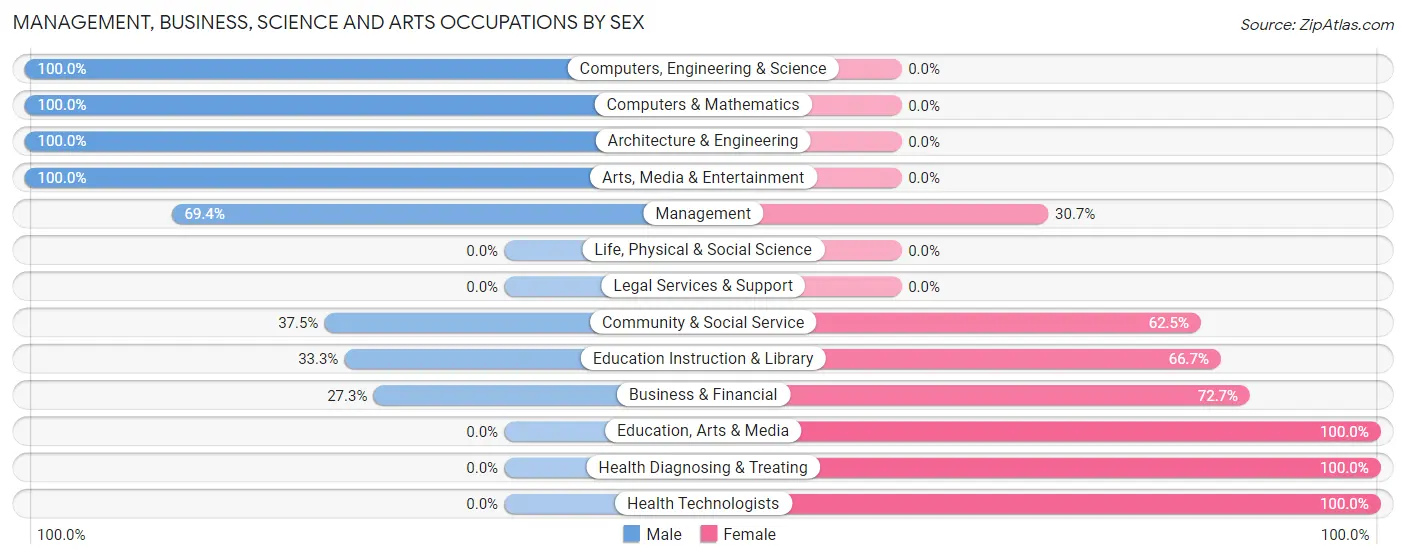
Management, Business, Science and Arts Occupations by Sex
Within the Management, Business, Science and Arts occupations in Cottonwood Shores, the most male-oriented occupations are Computers, Engineering & Science (100.0%), Computers & Mathematics (100.0%), and Architecture & Engineering (100.0%), while the most female-oriented occupations are Education, Arts & Media (100.0%), Health Diagnosing & Treating (100.0%), and Health Technologists (100.0%).
| Occupation | Male | Female |
| Management | 43 (69.4%) | 19 (30.6%) |
| Business & Financial | 6 (27.3%) | 16 (72.7%) |
| Computers, Engineering & Science | 24 (100.0%) | 0 (0.0%) |
| Computers & Mathematics | 13 (100.0%) | 0 (0.0%) |
| Architecture & Engineering | 11 (100.0%) | 0 (0.0%) |
| Life, Physical & Social Science | 0 (0.0%) | 0 (0.0%) |
| Community & Social Service | 21 (37.5%) | 35 (62.5%) |
| Education, Arts & Media | 0 (0.0%) | 5 (100.0%) |
| Legal Services & Support | 0 (0.0%) | 0 (0.0%) |
| Education Instruction & Library | 15 (33.3%) | 30 (66.7%) |
| Arts, Media & Entertainment | 6 (100.0%) | 0 (0.0%) |
| Health Diagnosing & Treating | 0 (0.0%) | 7 (100.0%) |
| Health Technologists | 0 (0.0%) | 7 (100.0%) |
| Total (Category) | 94 (55.0%) | 77 (45.0%) |
| Total (Overall) | 412 (48.9%) | 430 (51.1%) |
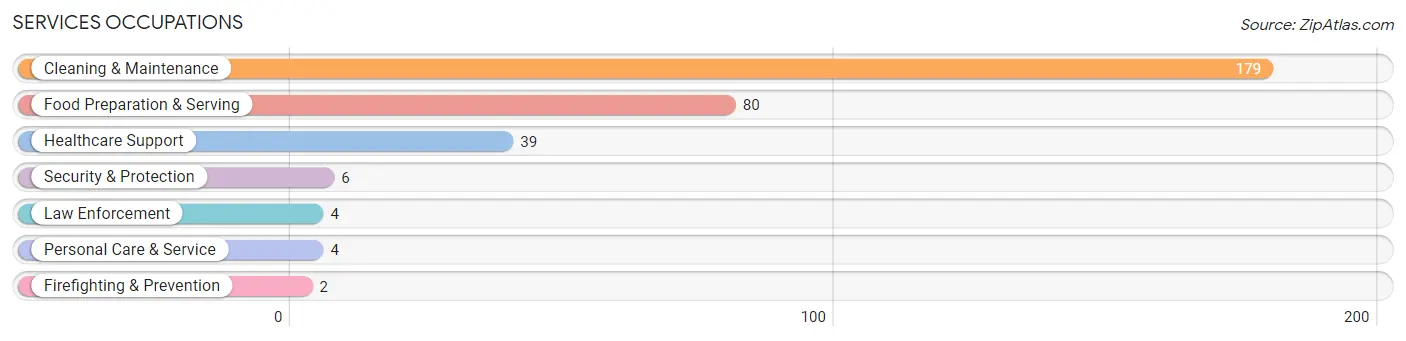
Services Occupations
The most common Services occupations in Cottonwood Shores are Cleaning & Maintenance (179 | 21.3%), Food Preparation & Serving (80 | 9.5%), Healthcare Support (39 | 4.6%), Security & Protection (6 | 0.7%), and Law Enforcement (4 | 0.5%).
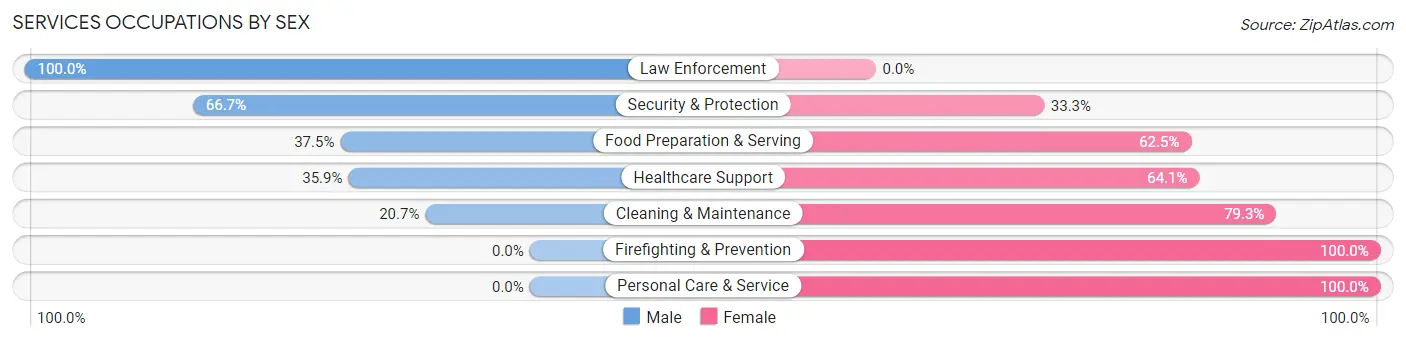
Services Occupations by Sex
Within the Services occupations in Cottonwood Shores, the most male-oriented occupations are Law Enforcement (100.0%), Security & Protection (66.7%), and Food Preparation & Serving (37.5%), while the most female-oriented occupations are Firefighting & Prevention (100.0%), Personal Care & Service (100.0%), and Cleaning & Maintenance (79.3%).
| Occupation | Male | Female |
| Healthcare Support | 14 (35.9%) | 25 (64.1%) |
| Security & Protection | 4 (66.7%) | 2 (33.3%) |
| Firefighting & Prevention | 0 (0.0%) | 2 (100.0%) |
| Law Enforcement | 4 (100.0%) | 0 (0.0%) |
| Food Preparation & Serving | 30 (37.5%) | 50 (62.5%) |
| Cleaning & Maintenance | 37 (20.7%) | 142 (79.3%) |
| Personal Care & Service | 0 (0.0%) | 4 (100.0%) |
| Total (Category) | 85 (27.6%) | 223 (72.4%) |
| Total (Overall) | 412 (48.9%) | 430 (51.1%) |
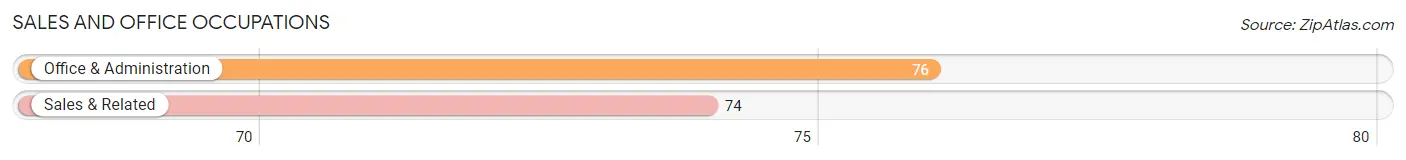
Sales and Office Occupations
The most common Sales and Office occupations in Cottonwood Shores are Office & Administration (76 | 9.0%), and Sales & Related (74 | 8.8%).
Sales and Office Occupations by Sex
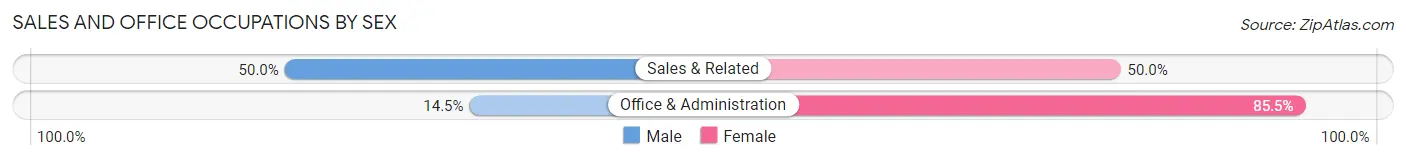
| Occupation | Male | Female |
| Sales & Related | 37 (50.0%) | 37 (50.0%) |
| Office & Administration | 11 (14.5%) | 65 (85.5%) |
| Total (Category) | 48 (32.0%) | 102 (68.0%) |
| Total (Overall) | 412 (48.9%) | 430 (51.1%) |
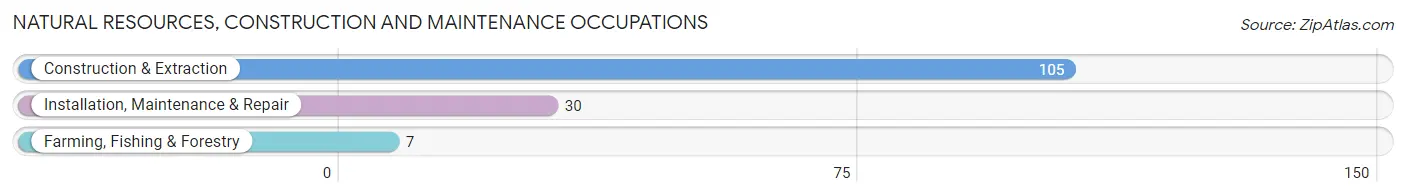
Natural Resources, Construction and Maintenance Occupations
The most common Natural Resources, Construction and Maintenance occupations in Cottonwood Shores are Construction & Extraction (105 | 12.5%), Installation, Maintenance & Repair (30 | 3.6%), and Farming, Fishing & Forestry (7 | 0.8%).
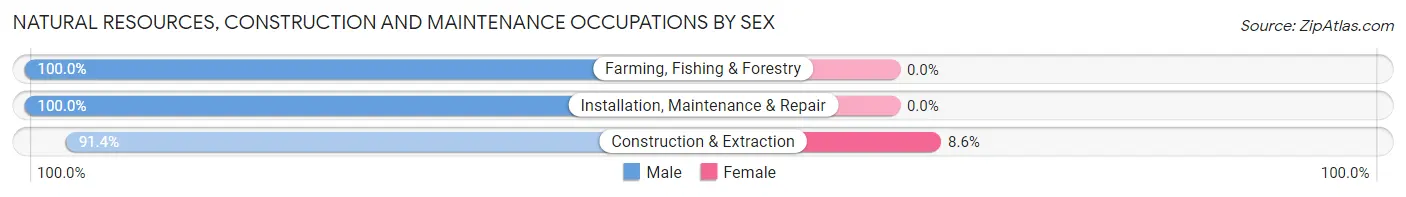
Natural Resources, Construction and Maintenance Occupations by Sex
| Occupation | Male | Female |
| Farming, Fishing & Forestry | 7 (100.0%) | 0 (0.0%) |
| Construction & Extraction | 96 (91.4%) | 9 (8.6%) |
| Installation, Maintenance & Repair | 30 (100.0%) | 0 (0.0%) |
| Total (Category) | 133 (93.7%) | 9 (6.3%) |
| Total (Overall) | 412 (48.9%) | 430 (51.1%) |
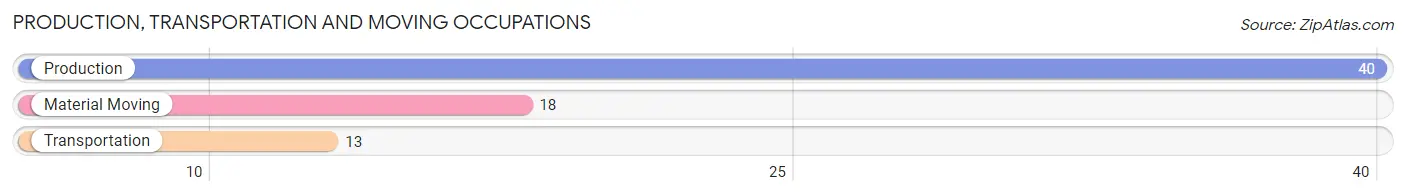
Production, Transportation and Moving Occupations
The most common Production, Transportation and Moving occupations in Cottonwood Shores are Production (40 | 4.8%), Material Moving (18 | 2.1%), and Transportation (13 | 1.5%).
Production, Transportation and Moving Occupations by Sex
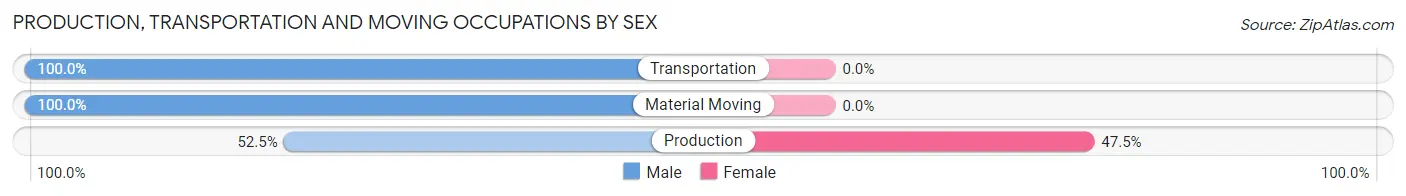
| Occupation | Male | Female |
| Production | 21 (52.5%) | 19 (47.5%) |
| Transportation | 13 (100.0%) | 0 (0.0%) |
| Material Moving | 18 (100.0%) | 0 (0.0%) |
| Total (Category) | 52 (73.2%) | 19 (26.8%) |
| Total (Overall) | 412 (48.9%) | 430 (51.1%) |
Employment Industries by Sex in Cottonwood Shores
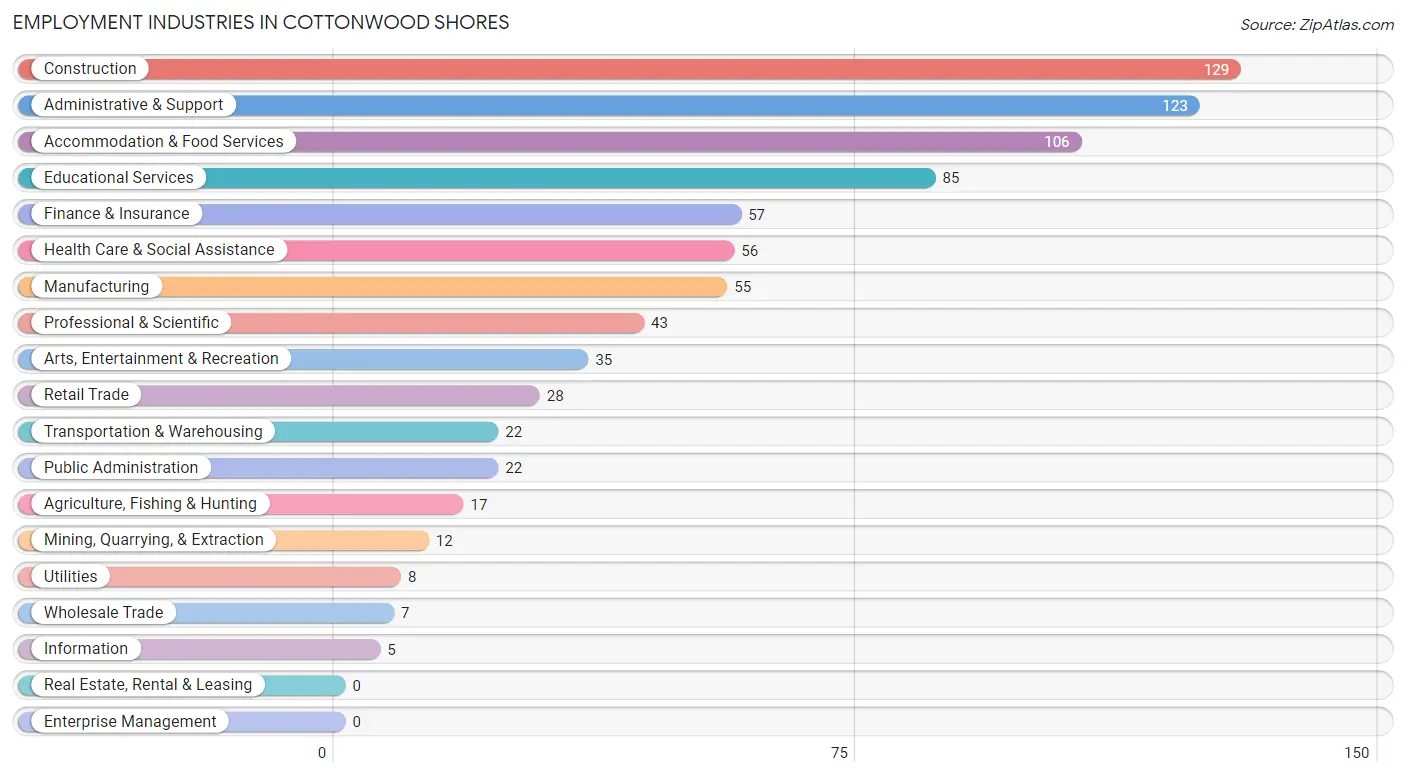
Employment Industries in Cottonwood Shores
The major employment industries in Cottonwood Shores include Construction (129 | 15.3%), Administrative & Support (123 | 14.6%), Accommodation & Food Services (106 | 12.6%), Educational Services (85 | 10.1%), and Finance & Insurance (57 | 6.8%).
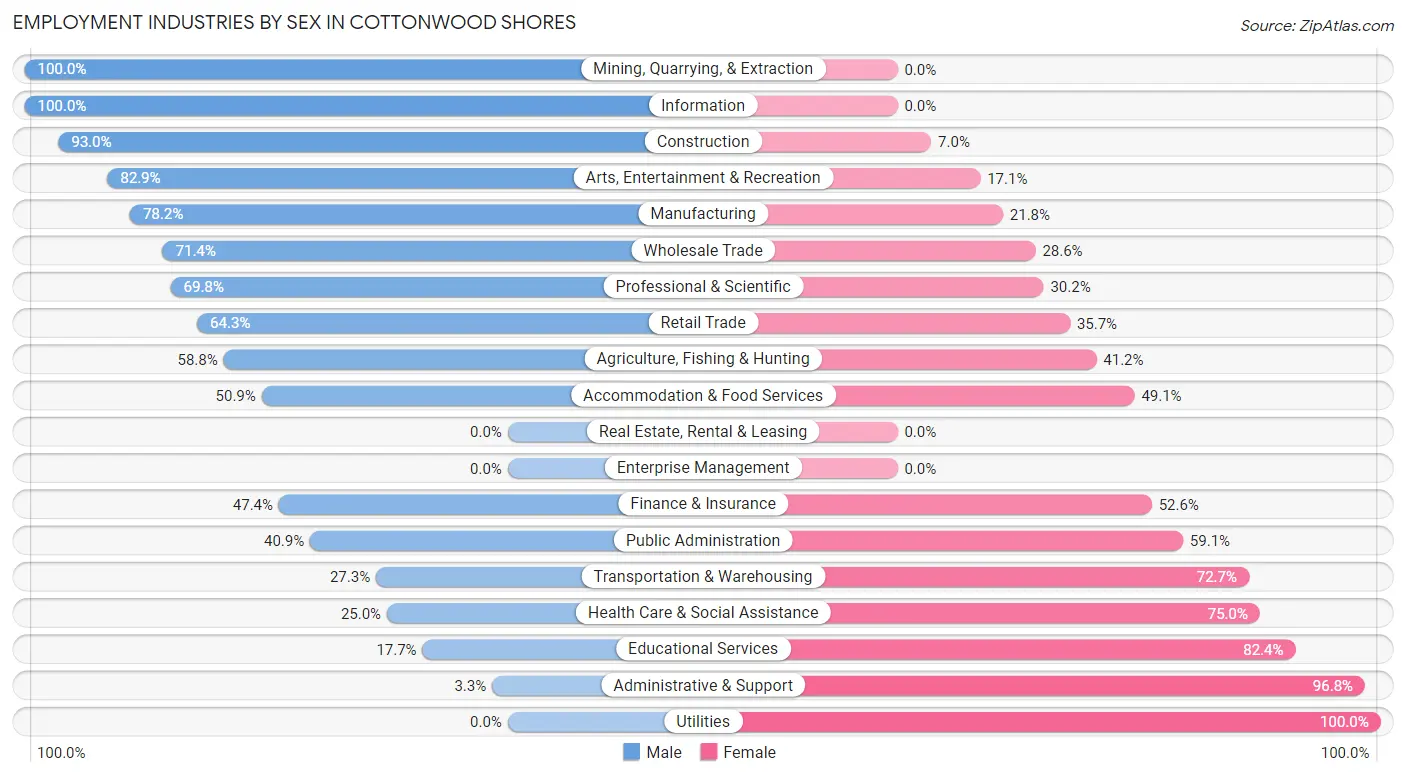
Employment Industries by Sex in Cottonwood Shores
The Cottonwood Shores industries that see more men than women are Mining, Quarrying, & Extraction (100.0%), Information (100.0%), and Construction (93.0%), whereas the industries that tend to have a higher number of women are Utilities (100.0%), Administrative & Support (96.8%), and Educational Services (82.4%).
| Industry | Male | Female |
| Agriculture, Fishing & Hunting | 10 (58.8%) | 7 (41.2%) |
| Mining, Quarrying, & Extraction | 12 (100.0%) | 0 (0.0%) |
| Construction | 120 (93.0%) | 9 (7.0%) |
| Manufacturing | 43 (78.2%) | 12 (21.8%) |
| Wholesale Trade | 5 (71.4%) | 2 (28.6%) |
| Retail Trade | 18 (64.3%) | 10 (35.7%) |
| Transportation & Warehousing | 6 (27.3%) | 16 (72.7%) |
| Utilities | 0 (0.0%) | 8 (100.0%) |
| Information | 5 (100.0%) | 0 (0.0%) |
| Finance & Insurance | 27 (47.4%) | 30 (52.6%) |
| Real Estate, Rental & Leasing | 0 (0.0%) | 0 (0.0%) |
| Professional & Scientific | 30 (69.8%) | 13 (30.2%) |
| Enterprise Management | 0 (0.0%) | 0 (0.0%) |
| Administrative & Support | 4 (3.3%) | 119 (96.8%) |
| Educational Services | 15 (17.6%) | 70 (82.4%) |
| Health Care & Social Assistance | 14 (25.0%) | 42 (75.0%) |
| Arts, Entertainment & Recreation | 29 (82.9%) | 6 (17.1%) |
| Accommodation & Food Services | 54 (50.9%) | 52 (49.1%) |
| Public Administration | 9 (40.9%) | 13 (59.1%) |
| Total | 412 (48.9%) | 430 (51.1%) |
Education in Cottonwood Shores
School Enrollment in Cottonwood Shores
The most common levels of schooling among the 290 students in Cottonwood Shores are high school (71 | 24.5%), college / undergraduate (60 | 20.7%), and kindergarten (52 | 17.9%).
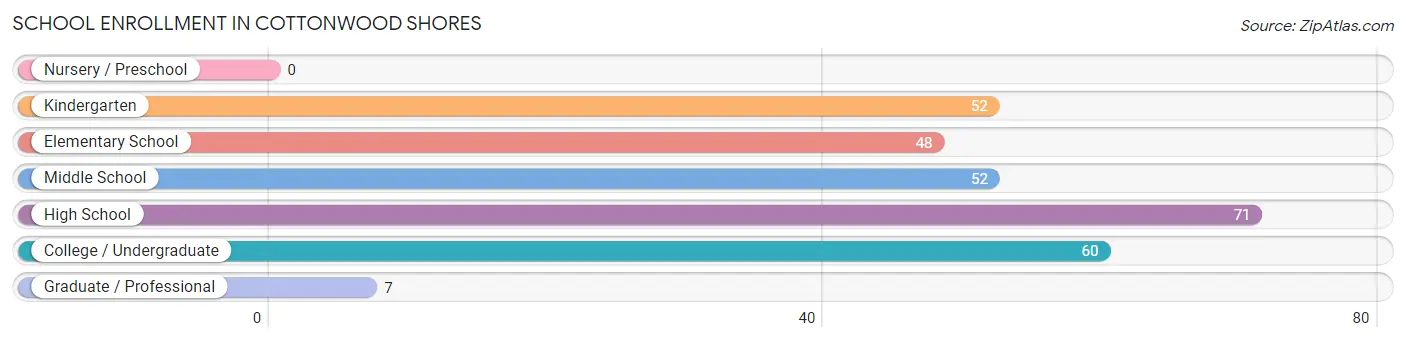
| School Level | # Students | % Students |
| Nursery / Preschool | 0 | 0.0% |
| Kindergarten | 52 | 17.9% |
| Elementary School | 48 | 16.6% |
| Middle School | 52 | 17.9% |
| High School | 71 | 24.5% |
| College / Undergraduate | 60 | 20.7% |
| Graduate / Professional | 7 | 2.4% |
| Total | 290 | 100.0% |
School Enrollment by Age by Funding Source in Cottonwood Shores
Out of a total of 290 students who are enrolled in schools in Cottonwood Shores, 40 (13.8%) attend a private institution, while the remaining 250 (86.2%) are enrolled in public schools. The age group of 35 years and over has the highest likelihood of being enrolled in private schools, with 18 (81.8% in the age bracket) enrolled. Conversely, the age group of 3 to 4 year olds has the lowest likelihood of being enrolled in a private school, with 17 (100.0% in the age bracket) attending a public institution.
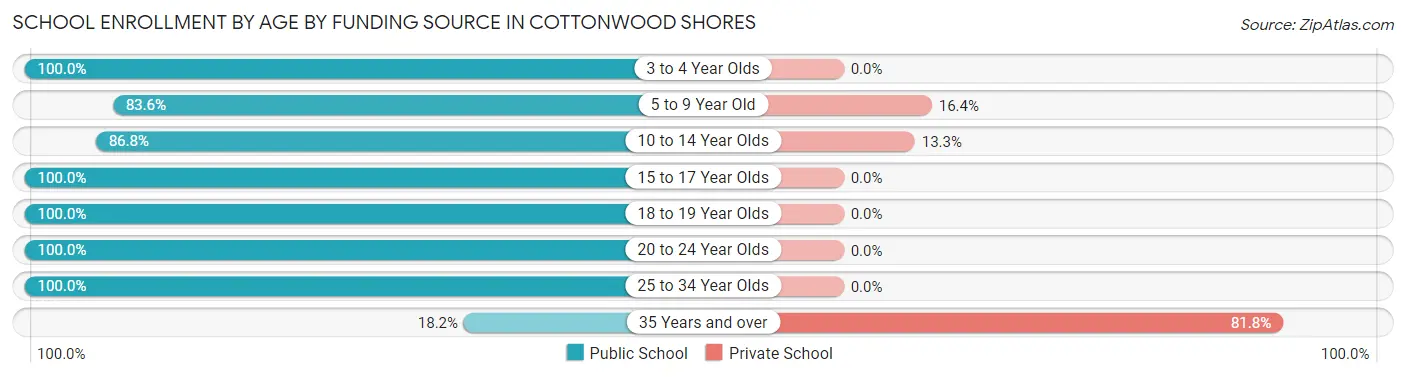
| Age Bracket | Public School | Private School |
| 3 to 4 Year Olds | 17 (100.0%) | 0 (0.0%) |
| 5 to 9 Year Old | 56 (83.6%) | 11 (16.4%) |
| 10 to 14 Year Olds | 72 (86.8%) | 11 (13.3%) |
| 15 to 17 Year Olds | 43 (100.0%) | 0 (0.0%) |
| 18 to 19 Year Olds | 13 (100.0%) | 0 (0.0%) |
| 20 to 24 Year Olds | 40 (100.0%) | 0 (0.0%) |
| 25 to 34 Year Olds | 5 (100.0%) | 0 (0.0%) |
| 35 Years and over | 4 (18.2%) | 18 (81.8%) |
| Total | 250 (86.2%) | 40 (13.8%) |
Educational Attainment by Field of Study in Cottonwood Shores
Business (25 | 17.1%), literature & languages (25 | 17.1%), science & technology (17 | 11.6%), arts & humanities (12 | 8.2%), and education (11 | 7.5%) are the most common fields of study among 146 individuals in Cottonwood Shores who have obtained a bachelor's degree or higher.
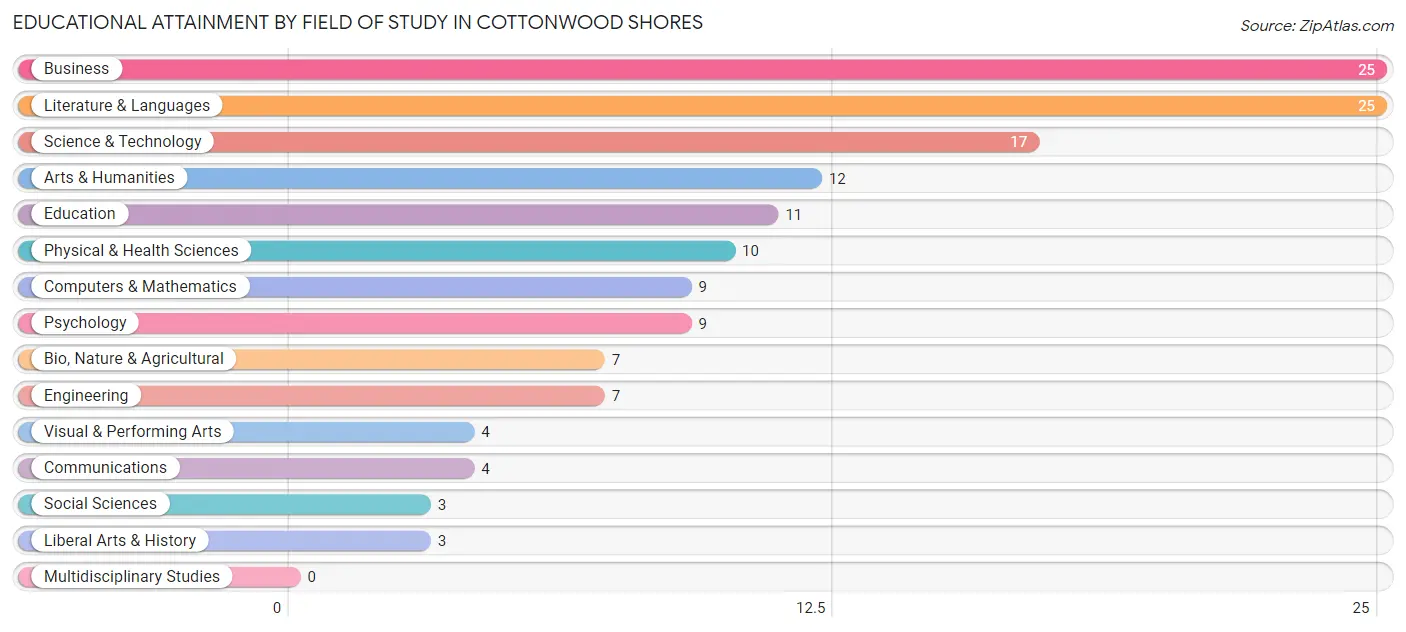
| Field of Study | # Graduates | % Graduates |
| Computers & Mathematics | 9 | 6.2% |
| Bio, Nature & Agricultural | 7 | 4.8% |
| Physical & Health Sciences | 10 | 6.9% |
| Psychology | 9 | 6.2% |
| Social Sciences | 3 | 2.1% |
| Engineering | 7 | 4.8% |
| Multidisciplinary Studies | 0 | 0.0% |
| Science & Technology | 17 | 11.6% |
| Business | 25 | 17.1% |
| Education | 11 | 7.5% |
| Literature & Languages | 25 | 17.1% |
| Liberal Arts & History | 3 | 2.1% |
| Visual & Performing Arts | 4 | 2.7% |
| Communications | 4 | 2.7% |
| Arts & Humanities | 12 | 8.2% |
| Total | 146 | 100.0% |
Transportation & Commute in Cottonwood Shores
Vehicle Availability by Sex in Cottonwood Shores
The most prevalent vehicle ownership categories in Cottonwood Shores are males with 2 vehicles (204, accounting for 49.5%) and females with 2 vehicles (89, making up 47.4%).
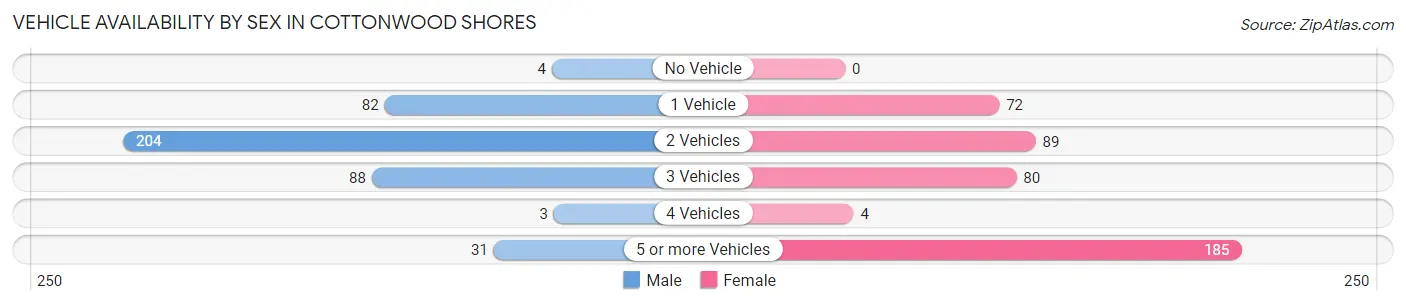
| Vehicles Available | Male | Female |
| No Vehicle | 4 (1.0%) | 0 (0.0%) |
| 1 Vehicle | 82 (19.9%) | 72 (16.7%) |
| 2 Vehicles | 204 (49.5%) | 89 (20.7%) |
| 3 Vehicles | 88 (21.4%) | 80 (18.6%) |
| 4 Vehicles | 3 (0.7%) | 4 (0.9%) |
| 5 or more Vehicles | 31 (7.5%) | 185 (43.0%) |
| Total | 412 (100.0%) | 430 (100.0%) |
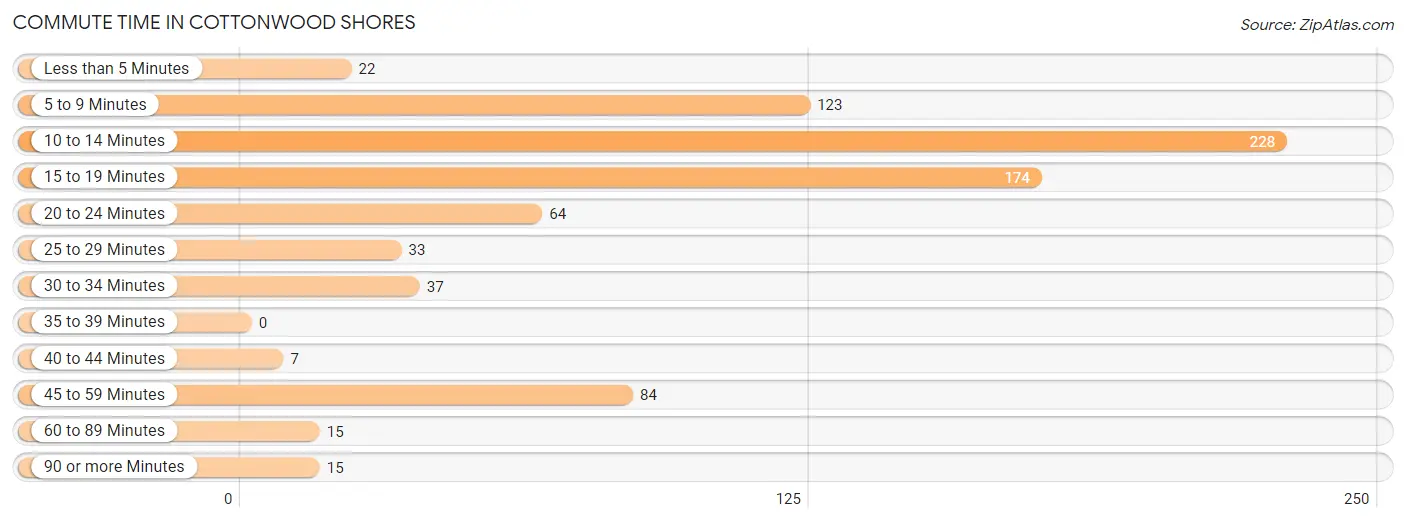
Commute Time in Cottonwood Shores
The most frequently occuring commute durations in Cottonwood Shores are 10 to 14 minutes (228 commuters, 28.4%), 15 to 19 minutes (174 commuters, 21.7%), and 5 to 9 minutes (123 commuters, 15.3%).
| Commute Time | # Commuters | % Commuters |
| Less than 5 Minutes | 22 | 2.7% |
| 5 to 9 Minutes | 123 | 15.3% |
| 10 to 14 Minutes | 228 | 28.4% |
| 15 to 19 Minutes | 174 | 21.7% |
| 20 to 24 Minutes | 64 | 8.0% |
| 25 to 29 Minutes | 33 | 4.1% |
| 30 to 34 Minutes | 37 | 4.6% |
| 35 to 39 Minutes | 0 | 0.0% |
| 40 to 44 Minutes | 7 | 0.9% |
| 45 to 59 Minutes | 84 | 10.5% |
| 60 to 89 Minutes | 15 | 1.9% |
| 90 or more Minutes | 15 | 1.9% |
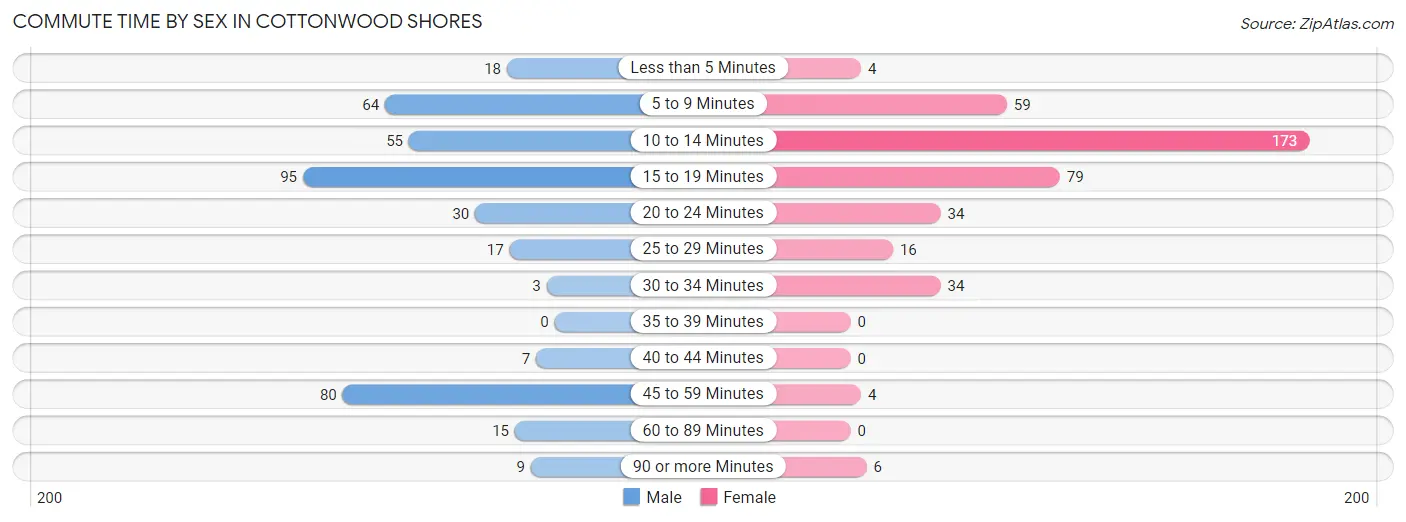
Commute Time by Sex in Cottonwood Shores
The most common commute times in Cottonwood Shores are 15 to 19 minutes (95 commuters, 24.2%) for males and 10 to 14 minutes (173 commuters, 42.3%) for females.
| Commute Time | Male | Female |
| Less than 5 Minutes | 18 (4.6%) | 4 (1.0%) |
| 5 to 9 Minutes | 64 (16.3%) | 59 (14.4%) |
| 10 to 14 Minutes | 55 (14.0%) | 173 (42.3%) |
| 15 to 19 Minutes | 95 (24.2%) | 79 (19.3%) |
| 20 to 24 Minutes | 30 (7.6%) | 34 (8.3%) |
| 25 to 29 Minutes | 17 (4.3%) | 16 (3.9%) |
| 30 to 34 Minutes | 3 (0.8%) | 34 (8.3%) |
| 35 to 39 Minutes | 0 (0.0%) | 0 (0.0%) |
| 40 to 44 Minutes | 7 (1.8%) | 0 (0.0%) |
| 45 to 59 Minutes | 80 (20.4%) | 4 (1.0%) |
| 60 to 89 Minutes | 15 (3.8%) | 0 (0.0%) |
| 90 or more Minutes | 9 (2.3%) | 6 (1.5%) |
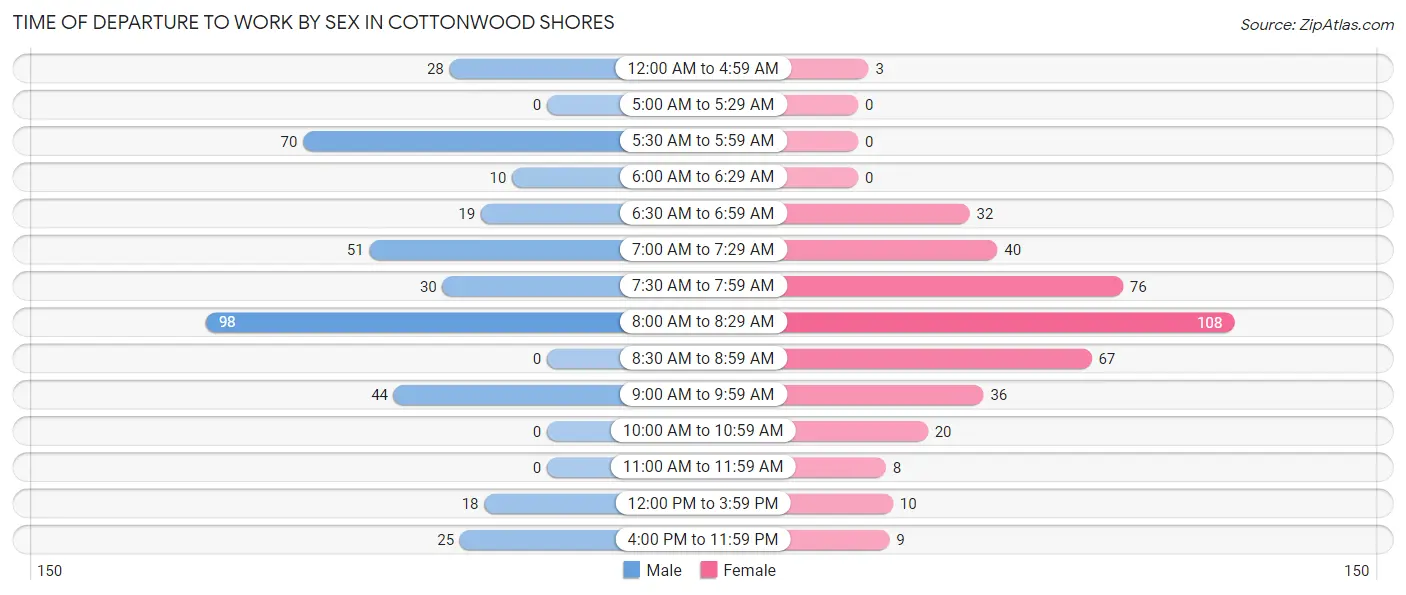
Time of Departure to Work by Sex in Cottonwood Shores
The most frequent times of departure to work in Cottonwood Shores are 8:00 AM to 8:29 AM (98, 24.9%) for males and 8:00 AM to 8:29 AM (108, 26.4%) for females.
| Time of Departure | Male | Female |
| 12:00 AM to 4:59 AM | 28 (7.1%) | 3 (0.7%) |
| 5:00 AM to 5:29 AM | 0 (0.0%) | 0 (0.0%) |
| 5:30 AM to 5:59 AM | 70 (17.8%) | 0 (0.0%) |
| 6:00 AM to 6:29 AM | 10 (2.5%) | 0 (0.0%) |
| 6:30 AM to 6:59 AM | 19 (4.8%) | 32 (7.8%) |
| 7:00 AM to 7:29 AM | 51 (13.0%) | 40 (9.8%) |
| 7:30 AM to 7:59 AM | 30 (7.6%) | 76 (18.6%) |
| 8:00 AM to 8:29 AM | 98 (24.9%) | 108 (26.4%) |
| 8:30 AM to 8:59 AM | 0 (0.0%) | 67 (16.4%) |
| 9:00 AM to 9:59 AM | 44 (11.2%) | 36 (8.8%) |
| 10:00 AM to 10:59 AM | 0 (0.0%) | 20 (4.9%) |
| 11:00 AM to 11:59 AM | 0 (0.0%) | 8 (2.0%) |
| 12:00 PM to 3:59 PM | 18 (4.6%) | 10 (2.4%) |
| 4:00 PM to 11:59 PM | 25 (6.4%) | 9 (2.2%) |
| Total | 393 (100.0%) | 409 (100.0%) |
Housing Occupancy in Cottonwood Shores
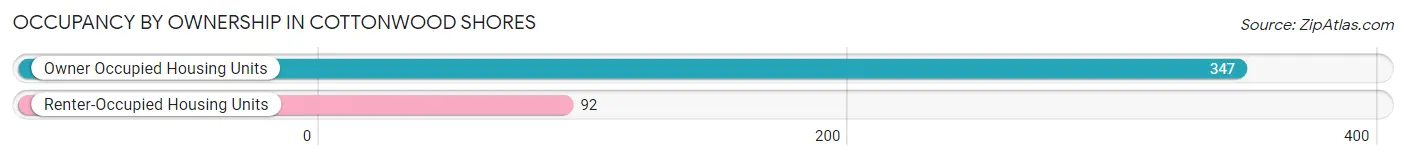
Occupancy by Ownership in Cottonwood Shores
Of the total 439 dwellings in Cottonwood Shores, owner-occupied units account for 347 (79.0%), while renter-occupied units make up 92 (21.0%).
| Occupancy | # Housing Units | % Housing Units |
| Owner Occupied Housing Units | 347 | 79.0% |
| Renter-Occupied Housing Units | 92 | 21.0% |
| Total Occupied Housing Units | 439 | 100.0% |
Occupancy by Household Size in Cottonwood Shores
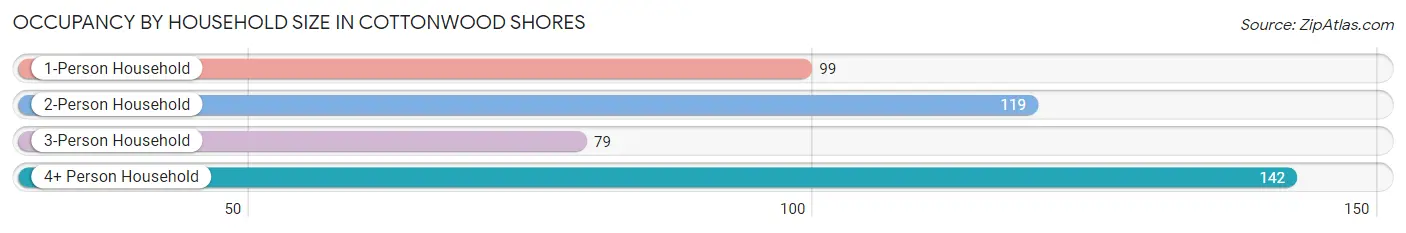
| Household Size | # Housing Units | % Housing Units |
| 1-Person Household | 99 | 22.6% |
| 2-Person Household | 119 | 27.1% |
| 3-Person Household | 79 | 18.0% |
| 4+ Person Household | 142 | 32.4% |
| Total Housing Units | 439 | 100.0% |
Occupancy by Ownership by Household Size in Cottonwood Shores
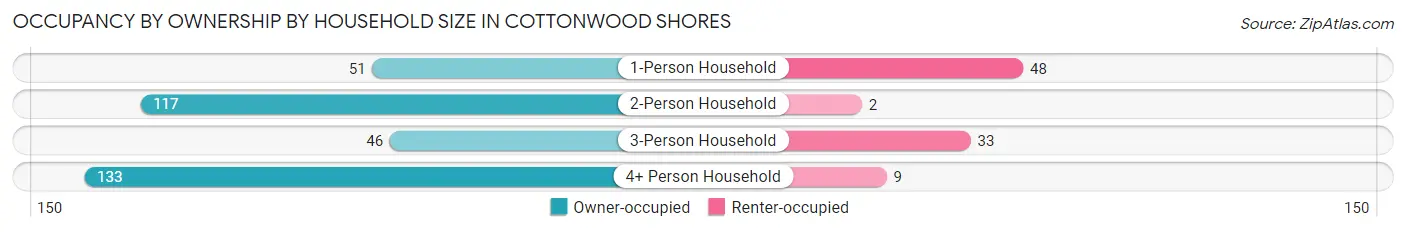
| Household Size | Owner-occupied | Renter-occupied |
| 1-Person Household | 51 (51.5%) | 48 (48.5%) |
| 2-Person Household | 117 (98.3%) | 2 (1.7%) |
| 3-Person Household | 46 (58.2%) | 33 (41.8%) |
| 4+ Person Household | 133 (93.7%) | 9 (6.3%) |
| Total Housing Units | 347 (79.0%) | 92 (21.0%) |
Occupancy by Educational Attainment in Cottonwood Shores
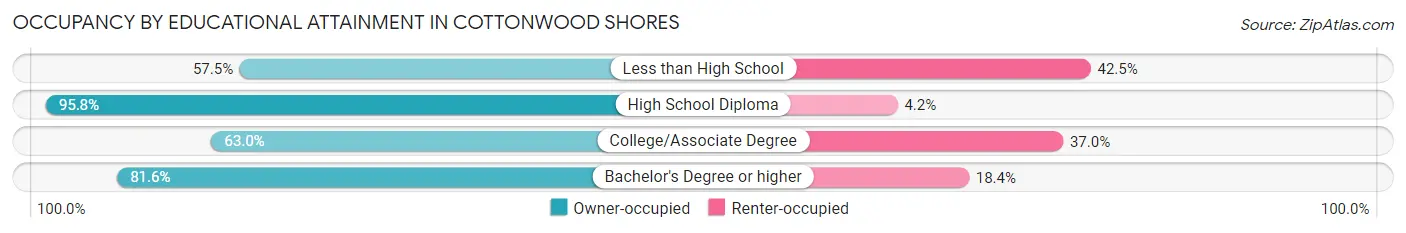
| Household Size | Owner-occupied | Renter-occupied |
| Less than High School | 23 (57.5%) | 17 (42.5%) |
| High School Diploma | 159 (95.8%) | 7 (4.2%) |
| College/Associate Degree | 85 (63.0%) | 50 (37.0%) |
| Bachelor's Degree or higher | 80 (81.6%) | 18 (18.4%) |
Occupancy by Age of Householder in Cottonwood Shores
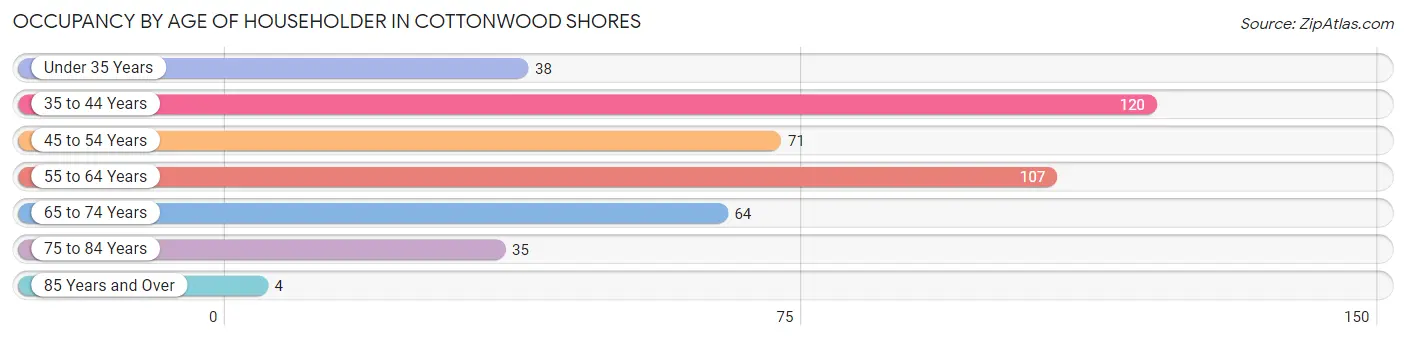
| Age Bracket | # Households | % Households |
| Under 35 Years | 38 | 8.7% |
| 35 to 44 Years | 120 | 27.3% |
| 45 to 54 Years | 71 | 16.2% |
| 55 to 64 Years | 107 | 24.4% |
| 65 to 74 Years | 64 | 14.6% |
| 75 to 84 Years | 35 | 8.0% |
| 85 Years and Over | 4 | 0.9% |
| Total | 439 | 100.0% |
Housing Finances in Cottonwood Shores
Median Income by Occupancy in Cottonwood Shores
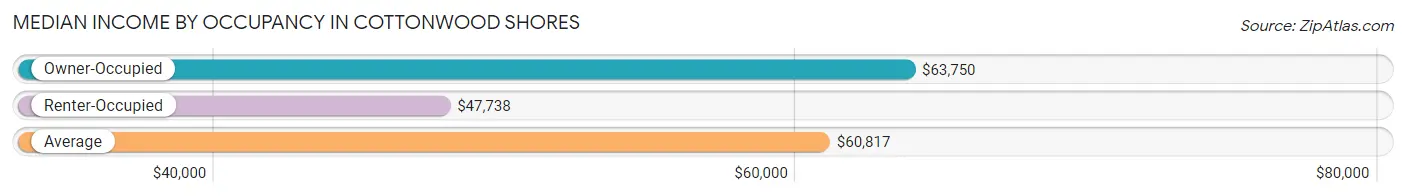
| Occupancy Type | # Households | Median Income |
| Owner-Occupied | 347 (79.0%) | $63,750 |
| Renter-Occupied | 92 (21.0%) | $47,738 |
| Average | 439 (100.0%) | $60,817 |
Occupancy by Householder Income Bracket in Cottonwood Shores
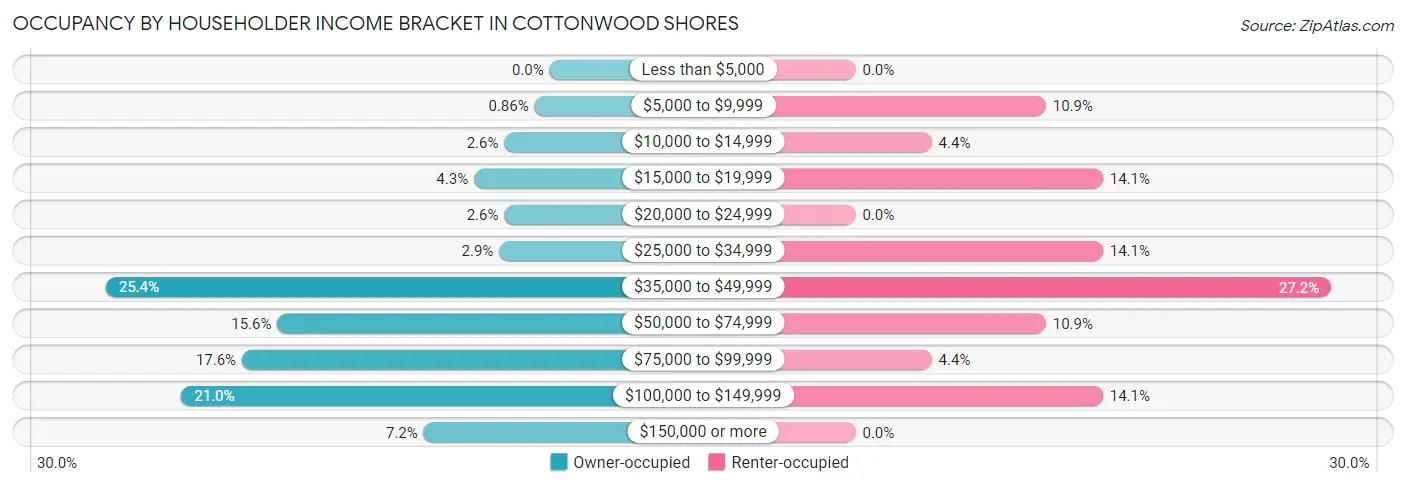
| Income Bracket | Owner-occupied | Renter-occupied |
| Less than $5,000 | 0 (0.0%) | 0 (0.0%) |
| $5,000 to $9,999 | 3 (0.9%) | 10 (10.9%) |
| $10,000 to $14,999 | 9 (2.6%) | 4 (4.3%) |
| $15,000 to $19,999 | 15 (4.3%) | 13 (14.1%) |
| $20,000 to $24,999 | 9 (2.6%) | 0 (0.0%) |
| $25,000 to $34,999 | 10 (2.9%) | 13 (14.1%) |
| $35,000 to $49,999 | 88 (25.4%) | 25 (27.2%) |
| $50,000 to $74,999 | 54 (15.6%) | 10 (10.9%) |
| $75,000 to $99,999 | 61 (17.6%) | 4 (4.3%) |
| $100,000 to $149,999 | 73 (21.0%) | 13 (14.1%) |
| $150,000 or more | 25 (7.2%) | 0 (0.0%) |
| Total | 347 (100.0%) | 92 (100.0%) |
Monthly Housing Cost Tiers in Cottonwood Shores
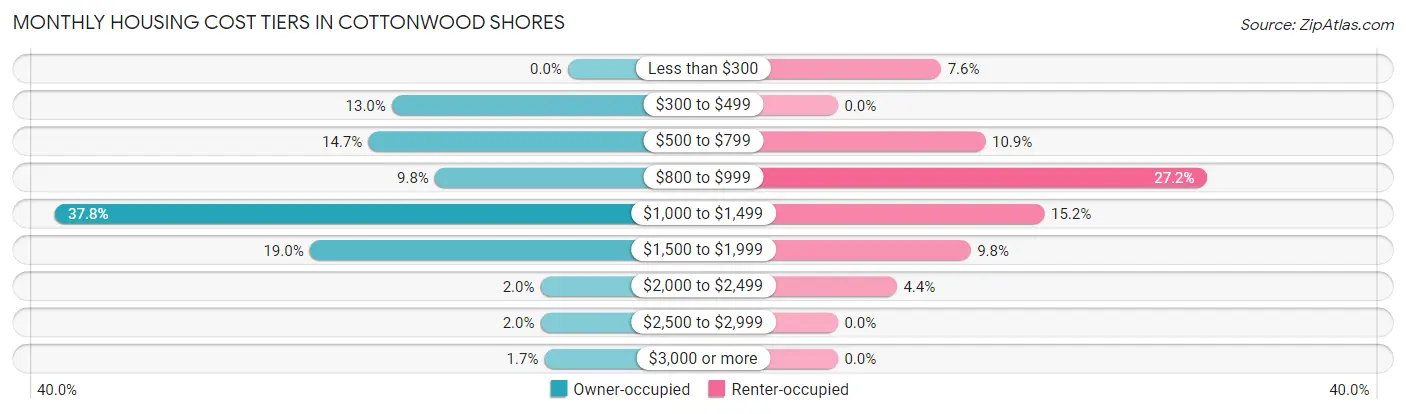
| Monthly Cost | Owner-occupied | Renter-occupied |
| Less than $300 | 0 (0.0%) | 7 (7.6%) |
| $300 to $499 | 45 (13.0%) | 0 (0.0%) |
| $500 to $799 | 51 (14.7%) | 10 (10.9%) |
| $800 to $999 | 34 (9.8%) | 25 (27.2%) |
| $1,000 to $1,499 | 131 (37.8%) | 14 (15.2%) |
| $1,500 to $1,999 | 66 (19.0%) | 9 (9.8%) |
| $2,000 to $2,499 | 7 (2.0%) | 4 (4.3%) |
| $2,500 to $2,999 | 7 (2.0%) | 0 (0.0%) |
| $3,000 or more | 6 (1.7%) | 0 (0.0%) |
| Total | 347 (100.0%) | 92 (100.0%) |
Physical Housing Characteristics in Cottonwood Shores
Housing Structures in Cottonwood Shores
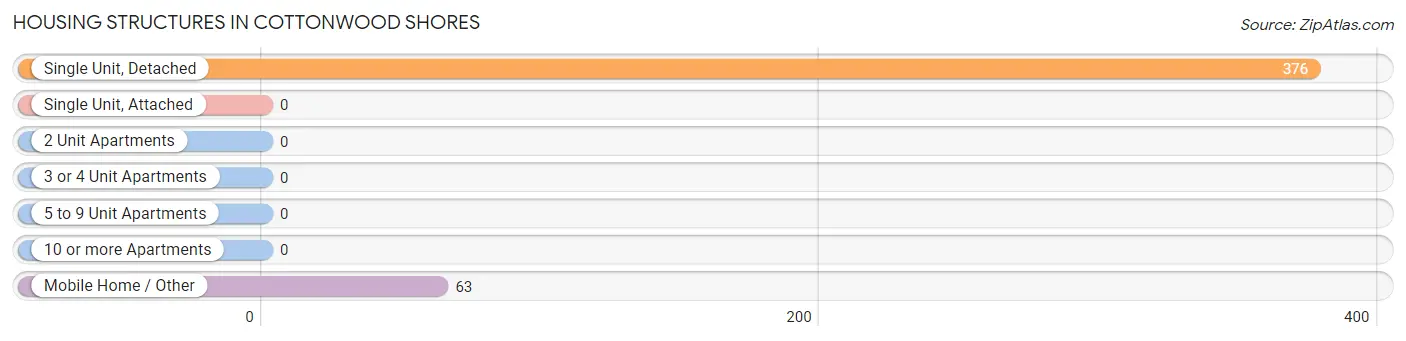
| Structure Type | # Housing Units | % Housing Units |
| Single Unit, Detached | 376 | 85.7% |
| Single Unit, Attached | 0 | 0.0% |
| 2 Unit Apartments | 0 | 0.0% |
| 3 or 4 Unit Apartments | 0 | 0.0% |
| 5 to 9 Unit Apartments | 0 | 0.0% |
| 10 or more Apartments | 0 | 0.0% |
| Mobile Home / Other | 63 | 14.3% |
| Total | 439 | 100.0% |
Housing Structures by Occupancy in Cottonwood Shores
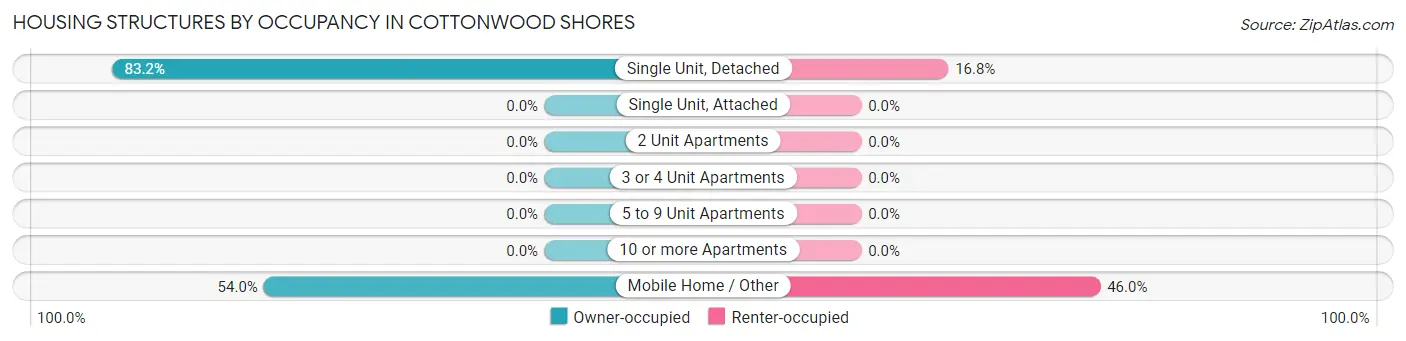
| Structure Type | Owner-occupied | Renter-occupied |
| Single Unit, Detached | 313 (83.2%) | 63 (16.8%) |
| Single Unit, Attached | 0 (0.0%) | 0 (0.0%) |
| 2 Unit Apartments | 0 (0.0%) | 0 (0.0%) |
| 3 or 4 Unit Apartments | 0 (0.0%) | 0 (0.0%) |
| 5 to 9 Unit Apartments | 0 (0.0%) | 0 (0.0%) |
| 10 or more Apartments | 0 (0.0%) | 0 (0.0%) |
| Mobile Home / Other | 34 (54.0%) | 29 (46.0%) |
| Total | 347 (79.0%) | 92 (21.0%) |
Housing Structures by Number of Rooms in Cottonwood Shores
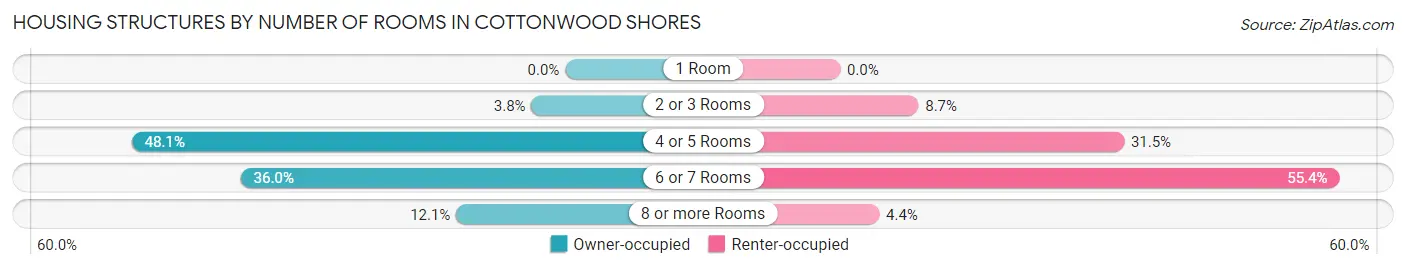
| Number of Rooms | Owner-occupied | Renter-occupied |
| 1 Room | 0 (0.0%) | 0 (0.0%) |
| 2 or 3 Rooms | 13 (3.7%) | 8 (8.7%) |
| 4 or 5 Rooms | 167 (48.1%) | 29 (31.5%) |
| 6 or 7 Rooms | 125 (36.0%) | 51 (55.4%) |
| 8 or more Rooms | 42 (12.1%) | 4 (4.3%) |
| Total | 347 (100.0%) | 92 (100.0%) |
Housing Structure by Heating Type in Cottonwood Shores
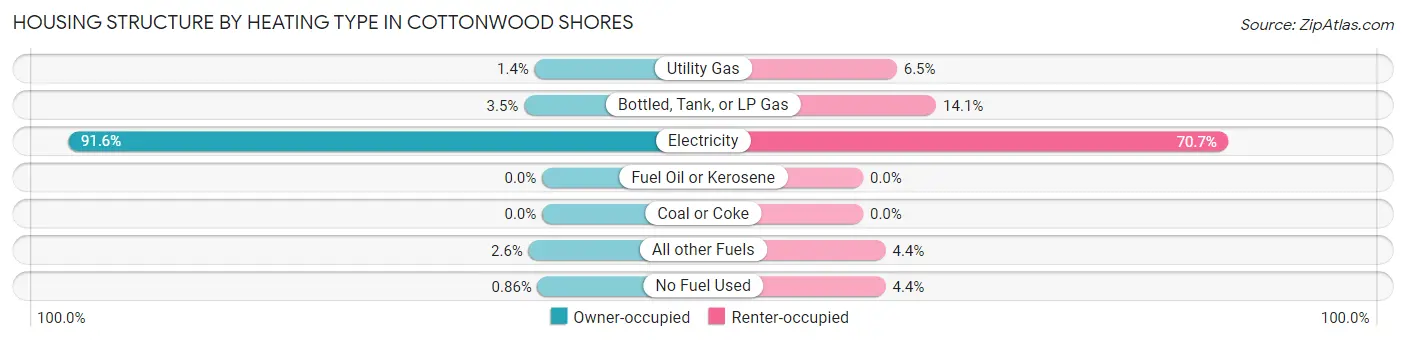
| Heating Type | Owner-occupied | Renter-occupied |
| Utility Gas | 5 (1.4%) | 6 (6.5%) |
| Bottled, Tank, or LP Gas | 12 (3.5%) | 13 (14.1%) |
| Electricity | 318 (91.6%) | 65 (70.7%) |
| Fuel Oil or Kerosene | 0 (0.0%) | 0 (0.0%) |
| Coal or Coke | 0 (0.0%) | 0 (0.0%) |
| All other Fuels | 9 (2.6%) | 4 (4.3%) |
| No Fuel Used | 3 (0.9%) | 4 (4.3%) |
| Total | 347 (100.0%) | 92 (100.0%) |
Household Vehicle Usage in Cottonwood Shores
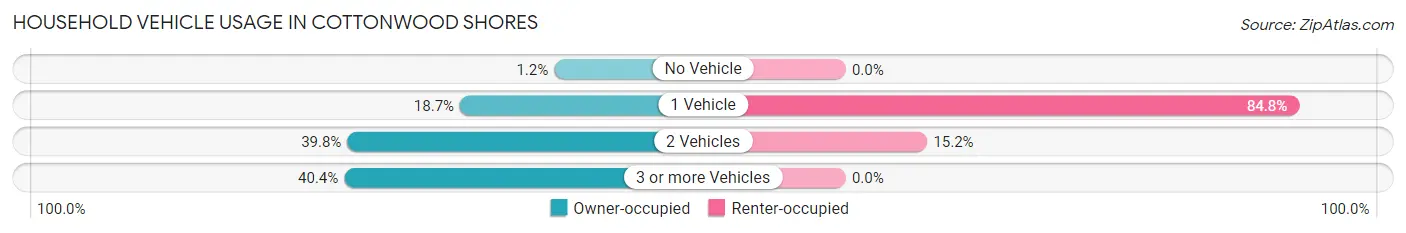
| Vehicles per Household | Owner-occupied | Renter-occupied |
| No Vehicle | 4 (1.1%) | 0 (0.0%) |
| 1 Vehicle | 65 (18.7%) | 78 (84.8%) |
| 2 Vehicles | 138 (39.8%) | 14 (15.2%) |
| 3 or more Vehicles | 140 (40.4%) | 0 (0.0%) |
| Total | 347 (100.0%) | 92 (100.0%) |
Real Estate & Mortgages in Cottonwood Shores
Real Estate and Mortgage Overview in Cottonwood Shores
| Characteristic | Without Mortgage | With Mortgage |
| Housing Units | 114 | 233 |
| Median Property Value | $178,600 | $219,400 |
| Median Household Income | $61,136 | $25 |
| Monthly Housing Costs | $575 | $6 |
| Real Estate Taxes | $1,875 | $7 |
Property Value by Mortgage Status in Cottonwood Shores
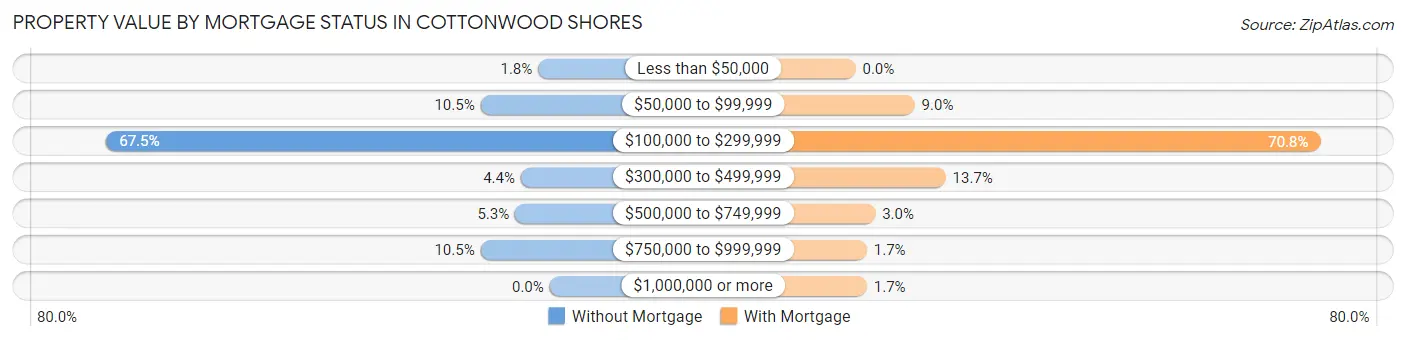
| Property Value | Without Mortgage | With Mortgage |
| Less than $50,000 | 2 (1.8%) | 0 (0.0%) |
| $50,000 to $99,999 | 12 (10.5%) | 21 (9.0%) |
| $100,000 to $299,999 | 77 (67.5%) | 165 (70.8%) |
| $300,000 to $499,999 | 5 (4.4%) | 32 (13.7%) |
| $500,000 to $749,999 | 6 (5.3%) | 7 (3.0%) |
| $750,000 to $999,999 | 12 (10.5%) | 4 (1.7%) |
| $1,000,000 or more | 0 (0.0%) | 4 (1.7%) |
| Total | 114 (100.0%) | 233 (100.0%) |
Household Income by Mortgage Status in Cottonwood Shores
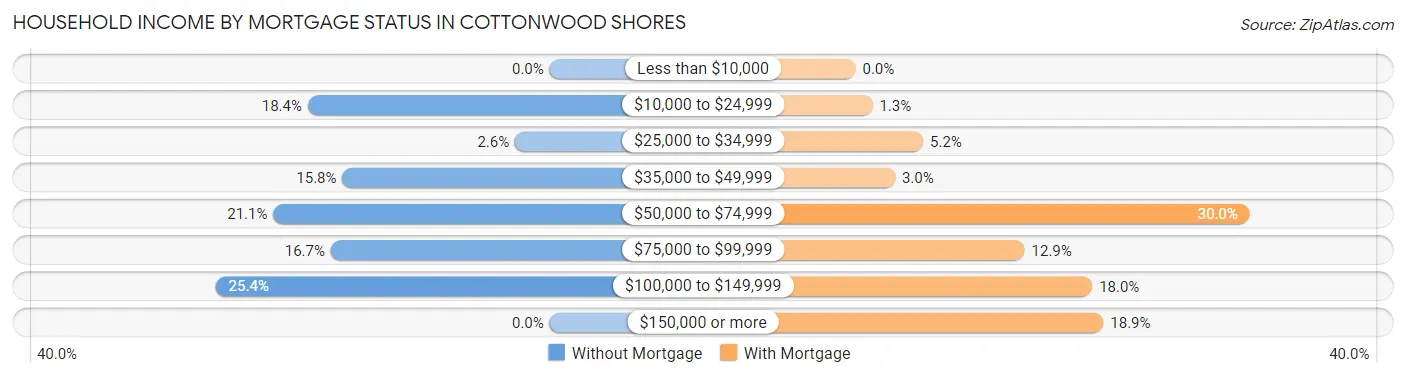
| Household Income | Without Mortgage | With Mortgage |
| Less than $10,000 | 0 (0.0%) | 0 (0.0%) |
| $10,000 to $24,999 | 21 (18.4%) | 3 (1.3%) |
| $25,000 to $34,999 | 3 (2.6%) | 12 (5.1%) |
| $35,000 to $49,999 | 18 (15.8%) | 7 (3.0%) |
| $50,000 to $74,999 | 24 (21.0%) | 70 (30.0%) |
| $75,000 to $99,999 | 19 (16.7%) | 30 (12.9%) |
| $100,000 to $149,999 | 29 (25.4%) | 42 (18.0%) |
| $150,000 or more | 0 (0.0%) | 44 (18.9%) |
| Total | 114 (100.0%) | 233 (100.0%) |
Property Value to Household Income Ratio in Cottonwood Shores
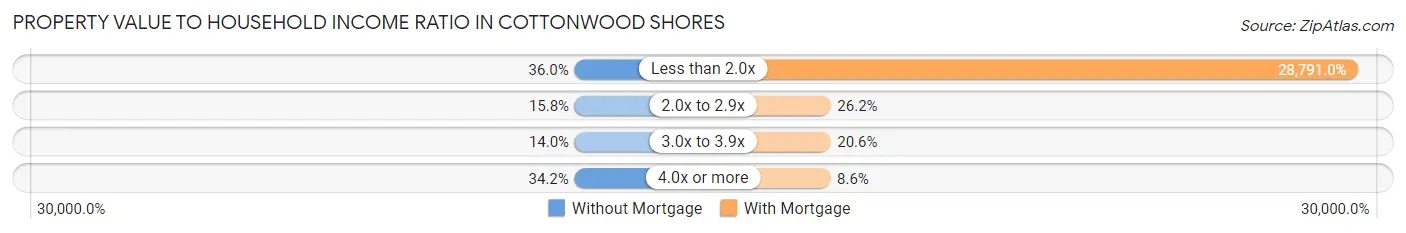
| Value-to-Income Ratio | Without Mortgage | With Mortgage |
| Less than 2.0x | 41 (36.0%) | 67,083 (28,791.0%) |
| 2.0x to 2.9x | 18 (15.8%) | 61 (26.2%) |
| 3.0x to 3.9x | 16 (14.0%) | 48 (20.6%) |
| 4.0x or more | 39 (34.2%) | 20 (8.6%) |
| Total | 114 (100.0%) | 233 (100.0%) |
Real Estate Taxes by Mortgage Status in Cottonwood Shores
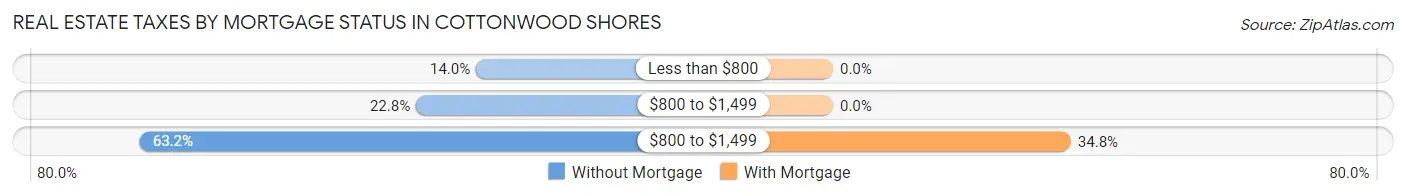
| Property Taxes | Without Mortgage | With Mortgage |
| Less than $800 | 16 (14.0%) | 0 (0.0%) |
| $800 to $1,499 | 26 (22.8%) | 0 (0.0%) |
| $800 to $1,499 | 72 (63.2%) | 81 (34.8%) |
| Total | 114 (100.0%) | 233 (100.0%) |
Health & Disability in Cottonwood Shores
Health Insurance Coverage by Age in Cottonwood Shores
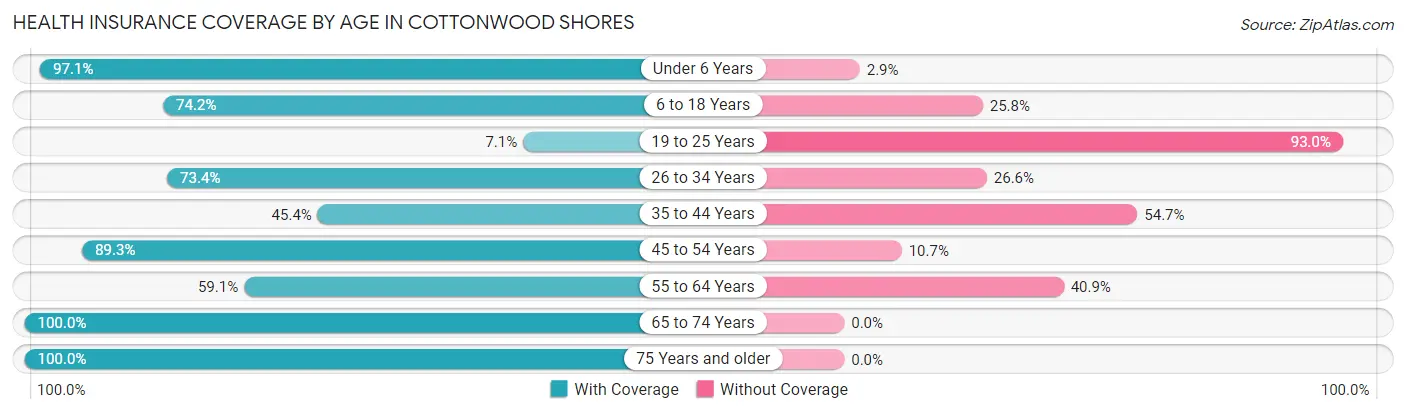
| Age Bracket | With Coverage | Without Coverage |
| Under 6 Years | 168 (97.1%) | 5 (2.9%) |
| 6 to 18 Years | 178 (74.2%) | 62 (25.8%) |
| 19 to 25 Years | 11 (7.0%) | 145 (92.9%) |
| 26 to 34 Years | 127 (73.4%) | 46 (26.6%) |
| 35 to 44 Years | 78 (45.4%) | 94 (54.6%) |
| 45 to 54 Years | 175 (89.3%) | 21 (10.7%) |
| 55 to 64 Years | 130 (59.1%) | 90 (40.9%) |
| 65 to 74 Years | 87 (100.0%) | 0 (0.0%) |
| 75 Years and older | 64 (100.0%) | 0 (0.0%) |
| Total | 1,018 (68.7%) | 463 (31.3%) |
Health Insurance Coverage by Citizenship Status in Cottonwood Shores
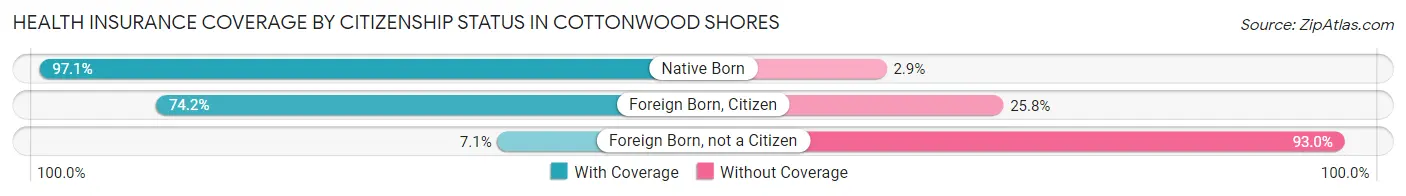
| Citizenship Status | With Coverage | Without Coverage |
| Native Born | 168 (97.1%) | 5 (2.9%) |
| Foreign Born, Citizen | 178 (74.2%) | 62 (25.8%) |
| Foreign Born, not a Citizen | 11 (7.0%) | 145 (92.9%) |
Health Insurance Coverage by Household Income in Cottonwood Shores
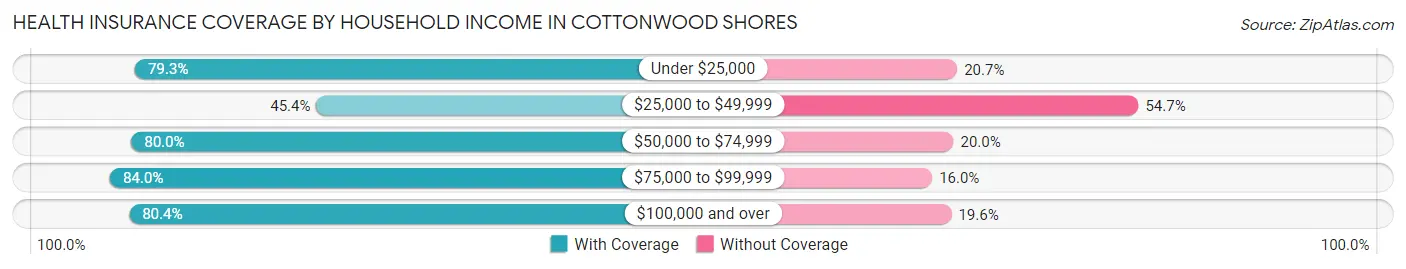
| Household Income | With Coverage | Without Coverage |
| Under $25,000 | 69 (79.3%) | 18 (20.7%) |
| $25,000 to $49,999 | 234 (45.4%) | 282 (54.6%) |
| $50,000 to $74,999 | 152 (80.0%) | 38 (20.0%) |
| $75,000 to $99,999 | 231 (84.0%) | 44 (16.0%) |
| $100,000 and over | 332 (80.4%) | 81 (19.6%) |
Public vs Private Health Insurance Coverage by Age in Cottonwood Shores
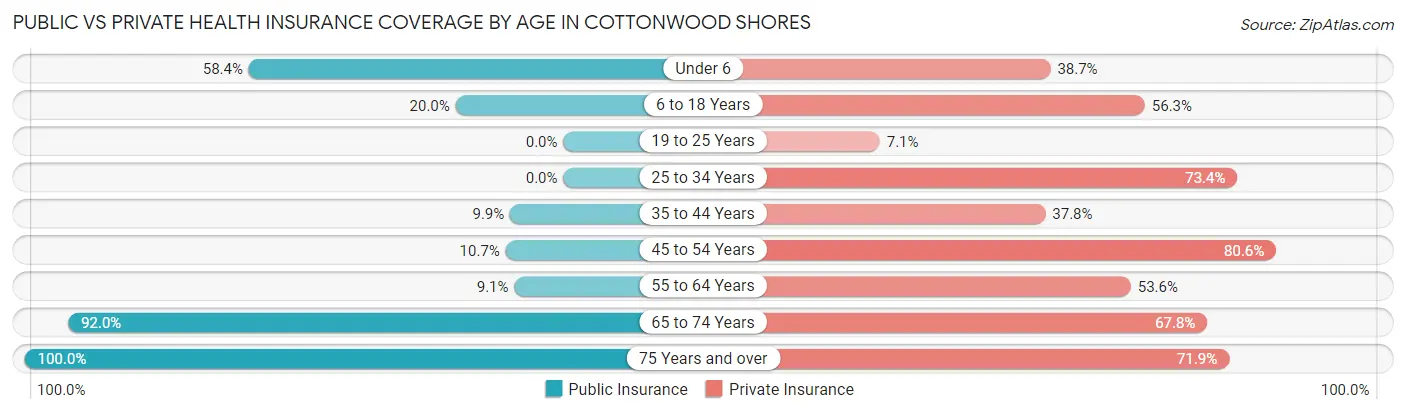
| Age Bracket | Public Insurance | Private Insurance |
| Under 6 | 101 (58.4%) | 67 (38.7%) |
| 6 to 18 Years | 48 (20.0%) | 135 (56.2%) |
| 19 to 25 Years | 0 (0.0%) | 11 (7.0%) |
| 25 to 34 Years | 0 (0.0%) | 127 (73.4%) |
| 35 to 44 Years | 17 (9.9%) | 65 (37.8%) |
| 45 to 54 Years | 21 (10.7%) | 158 (80.6%) |
| 55 to 64 Years | 20 (9.1%) | 118 (53.6%) |
| 65 to 74 Years | 80 (91.9%) | 59 (67.8%) |
| 75 Years and over | 64 (100.0%) | 46 (71.9%) |
| Total | 351 (23.7%) | 786 (53.1%) |
Disability Status by Sex by Age in Cottonwood Shores
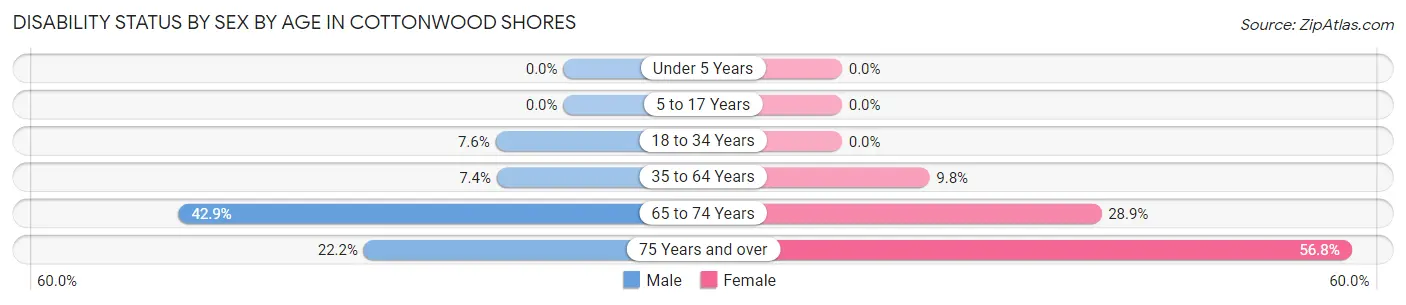
| Age Bracket | Male | Female |
| Under 5 Years | 0 (0.0%) | 0 (0.0%) |
| 5 to 17 Years | 0 (0.0%) | 0 (0.0%) |
| 18 to 34 Years | 12 (7.5%) | 0 (0.0%) |
| 35 to 64 Years | 20 (7.4%) | 31 (9.8%) |
| 65 to 74 Years | 18 (42.9%) | 13 (28.9%) |
| 75 Years and over | 6 (22.2%) | 21 (56.8%) |
Disability Class by Sex by Age in Cottonwood Shores
Disability Class: Hearing Difficulty
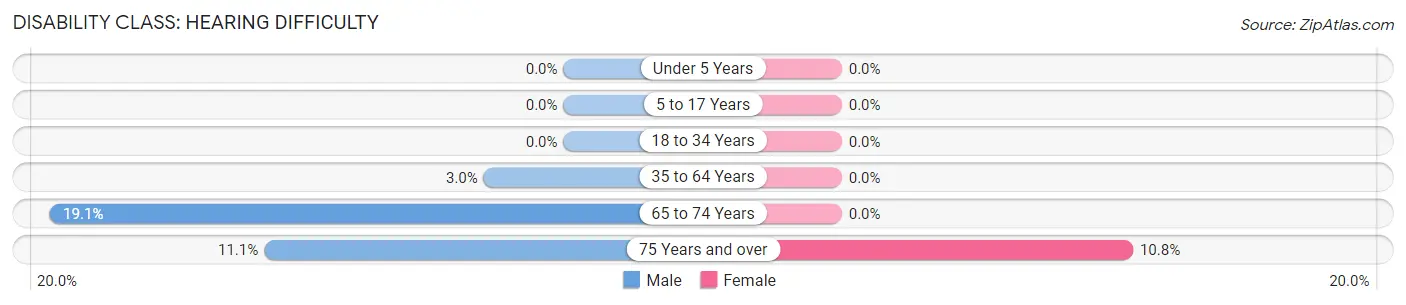
| Age Bracket | Male | Female |
| Under 5 Years | 0 (0.0%) | 0 (0.0%) |
| 5 to 17 Years | 0 (0.0%) | 0 (0.0%) |
| 18 to 34 Years | 0 (0.0%) | 0 (0.0%) |
| 35 to 64 Years | 8 (3.0%) | 0 (0.0%) |
| 65 to 74 Years | 8 (19.1%) | 0 (0.0%) |
| 75 Years and over | 3 (11.1%) | 4 (10.8%) |
Disability Class: Vision Difficulty
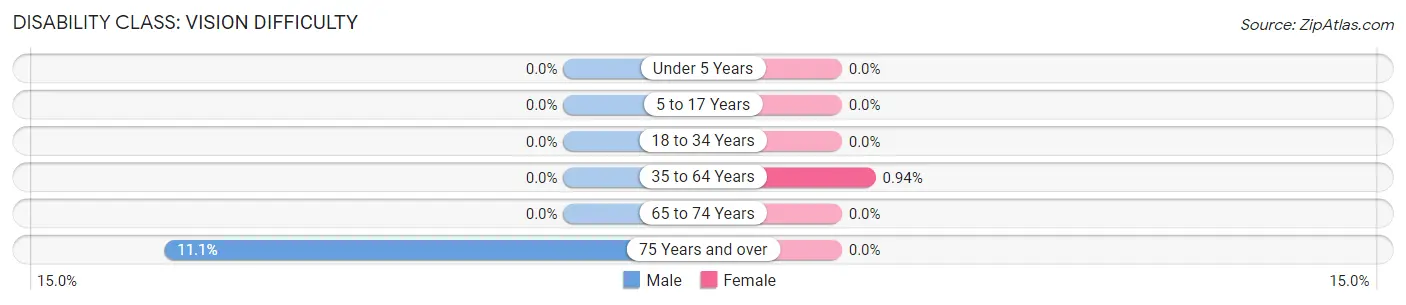
| Age Bracket | Male | Female |
| Under 5 Years | 0 (0.0%) | 0 (0.0%) |
| 5 to 17 Years | 0 (0.0%) | 0 (0.0%) |
| 18 to 34 Years | 0 (0.0%) | 0 (0.0%) |
| 35 to 64 Years | 0 (0.0%) | 3 (0.9%) |
| 65 to 74 Years | 0 (0.0%) | 0 (0.0%) |
| 75 Years and over | 3 (11.1%) | 0 (0.0%) |
Disability Class: Cognitive Difficulty
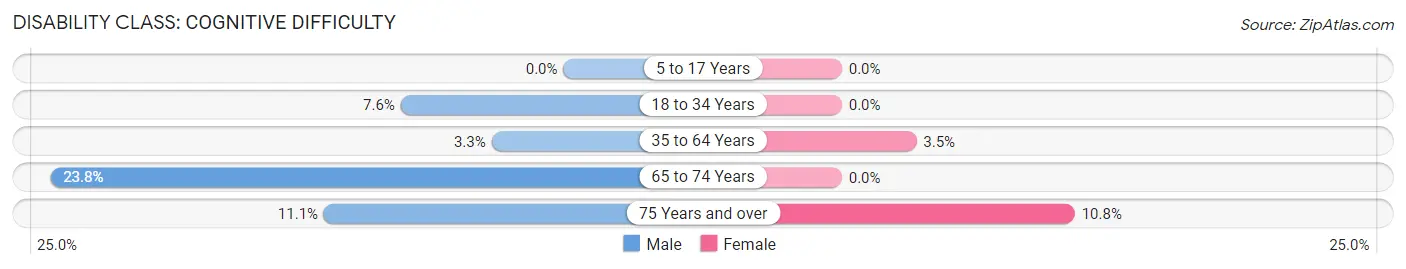
| Age Bracket | Male | Female |
| 5 to 17 Years | 0 (0.0%) | 0 (0.0%) |
| 18 to 34 Years | 12 (7.5%) | 0 (0.0%) |
| 35 to 64 Years | 9 (3.3%) | 11 (3.5%) |
| 65 to 74 Years | 10 (23.8%) | 0 (0.0%) |
| 75 Years and over | 3 (11.1%) | 4 (10.8%) |
Disability Class: Ambulatory Difficulty
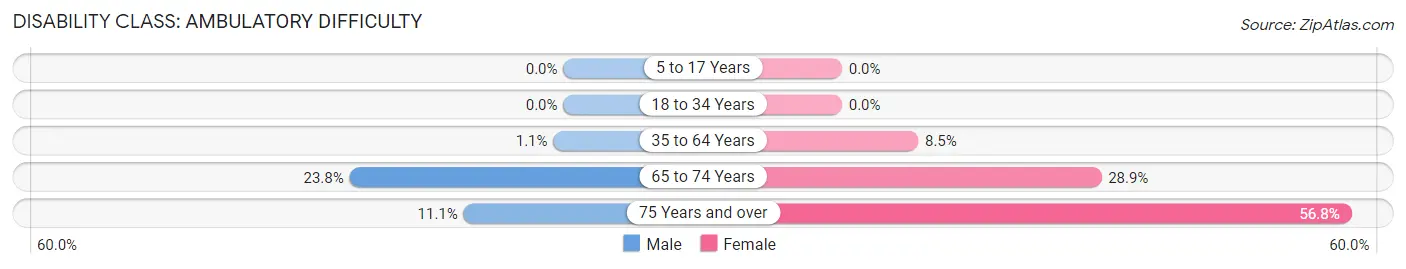
| Age Bracket | Male | Female |
| 5 to 17 Years | 0 (0.0%) | 0 (0.0%) |
| 18 to 34 Years | 0 (0.0%) | 0 (0.0%) |
| 35 to 64 Years | 3 (1.1%) | 27 (8.5%) |
| 65 to 74 Years | 10 (23.8%) | 13 (28.9%) |
| 75 Years and over | 3 (11.1%) | 21 (56.8%) |
Disability Class: Self-Care Difficulty
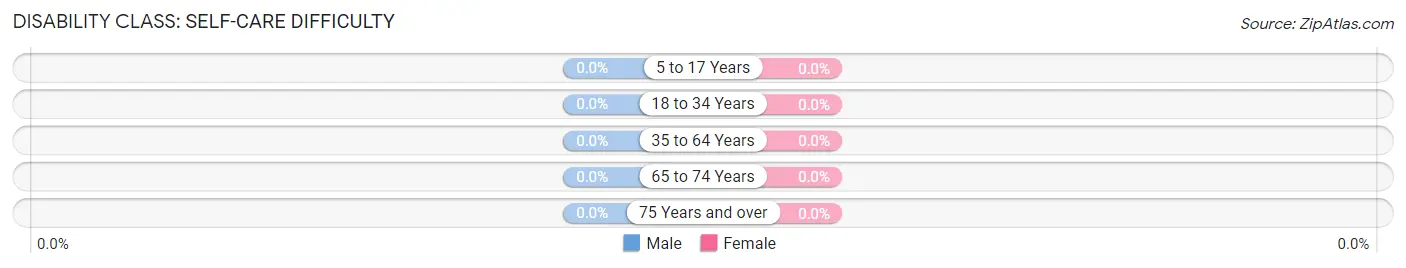
| Age Bracket | Male | Female |
| 5 to 17 Years | 0 (0.0%) | 0 (0.0%) |
| 18 to 34 Years | 0 (0.0%) | 0 (0.0%) |
| 35 to 64 Years | 0 (0.0%) | 0 (0.0%) |
| 65 to 74 Years | 0 (0.0%) | 0 (0.0%) |
| 75 Years and over | 0 (0.0%) | 0 (0.0%) |
Technology Access in Cottonwood Shores
Computing Device Access in Cottonwood Shores
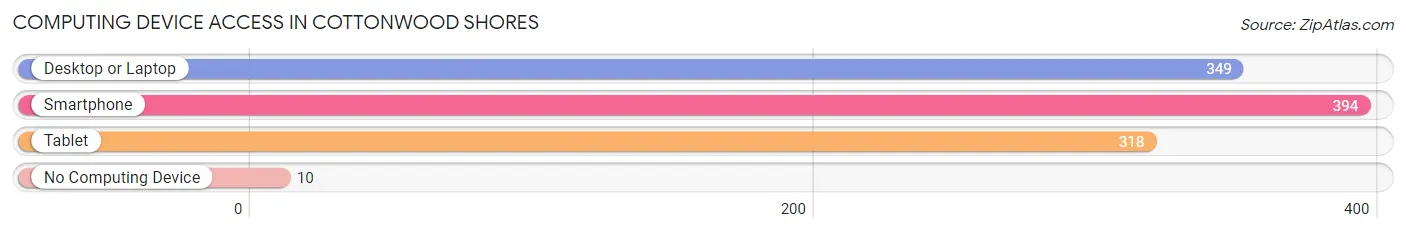
| Device Type | # Households | % Households |
| Desktop or Laptop | 349 | 79.5% |
| Smartphone | 394 | 89.7% |
| Tablet | 318 | 72.4% |
| No Computing Device | 10 | 2.3% |
| Total | 439 | 100.0% |
Internet Access in Cottonwood Shores
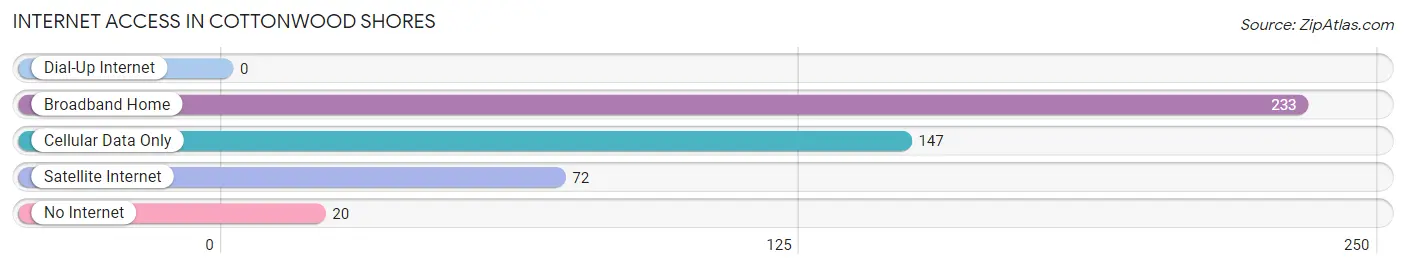
| Internet Type | # Households | % Households |
| Dial-Up Internet | 0 | 0.0% |
| Broadband Home | 233 | 53.1% |
| Cellular Data Only | 147 | 33.5% |
| Satellite Internet | 72 | 16.4% |
| No Internet | 20 | 4.6% |
| Total | 439 | 100.0% |
Cottonwood Shores Summary
Cottonwood Shores is a small city located in Burnet County, Texas, United States. It is situated on the north shore of Lake LBJ, a reservoir on the Colorado River. The city was incorporated in 2006 and has a population of approximately 1,500 people.
History
The area that is now Cottonwood Shores was originally inhabited by the Tonkawa Native American tribe. The first European settlers arrived in the area in the late 1800s and began to establish farms and ranches. The area was known as Cottonwood Point, and the first post office was established in 1891.
In the early 1900s, the area began to develop as a resort destination. The first hotel was built in 1912, and the area was renamed Cottonwood Shores. The city was officially incorporated in 2006.
Geography
Cottonwood Shores is located in Burnet County, Texas, United States. It is situated on the north shore of Lake LBJ, a reservoir on the Colorado River. The city has a total area of 2.2 square miles, all of which is land.
The city is located in the Hill Country region of Texas, and the terrain is mostly flat with rolling hills. The climate is humid subtropical, with hot summers and mild winters.
Economy
The economy of Cottonwood Shores is largely based on tourism. The city is a popular destination for fishing, boating, and other outdoor activities. There are several marinas and boat ramps in the area, as well as several restaurants and hotels.
The city is also home to several businesses, including a grocery store, a hardware store, and a gas station. The city is served by the Marble Falls Independent School District.
Demographics
As of the 2010 census, the population of Cottonwood Shores was 1,500. The racial makeup of the city was 94.7% White, 0.7% African American, 0.3% Native American, 0.7% Asian, and 3.3% from other races. Hispanic or Latino of any race were 5.3% of the population.
The median household income in Cottonwood Shores was $50,000, and the median family income was $54,000. The per capita income was $21,000. About 8.3% of families and 10.3% of the population were below the poverty line.
Conclusion
Cottonwood Shores is a small city located in Burnet County, Texas, United States. It is situated on the north shore of Lake LBJ, a reservoir on the Colorado River. The city was originally inhabited by the Tonkawa Native American tribe and was later developed as a resort destination. The economy of Cottonwood Shores is largely based on tourism, and the city is a popular destination for fishing, boating, and other outdoor activities. As of the 2010 census, the population of Cottonwood Shores was 1,500. The median household income in Cottonwood Shores was $50,000, and the median family income was $54,000.
Common Questions
What is Per Capita Income in Cottonwood Shores?
Per Capita income in Cottonwood Shores is $22,296.
What is the Median Family Income in Cottonwood Shores?
Median Family Income in Cottonwood Shores is $62,431.
What is the Median Household income in Cottonwood Shores?
Median Household Income in Cottonwood Shores is $60,817.
What is Income or Wage Gap in Cottonwood Shores?
Income or Wage Gap in Cottonwood Shores is 13.2%.
Women in Cottonwood Shores earn 86.8 cents for every dollar earned by a man.
What is Inequality or Gini Index in Cottonwood Shores?
Inequality or Gini Index in Cottonwood Shores is 0.33.
What is the Total Population of Cottonwood Shores?
Total Population of Cottonwood Shores is 1,481.
What is the Total Male Population of Cottonwood Shores?
Total Male Population of Cottonwood Shores is 727.
What is the Total Female Population of Cottonwood Shores?
Total Female Population of Cottonwood Shores is 754.
What is the Ratio of Males per 100 Females in Cottonwood Shores?
There are 96.42 Males per 100 Females in Cottonwood Shores.
What is the Ratio of Females per 100 Males in Cottonwood Shores?
There are 103.71 Females per 100 Males in Cottonwood Shores.
What is the Median Population Age in Cottonwood Shores?
Median Population Age in Cottonwood Shores is 34.8 Years.
What is the Average Family Size in Cottonwood Shores
Average Family Size in Cottonwood Shores is 4.0 People.
What is the Average Household Size in Cottonwood Shores
Average Household Size in Cottonwood Shores is 3.4 People.
How Large is the Labor Force in Cottonwood Shores?
There are 864 People in the Labor Forcein in Cottonwood Shores.
What is the Percentage of People in the Labor Force in Cottonwood Shores?
75.5% of People are in the Labor Force in Cottonwood Shores.
What is the Unemployment Rate in Cottonwood Shores?
Unemployment Rate in Cottonwood Shores is 2.5%.