Zip Codes with the Highest Percentage of Population Employed in Administrative & Support Services in Dallas, TX
RELATED REPORTS & OPTIONS
Administrative & Support Services
Dallas
Compare Zip Codes
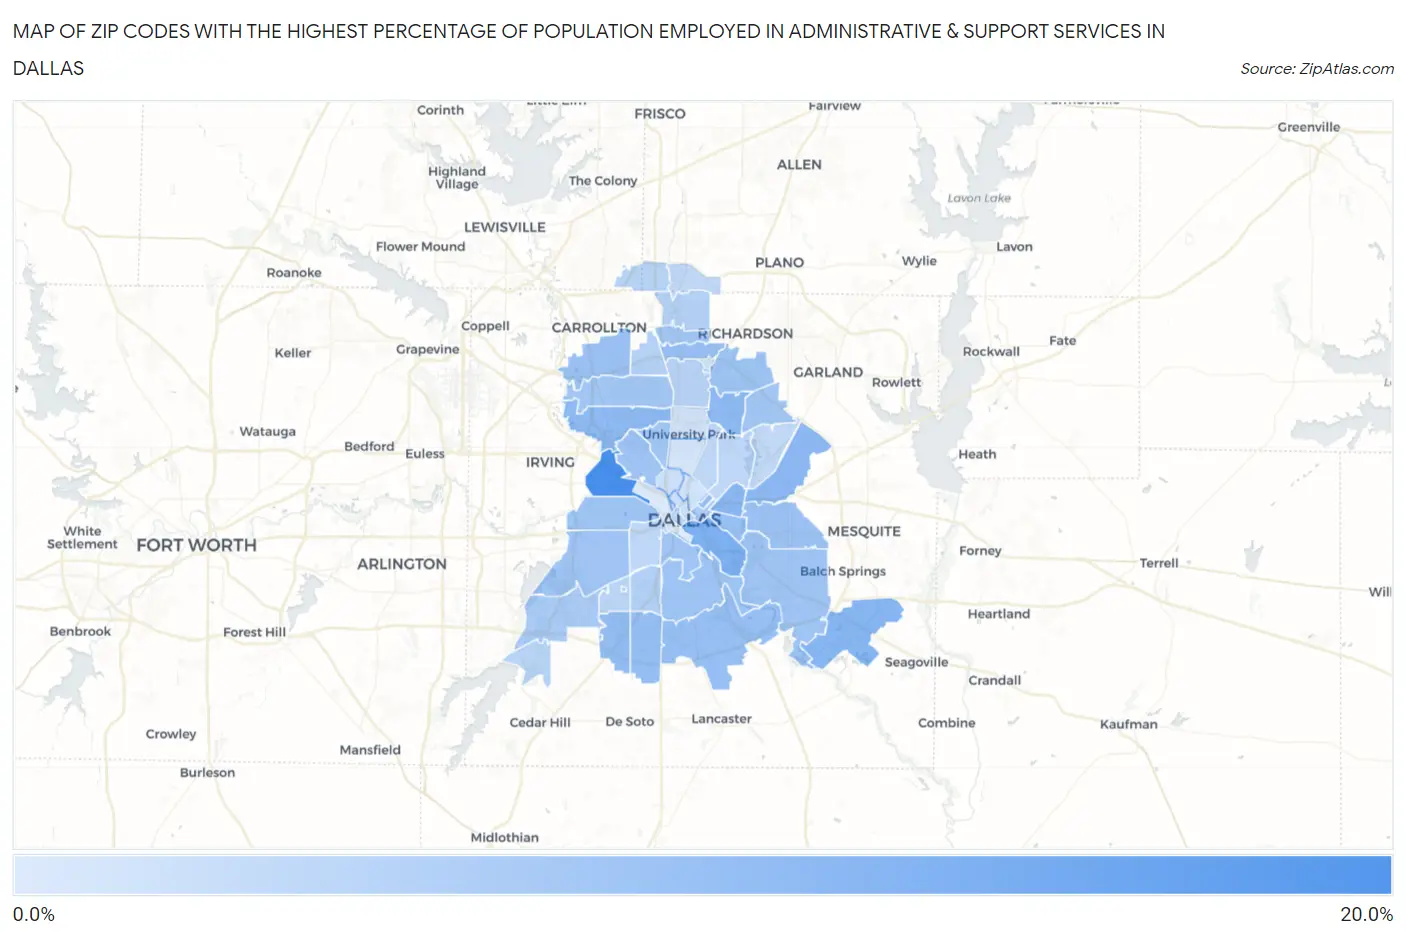
Map of Zip Codes with the Highest Percentage of Population Employed in Administrative & Support Services in Dallas
0.36%
16.5%
Zip Codes with the Highest Percentage of Population Employed in Administrative & Support Services in Dallas, TX
| Zip Code | % Employed | vs State | vs National | |
| 1. | 75247 | 16.5% | 4.4%(+12.1)#27 | 4.1%(+12.4)#426 |
| 2. | 75215 | 10.3% | 4.4%(+5.91)#81 | 4.1%(+6.17)#1,193 |
| 3. | 75253 | 9.2% | 4.4%(+4.78)#102 | 4.1%(+5.04)#1,591 |
| 4. | 75223 | 8.9% | 4.4%(+4.52)#111 | 4.1%(+4.78)#1,724 |
| 5. | 75228 | 8.8% | 4.4%(+4.37)#117 | 4.1%(+4.64)#1,799 |
| 6. | 75231 | 8.6% | 4.4%(+4.19)#129 | 4.1%(+4.45)#1,909 |
| 7. | 75220 | 8.6% | 4.4%(+4.17)#130 | 4.1%(+4.43)#1,923 |
| 8. | 75237 | 7.9% | 4.4%(+3.49)#162 | 4.1%(+3.76)#2,347 |
| 9. | 75232 | 7.8% | 4.4%(+3.38)#169 | 4.1%(+3.64)#2,424 |
| 10. | 75246 | 7.7% | 4.4%(+3.30)#173 | 4.1%(+3.57)#2,498 |
| 11. | 75210 | 7.5% | 4.4%(+3.07)#188 | 4.1%(+3.33)#2,702 |
| 12. | 75241 | 7.5% | 4.4%(+3.05)#192 | 4.1%(+3.32)#2,722 |
| 13. | 75240 | 7.4% | 4.4%(+3.00)#194 | 4.1%(+3.27)#2,765 |
| 14. | 75227 | 7.1% | 4.4%(+2.69)#216 | 4.1%(+2.96)#3,079 |
| 15. | 75234 | 6.9% | 4.4%(+2.53)#234 | 4.1%(+2.80)#3,291 |
| 16. | 75243 | 6.9% | 4.4%(+2.48)#239 | 4.1%(+2.75)#3,343 |
| 17. | 75216 | 6.9% | 4.4%(+2.44)#248 | 4.1%(+2.70)#3,412 |
| 18. | 75212 | 6.7% | 4.4%(+2.31)#261 | 4.1%(+2.58)#3,579 |
| 19. | 75217 | 6.6% | 4.4%(+2.23)#272 | 4.1%(+2.50)#3,705 |
| 20. | 75203 | 6.5% | 4.4%(+2.13)#283 | 4.1%(+2.39)#3,850 |
| 21. | 75211 | 6.5% | 4.4%(+2.11)#285 | 4.1%(+2.38)#3,864 |
| 22. | 75235 | 6.5% | 4.4%(+2.07)#289 | 4.1%(+2.33)#3,934 |
| 23. | 75209 | 6.3% | 4.4%(+1.89)#307 | 4.1%(+2.16)#4,226 |
| 24. | 75238 | 6.2% | 4.4%(+1.81)#321 | 4.1%(+2.07)#4,371 |
| 25. | 75229 | 6.2% | 4.4%(+1.80)#323 | 4.1%(+2.06)#4,383 |
| 26. | 75254 | 6.2% | 4.4%(+1.76)#332 | 4.1%(+2.03)#4,454 |
| 27. | 75236 | 5.7% | 4.4%(+1.26)#403 | 4.1%(+1.52)#5,408 |
| 28. | 75226 | 5.5% | 4.4%(+1.04)#436 | 4.1%(+1.31)#5,935 |
| 29. | 75224 | 4.6% | 4.4%(+0.179)#607 | 4.1%(+0.445)#8,397 |
| 30. | 75244 | 4.4% | 4.4%(-0.007)#643 | 4.1%(+0.259)#9,044 |
| 31. | 75248 | 4.3% | 4.4%(-0.067)#656 | 4.1%(+0.199)#9,287 |
| 32. | 75230 | 4.1% | 4.4%(-0.280)#710 | 4.1%(-0.013)#10,097 |
| 33. | 75249 | 3.9% | 4.4%(-0.500)#765 | 4.1%(-0.233)#11,027 |
| 34. | 75287 | 3.8% | 4.4%(-0.629)#798 | 4.1%(-0.362)#11,604 |
| 35. | 75233 | 3.6% | 4.4%(-0.801)#847 | 4.1%(-0.535)#12,402 |
| 36. | 75214 | 3.5% | 4.4%(-0.906)#875 | 4.1%(-0.640)#12,914 |
| 37. | 75208 | 3.4% | 4.4%(-1.00)#897 | 4.1%(-0.736)#13,369 |
| 38. | 75206 | 3.3% | 4.4%(-1.11)#931 | 4.1%(-0.839)#13,890 |
| 39. | 75252 | 3.2% | 4.4%(-1.21)#970 | 4.1%(-0.946)#14,457 |
| 40. | 75202 | 3.1% | 4.4%(-1.31)#999 | 4.1%(-1.04)#14,949 |
| 41. | 75218 | 3.1% | 4.4%(-1.35)#1,014 | 4.1%(-1.08)#15,168 |
| 42. | 75219 | 2.0% | 4.4%(-2.43)#1,286 | 4.1%(-2.17)#20,704 |
| 43. | 75201 | 1.9% | 4.4%(-2.50)#1,305 | 4.1%(-2.24)#21,031 |
| 44. | 75251 | 1.6% | 4.4%(-2.78)#1,362 | 4.1%(-2.51)#22,222 |
| 45. | 75225 | 1.4% | 4.4%(-2.98)#1,401 | 4.1%(-2.71)#22,972 |
| 46. | 75204 | 1.4% | 4.4%(-2.99)#1,402 | 4.1%(-2.72)#23,027 |
| 47. | 75205 | 1.4% | 4.4%(-3.06)#1,410 | 4.1%(-2.79)#23,265 |
| 48. | 75207 | 0.36% | 4.4%(-4.05)#1,541 | 4.1%(-3.79)#26,149 |
1
Common Questions
What are the Top 10 Zip Codes with the Highest Percentage of Population Employed in Administrative & Support Services in Dallas, TX?
Top 10 Zip Codes with the Highest Percentage of Population Employed in Administrative & Support Services in Dallas, TX are:
What zip code has the Highest Percentage of Population Employed in Administrative & Support Services in Dallas, TX?
75247 has the Highest Percentage of Population Employed in Administrative & Support Services in Dallas, TX with 16.5%.
What is the Percentage of Population Employed in Administrative & Support Services in Dallas, TX?
Percentage of Population Employed in Administrative & Support Services in Dallas is 5.6%.
What is the Percentage of Population Employed in Administrative & Support Services in Texas?
Percentage of Population Employed in Administrative & Support Services in Texas is 4.4%.
What is the Percentage of Population Employed in Administrative & Support Services in the United States?
Percentage of Population Employed in Administrative & Support Services in the United States is 4.1%.