Zip Codes with the Highest Percentage of Population Employed in Administrative & Support Services in Denton, TX

RELATED REPORTS & OPTIONS

Administrative & Support Services
Population
Families and Households
Female Fertility
Female Fertility (Unmarried)
Race (Community Size)
Race (Percentage)
Ancestry (Community Size)
AfricanAlbanianAmericanApacheArabArgentineanAustralianAustrianBelgianBelizeanBhutaneseBlackfeetBritishBulgarianBurmeseCajunCanadianCentral AmericanCentral American IndianCherokeeChickasawChileanChippewaChoctawColombianComancheCreekCroatianCubanCzechCzechoslovakianDanishDominicanDutchEastern EuropeanEnglishEthiopianEuropeanFilipinoFinnishFrenchFrench CanadianGermanGhanaianGreekGuamanian / ChamorroGuatemalanHaitianHonduranHungarianIndian (Asian)IranianIrishItalianJamaicanJordanianKenyanKoreanLaotianLebaneseLithuanianMexicanMexican American IndianMongolianMoroccanNative HawaiianNavajoNicaraguanNigerianNorthern EuropeanNorwegianPakistaniPalestinianPanamanianPeruvianPolishPortuguesePuebloPuerto RicanRomanianRussianSalvadoranScandinavianScotch-IrishScottishSeminoleSerbianSlovakSloveneSomaliSouth AmericanSpaniardSpanishSri LankanSubsaharan AfricanSwedishSwissThaiTrinidadian and TobagonianTurkishUkrainianVenezuelanVietnameseWelshWest IndianYugoslavian
Ancestry (Percentage)
AfricanAlbanianAmericanApacheArabArgentineanAustralianAustrianBelgianBelizeanBhutaneseBlackfeetBritishBulgarianBurmeseCajunCanadianCentral AmericanCentral American IndianCherokeeChickasawChileanChippewaChoctawColombianComancheCreekCroatianCubanCzechCzechoslovakianDanishDominicanDutchEastern EuropeanEnglishEthiopianEuropeanFilipinoFinnishFrenchFrench CanadianGermanGhanaianGreekGuamanian / ChamorroGuatemalanHaitianHonduranHungarianIndian (Asian)IranianIrishItalianJamaicanJordanianKenyanKoreanLaotianLebaneseLithuanianMexicanMexican American IndianMongolianMoroccanNative HawaiianNavajoNicaraguanNigerianNorthern EuropeanNorwegianPakistaniPalestinianPanamanianPeruvianPolishPortuguesePuebloPuerto RicanRomanianRussianSalvadoranScandinavianScotch-IrishScottishSeminoleSerbianSlovakSloveneSomaliSouth AmericanSpaniardSpanishSri LankanSubsaharan AfricanSwedishSwissThaiTrinidadian and TobagonianTurkishUkrainianVenezuelanVietnameseWelshWest IndianYugoslavian
Immigrant Origin (Total)
Immigrant Origin (Percentage)
Income
Income (Families)
Income (Households)
Poverty
Poverty (Families)
Unemployment
Employment Occupations
Employment Industries
Employer Class
Commute Time
Commute Means
School Enrollment
Education by Degree Field
Occupancy
Finances
Physical Characteristics
Denton
Compare Zip Codes
Comparison Subject

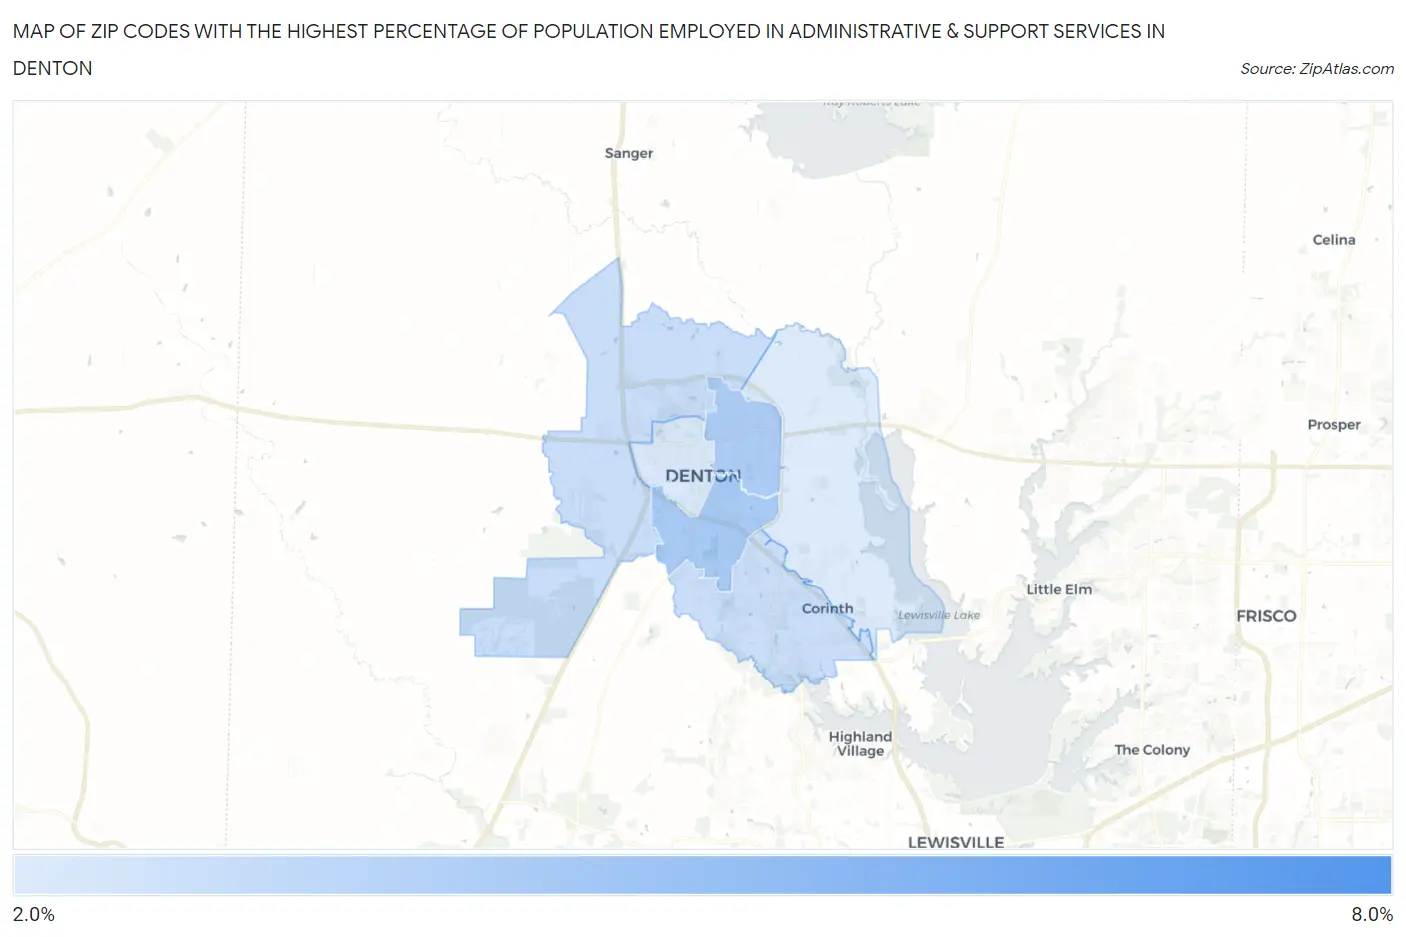
Map of Zip Codes with the Highest Percentage of Population Employed in Administrative & Support Services in Denton

0.0%
8.0%
Zip Codes with the Highest Percentage of Population Employed in Administrative & Support Services in Denton Map

Zip Codes with the Highest Percentage of Population Employed in Administrative & Support Services in Denton, TX

Zip Code % Employed vs State vs National
1.762036.7%4.4%(+2.25)#2714.1%(+2.52)#3,675
2.762053.9%4.4%(-0.491)#7624.1%(-0.225)#10,991
3.762093.8%4.4%(-0.615)#7914.1%(-0.349)#11,525
4.762073.0%4.4%(-1.41)#1,0284.1%(-1.14)#15,428
5.762103.0%4.4%(-1.44)#1,0464.1%(-1.18)#15,618
6.762012.5%4.4%(-1.90)#1,1604.1%(-1.64)#18,078
7.762082.5%4.4%(-1.95)#1,1714.1%(-1.68)#18,305

Common Questions

What are the Top 5 Zip Codes with the Highest Percentage of Population Employed in Administrative & Support Services in Denton, TX?
Top 5 Zip Codes with the Highest Percentage of Population Employed in Administrative & Support Services in Denton, TX are:
#1
6.7%
#2
3.9%
#3
3.8%
#4
3.0%
#5
3.0%
What zip code has the Highest Percentage of Population Employed in Administrative & Support Services in Denton, TX?
76203 has the Highest Percentage of Population Employed in Administrative & Support Services in Denton, TX with 6.7%.
What is the Percentage of Population Employed in Administrative & Support Services in Denton, TX?
Percentage of Population Employed in Administrative & Support Services in Denton is 3.0%.
What is the Percentage of Population Employed in Administrative & Support Services in Texas?
Percentage of Population Employed in Administrative & Support Services in Texas is 4.4%.
What is the Percentage of Population Employed in Administrative & Support Services in the United States?
Percentage of Population Employed in Administrative & Support Services in the United States is 4.1%.