Zip Codes with the Highest Percentage of Population Employed in Administrative & Support Services in Mission, TX
RELATED REPORTS & OPTIONS
Administrative & Support Services
Mission
Compare Zip Codes
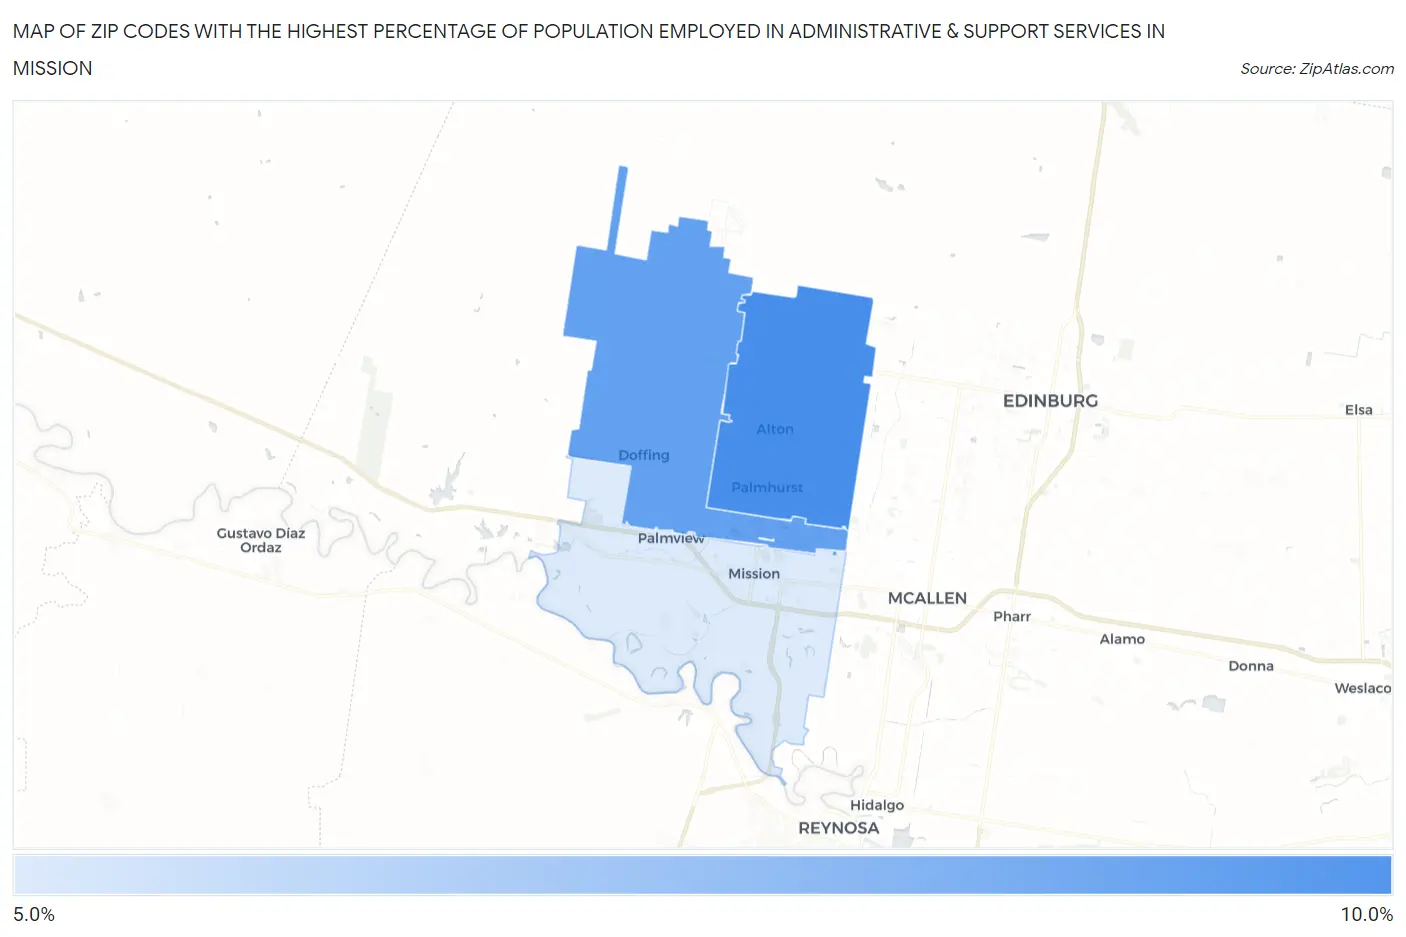
Map of Zip Codes with the Highest Percentage of Population Employed in Administrative & Support Services in Mission
5.5%
8.3%
Zip Codes with the Highest Percentage of Population Employed in Administrative & Support Services in Mission, TX
| Zip Code | % Employed | vs State | vs National | |
| 1. | 78573 | 8.3% | 4.4%(+3.90)#138 | 4.1%(+4.17)#2,076 |
| 2. | 78574 | 7.8% | 4.4%(+3.37)#171 | 4.1%(+3.63)#2,441 |
| 3. | 78572 | 5.5% | 4.4%(+1.13)#419 | 4.1%(+1.39)#5,725 |
1
Common Questions
What are the Top Zip Codes with the Highest Percentage of Population Employed in Administrative & Support Services in Mission, TX?
Top Zip Codes with the Highest Percentage of Population Employed in Administrative & Support Services in Mission, TX are:
What zip code has the Highest Percentage of Population Employed in Administrative & Support Services in Mission, TX?
78573 has the Highest Percentage of Population Employed in Administrative & Support Services in Mission, TX with 8.3%.
What is the Percentage of Population Employed in Administrative & Support Services in Mission, TX?
Percentage of Population Employed in Administrative & Support Services in Mission is 6.9%.
What is the Percentage of Population Employed in Administrative & Support Services in Texas?
Percentage of Population Employed in Administrative & Support Services in Texas is 4.4%.
What is the Percentage of Population Employed in Administrative & Support Services in the United States?
Percentage of Population Employed in Administrative & Support Services in the United States is 4.1%.