Zip Codes with the Highest Percentage of Population Employed in Administrative & Support Services in San Antonio, TX
RELATED REPORTS & OPTIONS
Administrative & Support Services
San Antonio
Compare Zip Codes
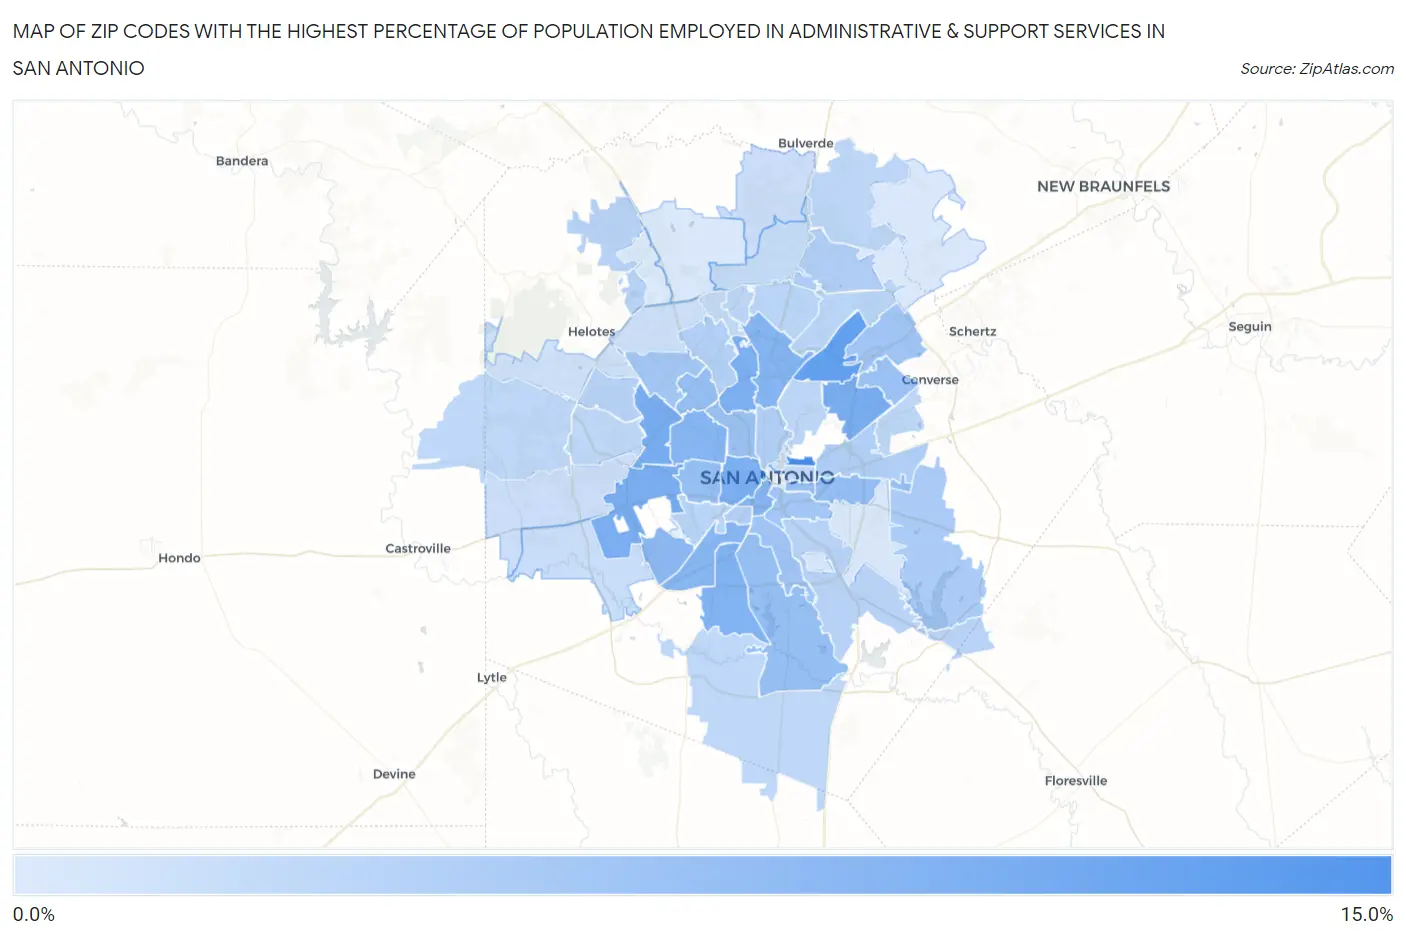
Map of Zip Codes with the Highest Percentage of Population Employed in Administrative & Support Services in San Antonio
1.6%
12.7%
Zip Codes with the Highest Percentage of Population Employed in Administrative & Support Services in San Antonio, TX
| Zip Code | % Employed | vs State | vs National | |
| 1. | 78208 | 12.7% | 4.4%(+8.31)#50 | 4.1%(+8.58)#757 |
| 2. | 78217 | 10.6% | 4.4%(+6.22)#75 | 4.1%(+6.49)#1,114 |
| 3. | 78238 | 9.1% | 4.4%(+4.65)#108 | 4.1%(+4.91)#1,654 |
| 4. | 78218 | 9.1% | 4.4%(+4.64)#109 | 4.1%(+4.90)#1,658 |
| 5. | 78227 | 8.8% | 4.4%(+4.42)#115 | 4.1%(+4.69)#1,772 |
| 6. | 78213 | 8.7% | 4.4%(+4.27)#123 | 4.1%(+4.53)#1,859 |
| 7. | 78207 | 8.7% | 4.4%(+4.24)#126 | 4.1%(+4.50)#1,878 |
| 8. | 78224 | 8.3% | 4.4%(+3.89)#139 | 4.1%(+4.15)#2,083 |
| 9. | 78204 | 8.1% | 4.4%(+3.65)#150 | 4.1%(+3.92)#2,220 |
| 10. | 78216 | 8.0% | 4.4%(+3.57)#155 | 4.1%(+3.83)#2,292 |
| 11. | 78228 | 8.0% | 4.4%(+3.56)#157 | 4.1%(+3.83)#2,297 |
| 12. | 78211 | 7.9% | 4.4%(+3.46)#164 | 4.1%(+3.72)#2,372 |
| 13. | 78242 | 7.4% | 4.4%(+2.98)#198 | 4.1%(+3.24)#2,798 |
| 14. | 78220 | 7.0% | 4.4%(+2.57)#230 | 4.1%(+2.83)#3,242 |
| 15. | 78229 | 6.8% | 4.4%(+2.41)#251 | 4.1%(+2.68)#3,445 |
| 16. | 78203 | 6.8% | 4.4%(+2.37)#254 | 4.1%(+2.64)#3,496 |
| 17. | 78221 | 6.8% | 4.4%(+2.35)#258 | 4.1%(+2.61)#3,526 |
| 18. | 78237 | 6.7% | 4.4%(+2.26)#269 | 4.1%(+2.53)#3,662 |
| 19. | 78239 | 6.3% | 4.4%(+1.89)#308 | 4.1%(+2.16)#4,227 |
| 20. | 78201 | 6.2% | 4.4%(+1.83)#319 | 4.1%(+2.10)#4,329 |
| 21. | 78233 | 6.0% | 4.4%(+1.54)#368 | 4.1%(+1.81)#4,860 |
| 22. | 78214 | 6.0% | 4.4%(+1.54)#369 | 4.1%(+1.80)#4,868 |
| 23. | 78240 | 5.8% | 4.4%(+1.39)#384 | 4.1%(+1.66)#5,137 |
| 24. | 78210 | 5.8% | 4.4%(+1.34)#395 | 4.1%(+1.61)#5,250 |
| 25. | 78263 | 5.3% | 4.4%(+0.861)#465 | 4.1%(+1.13)#6,387 |
| 26. | 78259 | 4.9% | 4.4%(+0.479)#545 | 4.1%(+0.745)#7,424 |
| 27. | 78212 | 4.8% | 4.4%(+0.376)#568 | 4.1%(+0.642)#7,747 |
| 28. | 78225 | 4.8% | 4.4%(+0.349)#575 | 4.1%(+0.615)#7,833 |
| 29. | 78219 | 4.7% | 4.4%(+0.266)#593 | 4.1%(+0.532)#8,089 |
| 30. | 78230 | 4.6% | 4.4%(+0.203)#604 | 4.1%(+0.469)#8,307 |
| 31. | 78223 | 4.3% | 4.4%(-0.163)#680 | 4.1%(+0.103)#9,624 |
| 32. | 78255 | 4.2% | 4.4%(-0.178)#683 | 4.1%(+0.088)#9,668 |
| 33. | 78250 | 4.2% | 4.4%(-0.235)#700 | 4.1%(+0.031)#9,910 |
| 34. | 78232 | 4.1% | 4.4%(-0.312)#717 | 4.1%(-0.046)#10,223 |
| 35. | 78226 | 4.1% | 4.4%(-0.329)#724 | 4.1%(-0.062)#10,292 |
| 36. | 78247 | 4.0% | 4.4%(-0.420)#743 | 4.1%(-0.154)#10,714 |
| 37. | 78244 | 4.0% | 4.4%(-0.441)#753 | 4.1%(-0.175)#10,803 |
| 38. | 78209 | 3.9% | 4.4%(-0.528)#773 | 4.1%(-0.261)#11,172 |
| 39. | 78248 | 3.9% | 4.4%(-0.546)#777 | 4.1%(-0.280)#11,246 |
| 40. | 78261 | 3.8% | 4.4%(-0.569)#780 | 4.1%(-0.303)#11,330 |
| 41. | 78253 | 3.7% | 4.4%(-0.668)#808 | 4.1%(-0.402)#11,771 |
| 42. | 78251 | 3.7% | 4.4%(-0.698)#814 | 4.1%(-0.431)#11,911 |
| 43. | 78264 | 3.7% | 4.4%(-0.733)#824 | 4.1%(-0.466)#12,063 |
| 44. | 78202 | 3.6% | 4.4%(-0.825)#852 | 4.1%(-0.559)#12,511 |
| 45. | 78231 | 3.4% | 4.4%(-0.990)#894 | 4.1%(-0.724)#13,323 |
| 46. | 78258 | 3.2% | 4.4%(-1.25)#984 | 4.1%(-0.988)#14,677 |
| 47. | 78252 | 3.1% | 4.4%(-1.28)#990 | 4.1%(-1.01)#14,793 |
| 48. | 78245 | 3.0% | 4.4%(-1.45)#1,049 | 4.1%(-1.19)#15,664 |
| 49. | 78260 | 2.9% | 4.4%(-1.50)#1,061 | 4.1%(-1.23)#15,917 |
| 50. | 78249 | 2.7% | 4.4%(-1.73)#1,110 | 4.1%(-1.46)#17,148 |
| 51. | 78254 | 2.5% | 4.4%(-1.92)#1,163 | 4.1%(-1.65)#18,152 |
| 52. | 78215 | 2.2% | 4.4%(-2.24)#1,237 | 4.1%(-1.97)#19,755 |
| 53. | 78235 | 2.1% | 4.4%(-2.34)#1,259 | 4.1%(-2.07)#20,234 |
| 54. | 78222 | 1.9% | 4.4%(-2.51)#1,307 | 4.1%(-2.24)#21,052 |
| 55. | 78266 | 1.7% | 4.4%(-2.71)#1,346 | 4.1%(-2.44)#21,936 |
| 56. | 78257 | 1.7% | 4.4%(-2.73)#1,350 | 4.1%(-2.47)#22,035 |
| 57. | 78256 | 1.6% | 4.4%(-2.82)#1,372 | 4.1%(-2.56)#22,386 |
1
Common Questions
What are the Top 10 Zip Codes with the Highest Percentage of Population Employed in Administrative & Support Services in San Antonio, TX?
Top 10 Zip Codes with the Highest Percentage of Population Employed in Administrative & Support Services in San Antonio, TX are:
What zip code has the Highest Percentage of Population Employed in Administrative & Support Services in San Antonio, TX?
78208 has the Highest Percentage of Population Employed in Administrative & Support Services in San Antonio, TX with 12.7%.
What is the Percentage of Population Employed in Administrative & Support Services in San Antonio, TX?
Percentage of Population Employed in Administrative & Support Services in San Antonio is 5.6%.
What is the Percentage of Population Employed in Administrative & Support Services in Texas?
Percentage of Population Employed in Administrative & Support Services in Texas is 4.4%.
What is the Percentage of Population Employed in Administrative & Support Services in the United States?
Percentage of Population Employed in Administrative & Support Services in the United States is 4.1%.