Ransom Canyon, TX Map & Demographics
Ransom Canyon Map
Ransom Canyon Overview
$65,425
PER CAPITA INCOME
$140,563
AVG FAMILY INCOME
$120,156
AVG HOUSEHOLD INCOME
35.7%
WAGE / INCOME GAP [ % ]
64.3¢/ $1
WAGE / INCOME GAP [ $ ]
0.44
INEQUALITY / GINI INDEX
1,073
TOTAL POPULATION
514
MALE POPULATION
559
FEMALE POPULATION
91.95
MALES / 100 FEMALES
108.75
FEMALES / 100 MALES
54.4
MEDIAN AGE
2.8
AVG FAMILY SIZE
2.4
AVG HOUSEHOLD SIZE
524
LABOR FORCE [ PEOPLE ]
55.3%
PERCENT IN LABOR FORCE
2.3%
UNEMPLOYMENT RATE
Ransom Canyon Zip Codes
Ransom Canyon Area Codes
Income in Ransom Canyon
Income Overview in Ransom Canyon
Per Capita Income in Ransom Canyon is $65,425, while median incomes of families and households are $140,563 and $120,156 respectively.
| Characteristic | Number | Measure |
| Per Capita Income | 1,073 | $65,425 |
| Median Family Income | 337 | $140,563 |
| Mean Family Income | 337 | $176,978 |
| Median Household Income | 451 | $120,156 |
| Mean Household Income | 451 | $155,678 |
| Income Deficit | 337 | $0 |
| Wage / Income Gap (%) | 1,073 | 35.69% |
| Wage / Income Gap ($) | 1,073 | 64.31¢ per $1 |
| Gini / Inequality Index | 1,073 | 0.44 |
Earnings by Sex in Ransom Canyon
Average Earnings in Ransom Canyon are $56,667, $63,819 for men and $41,042 for women, a difference of 35.7%.
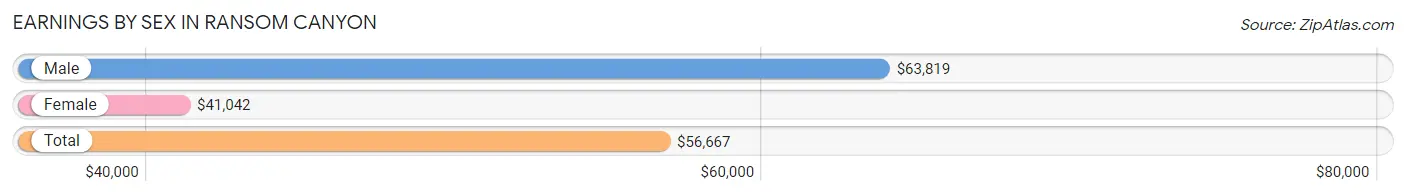
| Sex | Number | Average Earnings |
| Male | 313 (54.7%) | $63,819 |
| Female | 259 (45.3%) | $41,042 |
| Total | 572 (100.0%) | $56,667 |
Earnings by Sex by Income Bracket in Ransom Canyon
The most common earnings brackets in Ransom Canyon are $100,000+ for men (83 | 26.5%) and $100,000+ for women (36 | 13.9%).
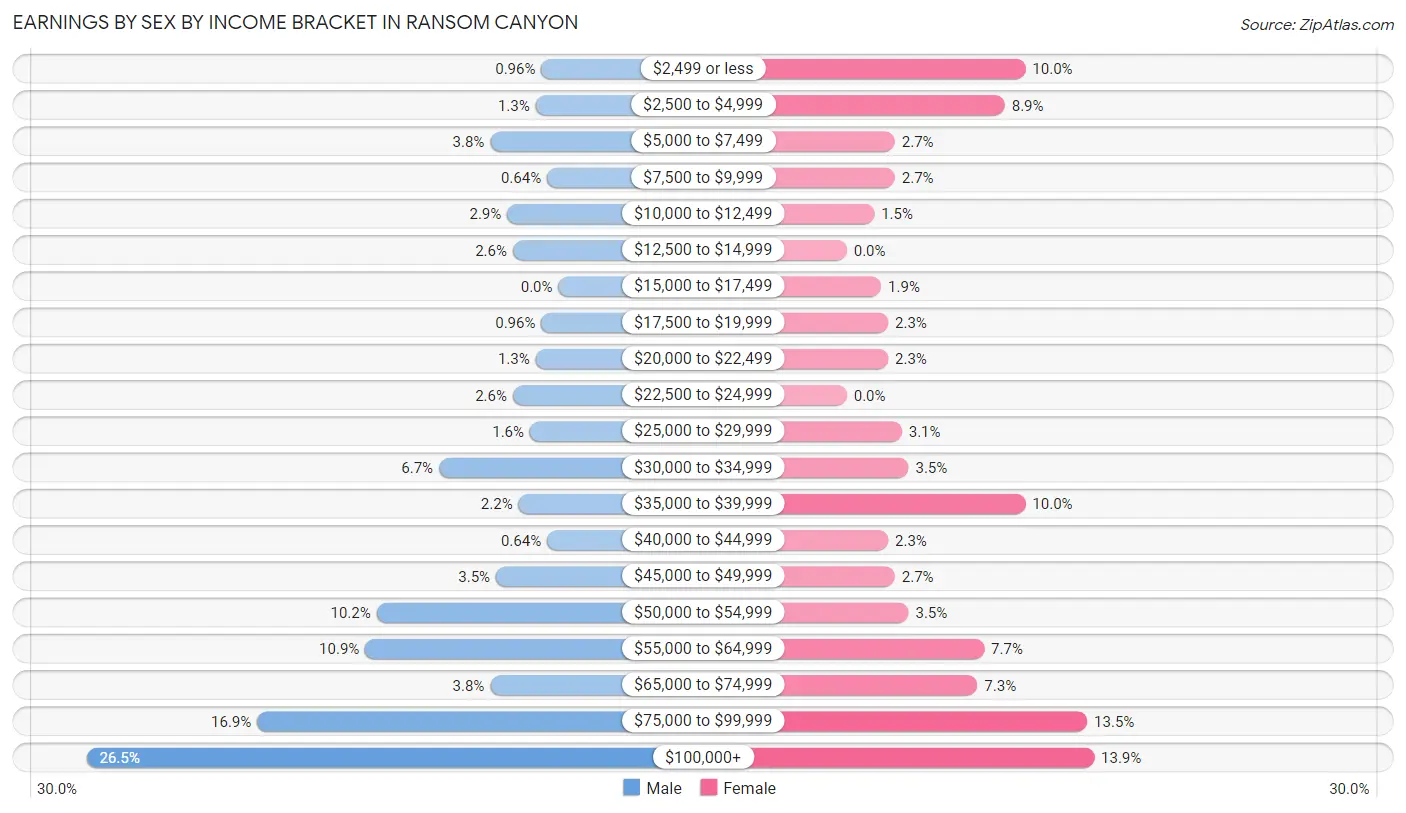
| Income | Male | Female |
| $2,499 or less | 3 (1.0%) | 26 (10.0%) |
| $2,500 to $4,999 | 4 (1.3%) | 23 (8.9%) |
| $5,000 to $7,499 | 12 (3.8%) | 7 (2.7%) |
| $7,500 to $9,999 | 2 (0.6%) | 7 (2.7%) |
| $10,000 to $12,499 | 9 (2.9%) | 4 (1.5%) |
| $12,500 to $14,999 | 8 (2.6%) | 0 (0.0%) |
| $15,000 to $17,499 | 0 (0.0%) | 5 (1.9%) |
| $17,500 to $19,999 | 3 (1.0%) | 6 (2.3%) |
| $20,000 to $22,499 | 4 (1.3%) | 6 (2.3%) |
| $22,500 to $24,999 | 8 (2.6%) | 0 (0.0%) |
| $25,000 to $29,999 | 5 (1.6%) | 8 (3.1%) |
| $30,000 to $34,999 | 21 (6.7%) | 9 (3.5%) |
| $35,000 to $39,999 | 7 (2.2%) | 26 (10.0%) |
| $40,000 to $44,999 | 2 (0.6%) | 6 (2.3%) |
| $45,000 to $49,999 | 11 (3.5%) | 7 (2.7%) |
| $50,000 to $54,999 | 32 (10.2%) | 9 (3.5%) |
| $55,000 to $64,999 | 34 (10.9%) | 20 (7.7%) |
| $65,000 to $74,999 | 12 (3.8%) | 19 (7.3%) |
| $75,000 to $99,999 | 53 (16.9%) | 35 (13.5%) |
| $100,000+ | 83 (26.5%) | 36 (13.9%) |
| Total | 313 (100.0%) | 259 (100.0%) |
Earnings by Sex by Educational Attainment in Ransom Canyon
Average earnings in Ransom Canyon are $75,000 for men and $47,143 for women, a difference of 37.1%. Men with an educational attainment of bachelor's degree enjoy the highest average annual earnings of $103,438, while those with college or associate's degree education earn the least with $53,859. Women with an educational attainment of bachelor's degree earn the most with the average annual earnings of $80,385, while those with graduate degree education have the smallest earnings of $39,375.
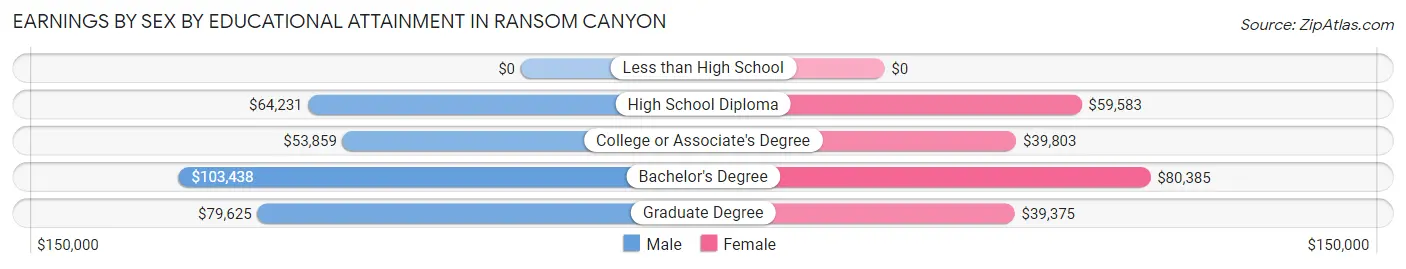
| Educational Attainment | Male Income | Female Income |
| Less than High School | - | - |
| High School Diploma | $64,231 | $59,583 |
| College or Associate's Degree | $53,859 | $39,803 |
| Bachelor's Degree | $103,438 | $80,385 |
| Graduate Degree | $79,625 | $39,375 |
| Total | $75,000 | $47,143 |
Family Income in Ransom Canyon
Family Income Brackets in Ransom Canyon
According to the Ransom Canyon family income data, there are 120 families falling into the $100,000 to $149,999 income range, which is the most common income bracket and makes up 35.6% of all families.
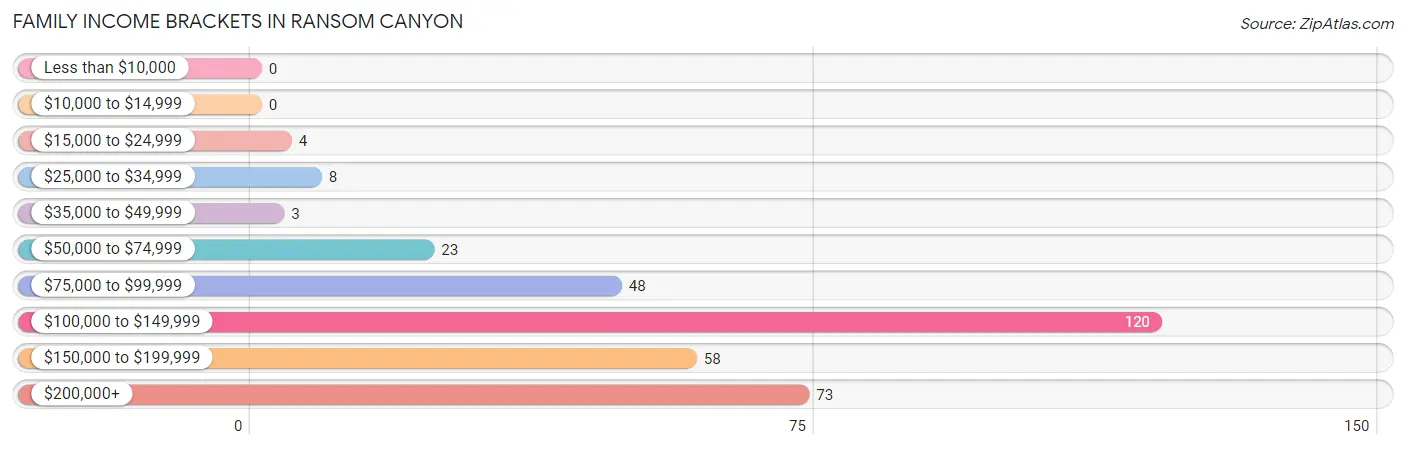
| Income Bracket | # Families | % Families |
| Less than $10,000 | 0 | 0.0% |
| $10,000 to $14,999 | 0 | 0.0% |
| $15,000 to $24,999 | 4 | 1.2% |
| $25,000 to $34,999 | 8 | 2.4% |
| $35,000 to $49,999 | 3 | 0.9% |
| $50,000 to $74,999 | 23 | 6.8% |
| $75,000 to $99,999 | 48 | 14.2% |
| $100,000 to $149,999 | 120 | 35.6% |
| $150,000 to $199,999 | 58 | 17.2% |
| $200,000+ | 73 | 21.7% |
Family Income by Famaliy Size in Ransom Canyon
5-person families (18 | 5.3%) account for the highest median family income in Ransom Canyon with $212,500 per family, while 2-person families (207 | 61.4%) have the highest median income of $71,758 per family member.
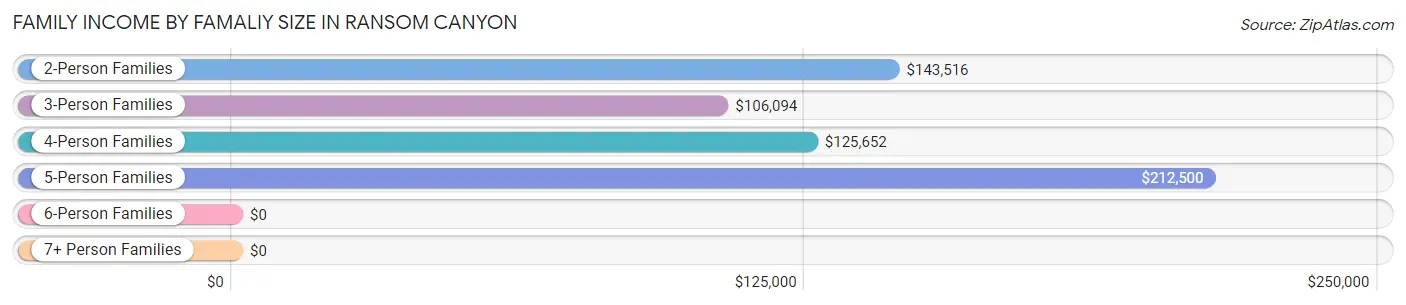
| Income Bracket | # Families | Median Income |
| 2-Person Families | 207 (61.4%) | $143,516 |
| 3-Person Families | 27 (8.0%) | $106,094 |
| 4-Person Families | 80 (23.7%) | $125,652 |
| 5-Person Families | 18 (5.3%) | $212,500 |
| 6-Person Families | 2 (0.6%) | $0 |
| 7+ Person Families | 3 (0.9%) | $0 |
| Total | 337 (100.0%) | $140,563 |
Family Income by Number of Earners in Ransom Canyon
The median family income in Ransom Canyon is $140,563, with families comprising 2 earners (128) having the highest median family income of $143,421, while families with no earners (66) have the lowest median family income of $98,333, accounting for 38.0% and 19.6% of families, respectively.
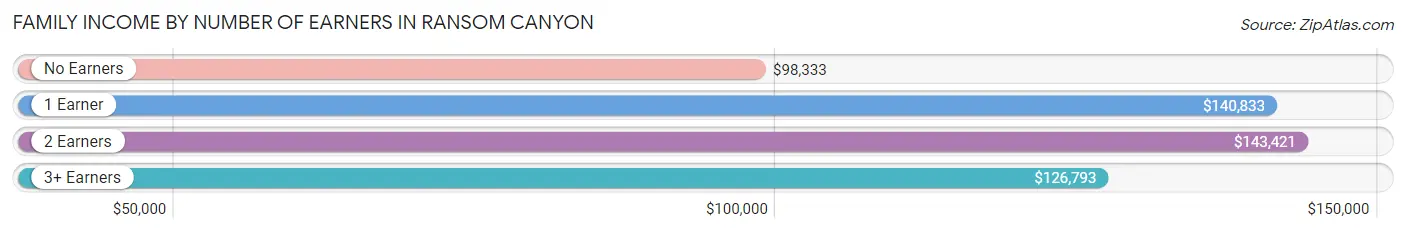
| Number of Earners | # Families | Median Income |
| No Earners | 66 (19.6%) | $98,333 |
| 1 Earner | 88 (26.1%) | $140,833 |
| 2 Earners | 128 (38.0%) | $143,421 |
| 3+ Earners | 55 (16.3%) | $126,793 |
| Total | 337 (100.0%) | $140,563 |
Household Income in Ransom Canyon
Household Income Brackets in Ransom Canyon
With 126 households falling in the category, the $100,000 to $149,999 income range is the most frequent in Ransom Canyon, accounting for 27.9% of all households.
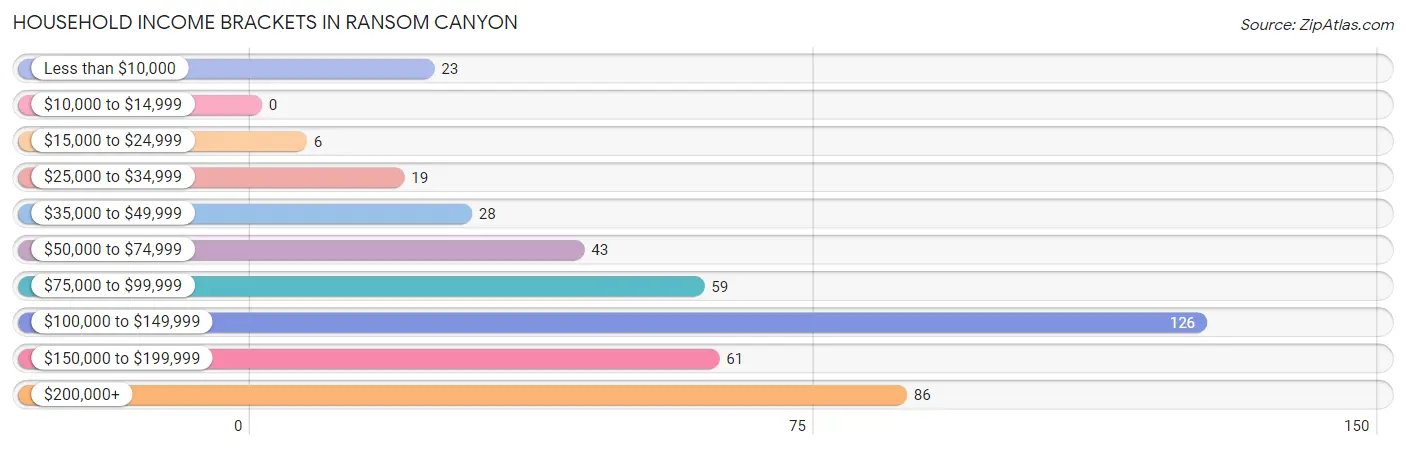
| Income Bracket | # Households | % Households |
| Less than $10,000 | 23 | 5.1% |
| $10,000 to $14,999 | 0 | 0.0% |
| $15,000 to $24,999 | 6 | 1.3% |
| $25,000 to $34,999 | 19 | 4.2% |
| $35,000 to $49,999 | 28 | 6.2% |
| $50,000 to $74,999 | 43 | 9.5% |
| $75,000 to $99,999 | 59 | 13.1% |
| $100,000 to $149,999 | 126 | 27.9% |
| $150,000 to $199,999 | 61 | 13.5% |
| $200,000+ | 86 | 19.1% |
Household Income by Householder Age in Ransom Canyon
The median household income in Ransom Canyon is $120,156, with the highest median household income of $144,803 found in the 45 to 64 years age bracket for the primary householder. A total of 181 households (40.1%) fall into this category. Meanwhile, the 15 to 24 years age bracket for the primary householder has the lowest median household income of $0, with 10 households (2.2%) in this group.
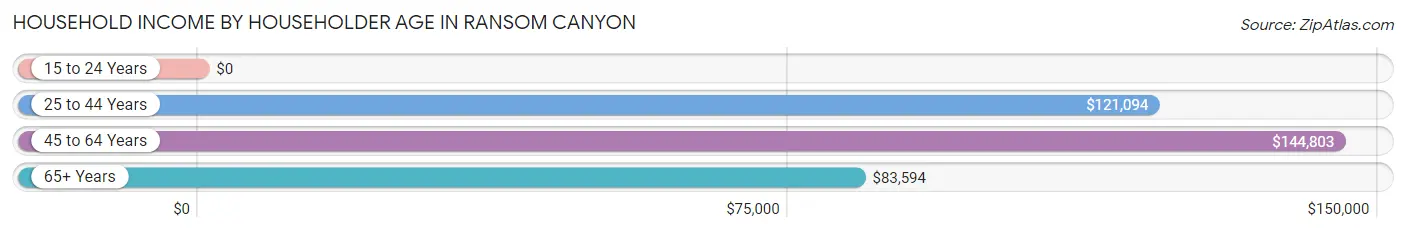
| Income Bracket | # Households | Median Income |
| 15 to 24 Years | 10 (2.2%) | $0 |
| 25 to 44 Years | 45 (10.0%) | $121,094 |
| 45 to 64 Years | 181 (40.1%) | $144,803 |
| 65+ Years | 215 (47.7%) | $83,594 |
| Total | 451 (100.0%) | $120,156 |
Poverty in Ransom Canyon
Income Below Poverty by Sex and Age in Ransom Canyon
With 1.6% poverty level for males and 4.3% for females among the residents of Ransom Canyon, 75 year old and over males and 75 year old and over females are the most vulnerable to poverty, with 3 males (5.4%) and 15 females (15.8%) in their respective age groups living below the poverty level.
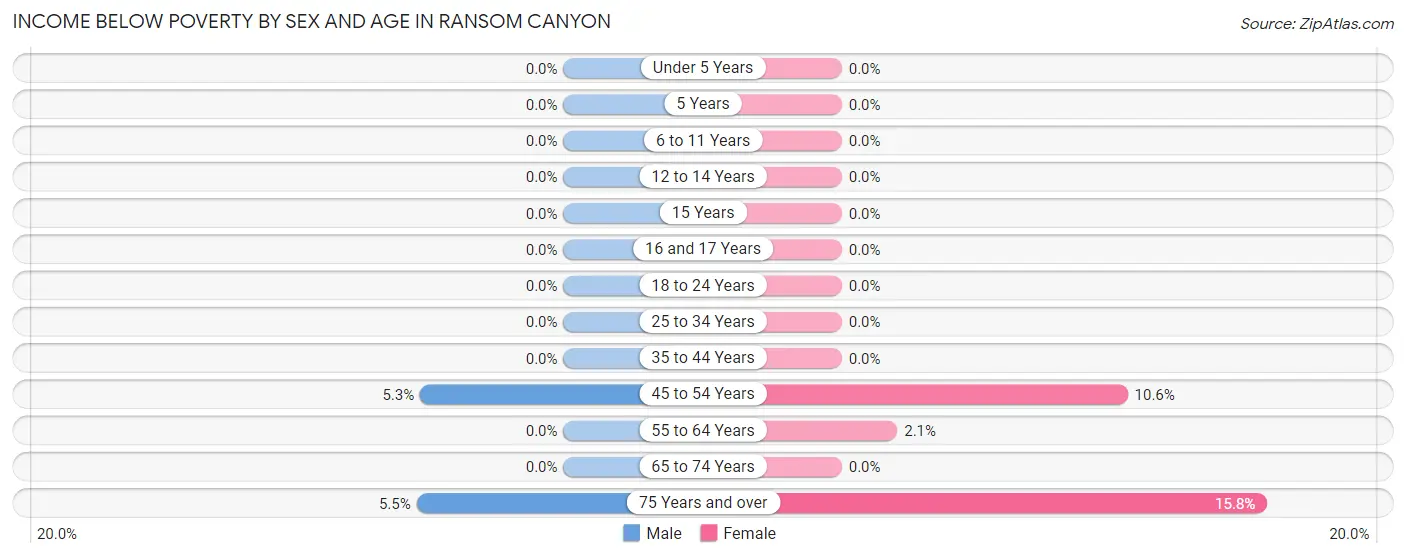
| Age Bracket | Male | Female |
| Under 5 Years | 0 (0.0%) | 0 (0.0%) |
| 5 Years | 0 (0.0%) | 0 (0.0%) |
| 6 to 11 Years | 0 (0.0%) | 0 (0.0%) |
| 12 to 14 Years | 0 (0.0%) | 0 (0.0%) |
| 15 Years | 0 (0.0%) | 0 (0.0%) |
| 16 and 17 Years | 0 (0.0%) | 0 (0.0%) |
| 18 to 24 Years | 0 (0.0%) | 0 (0.0%) |
| 25 to 34 Years | 0 (0.0%) | 0 (0.0%) |
| 35 to 44 Years | 0 (0.0%) | 0 (0.0%) |
| 45 to 54 Years | 5 (5.3%) | 7 (10.6%) |
| 55 to 64 Years | 0 (0.0%) | 2 (2.1%) |
| 65 to 74 Years | 0 (0.0%) | 0 (0.0%) |
| 75 Years and over | 3 (5.4%) | 15 (15.8%) |
| Total | 8 (1.6%) | 24 (4.3%) |
Income Above Poverty by Sex and Age in Ransom Canyon
According to the poverty statistics in Ransom Canyon, males aged under 5 years and females aged under 5 years are the age groups that are most secure financially, with 100.0% of males and 100.0% of females in these age groups living above the poverty line.
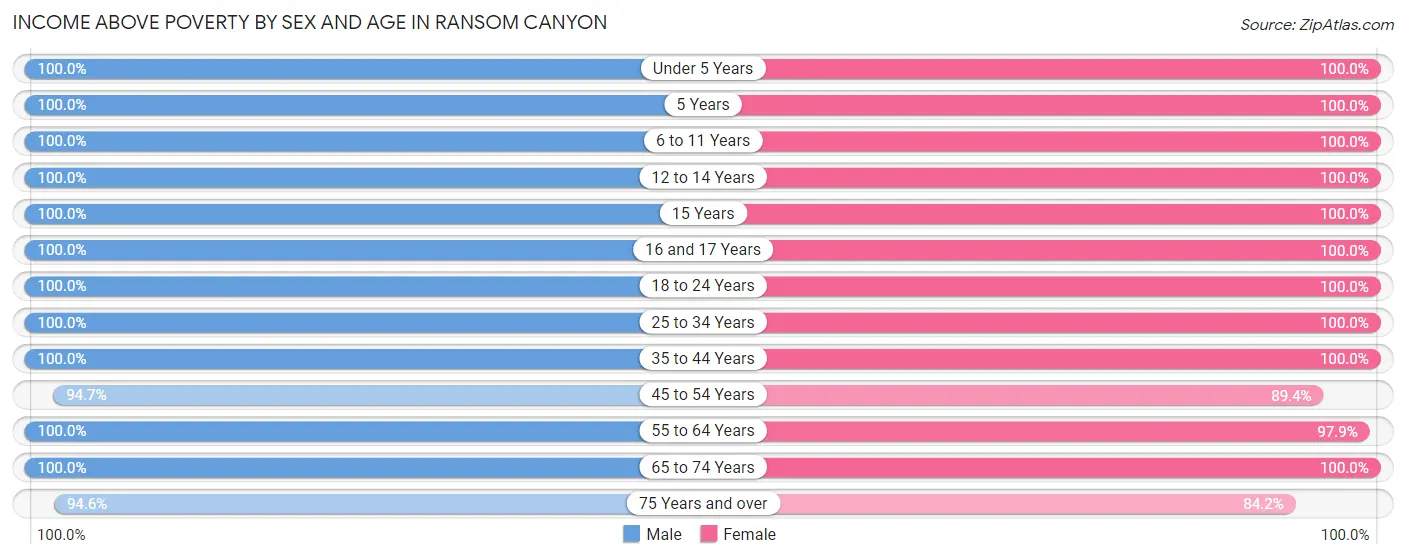
| Age Bracket | Male | Female |
| Under 5 Years | 15 (100.0%) | 15 (100.0%) |
| 5 Years | 6 (100.0%) | 7 (100.0%) |
| 6 to 11 Years | 19 (100.0%) | 33 (100.0%) |
| 12 to 14 Years | 18 (100.0%) | 6 (100.0%) |
| 15 Years | 3 (100.0%) | 4 (100.0%) |
| 16 and 17 Years | 31 (100.0%) | 19 (100.0%) |
| 18 to 24 Years | 39 (100.0%) | 35 (100.0%) |
| 25 to 34 Years | 28 (100.0%) | 7 (100.0%) |
| 35 to 44 Years | 33 (100.0%) | 68 (100.0%) |
| 45 to 54 Years | 89 (94.7%) | 59 (89.4%) |
| 55 to 64 Years | 93 (100.0%) | 95 (97.9%) |
| 65 to 74 Years | 80 (100.0%) | 107 (100.0%) |
| 75 Years and over | 52 (94.6%) | 80 (84.2%) |
| Total | 506 (98.4%) | 535 (95.7%) |
Income Below Poverty Among Married-Couple Families in Ransom Canyon
The poverty statistics for married-couple families in Ransom Canyon show that 1.3% or 4 of the total 318 families live below the poverty line. Families with no children have the highest poverty rate of 1.7%, comprising of 4 families. On the other hand, families with 1 or 2 children have the lowest poverty rate of 0.0%, which includes 0 families.
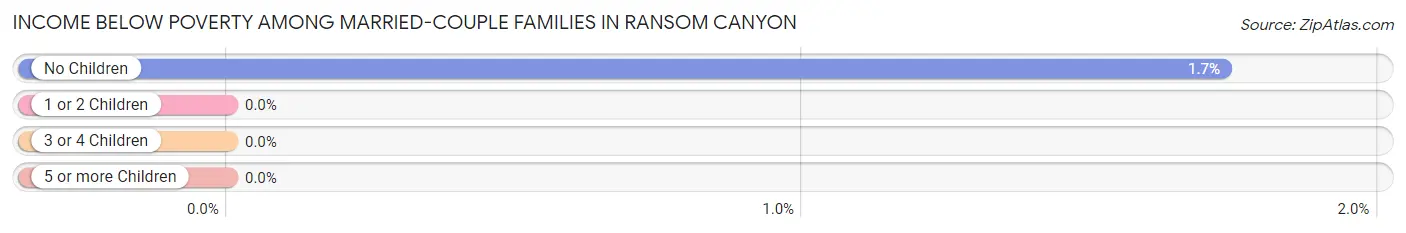
| Children | Above Poverty | Below Poverty |
| No Children | 227 (98.3%) | 4 (1.7%) |
| 1 or 2 Children | 73 (100.0%) | 0 (0.0%) |
| 3 or 4 Children | 11 (100.0%) | 0 (0.0%) |
| 5 or more Children | 3 (100.0%) | 0 (0.0%) |
| Total | 314 (98.7%) | 4 (1.3%) |
Income Below Poverty Among Single-Parent Households in Ransom Canyon
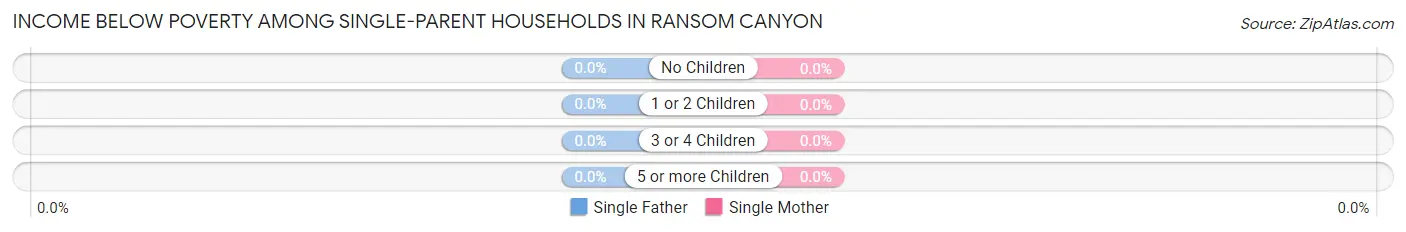
| Children | Single Father | Single Mother |
| No Children | 0 (0.0%) | 0 (0.0%) |
| 1 or 2 Children | 0 (0.0%) | 0 (0.0%) |
| 3 or 4 Children | 0 (0.0%) | 0 (0.0%) |
| 5 or more Children | 0 (0.0%) | 0 (0.0%) |
| Total | 0 (0.0%) | 0 (0.0%) |
Income Below Poverty Among Married-Couple vs Single-Parent Households in Ransom Canyon
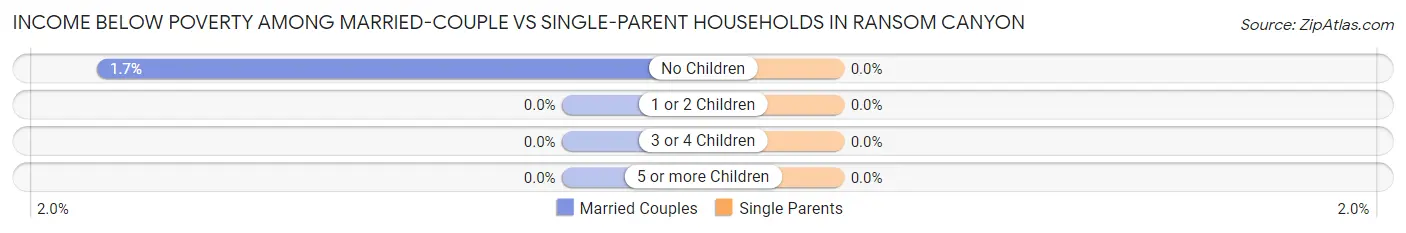
| Children | Married-Couple Families | Single-Parent Households |
| No Children | 4 (1.7%) | 0 (0.0%) |
| 1 or 2 Children | 0 (0.0%) | 0 (0.0%) |
| 3 or 4 Children | 0 (0.0%) | 0 (0.0%) |
| 5 or more Children | 0 (0.0%) | 0 (0.0%) |
| Total | 4 (1.3%) | 0 (0.0%) |
Race in Ransom Canyon
The most populous races in Ransom Canyon are White / Caucasian (886 | 82.6%), Hispanic or Latino (213 | 19.9%), and Two or more Races (143 | 13.3%).
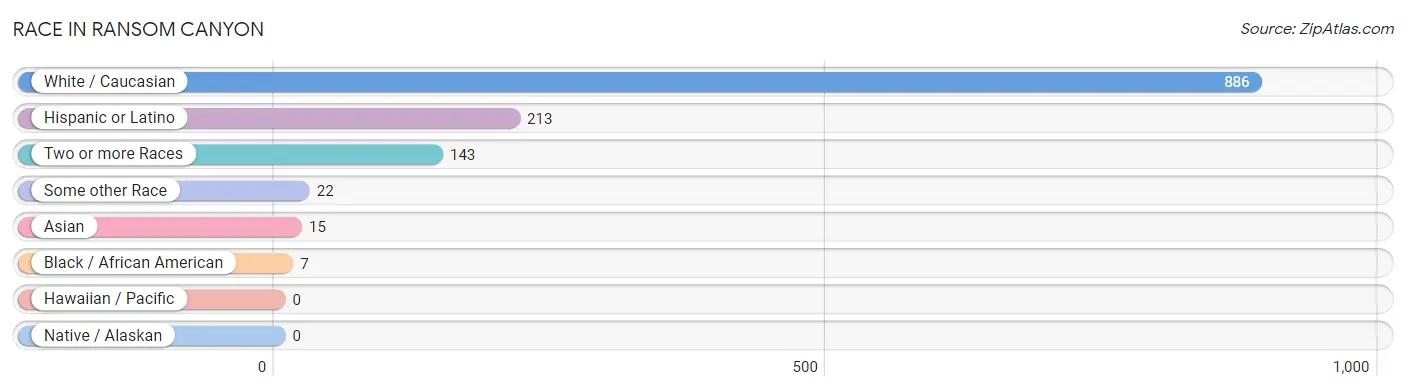
| Race | # Population | % Population |
| Asian | 15 | 1.4% |
| Black / African American | 7 | 0.6% |
| Hawaiian / Pacific | 0 | 0.0% |
| Hispanic or Latino | 213 | 19.9% |
| Native / Alaskan | 0 | 0.0% |
| White / Caucasian | 886 | 82.6% |
| Two or more Races | 143 | 13.3% |
| Some other Race | 22 | 2.1% |
| Total | 1,073 | 100.0% |
Ancestry in Ransom Canyon
The most populous ancestries reported in Ransom Canyon are German (179 | 16.7%), Mexican (179 | 16.7%), English (164 | 15.3%), American (111 | 10.3%), and Irish (77 | 7.2%), together accounting for 66.2% of all Ransom Canyon residents.
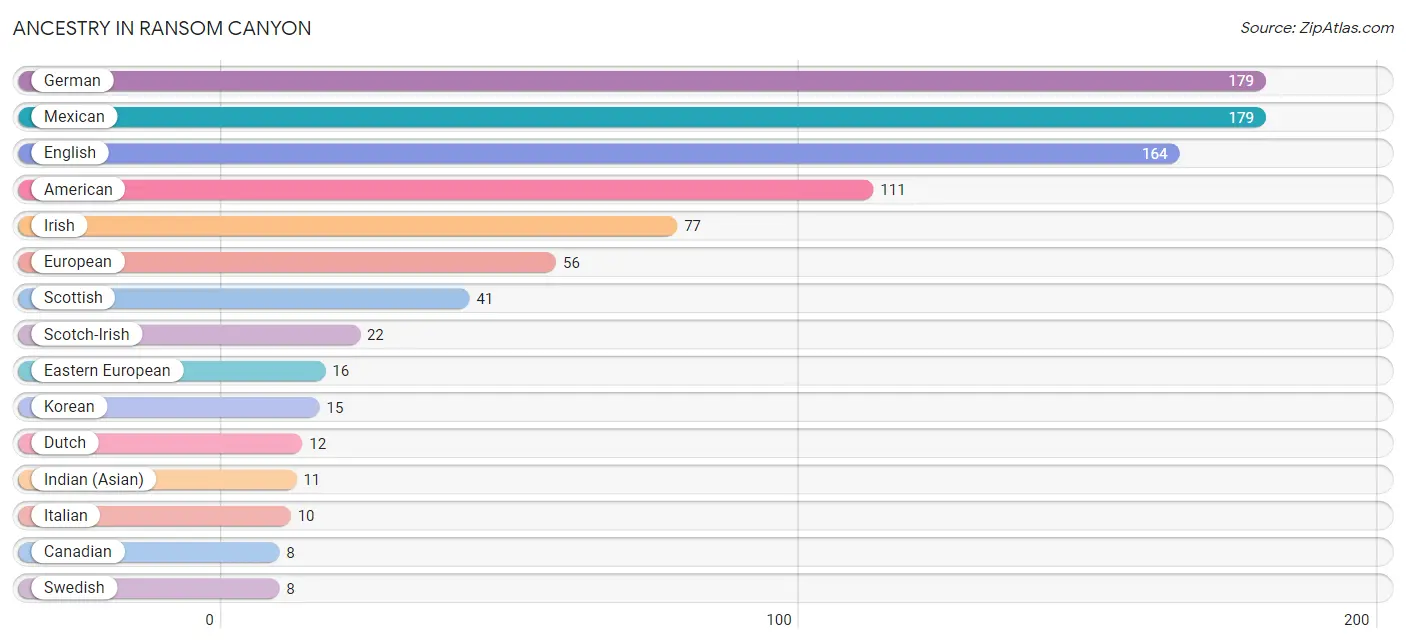
| Ancestry | # Population | % Population |
| American | 111 | 10.3% |
| Arab | 7 | 0.6% |
| British | 6 | 0.6% |
| Cajun | 3 | 0.3% |
| Canadian | 8 | 0.7% |
| Central American Indian | 5 | 0.5% |
| Cherokee | 7 | 0.6% |
| Czech | 3 | 0.3% |
| Danish | 3 | 0.3% |
| Dutch | 12 | 1.1% |
| Eastern European | 16 | 1.5% |
| English | 164 | 15.3% |
| European | 56 | 5.2% |
| Finnish | 3 | 0.3% |
| French | 3 | 0.3% |
| French Canadian | 3 | 0.3% |
| German | 179 | 16.7% |
| Indian (Asian) | 11 | 1.0% |
| Irish | 77 | 7.2% |
| Italian | 10 | 0.9% |
| Korean | 15 | 1.4% |
| Lithuanian | 3 | 0.3% |
| Mexican | 179 | 16.7% |
| Mexican American Indian | 5 | 0.5% |
| Norwegian | 3 | 0.3% |
| Polish | 4 | 0.4% |
| Puerto Rican | 3 | 0.3% |
| Russian | 3 | 0.3% |
| Scandinavian | 3 | 0.3% |
| Scotch-Irish | 22 | 2.1% |
| Scottish | 41 | 3.8% |
| Spaniard | 5 | 0.5% |
| Swedish | 8 | 0.7% |
| Swiss | 5 | 0.5% |
| Syrian | 7 | 0.6% |
| Ukrainian | 7 | 0.6% |
| Welsh | 4 | 0.4% | View All 37 Rows |
Immigrants in Ransom Canyon
The most numerous immigrant groups reported in Ransom Canyon came from Canada (16 | 1.5%), Asia (14 | 1.3%), Europe (13 | 1.2%), Germany (13 | 1.2%), and Western Europe (13 | 1.2%), together accounting for 6.4% of all Ransom Canyon residents.
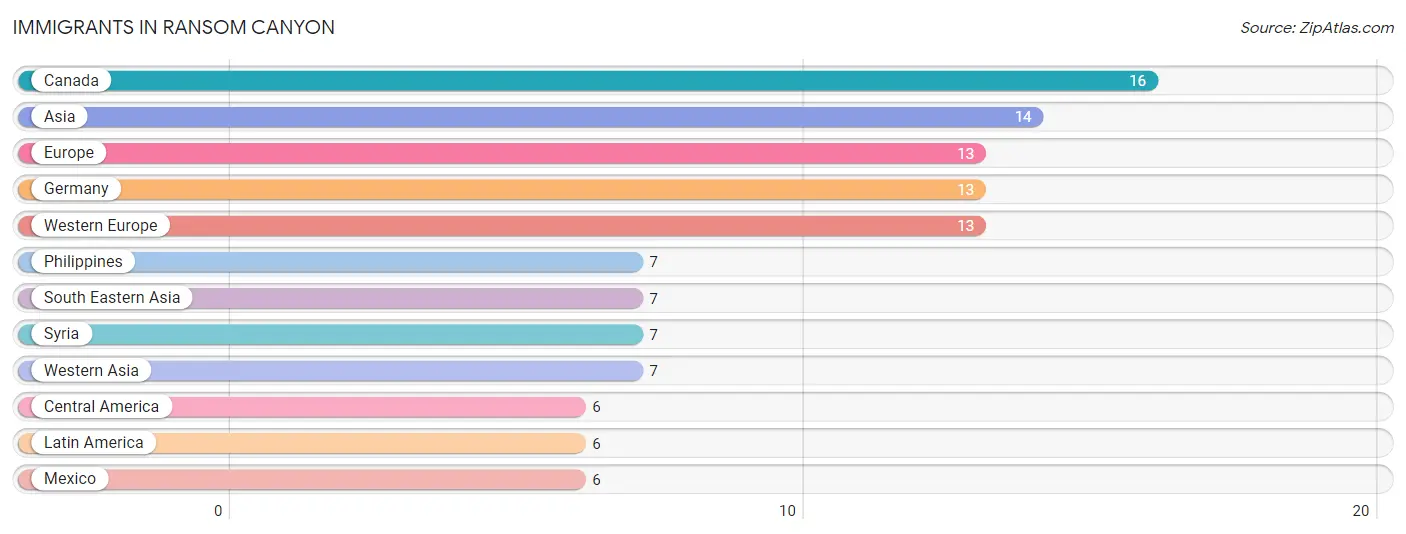
| Immigration Origin | # Population | % Population |
| Asia | 14 | 1.3% |
| Canada | 16 | 1.5% |
| Central America | 6 | 0.6% |
| Europe | 13 | 1.2% |
| Germany | 13 | 1.2% |
| Latin America | 6 | 0.6% |
| Mexico | 6 | 0.6% |
| Philippines | 7 | 0.6% |
| South Eastern Asia | 7 | 0.6% |
| Syria | 7 | 0.6% |
| Western Asia | 7 | 0.6% |
| Western Europe | 13 | 1.2% | View All 12 Rows |
Sex and Age in Ransom Canyon
Sex and Age in Ransom Canyon
The most populous age groups in Ransom Canyon are 45 to 49 Years (64 | 12.4%) for men and 65 to 69 Years (70 | 12.5%) for women.
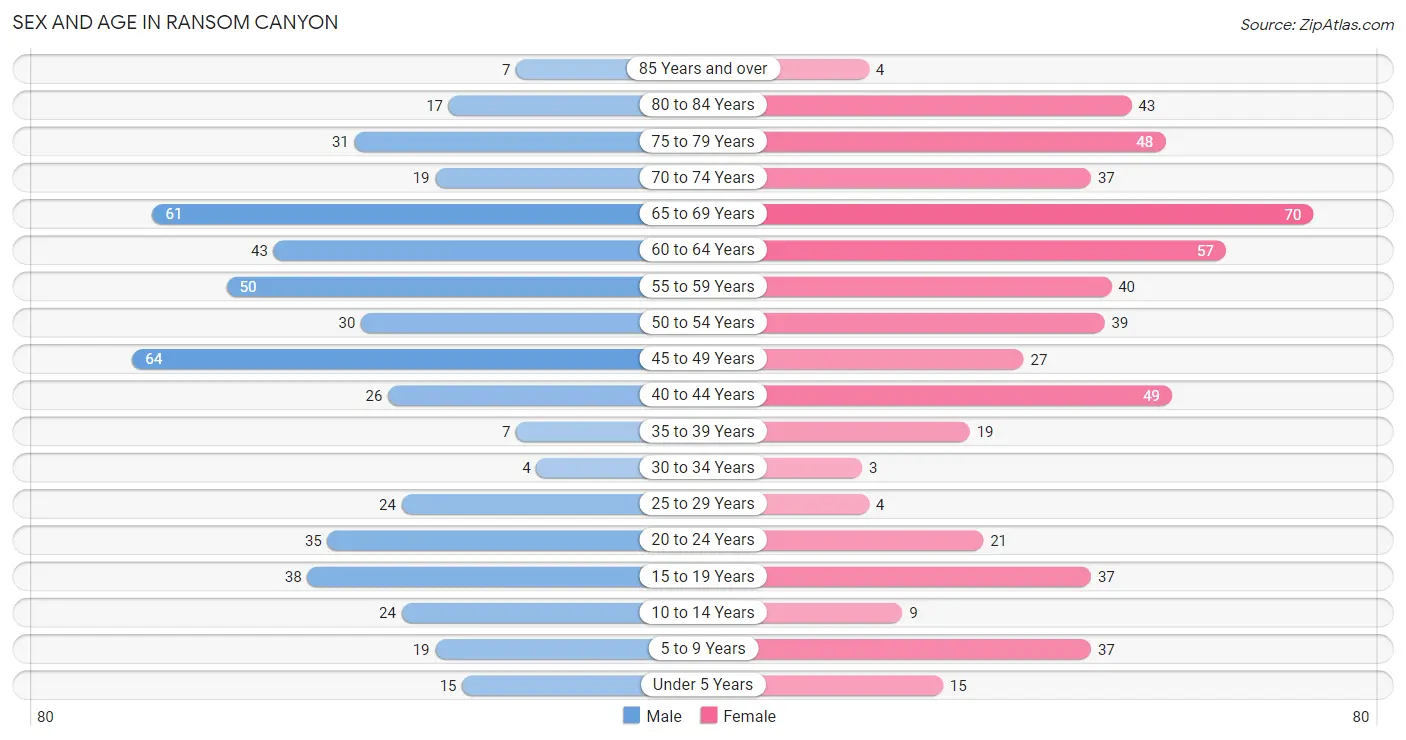
| Age Bracket | Male | Female |
| Under 5 Years | 15 (2.9%) | 15 (2.7%) |
| 5 to 9 Years | 19 (3.7%) | 37 (6.6%) |
| 10 to 14 Years | 24 (4.7%) | 9 (1.6%) |
| 15 to 19 Years | 38 (7.4%) | 37 (6.6%) |
| 20 to 24 Years | 35 (6.8%) | 21 (3.8%) |
| 25 to 29 Years | 24 (4.7%) | 4 (0.7%) |
| 30 to 34 Years | 4 (0.8%) | 3 (0.5%) |
| 35 to 39 Years | 7 (1.4%) | 19 (3.4%) |
| 40 to 44 Years | 26 (5.1%) | 49 (8.8%) |
| 45 to 49 Years | 64 (12.4%) | 27 (4.8%) |
| 50 to 54 Years | 30 (5.8%) | 39 (7.0%) |
| 55 to 59 Years | 50 (9.7%) | 40 (7.2%) |
| 60 to 64 Years | 43 (8.4%) | 57 (10.2%) |
| 65 to 69 Years | 61 (11.9%) | 70 (12.5%) |
| 70 to 74 Years | 19 (3.7%) | 37 (6.6%) |
| 75 to 79 Years | 31 (6.0%) | 48 (8.6%) |
| 80 to 84 Years | 17 (3.3%) | 43 (7.7%) |
| 85 Years and over | 7 (1.4%) | 4 (0.7%) |
| Total | 514 (100.0%) | 559 (100.0%) |
Families and Households in Ransom Canyon
Median Family Size in Ransom Canyon
The median family size in Ransom Canyon is 2.82 persons per family, with single female/mother families (15 | 4.4%) accounting for the largest median family size of 3.67 persons per family. On the other hand, single male/father families (4 | 1.2%) represent the smallest median family size with 2.75 persons per family.
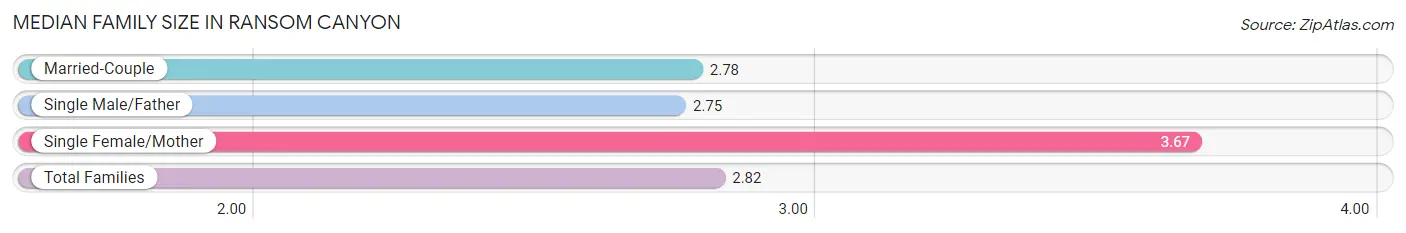
| Family Type | # Families | Family Size |
| Married-Couple | 318 (94.4%) | 2.78 |
| Single Male/Father | 4 (1.2%) | 2.75 |
| Single Female/Mother | 15 (4.4%) | 3.67 |
| Total Families | 337 (100.0%) | 2.82 |
Median Household Size in Ransom Canyon
The median household size in Ransom Canyon is 2.38 persons per household, with single female/mother households (15 | 3.3%) accounting for the largest median household size of 3.67 persons per household. non-family households (114 | 25.3%) represent the smallest median household size with 1.09 persons per household.
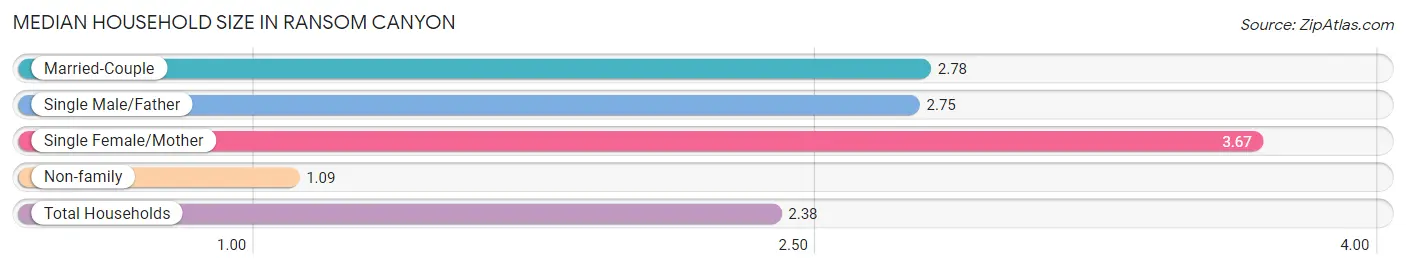
| Household Type | # Households | Household Size |
| Married-Couple | 318 (70.5%) | 2.78 |
| Single Male/Father | 4 (0.9%) | 2.75 |
| Single Female/Mother | 15 (3.3%) | 3.67 |
| Non-family | 114 (25.3%) | 1.09 |
| Total Households | 451 (100.0%) | 2.38 |
Household Size by Marriage Status in Ransom Canyon
Out of a total of 451 households in Ransom Canyon, 337 (74.7%) are family households, while 114 (25.3%) are nonfamily households. The most numerous type of family households are 2-person households, comprising 207, and the most common type of nonfamily households are 1-person households, comprising 103.
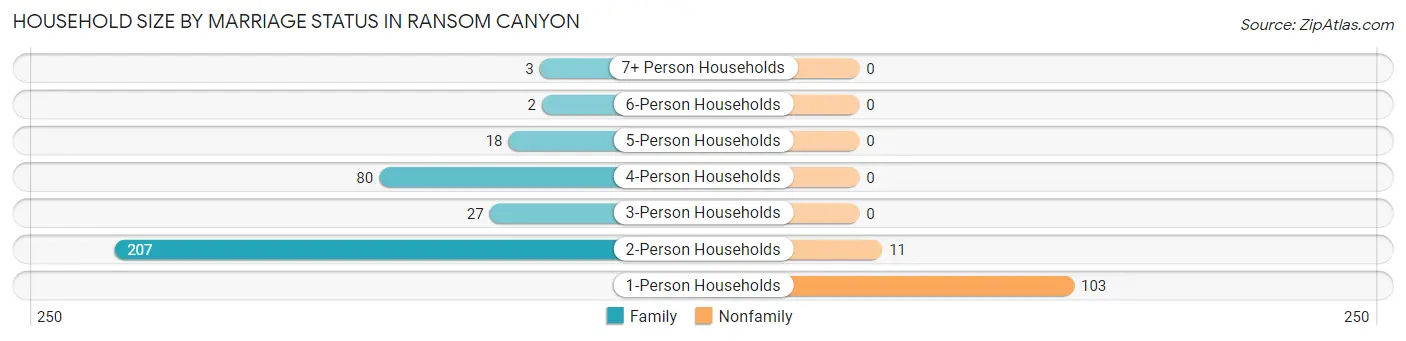
| Household Size | Family Households | Nonfamily Households |
| 1-Person Households | - | 103 (22.8%) |
| 2-Person Households | 207 (45.9%) | 11 (2.4%) |
| 3-Person Households | 27 (6.0%) | 0 (0.0%) |
| 4-Person Households | 80 (17.7%) | 0 (0.0%) |
| 5-Person Households | 18 (4.0%) | 0 (0.0%) |
| 6-Person Households | 2 (0.4%) | 0 (0.0%) |
| 7+ Person Households | 3 (0.7%) | 0 (0.0%) |
| Total | 337 (74.7%) | 114 (25.3%) |
Female Fertility in Ransom Canyon
Fertility by Age in Ransom Canyon
Average fertility rate in Ransom Canyon is 13.0 births per 1,000 women. Women in the age bracket of 35 to 50 years have the highest fertility rate with 21.0 births per 1,000 women. Women in the age bracket of 35 to 50 years acount for 100.0% of all women with births.
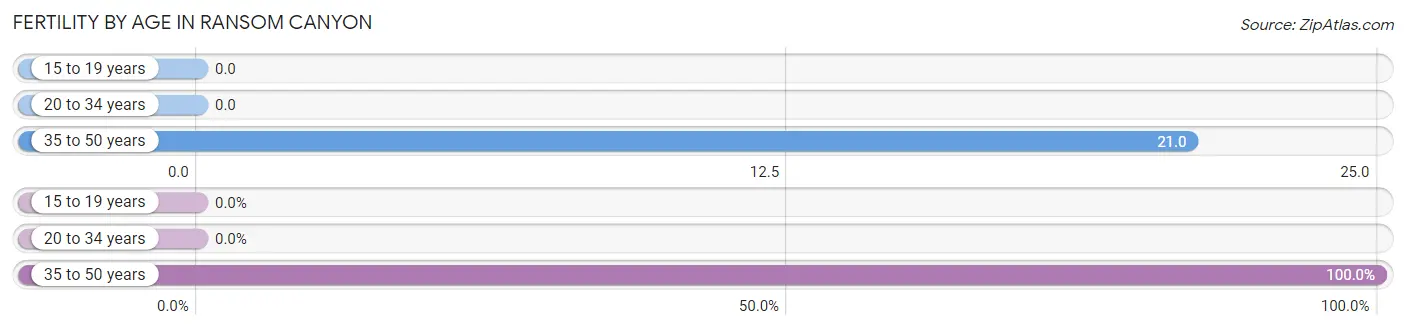
| Age Bracket | Women with Births | Births / 1,000 Women |
| 15 to 19 years | 0 (0.0%) | 0.0 |
| 20 to 34 years | 0 (0.0%) | 0.0 |
| 35 to 50 years | 2 (100.0%) | 21.0 |
| Total | 2 (100.0%) | 13.0 |
Fertility by Age by Marriage Status in Ransom Canyon
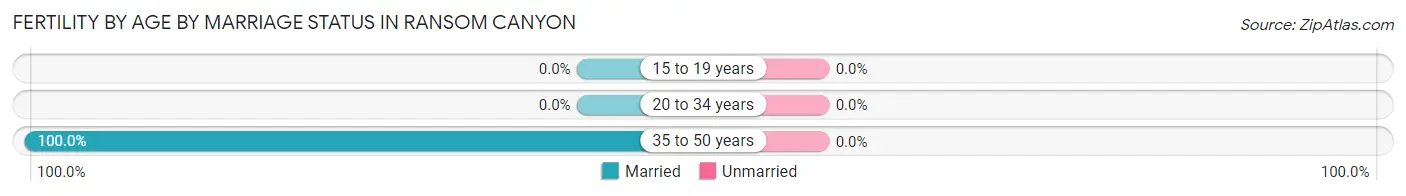
| Age Bracket | Married | Unmarried |
| 15 to 19 years | 0 (0.0%) | 0 (0.0%) |
| 20 to 34 years | 0 (0.0%) | 0 (0.0%) |
| 35 to 50 years | 2 (100.0%) | 0 (0.0%) |
| Total | 2 (100.0%) | 0 (0.0%) |
Fertility by Education in Ransom Canyon
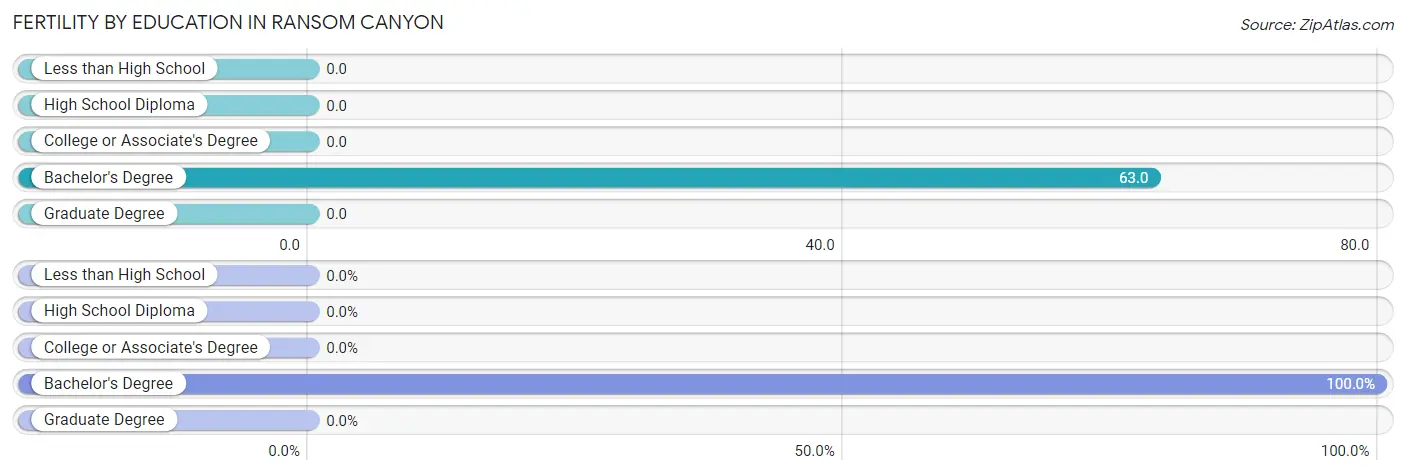
| Educational Attainment | Women with Births | Births / 1,000 Women |
| Less than High School | 0 (0.0%) | 0.0 |
| High School Diploma | 0 (0.0%) | 0.0 |
| College or Associate's Degree | 0 (0.0%) | 0.0 |
| Bachelor's Degree | 2 (100.0%) | 63.0 |
| Graduate Degree | 0 (0.0%) | 0.0 |
| Total | 2 (100.0%) | 13.0 |
Fertility by Education by Marriage Status in Ransom Canyon
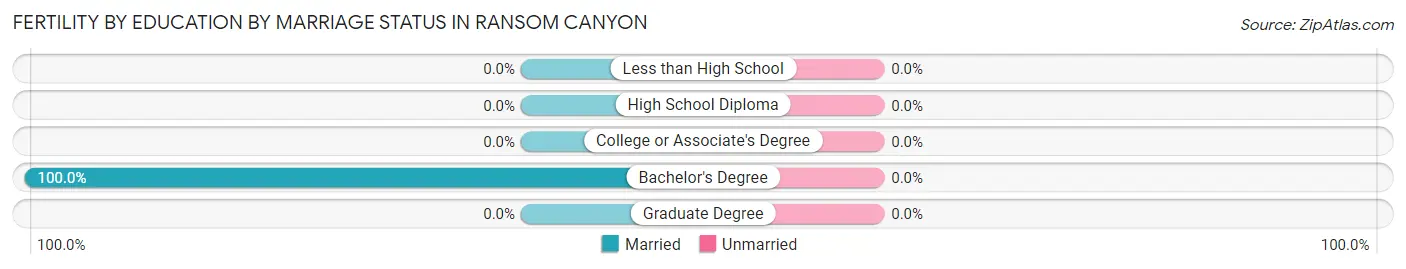
| Educational Attainment | Married | Unmarried |
| Less than High School | 0 (0.0%) | 0 (0.0%) |
| High School Diploma | 0 (0.0%) | 0 (0.0%) |
| College or Associate's Degree | 0 (0.0%) | 0 (0.0%) |
| Bachelor's Degree | 2 (100.0%) | 0 (0.0%) |
| Graduate Degree | 0 (0.0%) | 0 (0.0%) |
| Total | 2 (100.0%) | 0 (0.0%) |
Employment Characteristics in Ransom Canyon
Employment by Class of Employer in Ransom Canyon
Among the 505 employed individuals in Ransom Canyon, private company employees (275 | 54.5%), local government employees (60 | 11.9%), and state government employees (57 | 11.3%) make up the most common classes of employment.
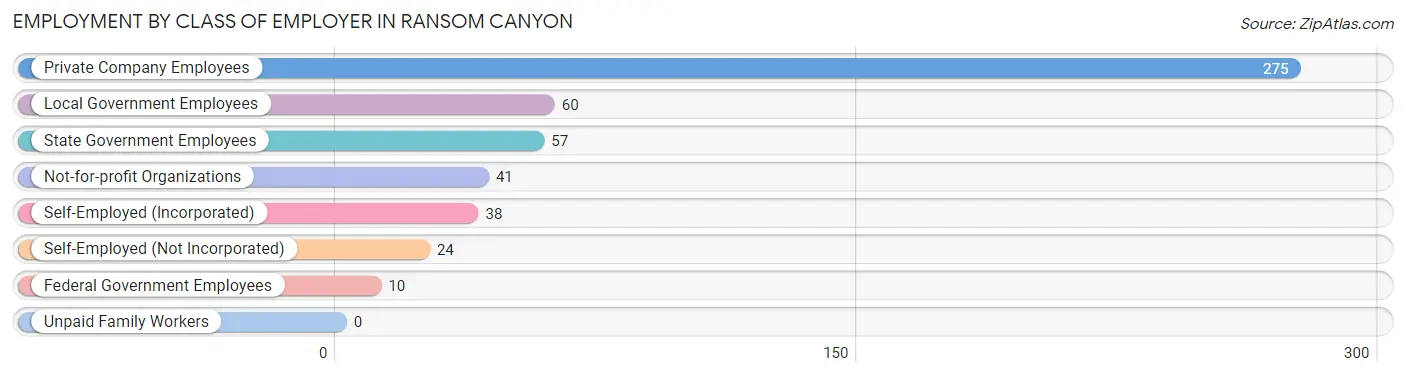
| Employer Class | # Employees | % Employees |
| Private Company Employees | 275 | 54.5% |
| Self-Employed (Incorporated) | 38 | 7.5% |
| Self-Employed (Not Incorporated) | 24 | 4.8% |
| Not-for-profit Organizations | 41 | 8.1% |
| Local Government Employees | 60 | 11.9% |
| State Government Employees | 57 | 11.3% |
| Federal Government Employees | 10 | 2.0% |
| Unpaid Family Workers | 0 | 0.0% |
| Total | 505 | 100.0% |
Employment Status by Age in Ransom Canyon
According to the labor force statistics for Ransom Canyon, out of the total population over 16 years of age (947), 55.3% or 524 individuals are in the labor force, with 2.3% or 12 of them unemployed. The age group with the highest labor force participation rate is 25 to 29 years, with 100.0% or 28 individuals in the labor force. Within the labor force, the 60 to 64 years age range has the highest percentage of unemployed individuals, with 8.3% or 4 of them being unemployed.
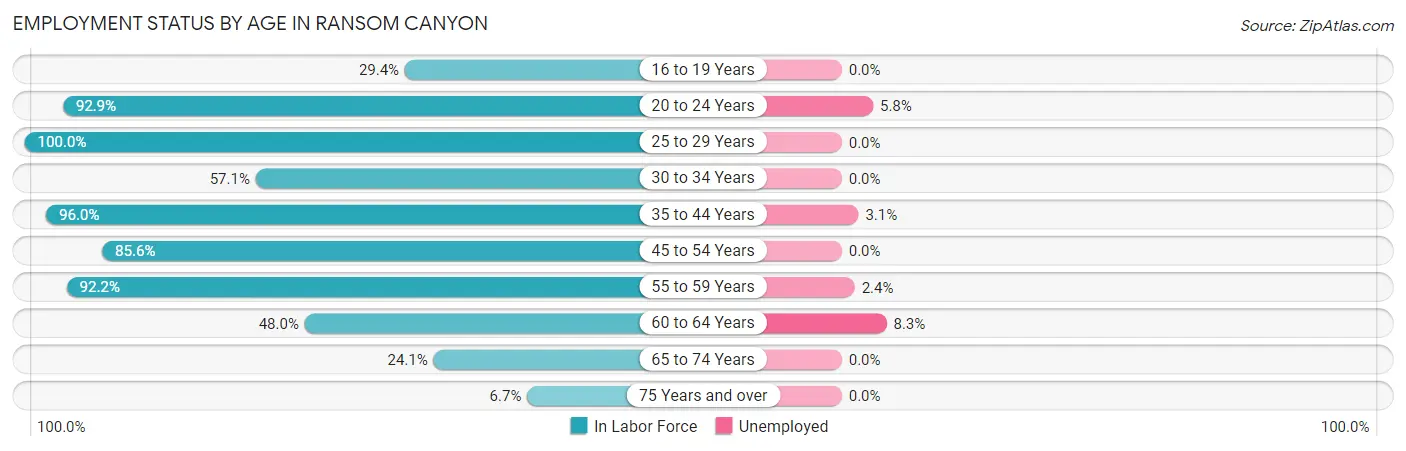
| Age Bracket | In Labor Force | Unemployed |
| 16 to 19 Years | 20 (29.4%) | 0 (0.0%) |
| 20 to 24 Years | 52 (92.9%) | 3 (5.8%) |
| 25 to 29 Years | 28 (100.0%) | 0 (0.0%) |
| 30 to 34 Years | 4 (57.1%) | 0 (0.0%) |
| 35 to 44 Years | 97 (96.0%) | 3 (3.1%) |
| 45 to 54 Years | 137 (85.6%) | 0 (0.0%) |
| 55 to 59 Years | 83 (92.2%) | 2 (2.4%) |
| 60 to 64 Years | 48 (48.0%) | 4 (8.3%) |
| 65 to 74 Years | 45 (24.1%) | 0 (0.0%) |
| 75 Years and over | 10 (6.7%) | 0 (0.0%) |
| Total | 524 (55.3%) | 12 (2.3%) |
Employment Status by Educational Attainment in Ransom Canyon
According to labor force statistics for Ransom Canyon, 81.7% of individuals (397) out of the total population between 25 and 64 years of age (486) are in the labor force, with 2.3% or 9 of them being unemployed. The group with the highest labor force participation rate are those with the educational attainment of high school diploma, with 92.0% or 81 individuals in the labor force. Within the labor force, individuals with college / associate degree education have the highest percentage of unemployment, with 3.5% or 4 of them being unemployed.
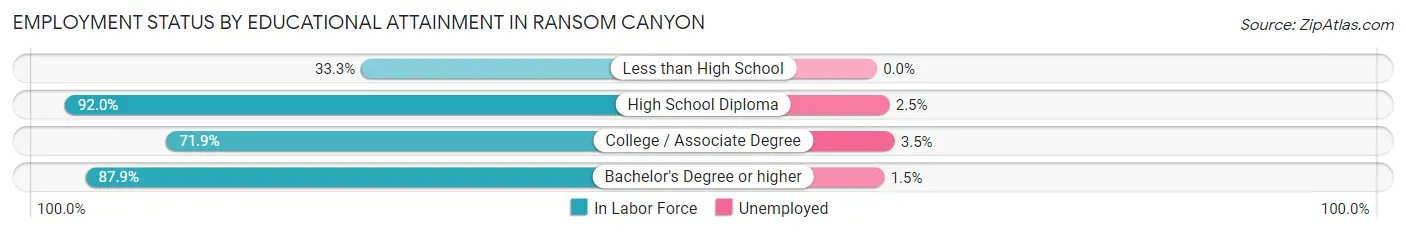
| Educational Attainment | In Labor Force | Unemployed |
| Less than High School | 5 (33.3%) | 0 (0.0%) |
| High School Diploma | 81 (92.0%) | 2 (2.5%) |
| College / Associate Degree | 115 (71.9%) | 6 (3.5%) |
| Bachelor's Degree or higher | 196 (87.9%) | 3 (1.5%) |
| Total | 397 (81.7%) | 11 (2.3%) |
Employment Occupations by Sex in Ransom Canyon
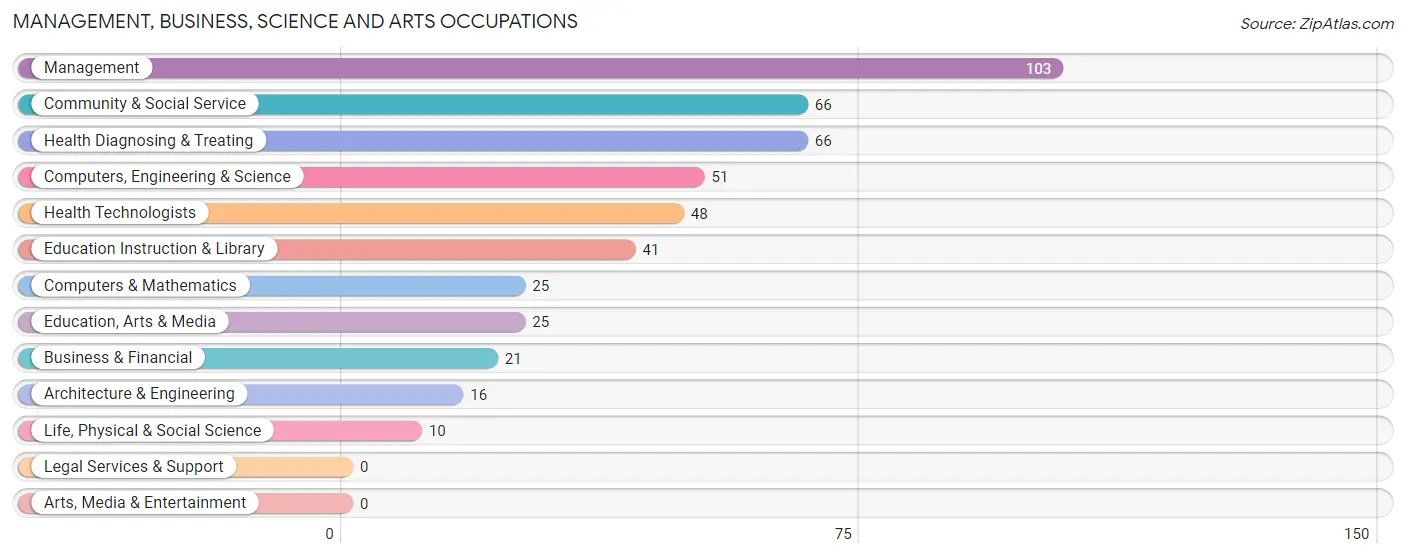
Management, Business, Science and Arts Occupations
The most common Management, Business, Science and Arts occupations in Ransom Canyon are Management (103 | 20.1%), Community & Social Service (66 | 12.9%), Health Diagnosing & Treating (66 | 12.9%), Computers, Engineering & Science (51 | 10.0%), and Health Technologists (48 | 9.4%).
Management, Business, Science and Arts Occupations by Sex
Within the Management, Business, Science and Arts occupations in Ransom Canyon, the most male-oriented occupations are Computers & Mathematics (100.0%), Computers, Engineering & Science (88.2%), and Architecture & Engineering (81.2%), while the most female-oriented occupations are Education, Arts & Media (92.0%), Community & Social Service (77.3%), and Health Technologists (77.1%).
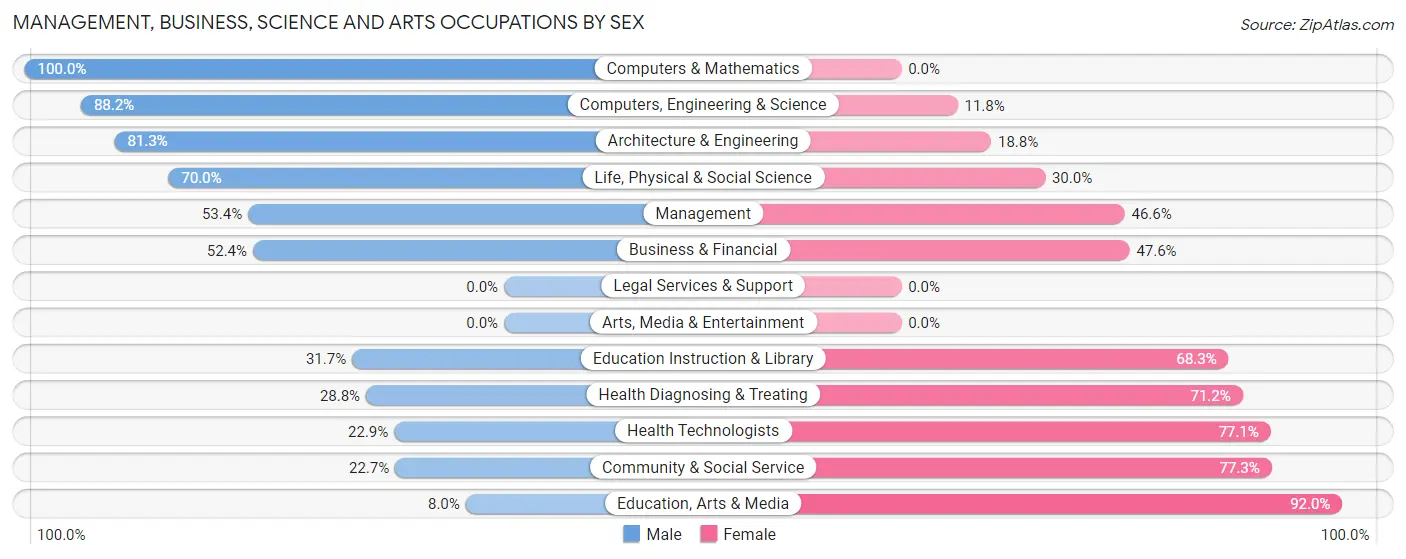
| Occupation | Male | Female |
| Management | 55 (53.4%) | 48 (46.6%) |
| Business & Financial | 11 (52.4%) | 10 (47.6%) |
| Computers, Engineering & Science | 45 (88.2%) | 6 (11.8%) |
| Computers & Mathematics | 25 (100.0%) | 0 (0.0%) |
| Architecture & Engineering | 13 (81.2%) | 3 (18.8%) |
| Life, Physical & Social Science | 7 (70.0%) | 3 (30.0%) |
| Community & Social Service | 15 (22.7%) | 51 (77.3%) |
| Education, Arts & Media | 2 (8.0%) | 23 (92.0%) |
| Legal Services & Support | 0 (0.0%) | 0 (0.0%) |
| Education Instruction & Library | 13 (31.7%) | 28 (68.3%) |
| Arts, Media & Entertainment | 0 (0.0%) | 0 (0.0%) |
| Health Diagnosing & Treating | 19 (28.8%) | 47 (71.2%) |
| Health Technologists | 11 (22.9%) | 37 (77.1%) |
| Total (Category) | 145 (47.2%) | 162 (52.8%) |
| Total (Overall) | 283 (55.3%) | 229 (44.7%) |
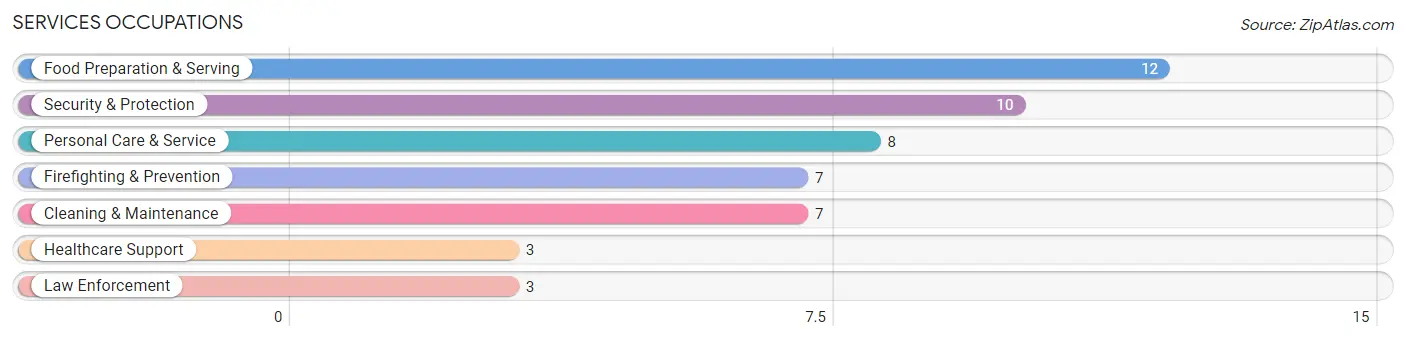
Services Occupations
The most common Services occupations in Ransom Canyon are Food Preparation & Serving (12 | 2.3%), Security & Protection (10 | 1.9%), Personal Care & Service (8 | 1.6%), Firefighting & Prevention (7 | 1.4%), and Cleaning & Maintenance (7 | 1.4%).
Services Occupations by Sex
Within the Services occupations in Ransom Canyon, the most male-oriented occupations are Law Enforcement (100.0%), Food Preparation & Serving (100.0%), and Security & Protection (70.0%), while the most female-oriented occupations are Healthcare Support (100.0%), Personal Care & Service (50.0%), and Firefighting & Prevention (42.9%).
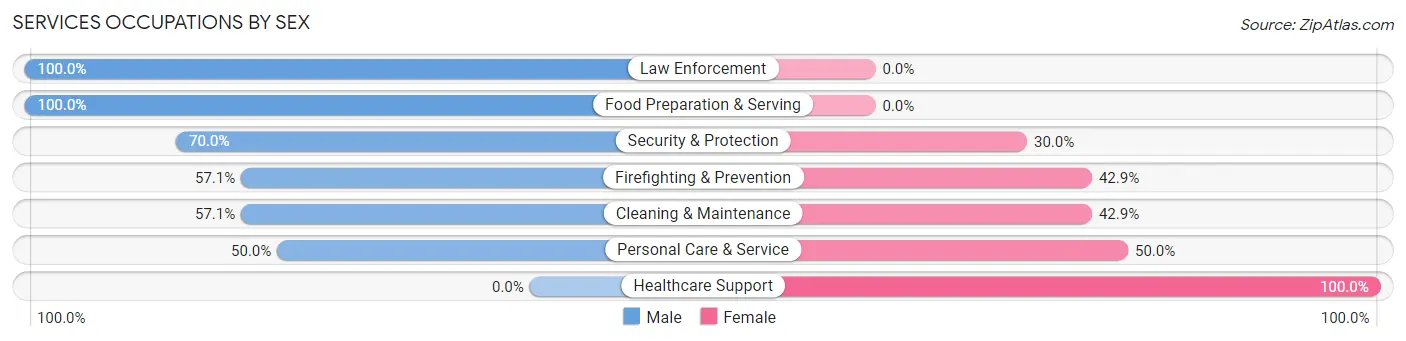
| Occupation | Male | Female |
| Healthcare Support | 0 (0.0%) | 3 (100.0%) |
| Security & Protection | 7 (70.0%) | 3 (30.0%) |
| Firefighting & Prevention | 4 (57.1%) | 3 (42.9%) |
| Law Enforcement | 3 (100.0%) | 0 (0.0%) |
| Food Preparation & Serving | 12 (100.0%) | 0 (0.0%) |
| Cleaning & Maintenance | 4 (57.1%) | 3 (42.9%) |
| Personal Care & Service | 4 (50.0%) | 4 (50.0%) |
| Total (Category) | 27 (67.5%) | 13 (32.5%) |
| Total (Overall) | 283 (55.3%) | 229 (44.7%) |
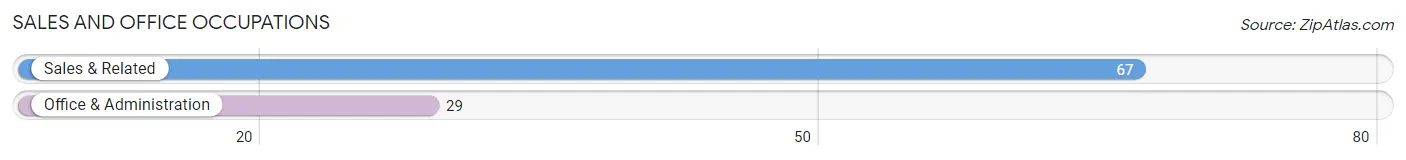
Sales and Office Occupations
The most common Sales and Office occupations in Ransom Canyon are Sales & Related (67 | 13.1%), and Office & Administration (29 | 5.7%).
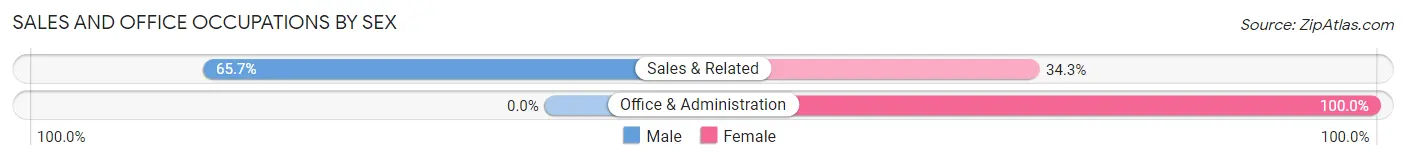
Sales and Office Occupations by Sex
| Occupation | Male | Female |
| Sales & Related | 44 (65.7%) | 23 (34.3%) |
| Office & Administration | 0 (0.0%) | 29 (100.0%) |
| Total (Category) | 44 (45.8%) | 52 (54.2%) |
| Total (Overall) | 283 (55.3%) | 229 (44.7%) |
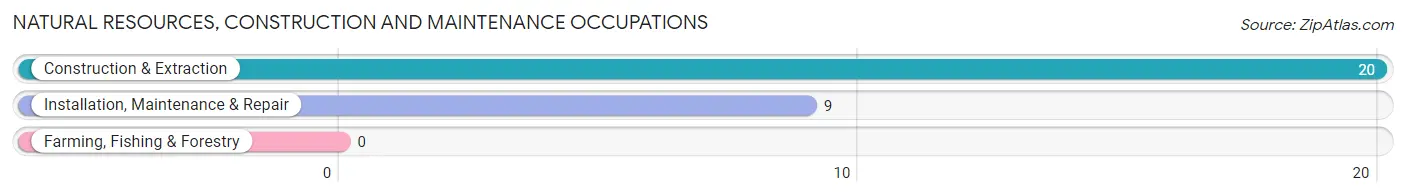
Natural Resources, Construction and Maintenance Occupations
The most common Natural Resources, Construction and Maintenance occupations in Ransom Canyon are Construction & Extraction (20 | 3.9%), and Installation, Maintenance & Repair (9 | 1.8%).
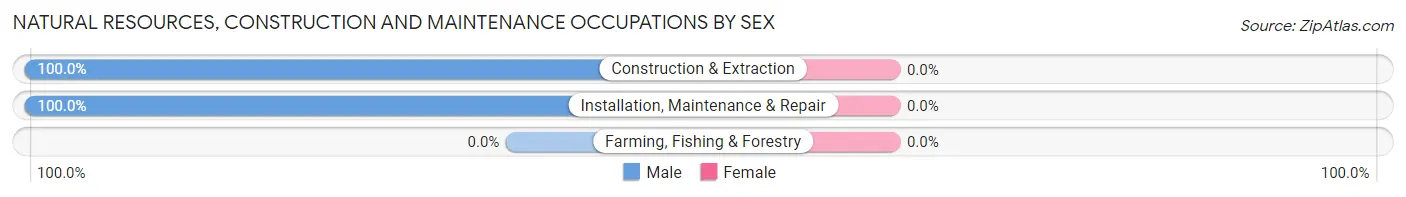
Natural Resources, Construction and Maintenance Occupations by Sex
| Occupation | Male | Female |
| Farming, Fishing & Forestry | 0 (0.0%) | 0 (0.0%) |
| Construction & Extraction | 20 (100.0%) | 0 (0.0%) |
| Installation, Maintenance & Repair | 9 (100.0%) | 0 (0.0%) |
| Total (Category) | 29 (100.0%) | 0 (0.0%) |
| Total (Overall) | 283 (55.3%) | 229 (44.7%) |
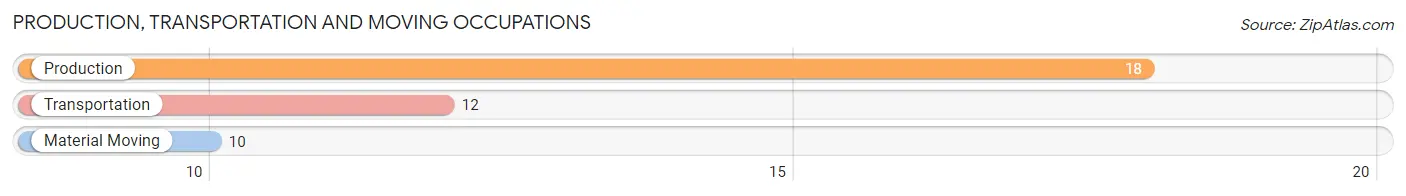
Production, Transportation and Moving Occupations
The most common Production, Transportation and Moving occupations in Ransom Canyon are Production (18 | 3.5%), Transportation (12 | 2.3%), and Material Moving (10 | 1.9%).
Production, Transportation and Moving Occupations by Sex
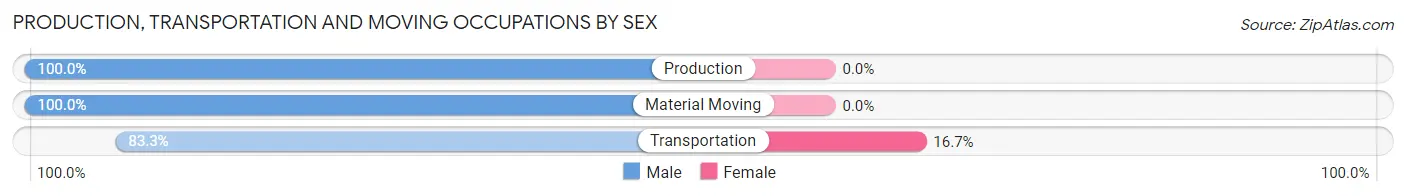
| Occupation | Male | Female |
| Production | 18 (100.0%) | 0 (0.0%) |
| Transportation | 10 (83.3%) | 2 (16.7%) |
| Material Moving | 10 (100.0%) | 0 (0.0%) |
| Total (Category) | 38 (95.0%) | 2 (5.0%) |
| Total (Overall) | 283 (55.3%) | 229 (44.7%) |
Employment Industries by Sex in Ransom Canyon
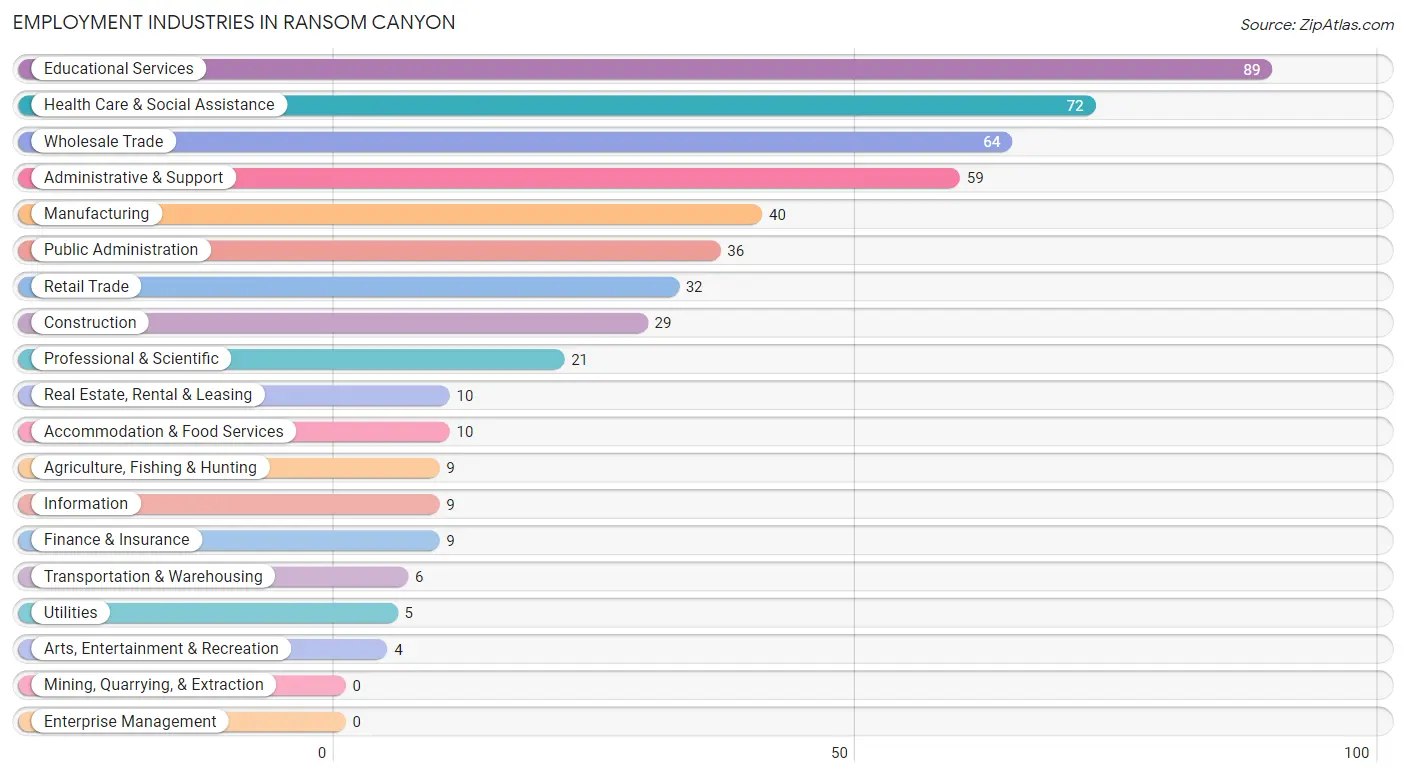
Employment Industries in Ransom Canyon
The major employment industries in Ransom Canyon include Educational Services (89 | 17.4%), Health Care & Social Assistance (72 | 14.1%), Wholesale Trade (64 | 12.5%), Administrative & Support (59 | 11.5%), and Manufacturing (40 | 7.8%).
Employment Industries by Sex in Ransom Canyon
The Ransom Canyon industries that see more men than women are Agriculture, Fishing & Hunting (100.0%), Construction (100.0%), and Arts, Entertainment & Recreation (100.0%), whereas the industries that tend to have a higher number of women are Health Care & Social Assistance (72.2%), Information (66.7%), and Educational Services (64.0%).
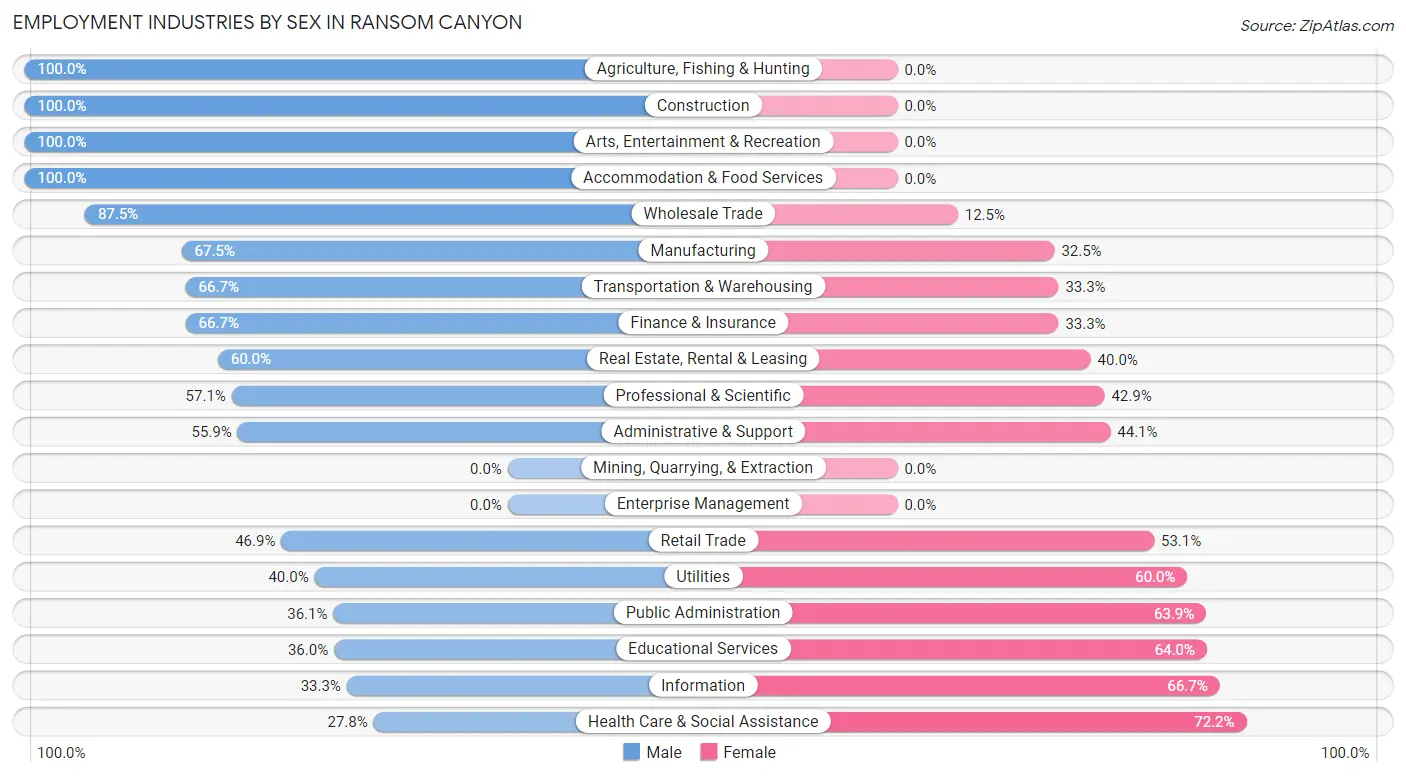
| Industry | Male | Female |
| Agriculture, Fishing & Hunting | 9 (100.0%) | 0 (0.0%) |
| Mining, Quarrying, & Extraction | 0 (0.0%) | 0 (0.0%) |
| Construction | 29 (100.0%) | 0 (0.0%) |
| Manufacturing | 27 (67.5%) | 13 (32.5%) |
| Wholesale Trade | 56 (87.5%) | 8 (12.5%) |
| Retail Trade | 15 (46.9%) | 17 (53.1%) |
| Transportation & Warehousing | 4 (66.7%) | 2 (33.3%) |
| Utilities | 2 (40.0%) | 3 (60.0%) |
| Information | 3 (33.3%) | 6 (66.7%) |
| Finance & Insurance | 6 (66.7%) | 3 (33.3%) |
| Real Estate, Rental & Leasing | 6 (60.0%) | 4 (40.0%) |
| Professional & Scientific | 12 (57.1%) | 9 (42.9%) |
| Enterprise Management | 0 (0.0%) | 0 (0.0%) |
| Administrative & Support | 33 (55.9%) | 26 (44.1%) |
| Educational Services | 32 (36.0%) | 57 (64.0%) |
| Health Care & Social Assistance | 20 (27.8%) | 52 (72.2%) |
| Arts, Entertainment & Recreation | 4 (100.0%) | 0 (0.0%) |
| Accommodation & Food Services | 10 (100.0%) | 0 (0.0%) |
| Public Administration | 13 (36.1%) | 23 (63.9%) |
| Total | 283 (55.3%) | 229 (44.7%) |
Education in Ransom Canyon
School Enrollment in Ransom Canyon
The most common levels of schooling among the 184 students in Ransom Canyon are high school (65 | 35.3%), elementary school (46 | 25.0%), and middle school (23 | 12.5%).
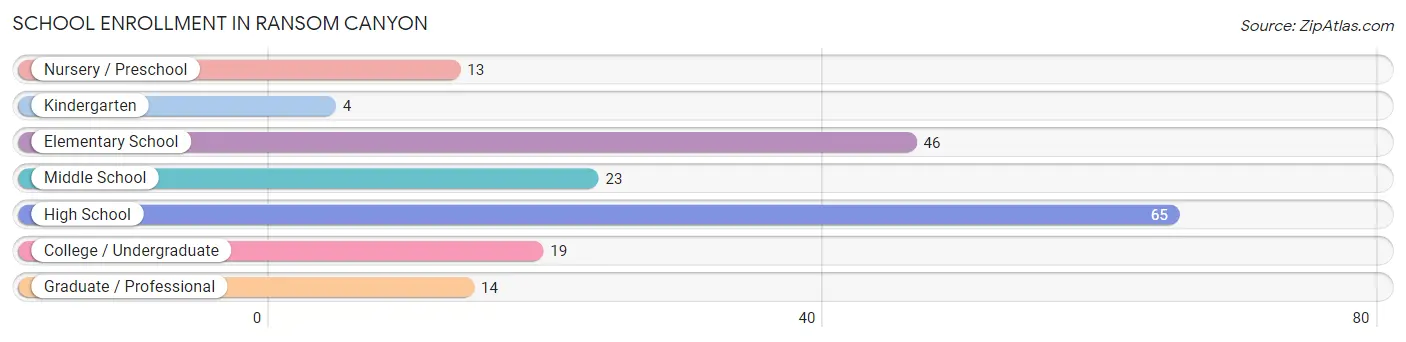
| School Level | # Students | % Students |
| Nursery / Preschool | 13 | 7.1% |
| Kindergarten | 4 | 2.2% |
| Elementary School | 46 | 25.0% |
| Middle School | 23 | 12.5% |
| High School | 65 | 35.3% |
| College / Undergraduate | 19 | 10.3% |
| Graduate / Professional | 14 | 7.6% |
| Total | 184 | 100.0% |
School Enrollment by Age by Funding Source in Ransom Canyon
Out of a total of 184 students who are enrolled in schools in Ransom Canyon, 37 (20.1%) attend a private institution, while the remaining 147 (79.9%) are enrolled in public schools. The age group of 20 to 24 year olds has the highest likelihood of being enrolled in private schools, with 4 (57.1% in the age bracket) enrolled. Conversely, the age group of 3 to 4 year olds has the lowest likelihood of being enrolled in a private school, with 4 (100.0% in the age bracket) attending a public institution.
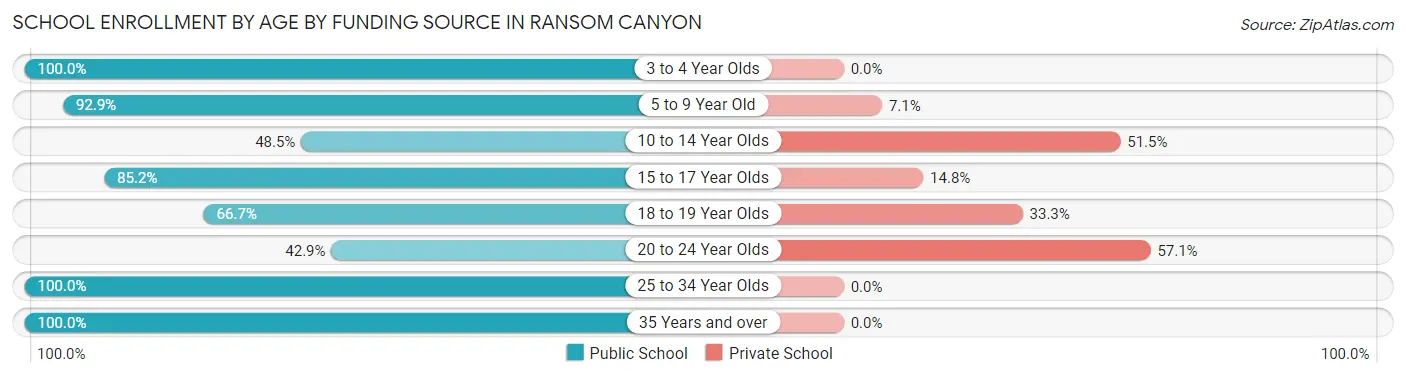
| Age Bracket | Public School | Private School |
| 3 to 4 Year Olds | 4 (100.0%) | 0 (0.0%) |
| 5 to 9 Year Old | 52 (92.9%) | 4 (7.1%) |
| 10 to 14 Year Olds | 16 (48.5%) | 17 (51.5%) |
| 15 to 17 Year Olds | 46 (85.2%) | 8 (14.8%) |
| 18 to 19 Year Olds | 8 (66.7%) | 4 (33.3%) |
| 20 to 24 Year Olds | 3 (42.9%) | 4 (57.1%) |
| 25 to 34 Year Olds | 8 (100.0%) | 0 (0.0%) |
| 35 Years and over | 10 (100.0%) | 0 (0.0%) |
| Total | 147 (79.9%) | 37 (20.1%) |
Educational Attainment by Field of Study in Ransom Canyon
Education (91 | 22.6%), bio, nature & agricultural (78 | 19.4%), business (62 | 15.4%), science & technology (40 | 9.9%), and engineering (24 | 6.0%) are the most common fields of study among 403 individuals in Ransom Canyon who have obtained a bachelor's degree or higher.
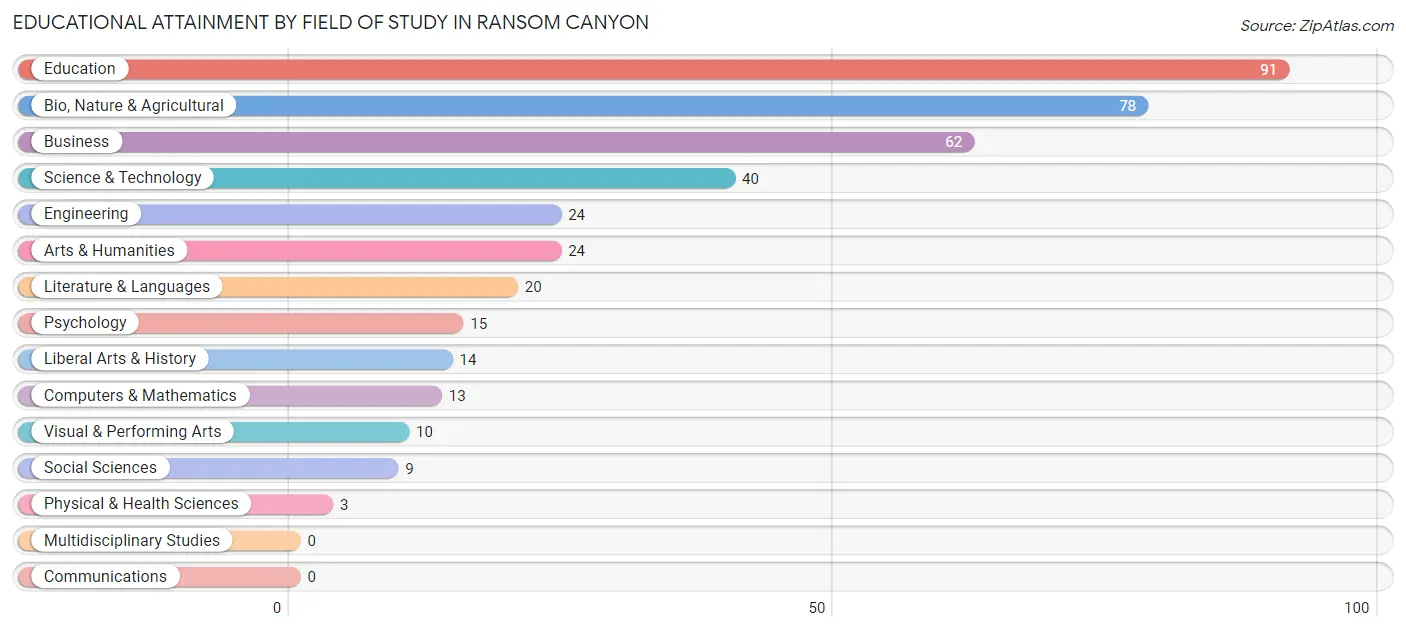
| Field of Study | # Graduates | % Graduates |
| Computers & Mathematics | 13 | 3.2% |
| Bio, Nature & Agricultural | 78 | 19.4% |
| Physical & Health Sciences | 3 | 0.7% |
| Psychology | 15 | 3.7% |
| Social Sciences | 9 | 2.2% |
| Engineering | 24 | 6.0% |
| Multidisciplinary Studies | 0 | 0.0% |
| Science & Technology | 40 | 9.9% |
| Business | 62 | 15.4% |
| Education | 91 | 22.6% |
| Literature & Languages | 20 | 5.0% |
| Liberal Arts & History | 14 | 3.5% |
| Visual & Performing Arts | 10 | 2.5% |
| Communications | 0 | 0.0% |
| Arts & Humanities | 24 | 6.0% |
| Total | 403 | 100.0% |
Transportation & Commute in Ransom Canyon
Vehicle Availability by Sex in Ransom Canyon
The most prevalent vehicle ownership categories in Ransom Canyon are males with 2 vehicles (116, accounting for 41.4%) and females with 2 vehicles (100, making up 51.6%).
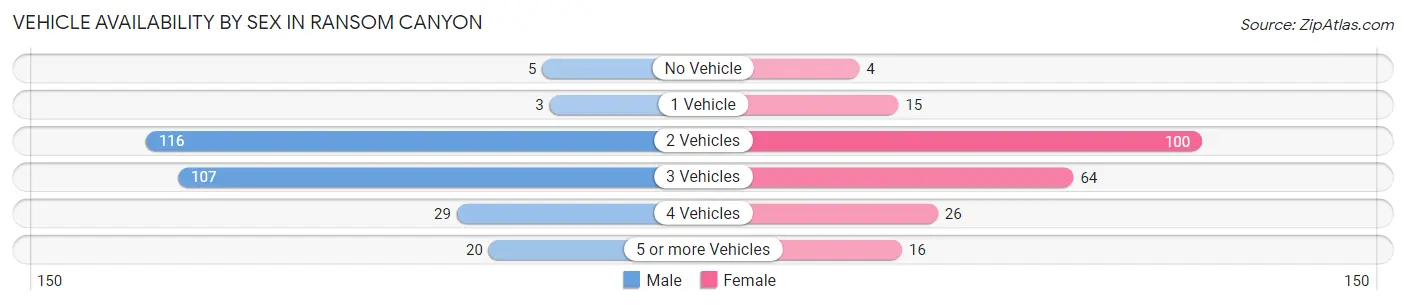
| Vehicles Available | Male | Female |
| No Vehicle | 5 (1.8%) | 4 (1.8%) |
| 1 Vehicle | 3 (1.1%) | 15 (6.7%) |
| 2 Vehicles | 116 (41.4%) | 100 (44.4%) |
| 3 Vehicles | 107 (38.2%) | 64 (28.4%) |
| 4 Vehicles | 29 (10.4%) | 26 (11.6%) |
| 5 or more Vehicles | 20 (7.1%) | 16 (7.1%) |
| Total | 280 (100.0%) | 225 (100.0%) |
Commute Time in Ransom Canyon
The most frequently occuring commute durations in Ransom Canyon are 20 to 24 minutes (213 commuters, 43.6%), 25 to 29 minutes (70 commuters, 14.3%), and 30 to 34 minutes (49 commuters, 10.0%).
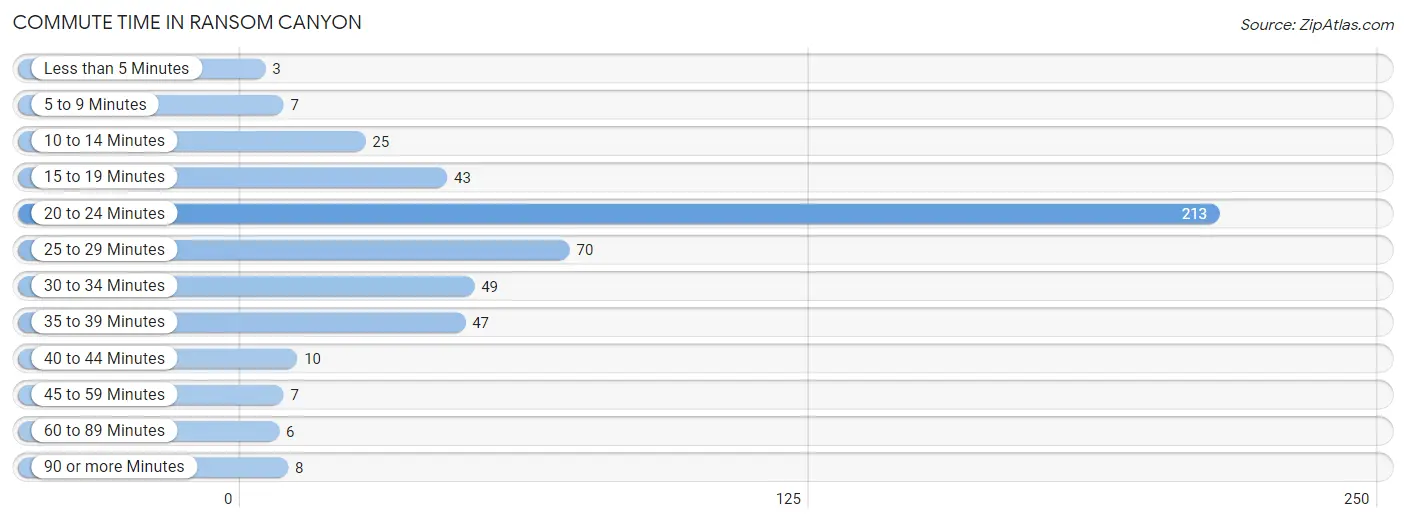
| Commute Time | # Commuters | % Commuters |
| Less than 5 Minutes | 3 | 0.6% |
| 5 to 9 Minutes | 7 | 1.4% |
| 10 to 14 Minutes | 25 | 5.1% |
| 15 to 19 Minutes | 43 | 8.8% |
| 20 to 24 Minutes | 213 | 43.6% |
| 25 to 29 Minutes | 70 | 14.3% |
| 30 to 34 Minutes | 49 | 10.0% |
| 35 to 39 Minutes | 47 | 9.6% |
| 40 to 44 Minutes | 10 | 2.1% |
| 45 to 59 Minutes | 7 | 1.4% |
| 60 to 89 Minutes | 6 | 1.2% |
| 90 or more Minutes | 8 | 1.6% |
Commute Time by Sex in Ransom Canyon
The most common commute times in Ransom Canyon are 20 to 24 minutes (111 commuters, 40.5%) for males and 20 to 24 minutes (102 commuters, 47.7%) for females.
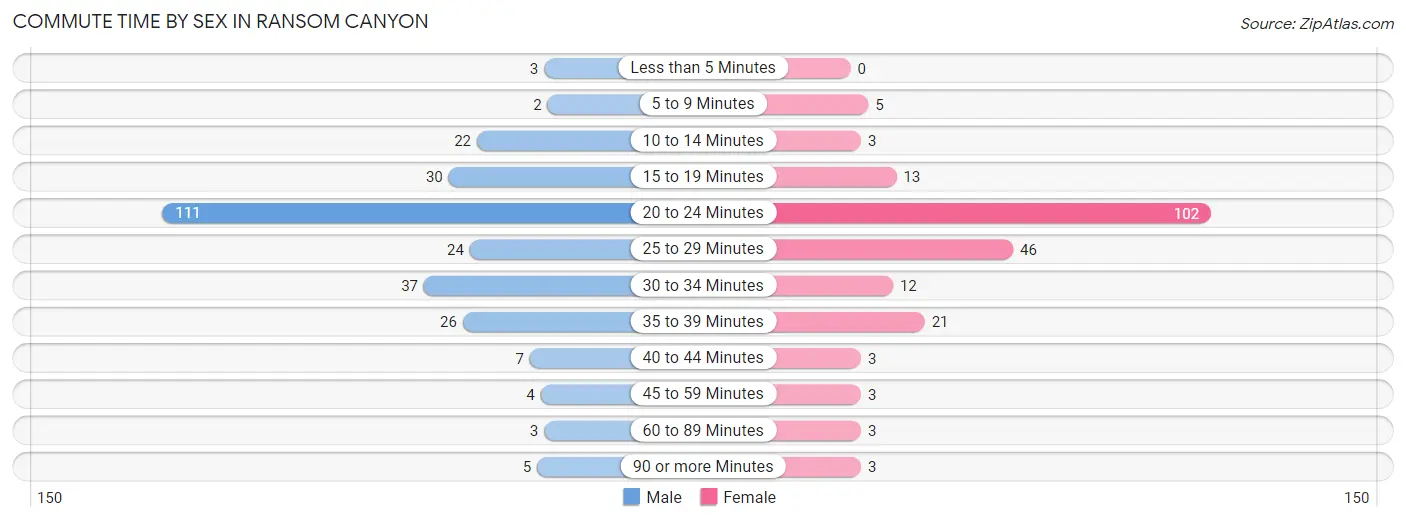
| Commute Time | Male | Female |
| Less than 5 Minutes | 3 (1.1%) | 0 (0.0%) |
| 5 to 9 Minutes | 2 (0.7%) | 5 (2.3%) |
| 10 to 14 Minutes | 22 (8.0%) | 3 (1.4%) |
| 15 to 19 Minutes | 30 (11.0%) | 13 (6.1%) |
| 20 to 24 Minutes | 111 (40.5%) | 102 (47.7%) |
| 25 to 29 Minutes | 24 (8.8%) | 46 (21.5%) |
| 30 to 34 Minutes | 37 (13.5%) | 12 (5.6%) |
| 35 to 39 Minutes | 26 (9.5%) | 21 (9.8%) |
| 40 to 44 Minutes | 7 (2.5%) | 3 (1.4%) |
| 45 to 59 Minutes | 4 (1.5%) | 3 (1.4%) |
| 60 to 89 Minutes | 3 (1.1%) | 3 (1.4%) |
| 90 or more Minutes | 5 (1.8%) | 3 (1.4%) |
Time of Departure to Work by Sex in Ransom Canyon
The most frequent times of departure to work in Ransom Canyon are 7:00 AM to 7:29 AM (71, 25.9%) for males and 7:30 AM to 7:59 AM (46, 21.5%) for females.
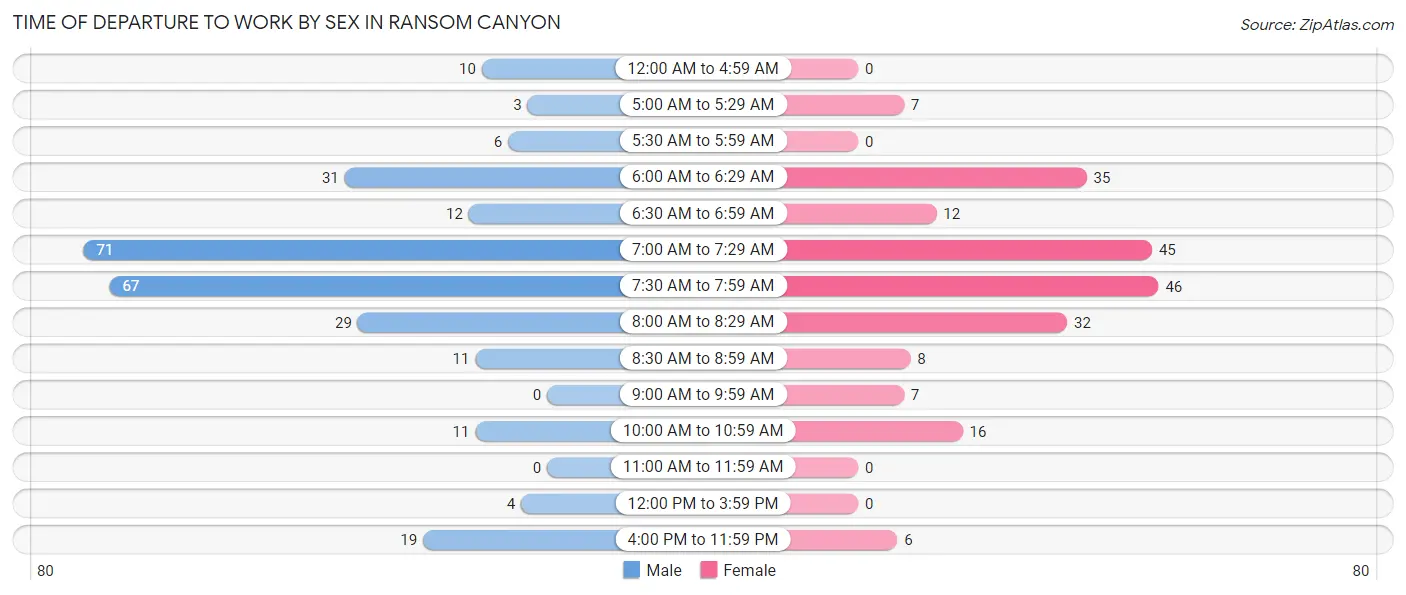
| Time of Departure | Male | Female |
| 12:00 AM to 4:59 AM | 10 (3.6%) | 0 (0.0%) |
| 5:00 AM to 5:29 AM | 3 (1.1%) | 7 (3.3%) |
| 5:30 AM to 5:59 AM | 6 (2.2%) | 0 (0.0%) |
| 6:00 AM to 6:29 AM | 31 (11.3%) | 35 (16.4%) |
| 6:30 AM to 6:59 AM | 12 (4.4%) | 12 (5.6%) |
| 7:00 AM to 7:29 AM | 71 (25.9%) | 45 (21.0%) |
| 7:30 AM to 7:59 AM | 67 (24.4%) | 46 (21.5%) |
| 8:00 AM to 8:29 AM | 29 (10.6%) | 32 (14.9%) |
| 8:30 AM to 8:59 AM | 11 (4.0%) | 8 (3.7%) |
| 9:00 AM to 9:59 AM | 0 (0.0%) | 7 (3.3%) |
| 10:00 AM to 10:59 AM | 11 (4.0%) | 16 (7.5%) |
| 11:00 AM to 11:59 AM | 0 (0.0%) | 0 (0.0%) |
| 12:00 PM to 3:59 PM | 4 (1.5%) | 0 (0.0%) |
| 4:00 PM to 11:59 PM | 19 (6.9%) | 6 (2.8%) |
| Total | 274 (100.0%) | 214 (100.0%) |
Housing Occupancy in Ransom Canyon
Occupancy by Ownership in Ransom Canyon
Of the total 451 dwellings in Ransom Canyon, owner-occupied units account for 440 (97.6%), while renter-occupied units make up 11 (2.4%).
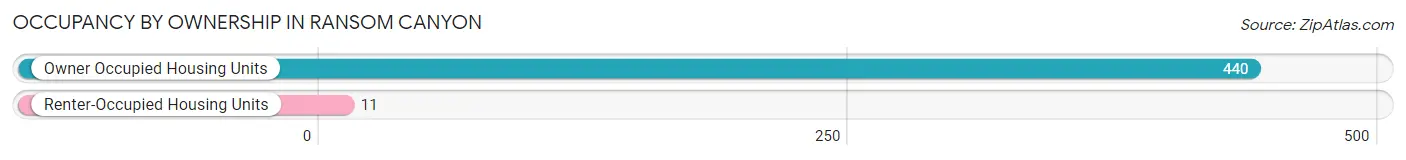
| Occupancy | # Housing Units | % Housing Units |
| Owner Occupied Housing Units | 440 | 97.6% |
| Renter-Occupied Housing Units | 11 | 2.4% |
| Total Occupied Housing Units | 451 | 100.0% |
Occupancy by Household Size in Ransom Canyon
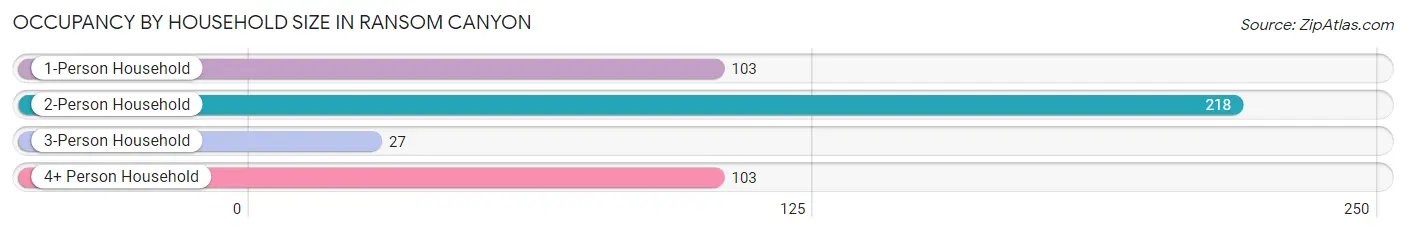
| Household Size | # Housing Units | % Housing Units |
| 1-Person Household | 103 | 22.8% |
| 2-Person Household | 218 | 48.3% |
| 3-Person Household | 27 | 6.0% |
| 4+ Person Household | 103 | 22.8% |
| Total Housing Units | 451 | 100.0% |
Occupancy by Ownership by Household Size in Ransom Canyon
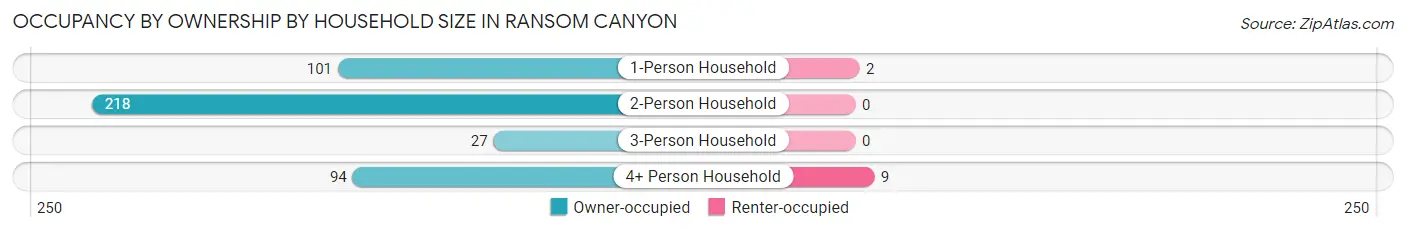
| Household Size | Owner-occupied | Renter-occupied |
| 1-Person Household | 101 (98.1%) | 2 (1.9%) |
| 2-Person Household | 218 (100.0%) | 0 (0.0%) |
| 3-Person Household | 27 (100.0%) | 0 (0.0%) |
| 4+ Person Household | 94 (91.3%) | 9 (8.7%) |
| Total Housing Units | 440 (97.6%) | 11 (2.4%) |
Occupancy by Educational Attainment in Ransom Canyon
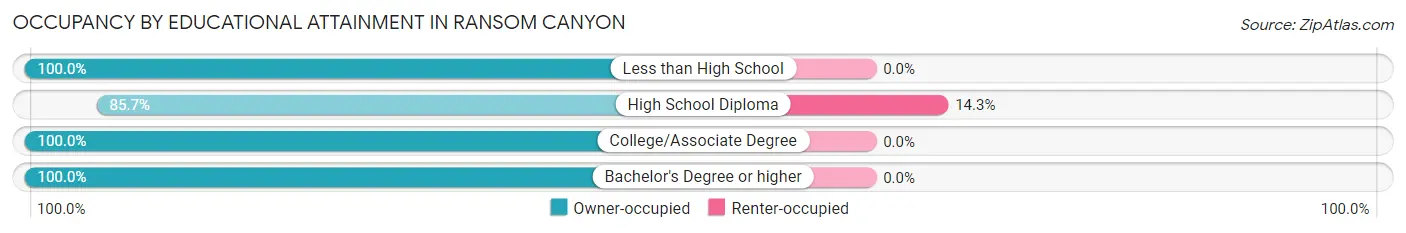
| Household Size | Owner-occupied | Renter-occupied |
| Less than High School | 4 (100.0%) | 0 (0.0%) |
| High School Diploma | 66 (85.7%) | 11 (14.3%) |
| College/Associate Degree | 153 (100.0%) | 0 (0.0%) |
| Bachelor's Degree or higher | 217 (100.0%) | 0 (0.0%) |
Occupancy by Age of Householder in Ransom Canyon
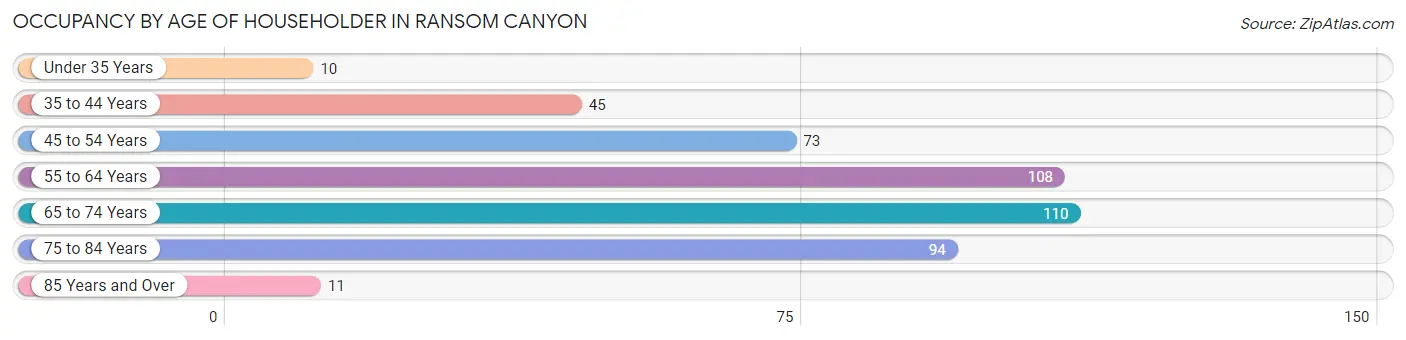
| Age Bracket | # Households | % Households |
| Under 35 Years | 10 | 2.2% |
| 35 to 44 Years | 45 | 10.0% |
| 45 to 54 Years | 73 | 16.2% |
| 55 to 64 Years | 108 | 23.9% |
| 65 to 74 Years | 110 | 24.4% |
| 75 to 84 Years | 94 | 20.8% |
| 85 Years and Over | 11 | 2.4% |
| Total | 451 | 100.0% |
Housing Finances in Ransom Canyon
Median Income by Occupancy in Ransom Canyon
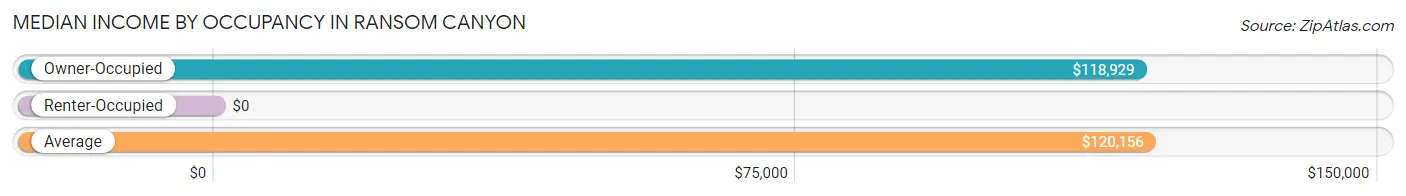
| Occupancy Type | # Households | Median Income |
| Owner-Occupied | 440 (97.6%) | $118,929 |
| Renter-Occupied | 11 (2.4%) | $0 |
| Average | 451 (100.0%) | $120,156 |
Occupancy by Householder Income Bracket in Ransom Canyon
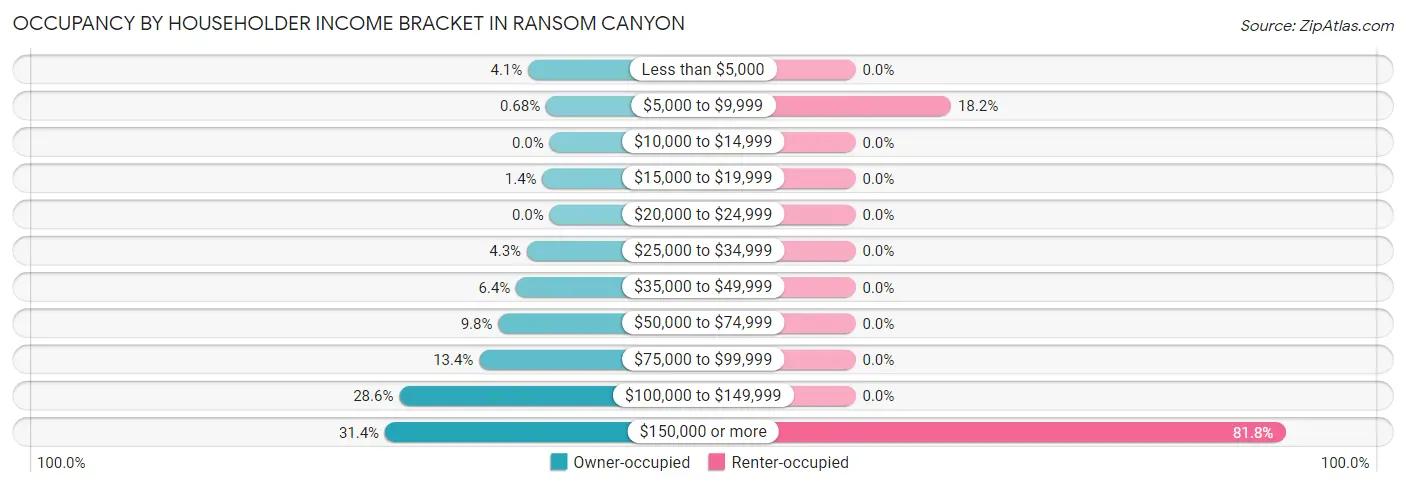
| Income Bracket | Owner-occupied | Renter-occupied |
| Less than $5,000 | 18 (4.1%) | 0 (0.0%) |
| $5,000 to $9,999 | 3 (0.7%) | 2 (18.2%) |
| $10,000 to $14,999 | 0 (0.0%) | 0 (0.0%) |
| $15,000 to $19,999 | 6 (1.4%) | 0 (0.0%) |
| $20,000 to $24,999 | 0 (0.0%) | 0 (0.0%) |
| $25,000 to $34,999 | 19 (4.3%) | 0 (0.0%) |
| $35,000 to $49,999 | 28 (6.4%) | 0 (0.0%) |
| $50,000 to $74,999 | 43 (9.8%) | 0 (0.0%) |
| $75,000 to $99,999 | 59 (13.4%) | 0 (0.0%) |
| $100,000 to $149,999 | 126 (28.6%) | 0 (0.0%) |
| $150,000 or more | 138 (31.4%) | 9 (81.8%) |
| Total | 440 (100.0%) | 11 (100.0%) |
Monthly Housing Cost Tiers in Ransom Canyon
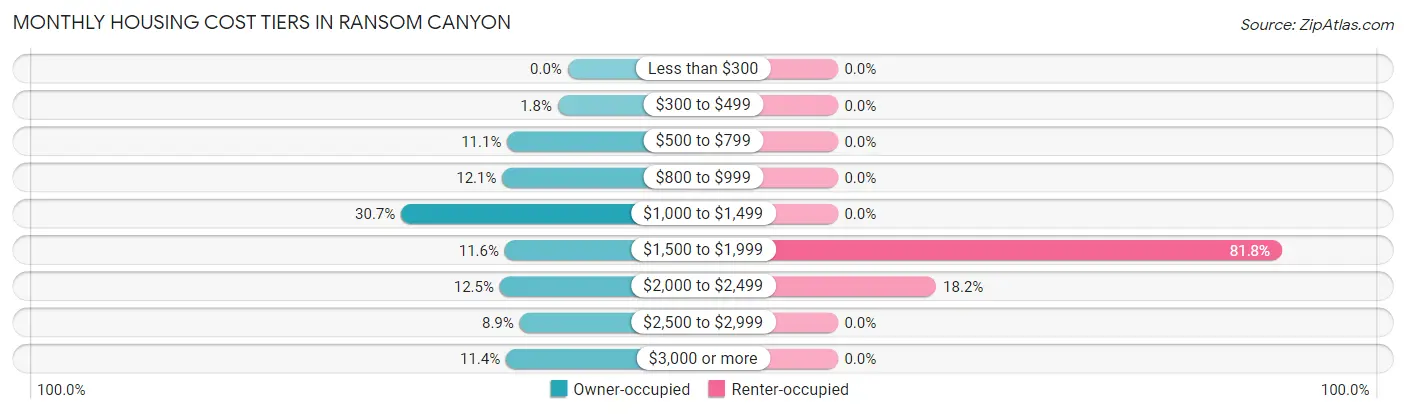
| Monthly Cost | Owner-occupied | Renter-occupied |
| Less than $300 | 0 (0.0%) | 0 (0.0%) |
| $300 to $499 | 8 (1.8%) | 0 (0.0%) |
| $500 to $799 | 49 (11.1%) | 0 (0.0%) |
| $800 to $999 | 53 (12.0%) | 0 (0.0%) |
| $1,000 to $1,499 | 135 (30.7%) | 0 (0.0%) |
| $1,500 to $1,999 | 51 (11.6%) | 9 (81.8%) |
| $2,000 to $2,499 | 55 (12.5%) | 2 (18.2%) |
| $2,500 to $2,999 | 39 (8.9%) | 0 (0.0%) |
| $3,000 or more | 50 (11.4%) | 0 (0.0%) |
| Total | 440 (100.0%) | 11 (100.0%) |
Physical Housing Characteristics in Ransom Canyon
Housing Structures in Ransom Canyon
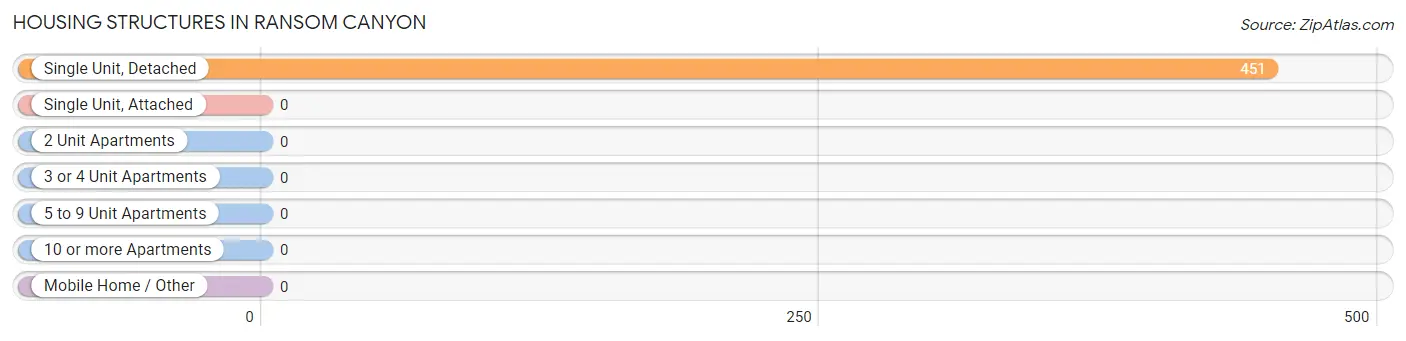
| Structure Type | # Housing Units | % Housing Units |
| Single Unit, Detached | 451 | 100.0% |
| Single Unit, Attached | 0 | 0.0% |
| 2 Unit Apartments | 0 | 0.0% |
| 3 or 4 Unit Apartments | 0 | 0.0% |
| 5 to 9 Unit Apartments | 0 | 0.0% |
| 10 or more Apartments | 0 | 0.0% |
| Mobile Home / Other | 0 | 0.0% |
| Total | 451 | 100.0% |
Housing Structures by Occupancy in Ransom Canyon
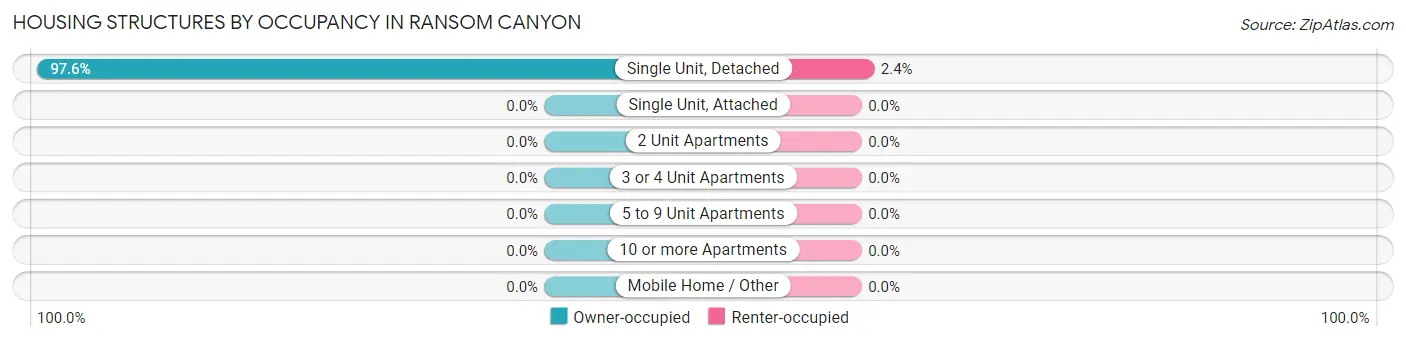
| Structure Type | Owner-occupied | Renter-occupied |
| Single Unit, Detached | 440 (97.6%) | 11 (2.4%) |
| Single Unit, Attached | 0 (0.0%) | 0 (0.0%) |
| 2 Unit Apartments | 0 (0.0%) | 0 (0.0%) |
| 3 or 4 Unit Apartments | 0 (0.0%) | 0 (0.0%) |
| 5 to 9 Unit Apartments | 0 (0.0%) | 0 (0.0%) |
| 10 or more Apartments | 0 (0.0%) | 0 (0.0%) |
| Mobile Home / Other | 0 (0.0%) | 0 (0.0%) |
| Total | 440 (97.6%) | 11 (2.4%) |
Housing Structures by Number of Rooms in Ransom Canyon
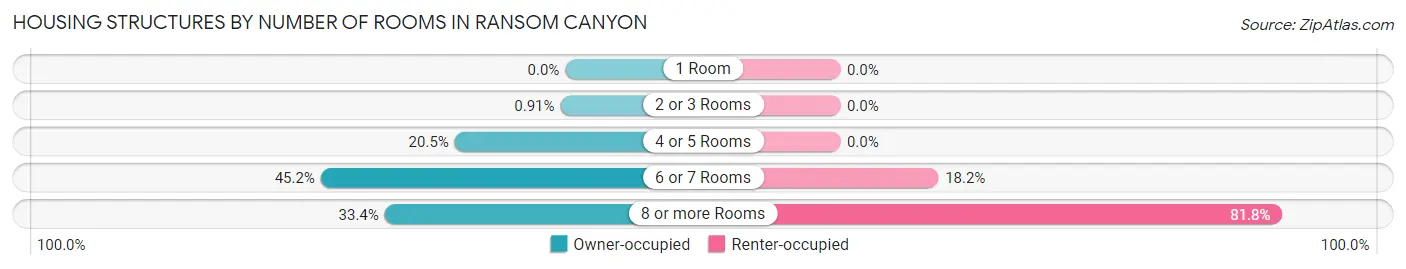
| Number of Rooms | Owner-occupied | Renter-occupied |
| 1 Room | 0 (0.0%) | 0 (0.0%) |
| 2 or 3 Rooms | 4 (0.9%) | 0 (0.0%) |
| 4 or 5 Rooms | 90 (20.4%) | 0 (0.0%) |
| 6 or 7 Rooms | 199 (45.2%) | 2 (18.2%) |
| 8 or more Rooms | 147 (33.4%) | 9 (81.8%) |
| Total | 440 (100.0%) | 11 (100.0%) |
Housing Structure by Heating Type in Ransom Canyon
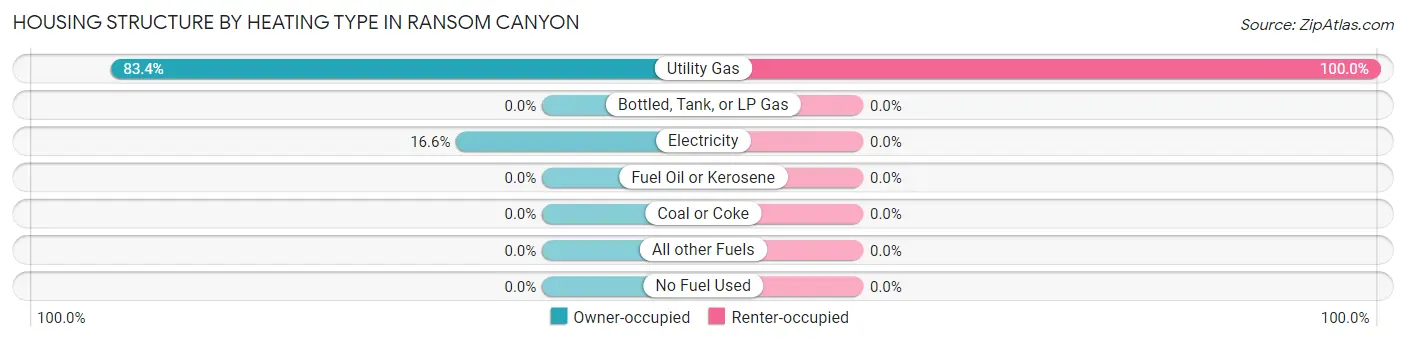
| Heating Type | Owner-occupied | Renter-occupied |
| Utility Gas | 367 (83.4%) | 11 (100.0%) |
| Bottled, Tank, or LP Gas | 0 (0.0%) | 0 (0.0%) |
| Electricity | 73 (16.6%) | 0 (0.0%) |
| Fuel Oil or Kerosene | 0 (0.0%) | 0 (0.0%) |
| Coal or Coke | 0 (0.0%) | 0 (0.0%) |
| All other Fuels | 0 (0.0%) | 0 (0.0%) |
| No Fuel Used | 0 (0.0%) | 0 (0.0%) |
| Total | 440 (100.0%) | 11 (100.0%) |
Household Vehicle Usage in Ransom Canyon
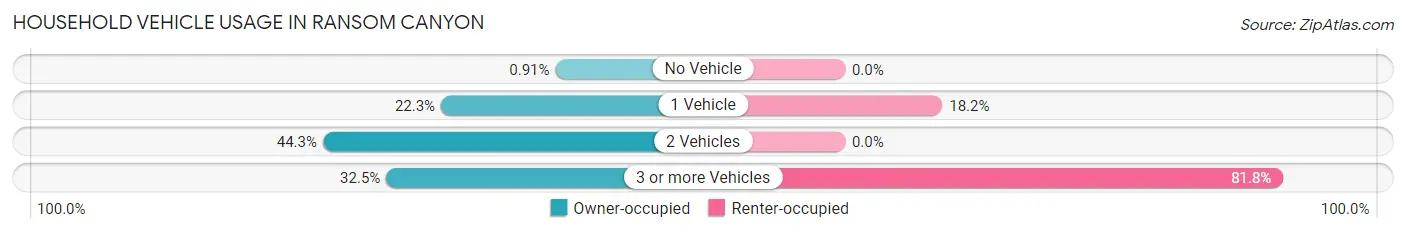
| Vehicles per Household | Owner-occupied | Renter-occupied |
| No Vehicle | 4 (0.9%) | 0 (0.0%) |
| 1 Vehicle | 98 (22.3%) | 2 (18.2%) |
| 2 Vehicles | 195 (44.3%) | 0 (0.0%) |
| 3 or more Vehicles | 143 (32.5%) | 9 (81.8%) |
| Total | 440 (100.0%) | 11 (100.0%) |
Real Estate & Mortgages in Ransom Canyon
Real Estate and Mortgage Overview in Ransom Canyon
| Characteristic | Without Mortgage | With Mortgage |
| Housing Units | 235 | 205 |
| Median Property Value | $310,000 | $319,400 |
| Median Household Income | $103,750 | $80 |
| Monthly Housing Costs | $1,030 | $47 |
| Real Estate Taxes | $4,821 | $9 |
Property Value by Mortgage Status in Ransom Canyon
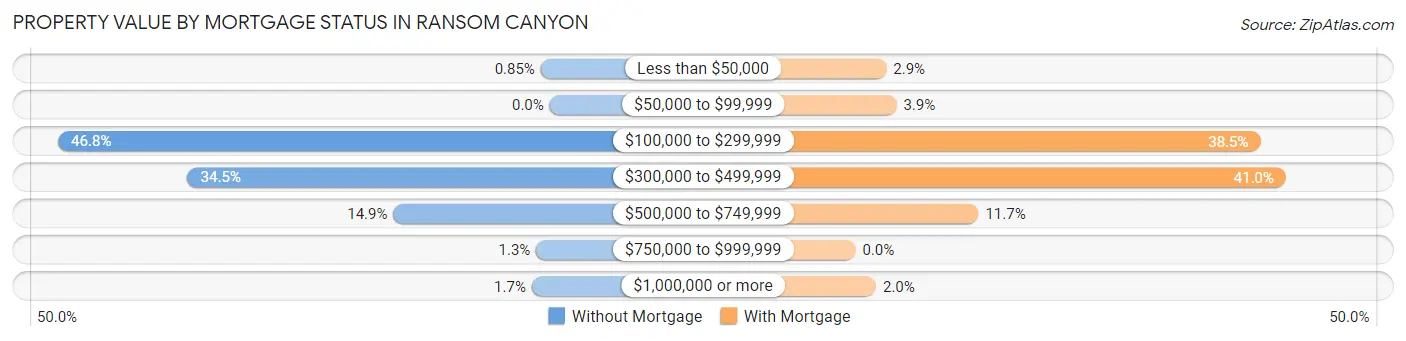
| Property Value | Without Mortgage | With Mortgage |
| Less than $50,000 | 2 (0.9%) | 6 (2.9%) |
| $50,000 to $99,999 | 0 (0.0%) | 8 (3.9%) |
| $100,000 to $299,999 | 110 (46.8%) | 79 (38.5%) |
| $300,000 to $499,999 | 81 (34.5%) | 84 (41.0%) |
| $500,000 to $749,999 | 35 (14.9%) | 24 (11.7%) |
| $750,000 to $999,999 | 3 (1.3%) | 0 (0.0%) |
| $1,000,000 or more | 4 (1.7%) | 4 (1.9%) |
| Total | 235 (100.0%) | 205 (100.0%) |
Household Income by Mortgage Status in Ransom Canyon
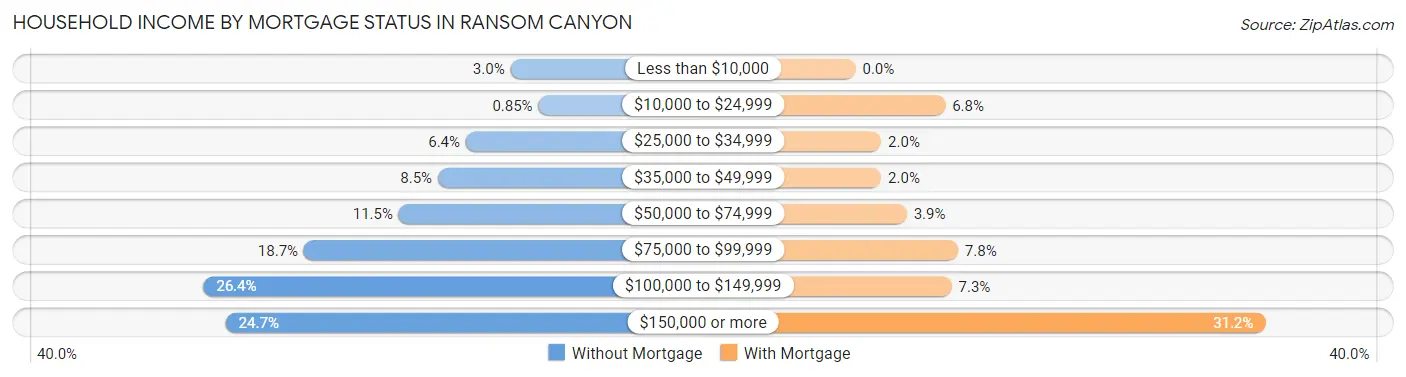
| Household Income | Without Mortgage | With Mortgage |
| Less than $10,000 | 7 (3.0%) | 0 (0.0%) |
| $10,000 to $24,999 | 2 (0.9%) | 14 (6.8%) |
| $25,000 to $34,999 | 15 (6.4%) | 4 (1.9%) |
| $35,000 to $49,999 | 20 (8.5%) | 4 (1.9%) |
| $50,000 to $74,999 | 27 (11.5%) | 8 (3.9%) |
| $75,000 to $99,999 | 44 (18.7%) | 16 (7.8%) |
| $100,000 to $149,999 | 62 (26.4%) | 15 (7.3%) |
| $150,000 or more | 58 (24.7%) | 64 (31.2%) |
| Total | 235 (100.0%) | 205 (100.0%) |
Property Value to Household Income Ratio in Ransom Canyon
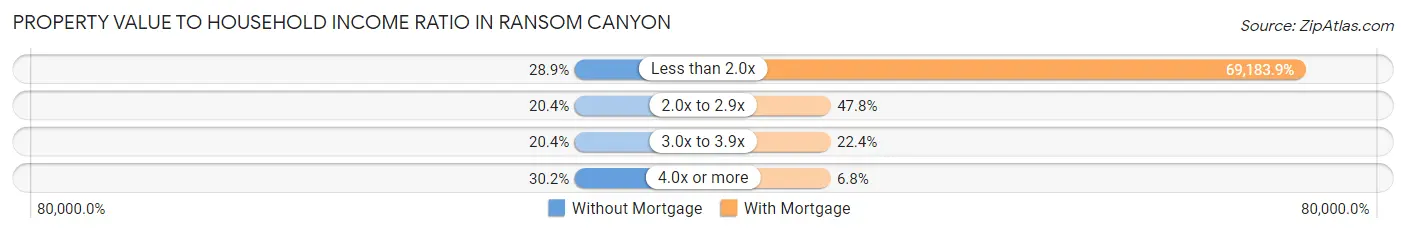
| Value-to-Income Ratio | Without Mortgage | With Mortgage |
| Less than 2.0x | 68 (28.9%) | 141,827 (69,183.9%) |
| 2.0x to 2.9x | 48 (20.4%) | 98 (47.8%) |
| 3.0x to 3.9x | 48 (20.4%) | 46 (22.4%) |
| 4.0x or more | 71 (30.2%) | 14 (6.8%) |
| Total | 235 (100.0%) | 205 (100.0%) |
Real Estate Taxes by Mortgage Status in Ransom Canyon
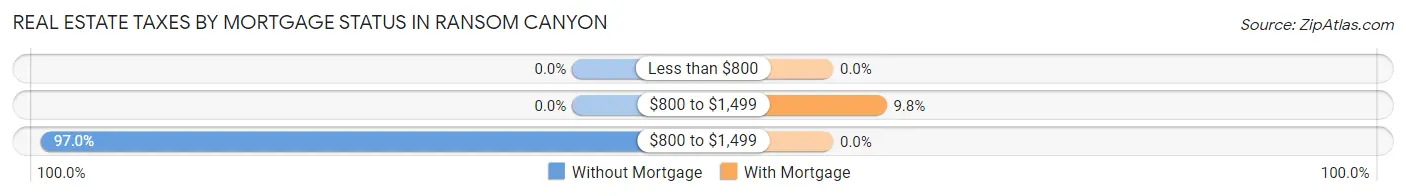
| Property Taxes | Without Mortgage | With Mortgage |
| Less than $800 | 0 (0.0%) | 0 (0.0%) |
| $800 to $1,499 | 0 (0.0%) | 20 (9.8%) |
| $800 to $1,499 | 228 (97.0%) | 0 (0.0%) |
| Total | 235 (100.0%) | 205 (100.0%) |
Health & Disability in Ransom Canyon
Health Insurance Coverage by Age in Ransom Canyon
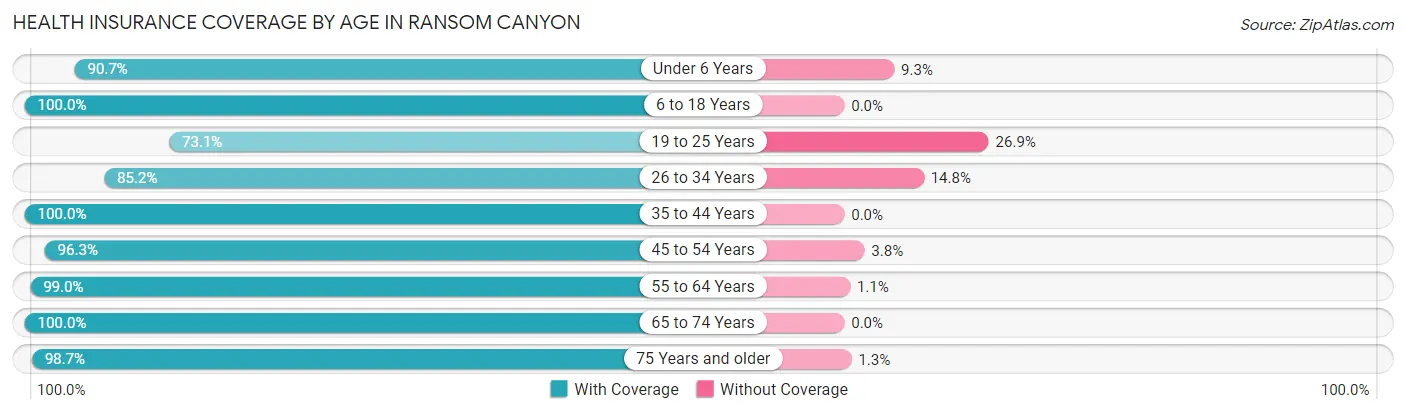
| Age Bracket | With Coverage | Without Coverage |
| Under 6 Years | 39 (90.7%) | 4 (9.3%) |
| 6 to 18 Years | 137 (100.0%) | 0 (0.0%) |
| 19 to 25 Years | 57 (73.1%) | 21 (26.9%) |
| 26 to 34 Years | 23 (85.2%) | 4 (14.8%) |
| 35 to 44 Years | 101 (100.0%) | 0 (0.0%) |
| 45 to 54 Years | 154 (96.3%) | 6 (3.7%) |
| 55 to 64 Years | 188 (99.0%) | 2 (1.1%) |
| 65 to 74 Years | 187 (100.0%) | 0 (0.0%) |
| 75 Years and older | 148 (98.7%) | 2 (1.3%) |
| Total | 1,034 (96.4%) | 39 (3.6%) |
Health Insurance Coverage by Citizenship Status in Ransom Canyon
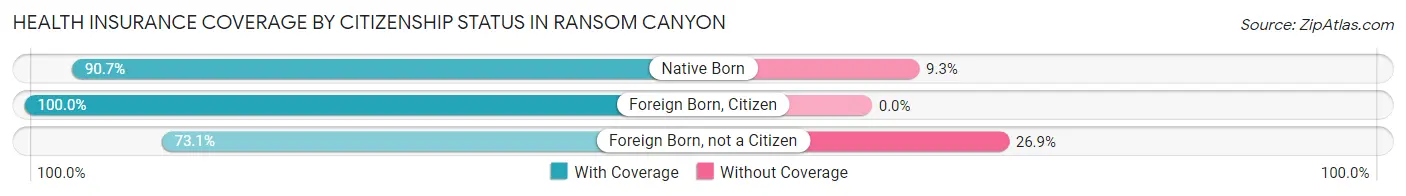
| Citizenship Status | With Coverage | Without Coverage |
| Native Born | 39 (90.7%) | 4 (9.3%) |
| Foreign Born, Citizen | 137 (100.0%) | 0 (0.0%) |
| Foreign Born, not a Citizen | 57 (73.1%) | 21 (26.9%) |
Health Insurance Coverage by Household Income in Ransom Canyon
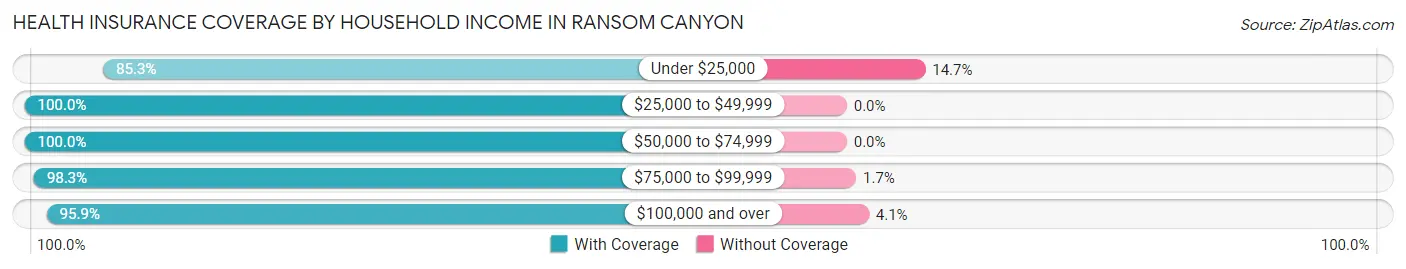
| Household Income | With Coverage | Without Coverage |
| Under $25,000 | 29 (85.3%) | 5 (14.7%) |
| $25,000 to $49,999 | 64 (100.0%) | 0 (0.0%) |
| $50,000 to $74,999 | 85 (100.0%) | 0 (0.0%) |
| $75,000 to $99,999 | 113 (98.3%) | 2 (1.7%) |
| $100,000 and over | 743 (95.9%) | 32 (4.1%) |
Public vs Private Health Insurance Coverage by Age in Ransom Canyon
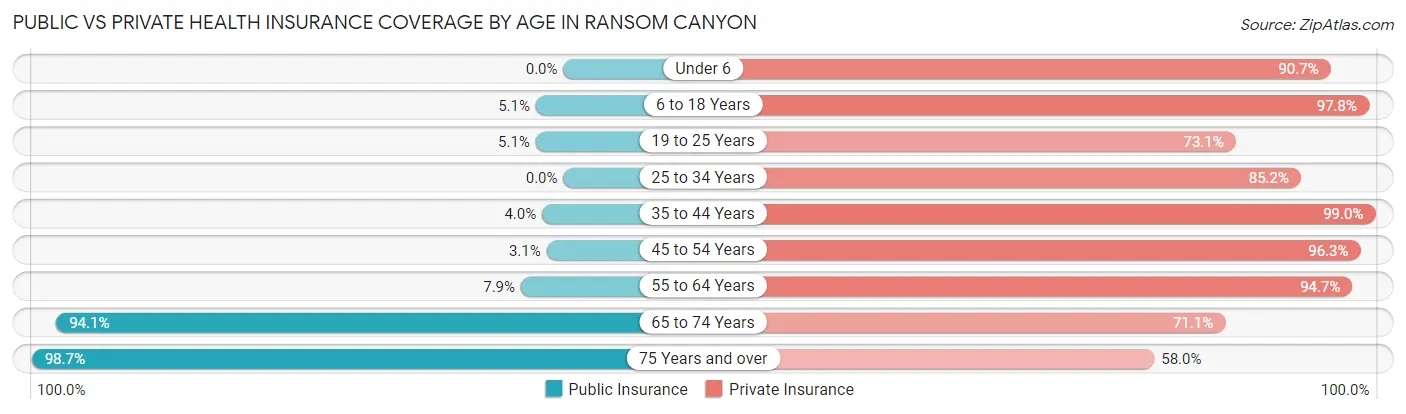
| Age Bracket | Public Insurance | Private Insurance |
| Under 6 | 0 (0.0%) | 39 (90.7%) |
| 6 to 18 Years | 7 (5.1%) | 134 (97.8%) |
| 19 to 25 Years | 4 (5.1%) | 57 (73.1%) |
| 25 to 34 Years | 0 (0.0%) | 23 (85.2%) |
| 35 to 44 Years | 4 (4.0%) | 100 (99.0%) |
| 45 to 54 Years | 5 (3.1%) | 154 (96.3%) |
| 55 to 64 Years | 15 (7.9%) | 180 (94.7%) |
| 65 to 74 Years | 176 (94.1%) | 133 (71.1%) |
| 75 Years and over | 148 (98.7%) | 87 (58.0%) |
| Total | 359 (33.5%) | 907 (84.5%) |
Disability Status by Sex by Age in Ransom Canyon
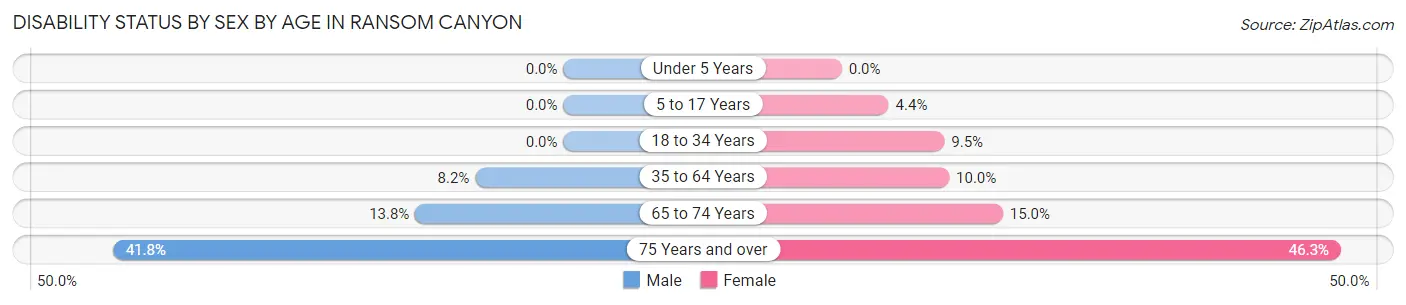
| Age Bracket | Male | Female |
| Under 5 Years | 0 (0.0%) | 0 (0.0%) |
| 5 to 17 Years | 0 (0.0%) | 3 (4.3%) |
| 18 to 34 Years | 0 (0.0%) | 4 (9.5%) |
| 35 to 64 Years | 18 (8.2%) | 23 (10.0%) |
| 65 to 74 Years | 11 (13.8%) | 16 (14.9%) |
| 75 Years and over | 23 (41.8%) | 44 (46.3%) |
Disability Class by Sex by Age in Ransom Canyon
Disability Class: Hearing Difficulty
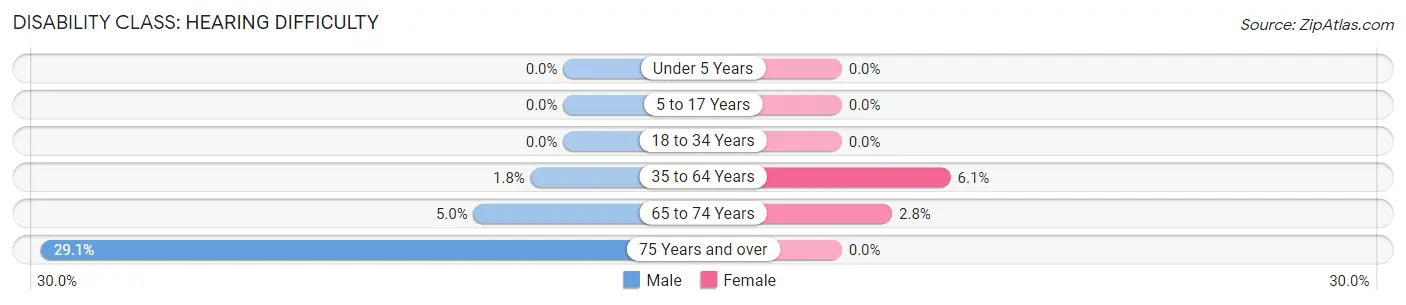
| Age Bracket | Male | Female |
| Under 5 Years | 0 (0.0%) | 0 (0.0%) |
| 5 to 17 Years | 0 (0.0%) | 0 (0.0%) |
| 18 to 34 Years | 0 (0.0%) | 0 (0.0%) |
| 35 to 64 Years | 4 (1.8%) | 14 (6.1%) |
| 65 to 74 Years | 4 (5.0%) | 3 (2.8%) |
| 75 Years and over | 16 (29.1%) | 0 (0.0%) |
Disability Class: Vision Difficulty
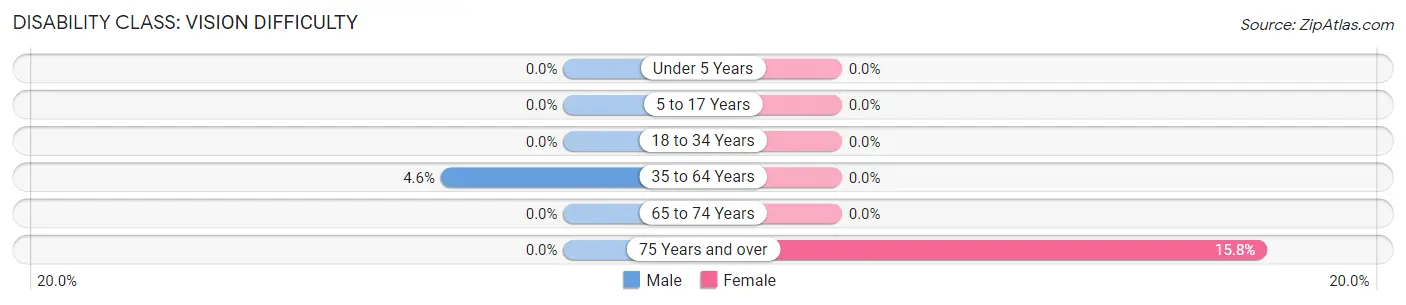
| Age Bracket | Male | Female |
| Under 5 Years | 0 (0.0%) | 0 (0.0%) |
| 5 to 17 Years | 0 (0.0%) | 0 (0.0%) |
| 18 to 34 Years | 0 (0.0%) | 0 (0.0%) |
| 35 to 64 Years | 10 (4.5%) | 0 (0.0%) |
| 65 to 74 Years | 0 (0.0%) | 0 (0.0%) |
| 75 Years and over | 0 (0.0%) | 15 (15.8%) |
Disability Class: Cognitive Difficulty
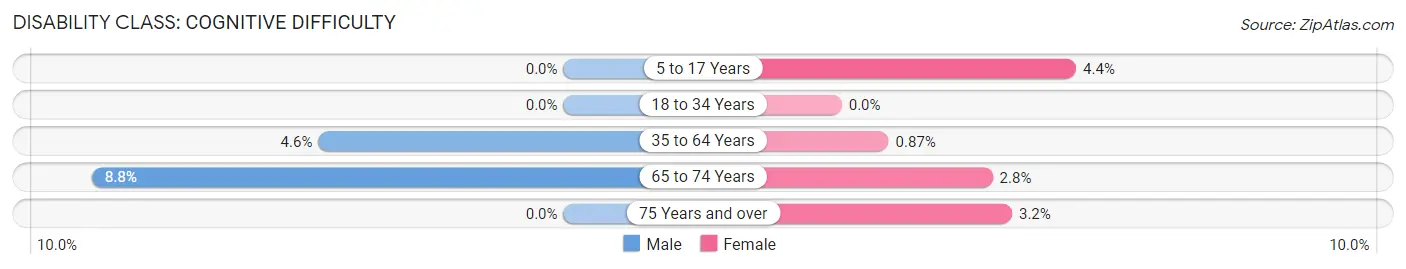
| Age Bracket | Male | Female |
| 5 to 17 Years | 0 (0.0%) | 3 (4.3%) |
| 18 to 34 Years | 0 (0.0%) | 0 (0.0%) |
| 35 to 64 Years | 10 (4.5%) | 2 (0.9%) |
| 65 to 74 Years | 7 (8.7%) | 3 (2.8%) |
| 75 Years and over | 0 (0.0%) | 3 (3.2%) |
Disability Class: Ambulatory Difficulty
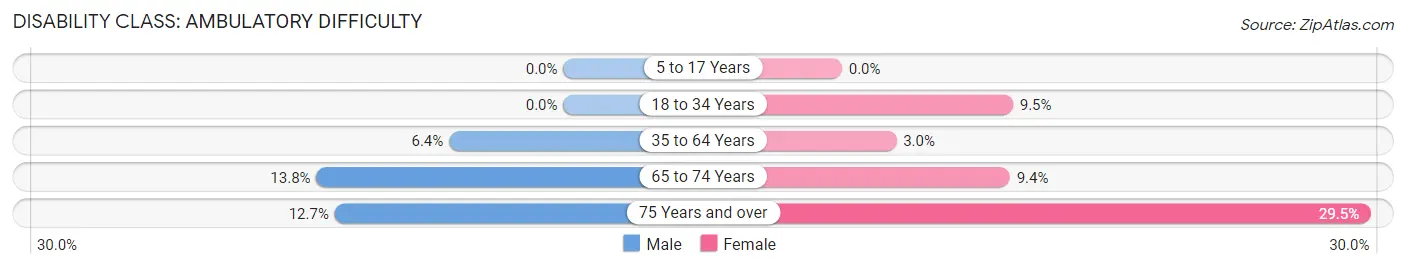
| Age Bracket | Male | Female |
| 5 to 17 Years | 0 (0.0%) | 0 (0.0%) |
| 18 to 34 Years | 0 (0.0%) | 4 (9.5%) |
| 35 to 64 Years | 14 (6.4%) | 7 (3.0%) |
| 65 to 74 Years | 11 (13.8%) | 10 (9.3%) |
| 75 Years and over | 7 (12.7%) | 28 (29.5%) |
Disability Class: Self-Care Difficulty
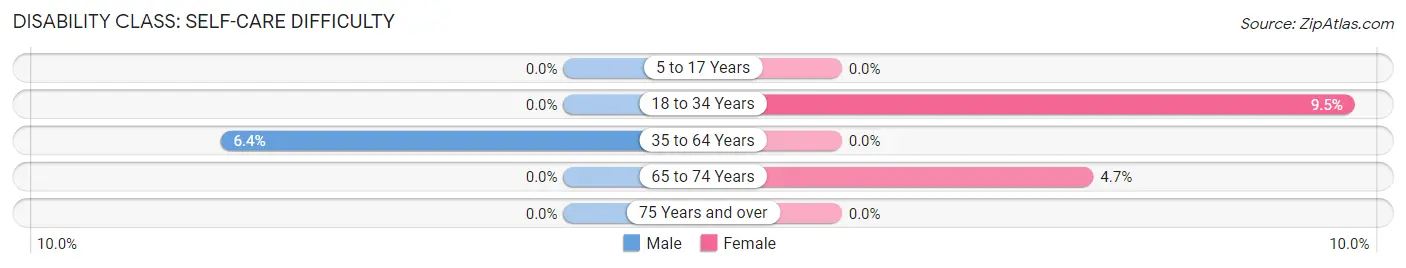
| Age Bracket | Male | Female |
| 5 to 17 Years | 0 (0.0%) | 0 (0.0%) |
| 18 to 34 Years | 0 (0.0%) | 4 (9.5%) |
| 35 to 64 Years | 14 (6.4%) | 0 (0.0%) |
| 65 to 74 Years | 0 (0.0%) | 5 (4.7%) |
| 75 Years and over | 0 (0.0%) | 0 (0.0%) |
Technology Access in Ransom Canyon
Computing Device Access in Ransom Canyon
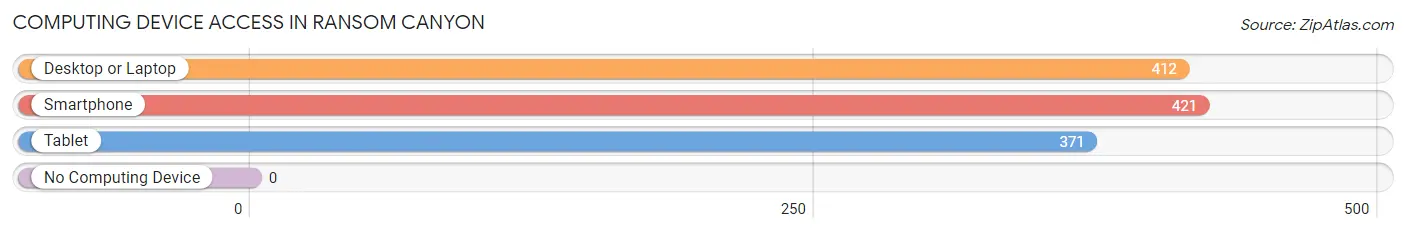
| Device Type | # Households | % Households |
| Desktop or Laptop | 412 | 91.3% |
| Smartphone | 421 | 93.3% |
| Tablet | 371 | 82.3% |
| No Computing Device | 0 | 0.0% |
| Total | 451 | 100.0% |
Internet Access in Ransom Canyon
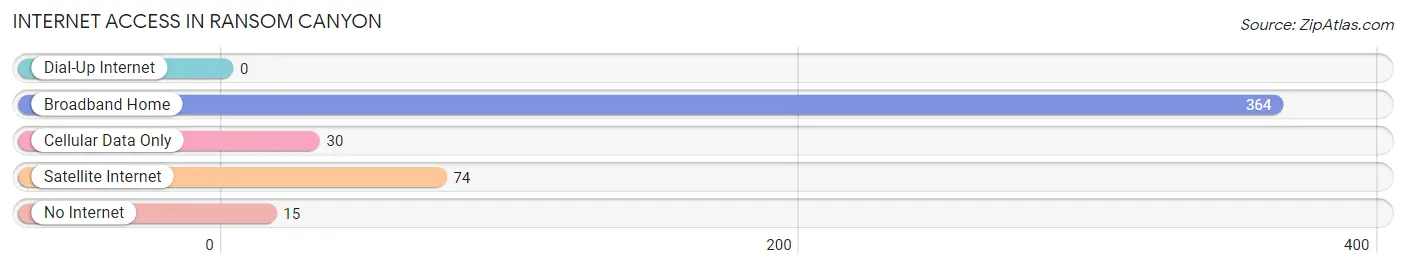
| Internet Type | # Households | % Households |
| Dial-Up Internet | 0 | 0.0% |
| Broadband Home | 364 | 80.7% |
| Cellular Data Only | 30 | 6.7% |
| Satellite Internet | 74 | 16.4% |
| No Internet | 15 | 3.3% |
| Total | 451 | 100.0% |
Ransom Canyon Summary
Ransom Canyon is a small town located in the Texas Panhandle, in Lubbock County, Texas. It is situated on the eastern edge of the Llano Estacado, a large plateau that stretches across the Texas Panhandle. The town was founded in the late 19th century by ranchers and farmers, and has since grown to a population of about 1,200 people.
History
Ransom Canyon was founded in 1891 by ranchers and farmers who were looking for a place to settle and raise their families. The town was named after the nearby Ransom Canyon, which was named after a local rancher, William Ransom. The town was originally a small farming community, but it soon grew to include a post office, a school, a church, and a general store.
In the early 20th century, the town began to experience a period of growth and prosperity. The town was home to several businesses, including a cotton gin, a blacksmith shop, and a livery stable. The town also had a hotel, a bank, and a movie theater.
In the 1950s, the town began to experience a decline in population as people moved away to larger cities. However, in the late 1970s, the town began to experience a resurgence in population as people began to move back to the area.
Geography
Ransom Canyon is located in the Texas Panhandle, in Lubbock County, Texas. It is situated on the eastern edge of the Llano Estacado, a large plateau that stretches across the Texas Panhandle. The town is located about 25 miles east of Lubbock, and about 75 miles west of Amarillo.
The town is situated in a semi-arid climate, with hot summers and mild winters. The average annual temperature is around 68 degrees Fahrenheit, and the average annual precipitation is around 17 inches.
Economy
Ransom Canyon is a small town with a limited economy. The town is home to several small businesses, including a grocery store, a hardware store, and a few restaurants. The town also has a post office, a bank, and a library.
The town is also home to several small manufacturing companies, including a furniture manufacturer and a metal fabrication company. The town is also home to a few oil and gas companies, as well as a few wind farms.
Demographics
As of the 2010 census, the population of Ransom Canyon was 1,200 people. The town is predominantly white, with about 90% of the population being white. The town also has a small Hispanic population, with about 8% of the population being Hispanic. The town also has a small African American population, with about 2% of the population being African American.
The median household income in Ransom Canyon is around $45,000, and the median home value is around $90,000. The town has a low unemployment rate, with only about 4% of the population being unemployed.
Conclusion
Ransom Canyon is a small town located in the Texas Panhandle, in Lubbock County, Texas. The town was founded in the late 19th century by ranchers and farmers, and has since grown to a population of about 1,200 people. The town is predominantly white, with about 90% of the population being white. The town has a limited economy, with several small businesses, manufacturing companies, and oil and gas companies. The median household income in Ransom Canyon is around $45,000, and the median home value is around $90,000. The town has a low unemployment rate, with only about 4% of the population being unemployed.
Common Questions
What is Per Capita Income in Ransom Canyon?
Per Capita income in Ransom Canyon is $65,425.
What is the Median Family Income in Ransom Canyon?
Median Family Income in Ransom Canyon is $140,563.
What is the Median Household income in Ransom Canyon?
Median Household Income in Ransom Canyon is $120,156.
What is Income or Wage Gap in Ransom Canyon?
Income or Wage Gap in Ransom Canyon is 35.7%.
Women in Ransom Canyon earn 64.3 cents for every dollar earned by a man.
What is Inequality or Gini Index in Ransom Canyon?
Inequality or Gini Index in Ransom Canyon is 0.44.
What is the Total Population of Ransom Canyon?
Total Population of Ransom Canyon is 1,073.
What is the Total Male Population of Ransom Canyon?
Total Male Population of Ransom Canyon is 514.
What is the Total Female Population of Ransom Canyon?
Total Female Population of Ransom Canyon is 559.
What is the Ratio of Males per 100 Females in Ransom Canyon?
There are 91.95 Males per 100 Females in Ransom Canyon.
What is the Ratio of Females per 100 Males in Ransom Canyon?
There are 108.75 Females per 100 Males in Ransom Canyon.
What is the Median Population Age in Ransom Canyon?
Median Population Age in Ransom Canyon is 54.4 Years.
What is the Average Family Size in Ransom Canyon
Average Family Size in Ransom Canyon is 2.8 People.
What is the Average Household Size in Ransom Canyon
Average Household Size in Ransom Canyon is 2.4 People.
How Large is the Labor Force in Ransom Canyon?
There are 524 People in the Labor Forcein in Ransom Canyon.
What is the Percentage of People in the Labor Force in Ransom Canyon?
55.3% of People are in the Labor Force in Ransom Canyon.
What is the Unemployment Rate in Ransom Canyon?
Unemployment Rate in Ransom Canyon is 2.3%.