Zip Codes with the Highest Percentage of Population Employed in Administrative & Support Services in Galveston, TX
RELATED REPORTS & OPTIONS
Administrative & Support Services
Galveston
Compare Zip Codes
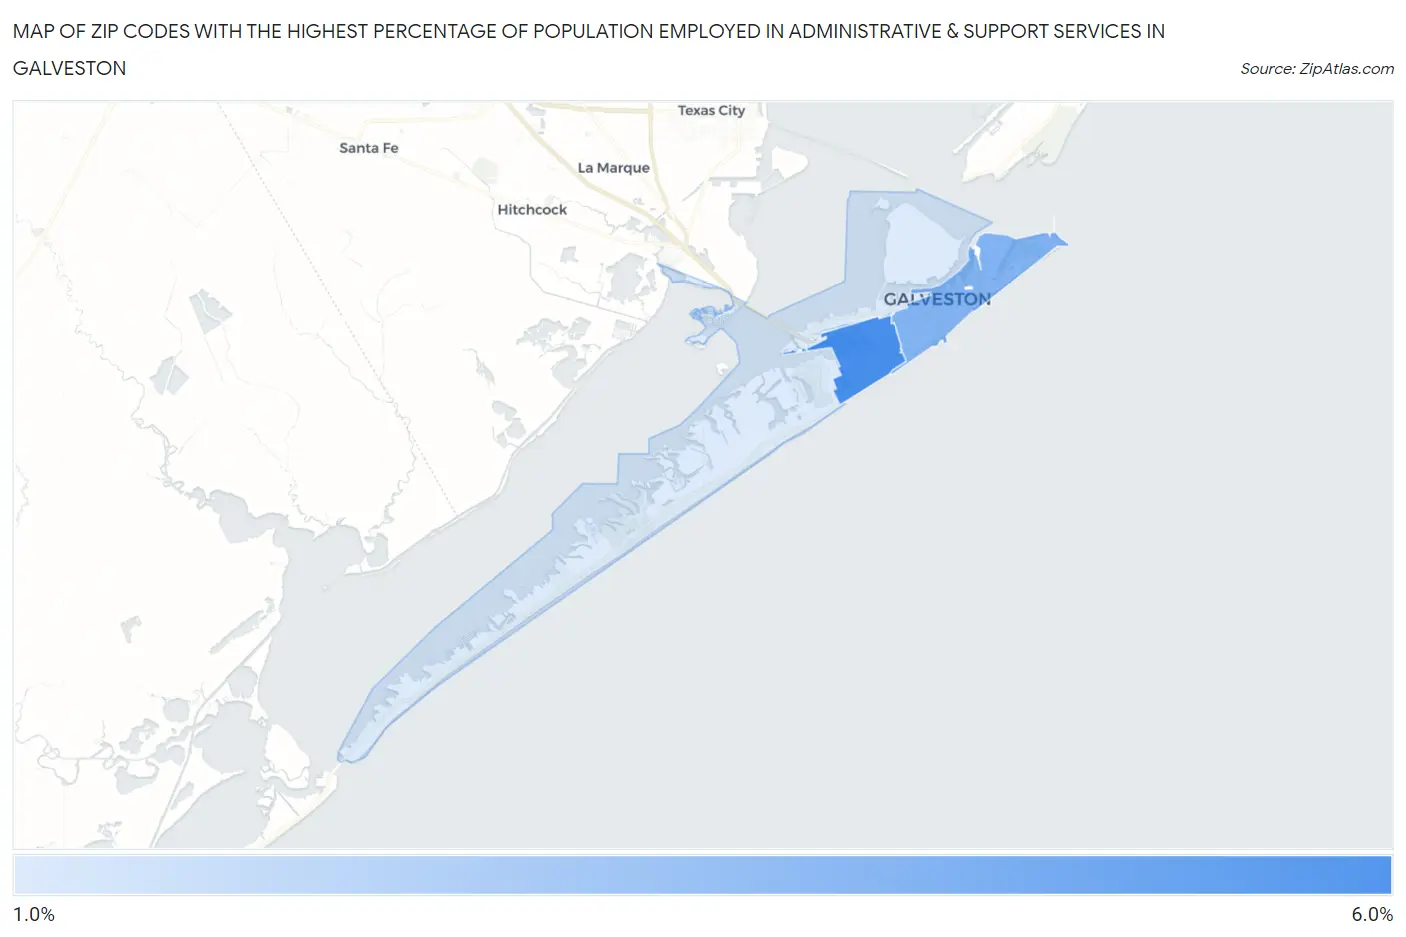
Map of Zip Codes with the Highest Percentage of Population Employed in Administrative & Support Services in Galveston
1.2%
5.4%
Zip Codes with the Highest Percentage of Population Employed in Administrative & Support Services in Galveston, TX
| Zip Code | % Employed | vs State | vs National | |
| 1. | 77551 | 5.4% | 4.4%(+0.992)#441 | 4.1%(+1.26)#6,054 |
| 2. | 77550 | 3.8% | 4.4%(-0.611)#790 | 4.1%(-0.345)#11,510 |
| 3. | 77554 | 1.2% | 4.4%(-3.19)#1,429 | 4.1%(-2.93)#23,779 |
1
Common Questions
What are the Top Zip Codes with the Highest Percentage of Population Employed in Administrative & Support Services in Galveston, TX?
Top Zip Codes with the Highest Percentage of Population Employed in Administrative & Support Services in Galveston, TX are:
What zip code has the Highest Percentage of Population Employed in Administrative & Support Services in Galveston, TX?
77551 has the Highest Percentage of Population Employed in Administrative & Support Services in Galveston, TX with 5.4%.
What is the Percentage of Population Employed in Administrative & Support Services in Galveston, TX?
Percentage of Population Employed in Administrative & Support Services in Galveston is 4.0%.
What is the Percentage of Population Employed in Administrative & Support Services in Texas?
Percentage of Population Employed in Administrative & Support Services in Texas is 4.4%.
What is the Percentage of Population Employed in Administrative & Support Services in the United States?
Percentage of Population Employed in Administrative & Support Services in the United States is 4.1%.