Bolivar Peninsula, TX Map & Demographics
Bolivar Peninsula Map
Bolivar Peninsula Overview
$36,821
PER CAPITA INCOME
$77,222
AVG FAMILY INCOME
$62,207
AVG HOUSEHOLD INCOME
42.0%
WAGE / INCOME GAP [ % ]
58.0¢/ $1
WAGE / INCOME GAP [ $ ]
0.41
INEQUALITY / GINI INDEX
2,626
TOTAL POPULATION
1,160
MALE POPULATION
1,466
FEMALE POPULATION
79.13
MALES / 100 FEMALES
126.38
FEMALES / 100 MALES
64.9
MEDIAN AGE
2.3
AVG FAMILY SIZE
1.8
AVG HOUSEHOLD SIZE
915
LABOR FORCE [ PEOPLE ]
36.7%
PERCENT IN LABOR FORCE
Income in Bolivar Peninsula
Income Overview in Bolivar Peninsula
Per Capita Income in Bolivar Peninsula is $36,821, while median incomes of families and households are $77,222 and $62,207 respectively.
| Characteristic | Number | Measure |
| Per Capita Income | 2,626 | $36,821 |
| Median Family Income | 872 | $77,222 |
| Mean Family Income | 872 | $89,131 |
| Median Household Income | 1,439 | $62,207 |
| Mean Household Income | 1,439 | $68,527 |
| Income Deficit | 872 | $0 |
| Wage / Income Gap (%) | 2,626 | 42.04% |
| Wage / Income Gap ($) | 2,626 | 57.96¢ per $1 |
| Gini / Inequality Index | 2,626 | 0.41 |
Earnings by Sex in Bolivar Peninsula
Average Earnings in Bolivar Peninsula are $35,078, $24,539 for men and $42,337 for women, a difference of 42.0%.
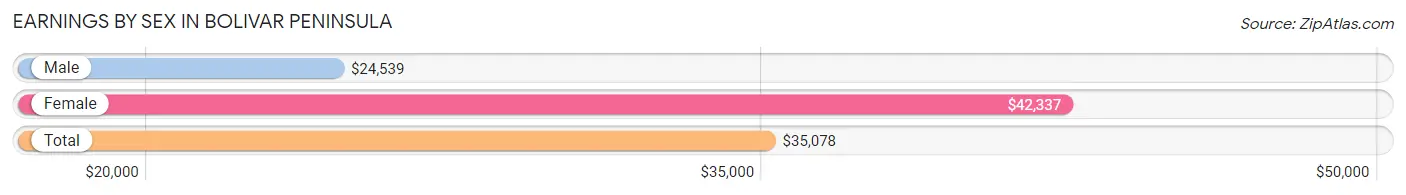
| Sex | Number | Average Earnings |
| Male | 472 (47.1%) | $24,539 |
| Female | 529 (52.8%) | $42,337 |
| Total | 1,001 (100.0%) | $35,078 |
Earnings by Sex by Income Bracket in Bolivar Peninsula
The most common earnings brackets in Bolivar Peninsula are $22,500 to $24,999 for men (114 | 24.1%) and $75,000 to $99,999 for women (119 | 22.5%).
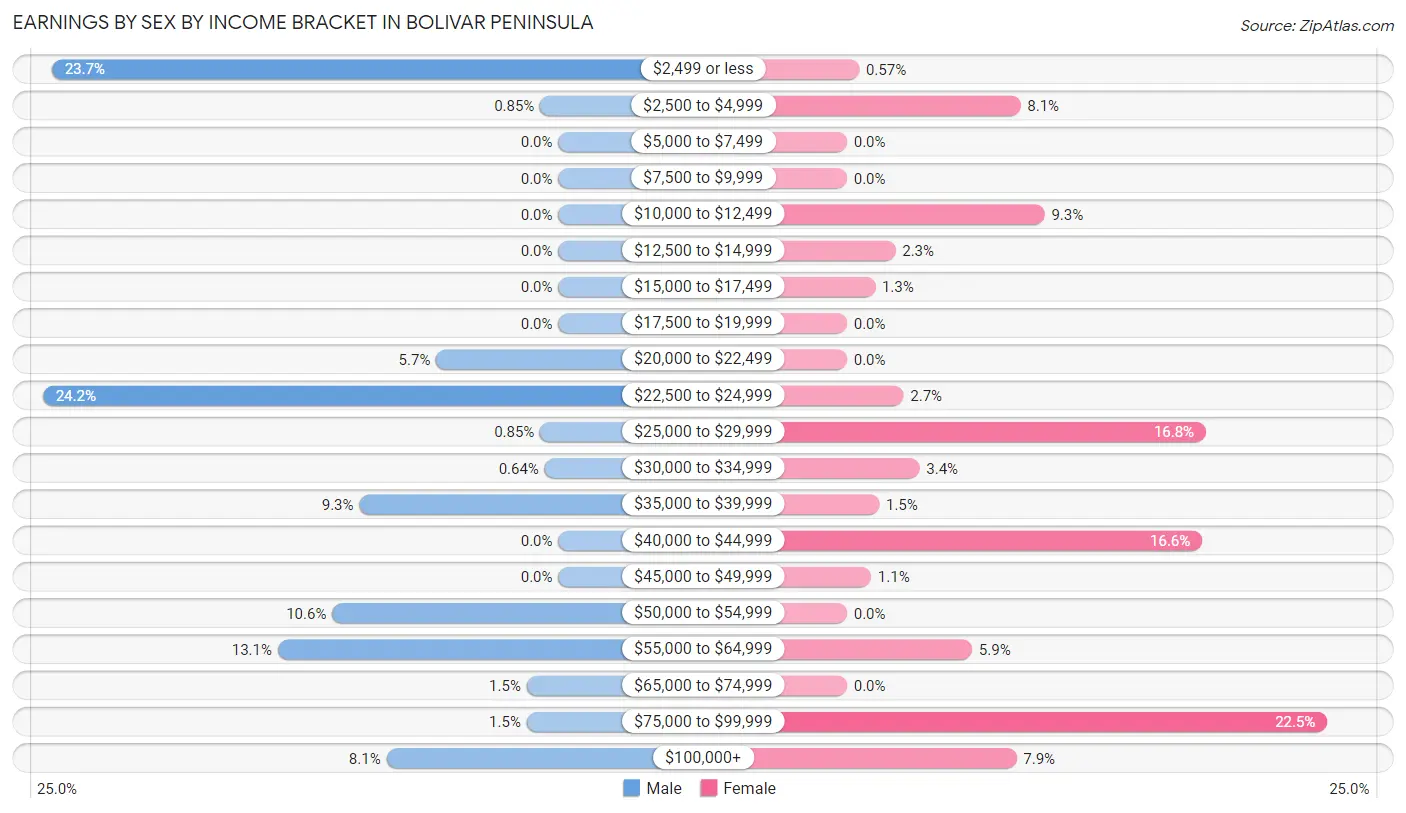
| Income | Male | Female |
| $2,499 or less | 112 (23.7%) | 3 (0.6%) |
| $2,500 to $4,999 | 4 (0.9%) | 43 (8.1%) |
| $5,000 to $7,499 | 0 (0.0%) | 0 (0.0%) |
| $7,500 to $9,999 | 0 (0.0%) | 0 (0.0%) |
| $10,000 to $12,499 | 0 (0.0%) | 49 (9.3%) |
| $12,500 to $14,999 | 0 (0.0%) | 12 (2.3%) |
| $15,000 to $17,499 | 0 (0.0%) | 7 (1.3%) |
| $17,500 to $19,999 | 0 (0.0%) | 0 (0.0%) |
| $20,000 to $22,499 | 27 (5.7%) | 0 (0.0%) |
| $22,500 to $24,999 | 114 (24.1%) | 14 (2.6%) |
| $25,000 to $29,999 | 4 (0.9%) | 89 (16.8%) |
| $30,000 to $34,999 | 3 (0.6%) | 18 (3.4%) |
| $35,000 to $39,999 | 44 (9.3%) | 8 (1.5%) |
| $40,000 to $44,999 | 0 (0.0%) | 88 (16.6%) |
| $45,000 to $49,999 | 0 (0.0%) | 6 (1.1%) |
| $50,000 to $54,999 | 50 (10.6%) | 0 (0.0%) |
| $55,000 to $64,999 | 62 (13.1%) | 31 (5.9%) |
| $65,000 to $74,999 | 7 (1.5%) | 0 (0.0%) |
| $75,000 to $99,999 | 7 (1.5%) | 119 (22.5%) |
| $100,000+ | 38 (8.1%) | 42 (7.9%) |
| Total | 472 (100.0%) | 529 (100.0%) |
Earnings by Sex by Educational Attainment in Bolivar Peninsula
Average earnings in Bolivar Peninsula are $24,518 for men and $42,519 for women, a difference of 42.3%. Men with an educational attainment of high school diploma enjoy the highest average annual earnings of $24,331, while those with high school diploma education earn the least with $24,331. Women with an educational attainment of bachelor's degree earn the most with the average annual earnings of $75,132, while those with college or associate's degree education have the smallest earnings of $29,142.
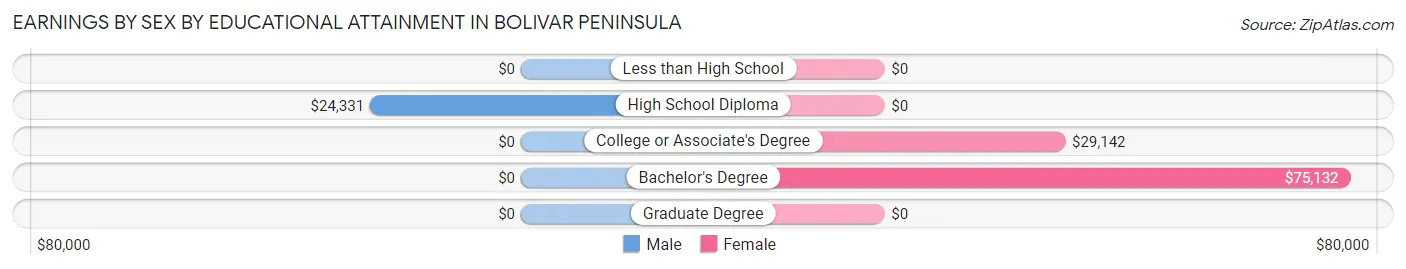
| Educational Attainment | Male Income | Female Income |
| Less than High School | - | - |
| High School Diploma | $24,331 | $0 |
| College or Associate's Degree | - | - |
| Bachelor's Degree | - | - |
| Graduate Degree | - | - |
| Total | $24,518 | $42,519 |
Family Income in Bolivar Peninsula
Family Income Brackets in Bolivar Peninsula
According to the Bolivar Peninsula family income data, there are 206 families falling into the $100,000 to $149,999 income range, which is the most common income bracket and makes up 23.6% of all families.
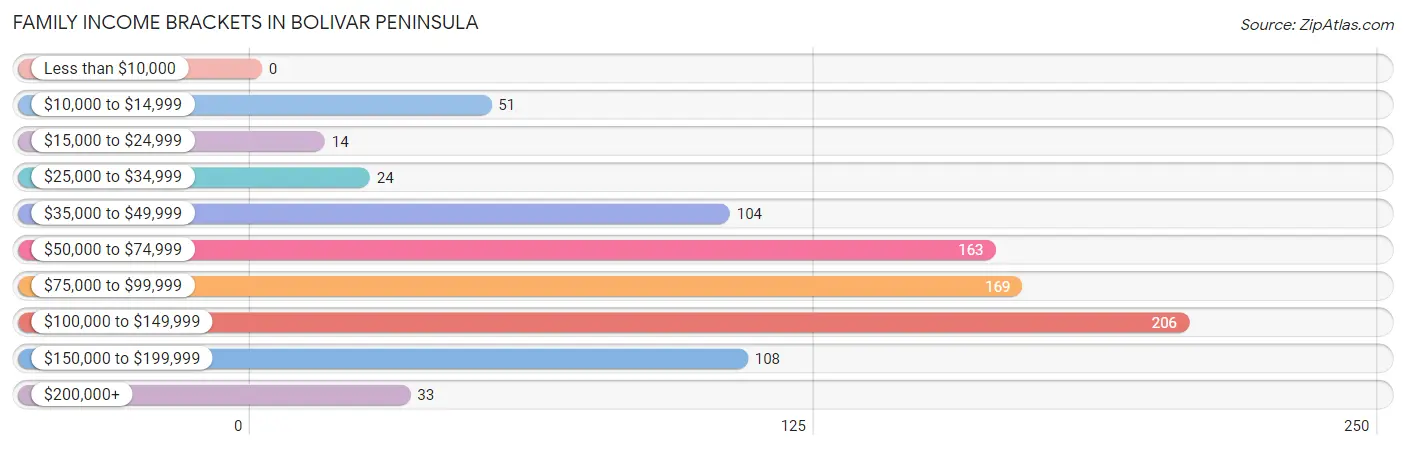
| Income Bracket | # Families | % Families |
| Less than $10,000 | 0 | 0.0% |
| $10,000 to $14,999 | 51 | 5.8% |
| $15,000 to $24,999 | 14 | 1.6% |
| $25,000 to $34,999 | 24 | 2.8% |
| $35,000 to $49,999 | 104 | 11.9% |
| $50,000 to $74,999 | 163 | 18.7% |
| $75,000 to $99,999 | 169 | 19.4% |
| $100,000 to $149,999 | 206 | 23.6% |
| $150,000 to $199,999 | 108 | 12.4% |
| $200,000+ | 33 | 3.8% |
Family Income by Famaliy Size in Bolivar Peninsula
2-person families (731 | 83.8%) account for the highest median family income in Bolivar Peninsula with $76,736 per family, while 2-person families (731 | 83.8%) have the highest median income of $38,368 per family member.
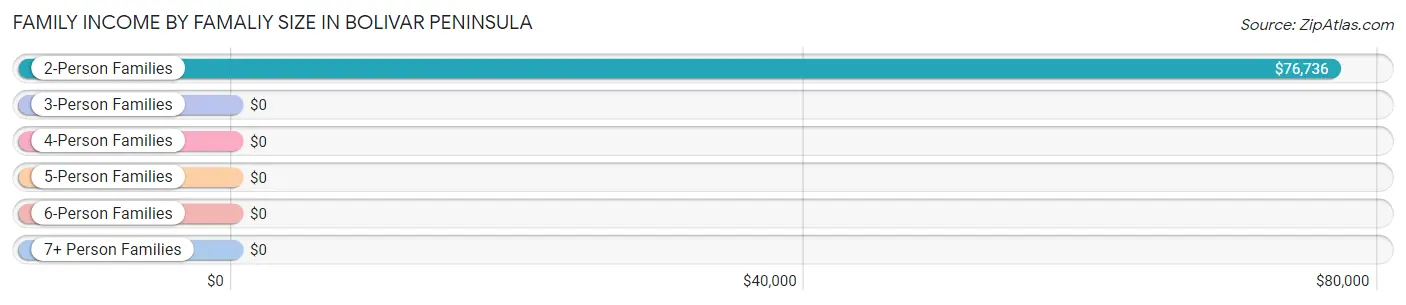
| Income Bracket | # Families | Median Income |
| 2-Person Families | 731 (83.8%) | $76,736 |
| 3-Person Families | 69 (7.9%) | $0 |
| 4-Person Families | 16 (1.8%) | $0 |
| 5-Person Families | 56 (6.4%) | $0 |
| 6-Person Families | 0 (0.0%) | $0 |
| 7+ Person Families | 0 (0.0%) | $0 |
| Total | 872 (100.0%) | $77,222 |
Family Income by Number of Earners in Bolivar Peninsula
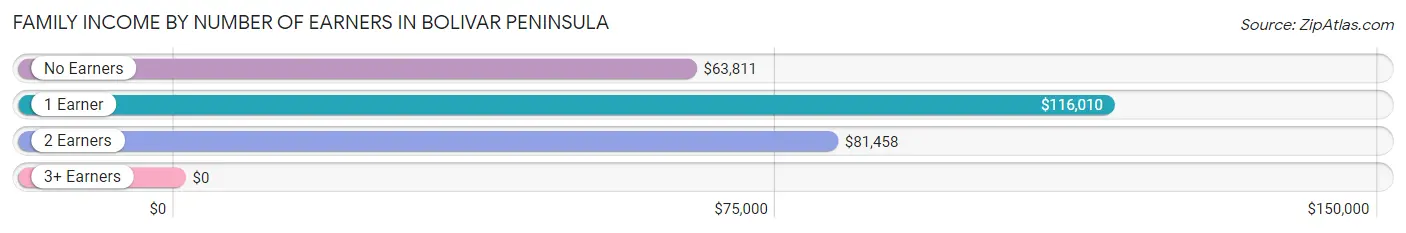
| Number of Earners | # Families | Median Income |
| No Earners | 427 (49.0%) | $63,811 |
| 1 Earner | 173 (19.8%) | $116,010 |
| 2 Earners | 194 (22.3%) | $81,458 |
| 3+ Earners | 78 (8.9%) | $0 |
| Total | 872 (100.0%) | $77,222 |
Household Income in Bolivar Peninsula
Household Income Brackets in Bolivar Peninsula
With 237 households falling in the category, the $50,000 to $74,999 income range is the most frequent in Bolivar Peninsula, accounting for 16.5% of all households. In contrast, only 33 households (2.3%) fall into the $200,000+ income bracket, making it the least populous group.
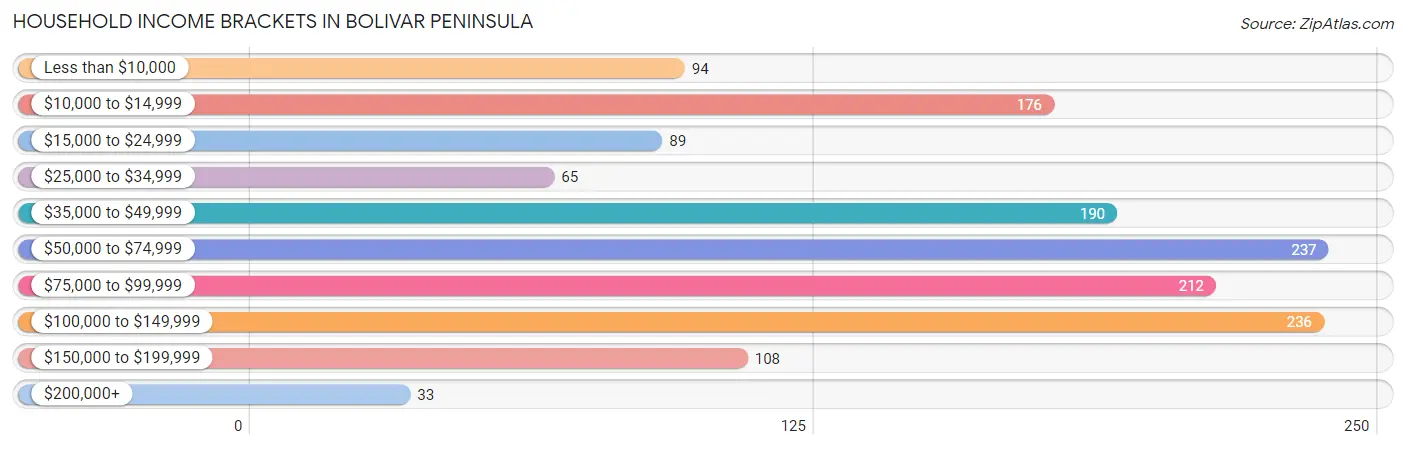
| Income Bracket | # Households | % Households |
| Less than $10,000 | 94 | 6.5% |
| $10,000 to $14,999 | 176 | 12.2% |
| $15,000 to $24,999 | 89 | 6.2% |
| $25,000 to $34,999 | 65 | 4.5% |
| $35,000 to $49,999 | 190 | 13.2% |
| $50,000 to $74,999 | 237 | 16.5% |
| $75,000 to $99,999 | 212 | 14.7% |
| $100,000 to $149,999 | 236 | 16.4% |
| $150,000 to $199,999 | 108 | 7.5% |
| $200,000+ | 33 | 2.3% |
Household Income by Householder Age in Bolivar Peninsula
The median household income in Bolivar Peninsula is $62,207, with the highest median household income of $63,171 found in the 65+ years age bracket for the primary householder. A total of 776 households (53.9%) fall into this category. Meanwhile, the 15 to 24 years age bracket for the primary householder has the lowest median household income of $0, with 4 households (0.3%) in this group.
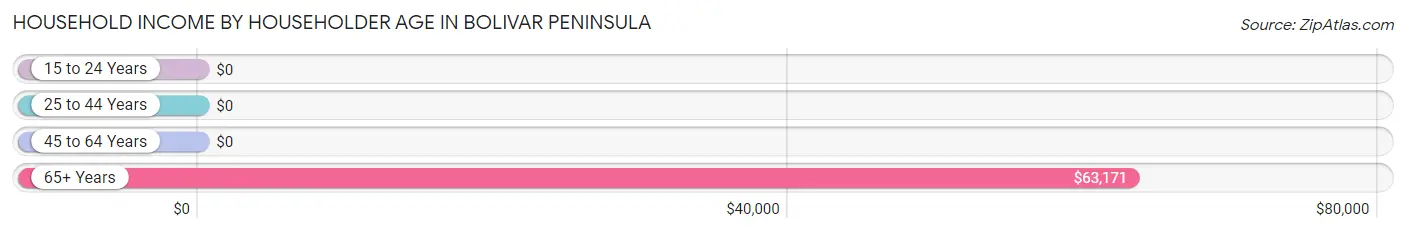
| Income Bracket | # Households | Median Income |
| 15 to 24 Years | 4 (0.3%) | $0 |
| 25 to 44 Years | 70 (4.9%) | $0 |
| 45 to 64 Years | 589 (40.9%) | $0 |
| 65+ Years | 776 (53.9%) | $63,171 |
| Total | 1,439 (100.0%) | $62,207 |
Poverty in Bolivar Peninsula
Income Below Poverty by Sex and Age in Bolivar Peninsula
With 4.5% poverty level for males and 18.6% for females among the residents of Bolivar Peninsula, 55 to 64 year old males and 55 to 64 year old females are the most vulnerable to poverty, with 48 males (14.9%) and 179 females (31.9%) in their respective age groups living below the poverty level.
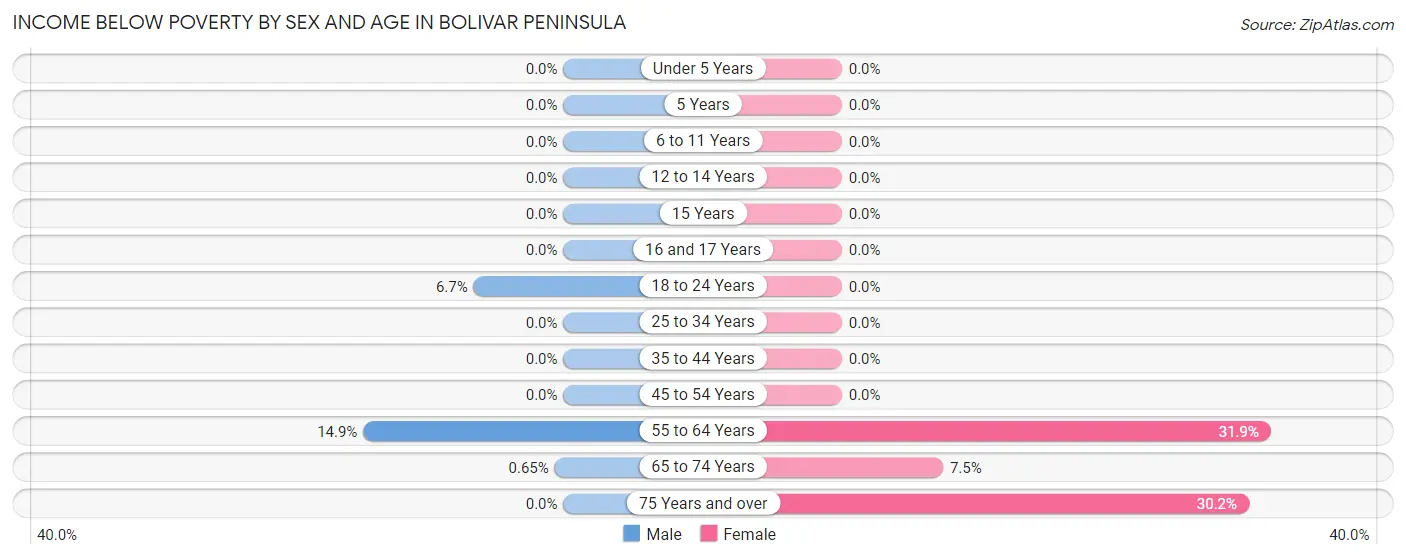
| Age Bracket | Male | Female |
| Under 5 Years | 0 (0.0%) | 0 (0.0%) |
| 5 Years | 0 (0.0%) | 0 (0.0%) |
| 6 to 11 Years | 0 (0.0%) | 0 (0.0%) |
| 12 to 14 Years | 0 (0.0%) | 0 (0.0%) |
| 15 Years | 0 (0.0%) | 0 (0.0%) |
| 16 and 17 Years | 0 (0.0%) | 0 (0.0%) |
| 18 to 24 Years | 1 (6.7%) | 0 (0.0%) |
| 25 to 34 Years | 0 (0.0%) | 0 (0.0%) |
| 35 to 44 Years | 0 (0.0%) | 0 (0.0%) |
| 45 to 54 Years | 0 (0.0%) | 0 (0.0%) |
| 55 to 64 Years | 48 (14.9%) | 179 (31.9%) |
| 65 to 74 Years | 3 (0.6%) | 39 (7.5%) |
| 75 Years and over | 0 (0.0%) | 55 (30.2%) |
| Total | 52 (4.5%) | 273 (18.6%) |
Income Above Poverty by Sex and Age in Bolivar Peninsula
According to the poverty statistics in Bolivar Peninsula, males aged under 5 years and females aged under 5 years are the age groups that are most secure financially, with 100.0% of males and 100.0% of females in these age groups living above the poverty line.
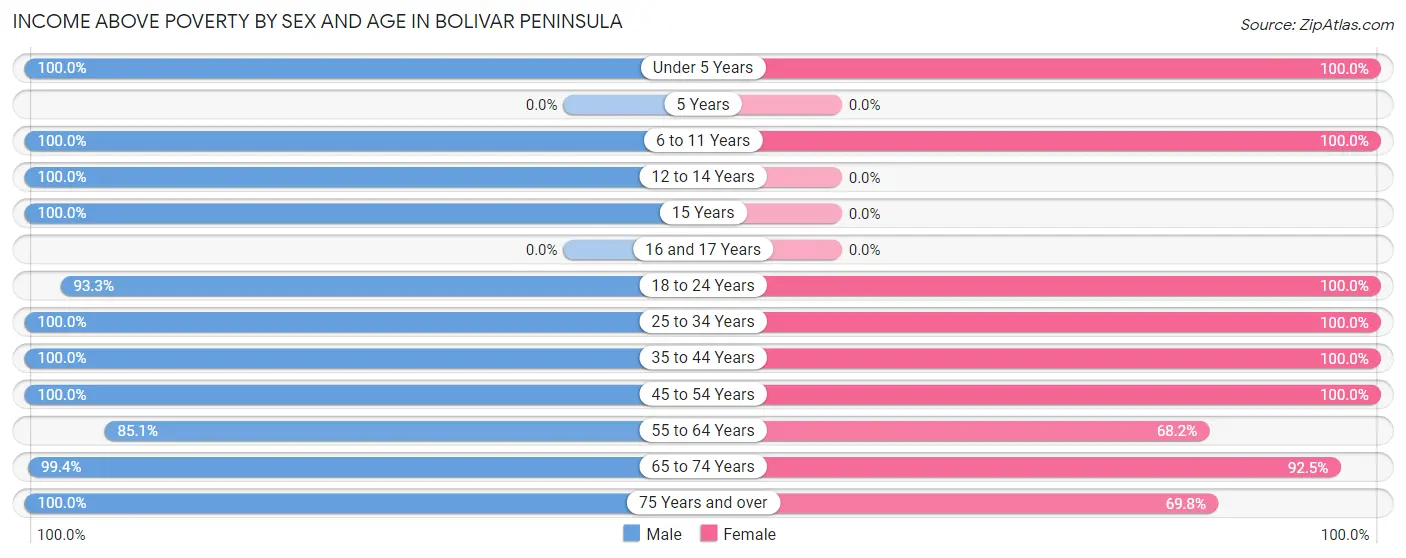
| Age Bracket | Male | Female |
| Under 5 Years | 53 (100.0%) | 7 (100.0%) |
| 5 Years | 0 (0.0%) | 0 (0.0%) |
| 6 to 11 Years | 47 (100.0%) | 4 (100.0%) |
| 12 to 14 Years | 10 (100.0%) | 0 (0.0%) |
| 15 Years | 11 (100.0%) | 0 (0.0%) |
| 16 and 17 Years | 0 (0.0%) | 0 (0.0%) |
| 18 to 24 Years | 14 (93.3%) | 4 (100.0%) |
| 25 to 34 Years | 6 (100.0%) | 110 (100.0%) |
| 35 to 44 Years | 74 (100.0%) | 23 (100.0%) |
| 45 to 54 Years | 20 (100.0%) | 55 (100.0%) |
| 55 to 64 Years | 275 (85.1%) | 383 (68.1%) |
| 65 to 74 Years | 462 (99.4%) | 480 (92.5%) |
| 75 Years and over | 136 (100.0%) | 127 (69.8%) |
| Total | 1,108 (95.5%) | 1,193 (81.4%) |
Income Below Poverty Among Married-Couple Families in Bolivar Peninsula
The poverty statistics for married-couple families in Bolivar Peninsula show that 6.2% or 51 of the total 819 families live below the poverty line. Families with no children have the highest poverty rate of 6.9%, comprising of 51 families. On the other hand, families with 1 or 2 children have the lowest poverty rate of 0.0%, which includes 0 families.
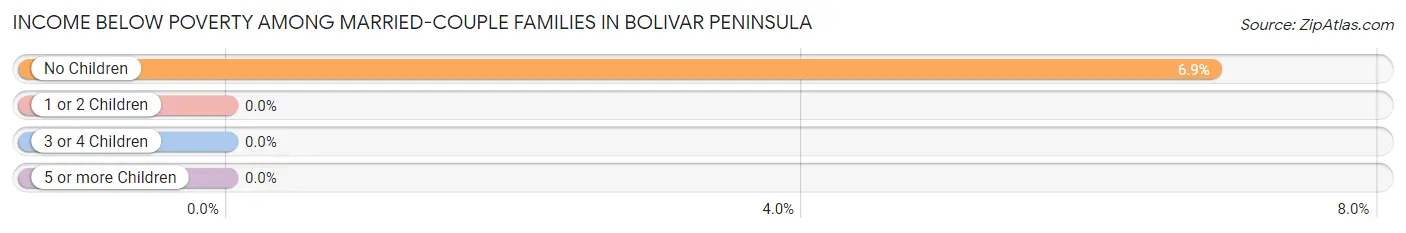
| Children | Above Poverty | Below Poverty |
| No Children | 693 (93.1%) | 51 (6.9%) |
| 1 or 2 Children | 75 (100.0%) | 0 (0.0%) |
| 3 or 4 Children | 0 (0.0%) | 0 (0.0%) |
| 5 or more Children | 0 (0.0%) | 0 (0.0%) |
| Total | 768 (93.8%) | 51 (6.2%) |
Income Below Poverty Among Single-Parent Households in Bolivar Peninsula
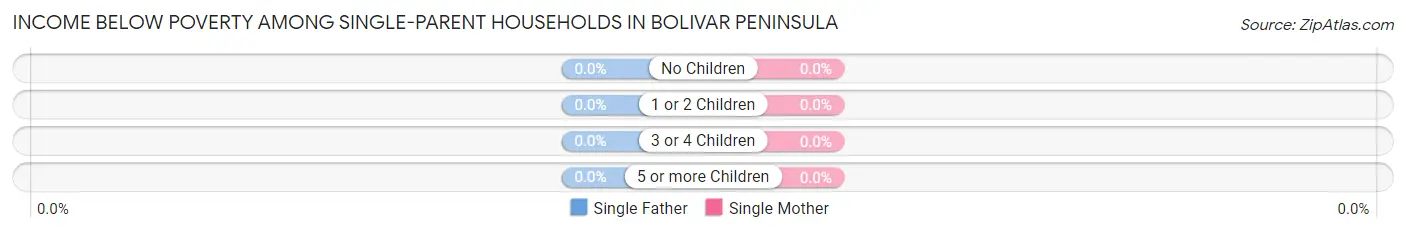
| Children | Single Father | Single Mother |
| No Children | 0 (0.0%) | 0 (0.0%) |
| 1 or 2 Children | 0 (0.0%) | 0 (0.0%) |
| 3 or 4 Children | 0 (0.0%) | 0 (0.0%) |
| 5 or more Children | 0 (0.0%) | 0 (0.0%) |
| Total | 0 (0.0%) | 0 (0.0%) |
Income Below Poverty Among Married-Couple vs Single-Parent Households in Bolivar Peninsula
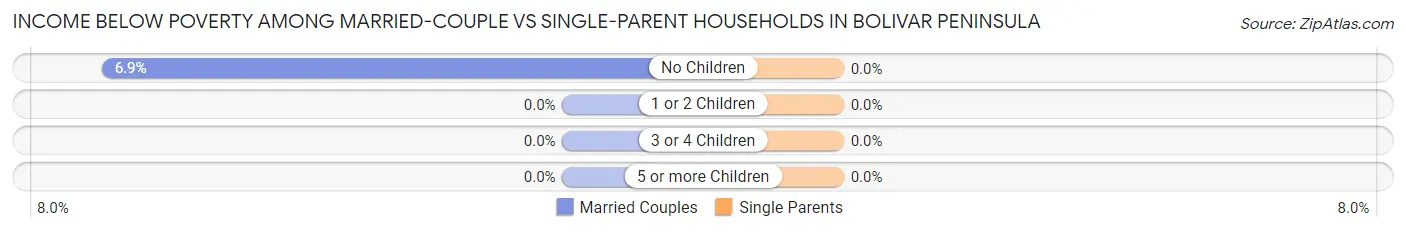
| Children | Married-Couple Families | Single-Parent Households |
| No Children | 51 (6.9%) | 0 (0.0%) |
| 1 or 2 Children | 0 (0.0%) | 0 (0.0%) |
| 3 or 4 Children | 0 (0.0%) | 0 (0.0%) |
| 5 or more Children | 0 (0.0%) | 0 (0.0%) |
| Total | 51 (6.2%) | 0 (0.0%) |
Race in Bolivar Peninsula
The most populous races in Bolivar Peninsula are White / Caucasian (2,392 | 91.1%), Hispanic or Latino (274 | 10.4%), and Black / African American (178 | 6.8%).
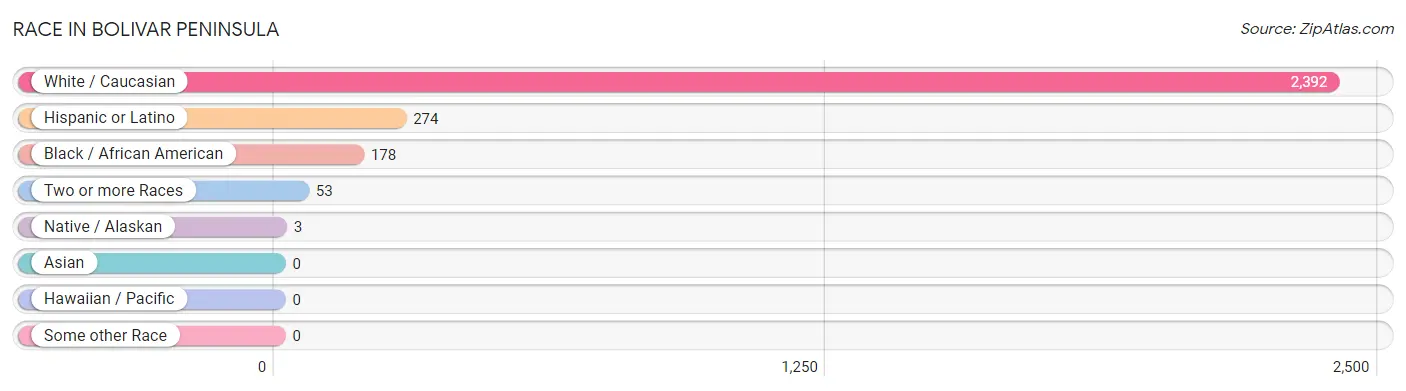
| Race | # Population | % Population |
| Asian | 0 | 0.0% |
| Black / African American | 178 | 6.8% |
| Hawaiian / Pacific | 0 | 0.0% |
| Hispanic or Latino | 274 | 10.4% |
| Native / Alaskan | 3 | 0.1% |
| White / Caucasian | 2,392 | 91.1% |
| Two or more Races | 53 | 2.0% |
| Some other Race | 0 | 0.0% |
| Total | 2,626 | 100.0% |
Ancestry in Bolivar Peninsula
The most populous ancestries reported in Bolivar Peninsula are German (371 | 14.1%), English (350 | 13.3%), French (292 | 11.1%), Mexican (274 | 10.4%), and Irish (261 | 9.9%), together accounting for 59.0% of all Bolivar Peninsula residents.
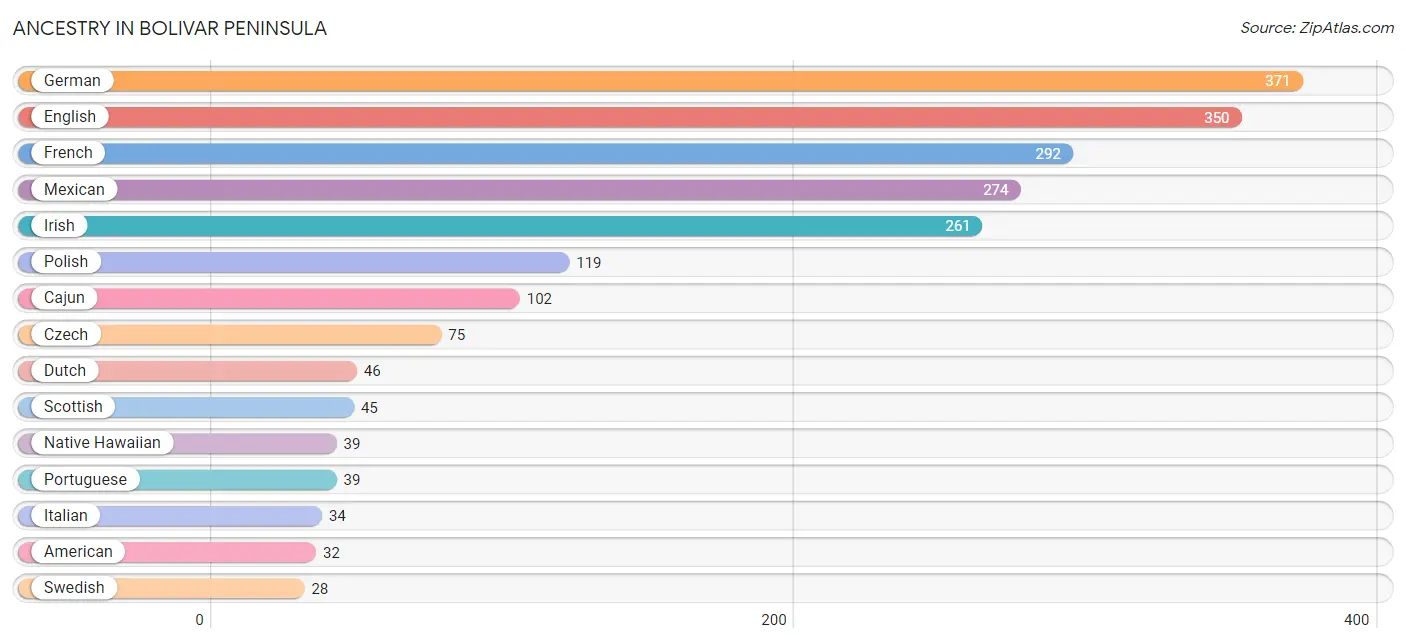
| Ancestry | # Population | % Population |
| American | 32 | 1.2% |
| Cajun | 102 | 3.9% |
| Cherokee | 14 | 0.5% |
| Choctaw | 3 | 0.1% |
| Czech | 75 | 2.9% |
| Dutch | 46 | 1.8% |
| English | 350 | 13.3% |
| French | 292 | 11.1% |
| French Canadian | 3 | 0.1% |
| German | 371 | 14.1% |
| Irish | 261 | 9.9% |
| Italian | 34 | 1.3% |
| Mexican | 274 | 10.4% |
| Native Hawaiian | 39 | 1.5% |
| Polish | 119 | 4.5% |
| Portuguese | 39 | 1.5% |
| Scotch-Irish | 14 | 0.5% |
| Scottish | 45 | 1.7% |
| Swedish | 28 | 1.1% |
| Welsh | 6 | 0.2% | View All 20 Rows |
Immigrants in Bolivar Peninsula
The most numerous immigrant groups reported in Bolivar Peninsula came from Central America (150 | 5.7%), Latin America (150 | 5.7%), Mexico (150 | 5.7%), Europe (73 | 2.8%), and Western Europe (73 | 2.8%), together accounting for 22.7% of all Bolivar Peninsula residents.
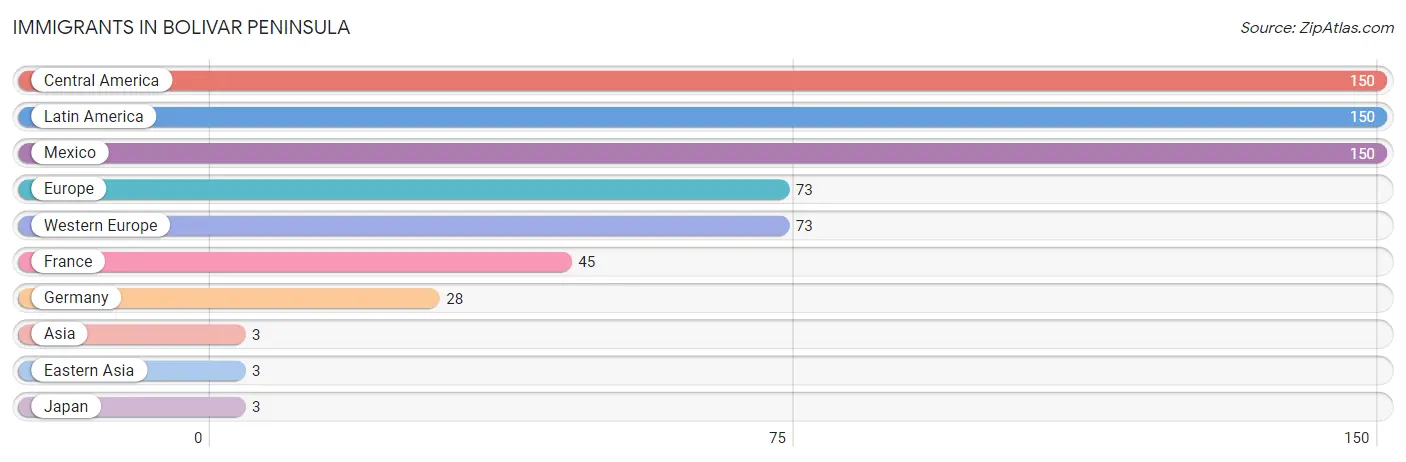
| Immigration Origin | # Population | % Population |
| Asia | 3 | 0.1% |
| Central America | 150 | 5.7% |
| Eastern Asia | 3 | 0.1% |
| Europe | 73 | 2.8% |
| France | 45 | 1.7% |
| Germany | 28 | 1.1% |
| Japan | 3 | 0.1% |
| Latin America | 150 | 5.7% |
| Mexico | 150 | 5.7% |
| Western Europe | 73 | 2.8% | View All 10 Rows |
Sex and Age in Bolivar Peninsula
Sex and Age in Bolivar Peninsula
The most populous age groups in Bolivar Peninsula are 60 to 64 Years (283 | 24.4%) for men and 65 to 69 Years (354 | 24.1%) for women.
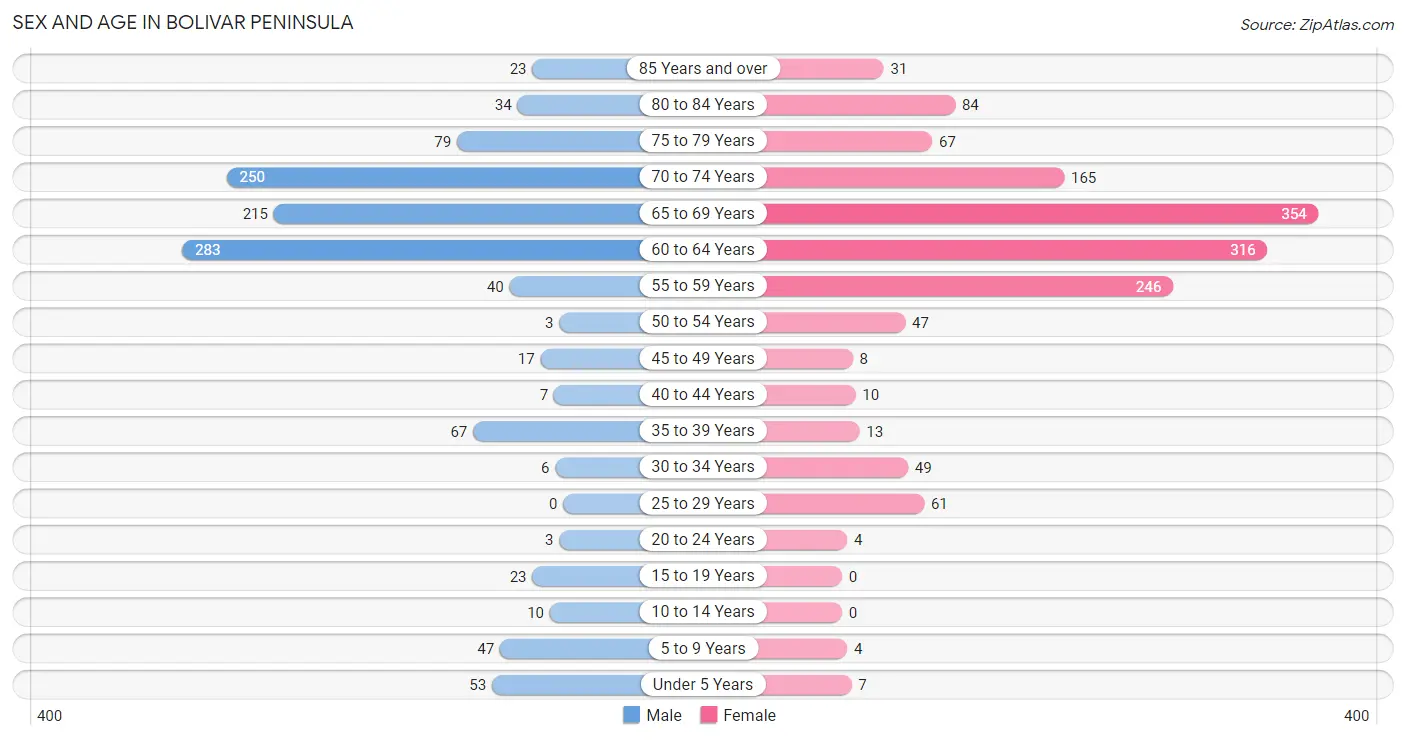
| Age Bracket | Male | Female |
| Under 5 Years | 53 (4.6%) | 7 (0.5%) |
| 5 to 9 Years | 47 (4.1%) | 4 (0.3%) |
| 10 to 14 Years | 10 (0.9%) | 0 (0.0%) |
| 15 to 19 Years | 23 (2.0%) | 0 (0.0%) |
| 20 to 24 Years | 3 (0.3%) | 4 (0.3%) |
| 25 to 29 Years | 0 (0.0%) | 61 (4.2%) |
| 30 to 34 Years | 6 (0.5%) | 49 (3.3%) |
| 35 to 39 Years | 67 (5.8%) | 13 (0.9%) |
| 40 to 44 Years | 7 (0.6%) | 10 (0.7%) |
| 45 to 49 Years | 17 (1.5%) | 8 (0.5%) |
| 50 to 54 Years | 3 (0.3%) | 47 (3.2%) |
| 55 to 59 Years | 40 (3.5%) | 246 (16.8%) |
| 60 to 64 Years | 283 (24.4%) | 316 (21.6%) |
| 65 to 69 Years | 215 (18.5%) | 354 (24.1%) |
| 70 to 74 Years | 250 (21.5%) | 165 (11.3%) |
| 75 to 79 Years | 79 (6.8%) | 67 (4.6%) |
| 80 to 84 Years | 34 (2.9%) | 84 (5.7%) |
| 85 Years and over | 23 (2.0%) | 31 (2.1%) |
| Total | 1,160 (100.0%) | 1,466 (100.0%) |
Families and Households in Bolivar Peninsula
Median Family Size in Bolivar Peninsula
The median family size in Bolivar Peninsula is 2.28 persons per family, with married-couple families (819 | 93.9%) accounting for the largest median family size of 2.3 persons per family. On the other hand, single male/father families (9 | 1.0%) represent the smallest median family size with 1.78 persons per family.
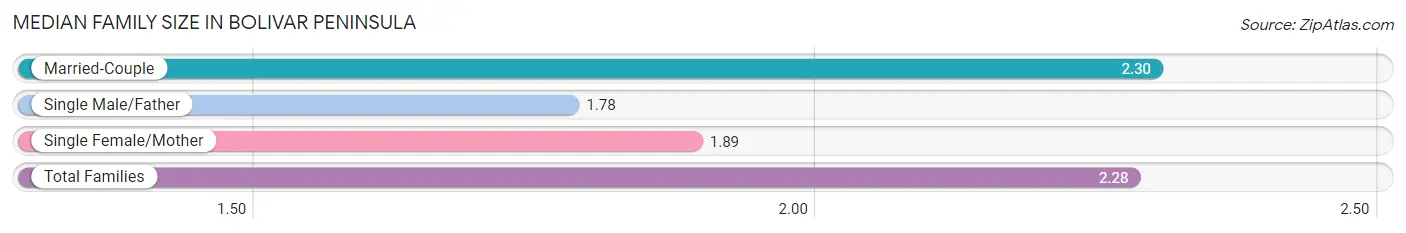
| Family Type | # Families | Family Size |
| Married-Couple | 819 (93.9%) | 2.30 |
| Single Male/Father | 9 (1.0%) | 1.78 |
| Single Female/Mother | 44 (5.1%) | 1.89 |
| Total Families | 872 (100.0%) | 2.28 |
Median Household Size in Bolivar Peninsula
The median household size in Bolivar Peninsula is 1.82 persons per household, with married-couple households (819 | 56.9%) accounting for the largest median household size of 2.3 persons per household. non-family households (567 | 39.4%) represent the smallest median household size with 1.13 persons per household.
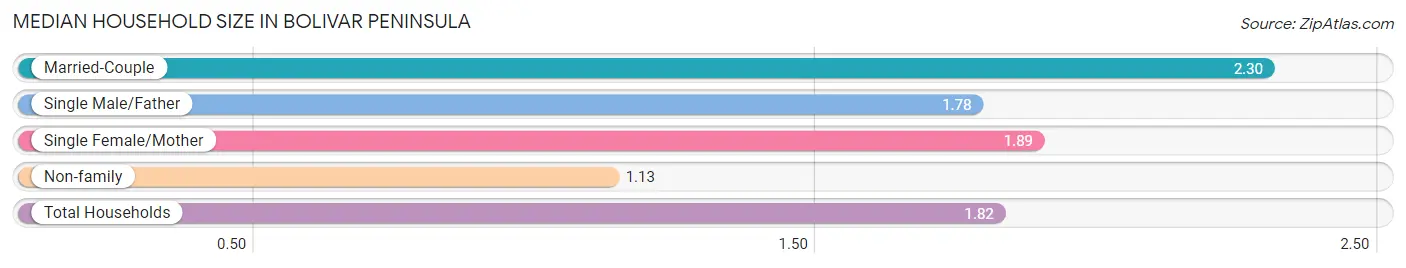
| Household Type | # Households | Household Size |
| Married-Couple | 819 (56.9%) | 2.30 |
| Single Male/Father | 9 (0.6%) | 1.78 |
| Single Female/Mother | 44 (3.1%) | 1.89 |
| Non-family | 567 (39.4%) | 1.13 |
| Total Households | 1,439 (100.0%) | 1.82 |
Household Size by Marriage Status in Bolivar Peninsula
Out of a total of 1,439 households in Bolivar Peninsula, 872 (60.6%) are family households, while 567 (39.4%) are nonfamily households. The most numerous type of family households are 2-person households, comprising 731, and the most common type of nonfamily households are 1-person households, comprising 491.
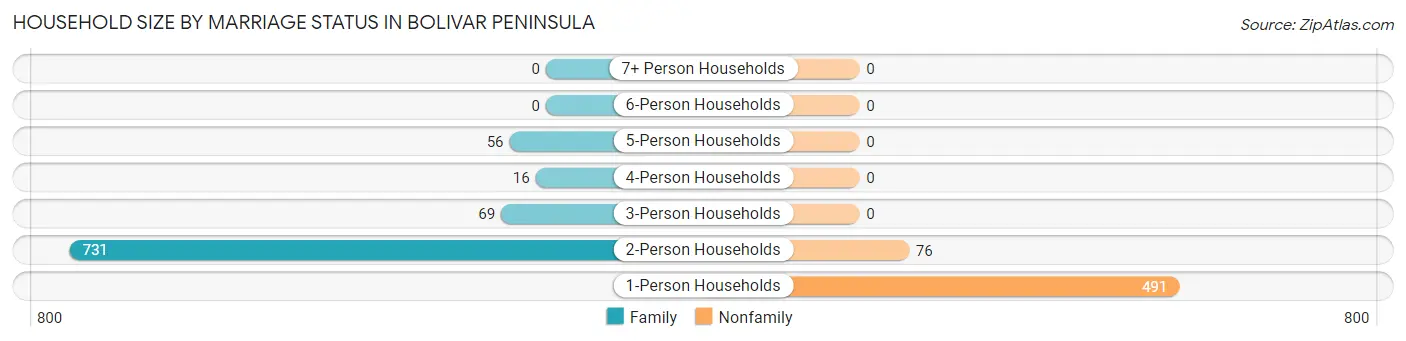
| Household Size | Family Households | Nonfamily Households |
| 1-Person Households | - | 491 (34.1%) |
| 2-Person Households | 731 (50.8%) | 76 (5.3%) |
| 3-Person Households | 69 (4.8%) | 0 (0.0%) |
| 4-Person Households | 16 (1.1%) | 0 (0.0%) |
| 5-Person Households | 56 (3.9%) | 0 (0.0%) |
| 6-Person Households | 0 (0.0%) | 0 (0.0%) |
| 7+ Person Households | 0 (0.0%) | 0 (0.0%) |
| Total | 872 (60.6%) | 567 (39.4%) |
Female Fertility in Bolivar Peninsula
Fertility by Age in Bolivar Peninsula
| Age Bracket | Women with Births | Births / 1,000 Women |
| 15 to 19 years | 0 (0.0%) | 0.0 |
| 20 to 34 years | 0 (0.0%) | 0.0 |
| 35 to 50 years | 0 (0.0%) | 0.0 |
| Total | 0 (0.0%) | 0.0 |
Fertility by Age by Marriage Status in Bolivar Peninsula
| Age Bracket | Married | Unmarried |
| 15 to 19 years | 0 (0.0%) | 0 (0.0%) |
| 20 to 34 years | 0 (0.0%) | 0 (0.0%) |
| 35 to 50 years | 0 (0.0%) | 0 (0.0%) |
| Total | 0 (0.0%) | 0 (0.0%) |
Fertility by Education in Bolivar Peninsula
| Educational Attainment | Women with Births | Births / 1,000 Women |
| Less than High School | 0 (0.0%) | 0.0 |
| High School Diploma | 0 (0.0%) | 0.0 |
| College or Associate's Degree | 0 (0.0%) | 0.0 |
| Bachelor's Degree | 0 (0.0%) | 0.0 |
| Graduate Degree | 0 (0.0%) | 0.0 |
| Total | 0 (0.0%) | 0.0 |
Fertility by Education by Marriage Status in Bolivar Peninsula
| Educational Attainment | Married | Unmarried |
| Less than High School | 0 (0.0%) | 0 (0.0%) |
| High School Diploma | 0 (0.0%) | 0 (0.0%) |
| College or Associate's Degree | 0 (0.0%) | 0 (0.0%) |
| Bachelor's Degree | 0 (0.0%) | 0 (0.0%) |
| Graduate Degree | 0 (0.0%) | 0 (0.0%) |
| Total | 0 (0.0%) | 0 (0.0%) |
Employment Characteristics in Bolivar Peninsula
Employment by Class of Employer in Bolivar Peninsula
Among the 915 employed individuals in Bolivar Peninsula, private company employees (460 | 50.3%), self-employed (not incorporated) (201 | 22.0%), and state government employees (105 | 11.5%) make up the most common classes of employment.
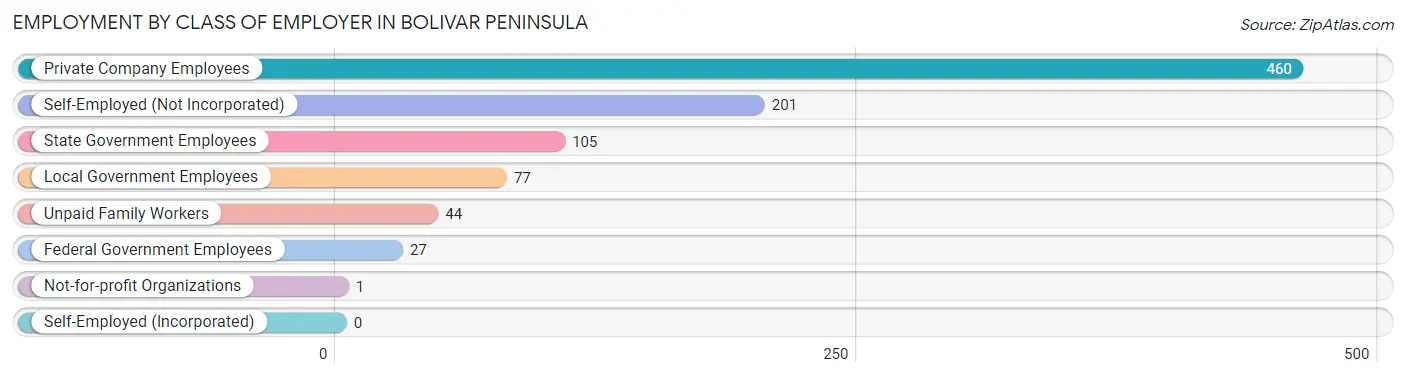
| Employer Class | # Employees | % Employees |
| Private Company Employees | 460 | 50.3% |
| Self-Employed (Incorporated) | 0 | 0.0% |
| Self-Employed (Not Incorporated) | 201 | 22.0% |
| Not-for-profit Organizations | 1 | 0.1% |
| Local Government Employees | 77 | 8.4% |
| State Government Employees | 105 | 11.5% |
| Federal Government Employees | 27 | 2.9% |
| Unpaid Family Workers | 44 | 4.8% |
| Total | 915 | 100.0% |
Employment Status by Age in Bolivar Peninsula
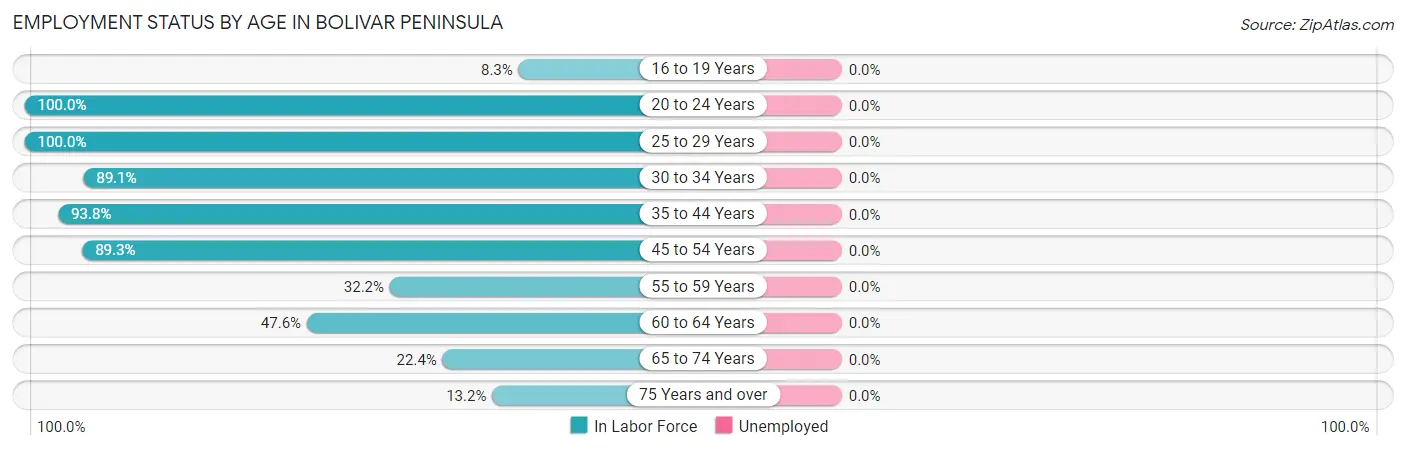
| Age Bracket | In Labor Force | Unemployed |
| 16 to 19 Years | 1 (8.3%) | 0 (0.0%) |
| 20 to 24 Years | 7 (100.0%) | 0 (0.0%) |
| 25 to 29 Years | 61 (100.0%) | 0 (0.0%) |
| 30 to 34 Years | 49 (89.1%) | 0 (0.0%) |
| 35 to 44 Years | 91 (93.8%) | 0 (0.0%) |
| 45 to 54 Years | 67 (89.3%) | 0 (0.0%) |
| 55 to 59 Years | 92 (32.2%) | 0 (0.0%) |
| 60 to 64 Years | 285 (47.6%) | 0 (0.0%) |
| 65 to 74 Years | 220 (22.4%) | 0 (0.0%) |
| 75 Years and over | 42 (13.2%) | 0 (0.0%) |
| Total | 915 (36.7%) | 0 (0.0%) |
Employment Status by Educational Attainment in Bolivar Peninsula
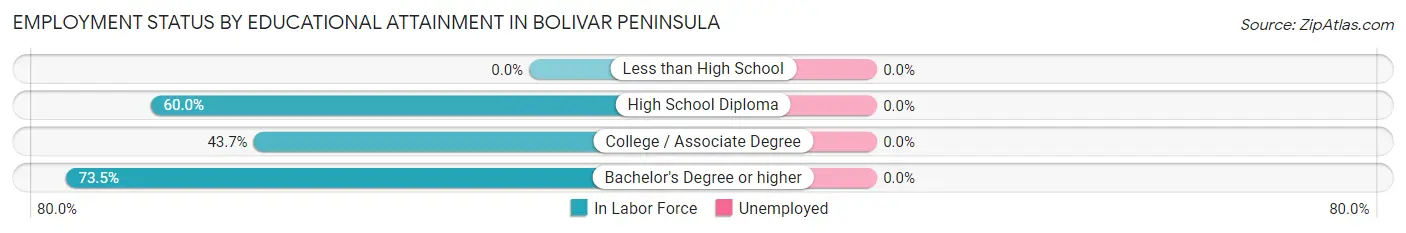
| Educational Attainment | In Labor Force | Unemployed |
| Less than High School | 0 (0.0%) | 0 (0.0%) |
| High School Diploma | 388 (60.0%) | 0 (0.0%) |
| College / Associate Degree | 146 (43.7%) | 0 (0.0%) |
| Bachelor's Degree or higher | 111 (73.5%) | 0 (0.0%) |
| Total | 645 (55.0%) | 0 (0.0%) |
Employment Occupations by Sex in Bolivar Peninsula
Management, Business, Science and Arts Occupations
The most common Management, Business, Science and Arts occupations in Bolivar Peninsula are Management (140 | 15.3%), Community & Social Service (118 | 12.9%), Health Diagnosing & Treating (102 | 11.2%), Health Technologists (98 | 10.7%), and Education Instruction & Library (90 | 9.8%).
Management, Business, Science and Arts Occupations by Sex
Within the Management, Business, Science and Arts occupations in Bolivar Peninsula, the most male-oriented occupations are Management (64.3%), Arts, Media & Entertainment (29.4%), and Community & Social Service (4.2%), while the most female-oriented occupations are Business & Financial (100.0%), Computers, Engineering & Science (100.0%), and Computers & Mathematics (100.0%).
| Occupation | Male | Female |
| Management | 90 (64.3%) | 50 (35.7%) |
| Business & Financial | 0 (0.0%) | 15 (100.0%) |
| Computers, Engineering & Science | 0 (0.0%) | 30 (100.0%) |
| Computers & Mathematics | 0 (0.0%) | 30 (100.0%) |
| Architecture & Engineering | 0 (0.0%) | 0 (0.0%) |
| Life, Physical & Social Science | 0 (0.0%) | 0 (0.0%) |
| Community & Social Service | 5 (4.2%) | 113 (95.8%) |
| Education, Arts & Media | 0 (0.0%) | 0 (0.0%) |
| Legal Services & Support | 0 (0.0%) | 11 (100.0%) |
| Education Instruction & Library | 0 (0.0%) | 90 (100.0%) |
| Arts, Media & Entertainment | 5 (29.4%) | 12 (70.6%) |
| Health Diagnosing & Treating | 4 (3.9%) | 98 (96.1%) |
| Health Technologists | 0 (0.0%) | 98 (100.0%) |
| Total (Category) | 99 (24.4%) | 306 (75.6%) |
| Total (Overall) | 380 (41.5%) | 535 (58.5%) |
Services Occupations
The most common Services occupations in Bolivar Peninsula are Food Preparation & Serving (103 | 11.3%), Cleaning & Maintenance (75 | 8.2%), Security & Protection (56 | 6.1%), Law Enforcement (56 | 6.1%), and Healthcare Support (39 | 4.3%).
Services Occupations by Sex
Within the Services occupations in Bolivar Peninsula, the most male-oriented occupations are Cleaning & Maintenance (96.0%), Security & Protection (48.2%), and Law Enforcement (48.2%), while the most female-oriented occupations are Healthcare Support (100.0%), Food Preparation & Serving (99.0%), and Security & Protection (51.8%).
| Occupation | Male | Female |
| Healthcare Support | 0 (0.0%) | 39 (100.0%) |
| Security & Protection | 27 (48.2%) | 29 (51.8%) |
| Firefighting & Prevention | 0 (0.0%) | 0 (0.0%) |
| Law Enforcement | 27 (48.2%) | 29 (51.8%) |
| Food Preparation & Serving | 1 (1.0%) | 102 (99.0%) |
| Cleaning & Maintenance | 72 (96.0%) | 3 (4.0%) |
| Personal Care & Service | 0 (0.0%) | 0 (0.0%) |
| Total (Category) | 100 (36.6%) | 173 (63.4%) |
| Total (Overall) | 380 (41.5%) | 535 (58.5%) |
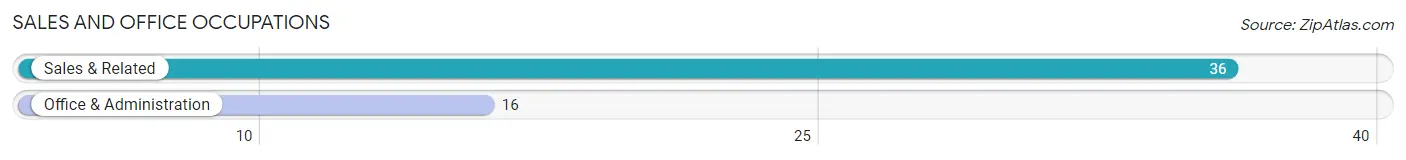
Sales and Office Occupations
The most common Sales and Office occupations in Bolivar Peninsula are Sales & Related (36 | 3.9%), and Office & Administration (16 | 1.8%).
Sales and Office Occupations by Sex

| Occupation | Male | Female |
| Sales & Related | 7 (19.4%) | 29 (80.6%) |
| Office & Administration | 12 (75.0%) | 4 (25.0%) |
| Total (Category) | 19 (36.5%) | 33 (63.5%) |
| Total (Overall) | 380 (41.5%) | 535 (58.5%) |
Natural Resources, Construction and Maintenance Occupations
The most common Natural Resources, Construction and Maintenance occupations in Bolivar Peninsula are Construction & Extraction (91 | 10.0%), and Installation, Maintenance & Repair (29 | 3.2%).
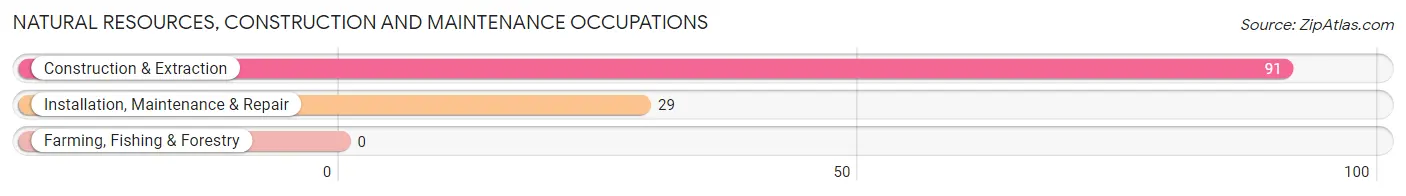
Natural Resources, Construction and Maintenance Occupations by Sex
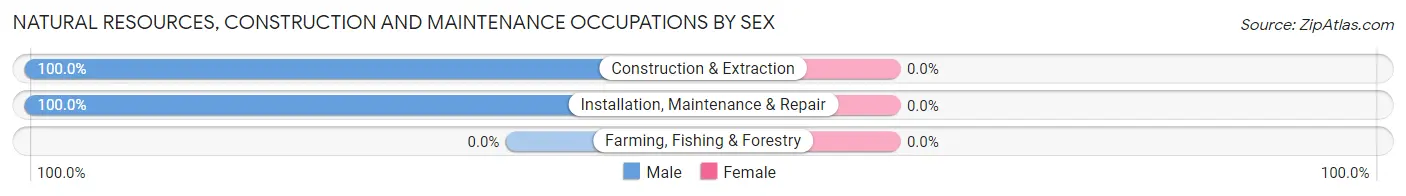
| Occupation | Male | Female |
| Farming, Fishing & Forestry | 0 (0.0%) | 0 (0.0%) |
| Construction & Extraction | 91 (100.0%) | 0 (0.0%) |
| Installation, Maintenance & Repair | 29 (100.0%) | 0 (0.0%) |
| Total (Category) | 120 (100.0%) | 0 (0.0%) |
| Total (Overall) | 380 (41.5%) | 535 (58.5%) |
Production, Transportation and Moving Occupations
The most common Production, Transportation and Moving occupations in Bolivar Peninsula are Material Moving (39 | 4.3%), Transportation (23 | 2.5%), and Production (3 | 0.3%).
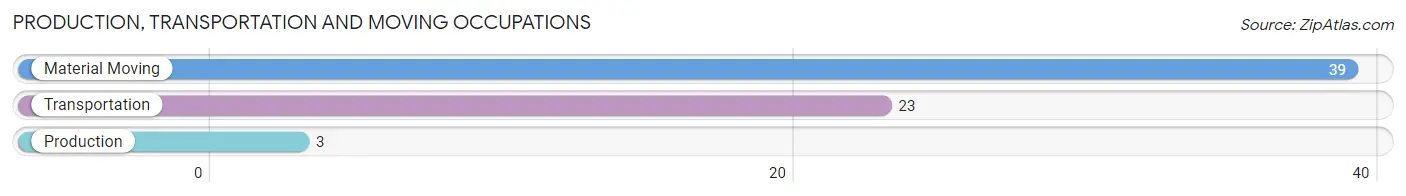
Production, Transportation and Moving Occupations by Sex
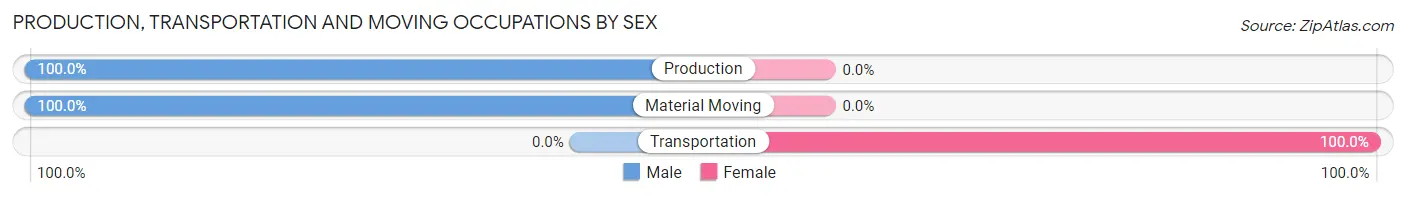
| Occupation | Male | Female |
| Production | 3 (100.0%) | 0 (0.0%) |
| Transportation | 0 (0.0%) | 23 (100.0%) |
| Material Moving | 39 (100.0%) | 0 (0.0%) |
| Total (Category) | 42 (64.6%) | 23 (35.4%) |
| Total (Overall) | 380 (41.5%) | 535 (58.5%) |
Employment Industries by Sex in Bolivar Peninsula
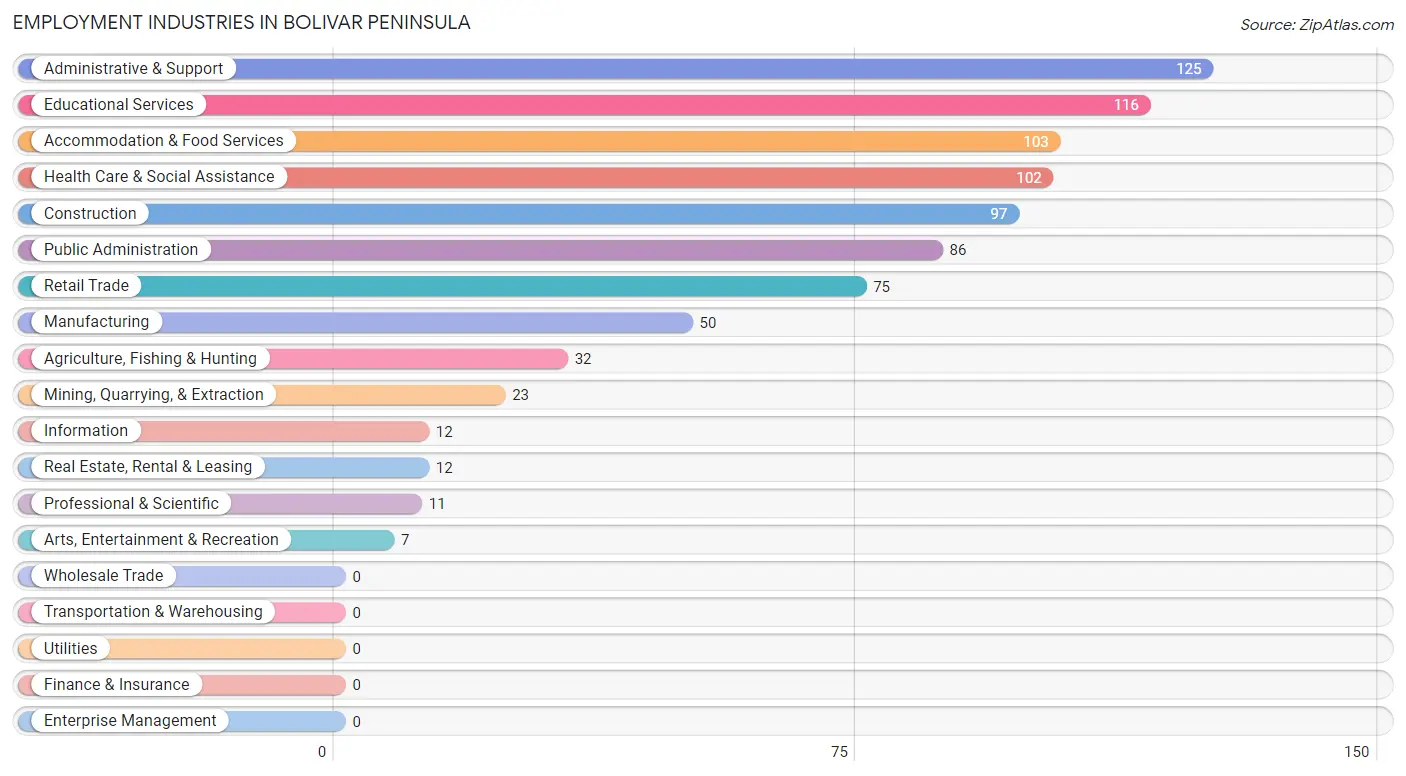
Employment Industries in Bolivar Peninsula
The major employment industries in Bolivar Peninsula include Administrative & Support (125 | 13.7%), Educational Services (116 | 12.7%), Accommodation & Food Services (103 | 11.3%), Health Care & Social Assistance (102 | 11.2%), and Construction (97 | 10.6%).
Employment Industries by Sex in Bolivar Peninsula
The Bolivar Peninsula industries that see more men than women are Agriculture, Fishing & Hunting (100.0%), Mining, Quarrying, & Extraction (100.0%), and Construction (100.0%), whereas the industries that tend to have a higher number of women are Information (100.0%), Health Care & Social Assistance (100.0%), and Accommodation & Food Services (99.0%).
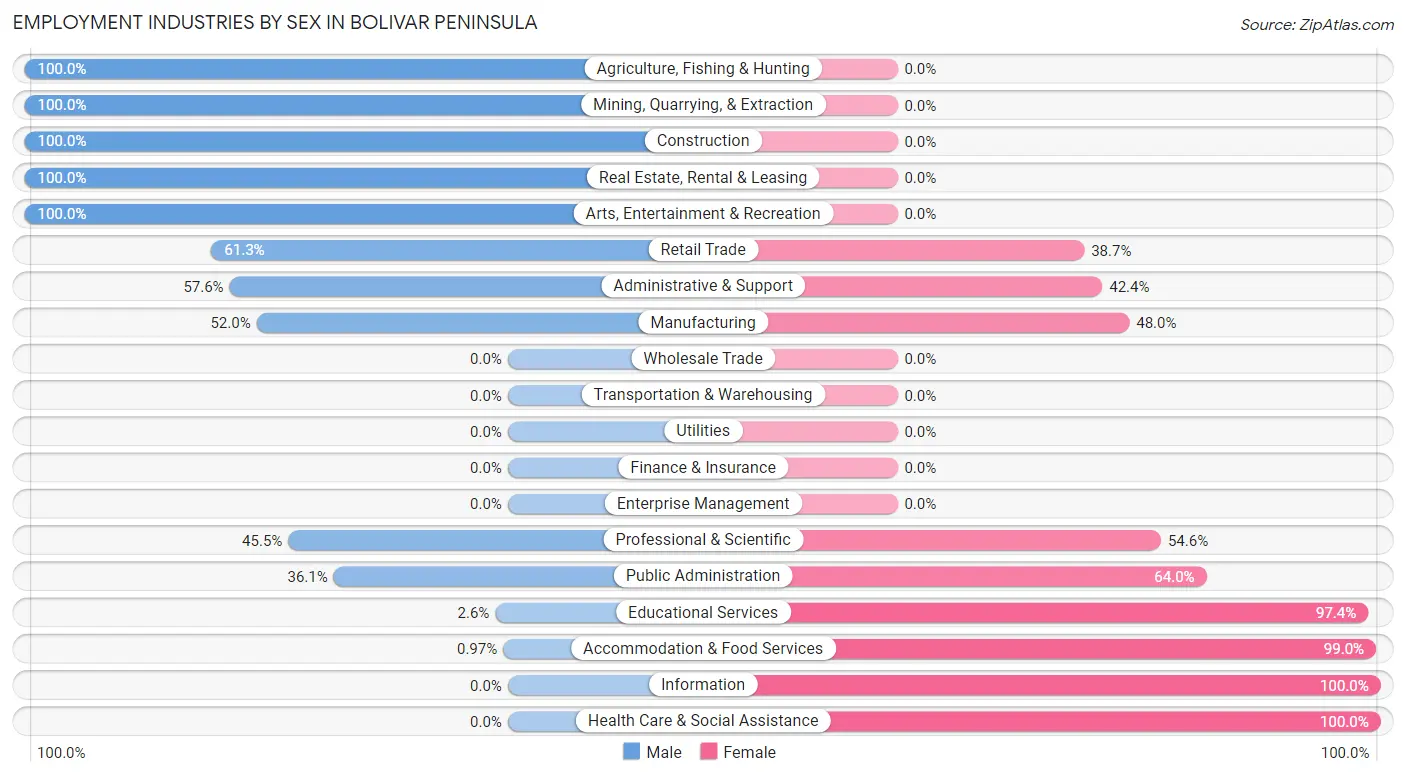
| Industry | Male | Female |
| Agriculture, Fishing & Hunting | 32 (100.0%) | 0 (0.0%) |
| Mining, Quarrying, & Extraction | 23 (100.0%) | 0 (0.0%) |
| Construction | 97 (100.0%) | 0 (0.0%) |
| Manufacturing | 26 (52.0%) | 24 (48.0%) |
| Wholesale Trade | 0 (0.0%) | 0 (0.0%) |
| Retail Trade | 46 (61.3%) | 29 (38.7%) |
| Transportation & Warehousing | 0 (0.0%) | 0 (0.0%) |
| Utilities | 0 (0.0%) | 0 (0.0%) |
| Information | 0 (0.0%) | 12 (100.0%) |
| Finance & Insurance | 0 (0.0%) | 0 (0.0%) |
| Real Estate, Rental & Leasing | 12 (100.0%) | 0 (0.0%) |
| Professional & Scientific | 5 (45.5%) | 6 (54.5%) |
| Enterprise Management | 0 (0.0%) | 0 (0.0%) |
| Administrative & Support | 72 (57.6%) | 53 (42.4%) |
| Educational Services | 3 (2.6%) | 113 (97.4%) |
| Health Care & Social Assistance | 0 (0.0%) | 102 (100.0%) |
| Arts, Entertainment & Recreation | 7 (100.0%) | 0 (0.0%) |
| Accommodation & Food Services | 1 (1.0%) | 102 (99.0%) |
| Public Administration | 31 (36.0%) | 55 (63.9%) |
| Total | 380 (41.5%) | 535 (58.5%) |
Education in Bolivar Peninsula
School Enrollment in Bolivar Peninsula
The most common levels of schooling among the 95 students in Bolivar Peninsula are elementary school (51 | 53.7%), high school (22 | 23.2%), and graduate / professional (12 | 12.6%).
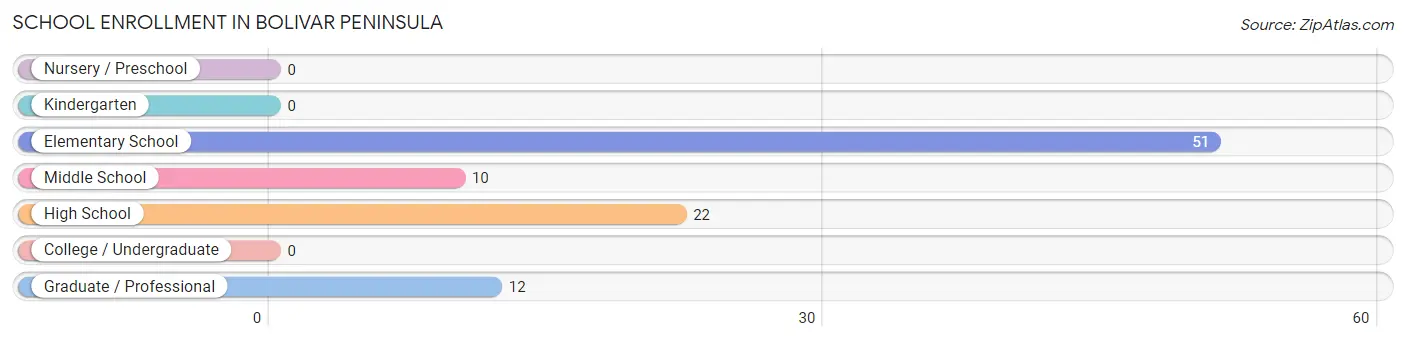
| School Level | # Students | % Students |
| Nursery / Preschool | 0 | 0.0% |
| Kindergarten | 0 | 0.0% |
| Elementary School | 51 | 53.7% |
| Middle School | 10 | 10.5% |
| High School | 22 | 23.2% |
| College / Undergraduate | 0 | 0.0% |
| Graduate / Professional | 12 | 12.6% |
| Total | 95 | 100.0% |
School Enrollment by Age by Funding Source in Bolivar Peninsula
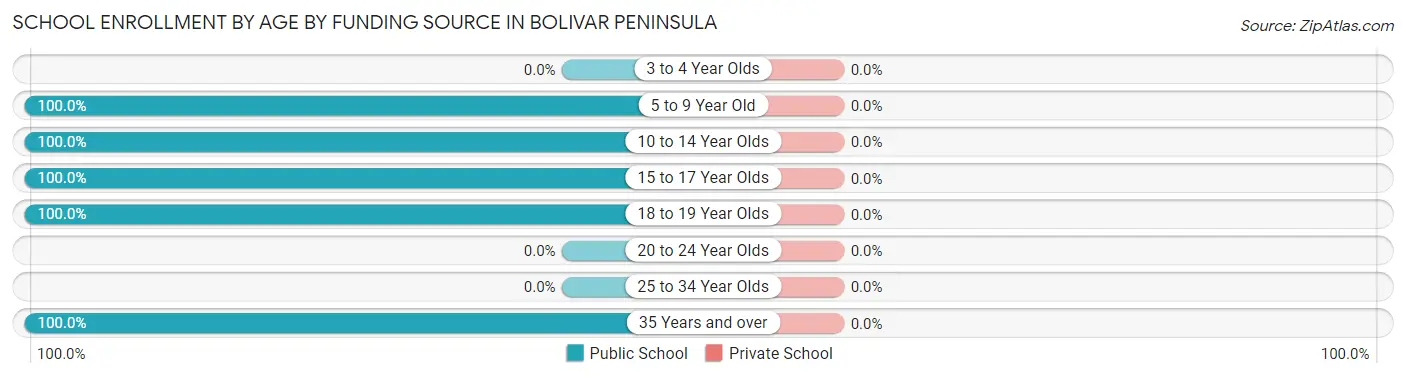
| Age Bracket | Public School | Private School |
| 3 to 4 Year Olds | 0 (0.0%) | 0 (0.0%) |
| 5 to 9 Year Old | 51 (100.0%) | 0 (0.0%) |
| 10 to 14 Year Olds | 10 (100.0%) | 0 (0.0%) |
| 15 to 17 Year Olds | 11 (100.0%) | 0 (0.0%) |
| 18 to 19 Year Olds | 11 (100.0%) | 0 (0.0%) |
| 20 to 24 Year Olds | 0 (0.0%) | 0 (0.0%) |
| 25 to 34 Year Olds | 0 (0.0%) | 0 (0.0%) |
| 35 Years and over | 12 (100.0%) | 0 (0.0%) |
| Total | 95 (100.0%) | 0 (0.0%) |
Educational Attainment by Field of Study in Bolivar Peninsula
Liberal arts & history (66 | 17.8%), bio, nature & agricultural (55 | 14.9%), education (54 | 14.6%), business (50 | 13.5%), and physical & health sciences (36 | 9.7%) are the most common fields of study among 370 individuals in Bolivar Peninsula who have obtained a bachelor's degree or higher.
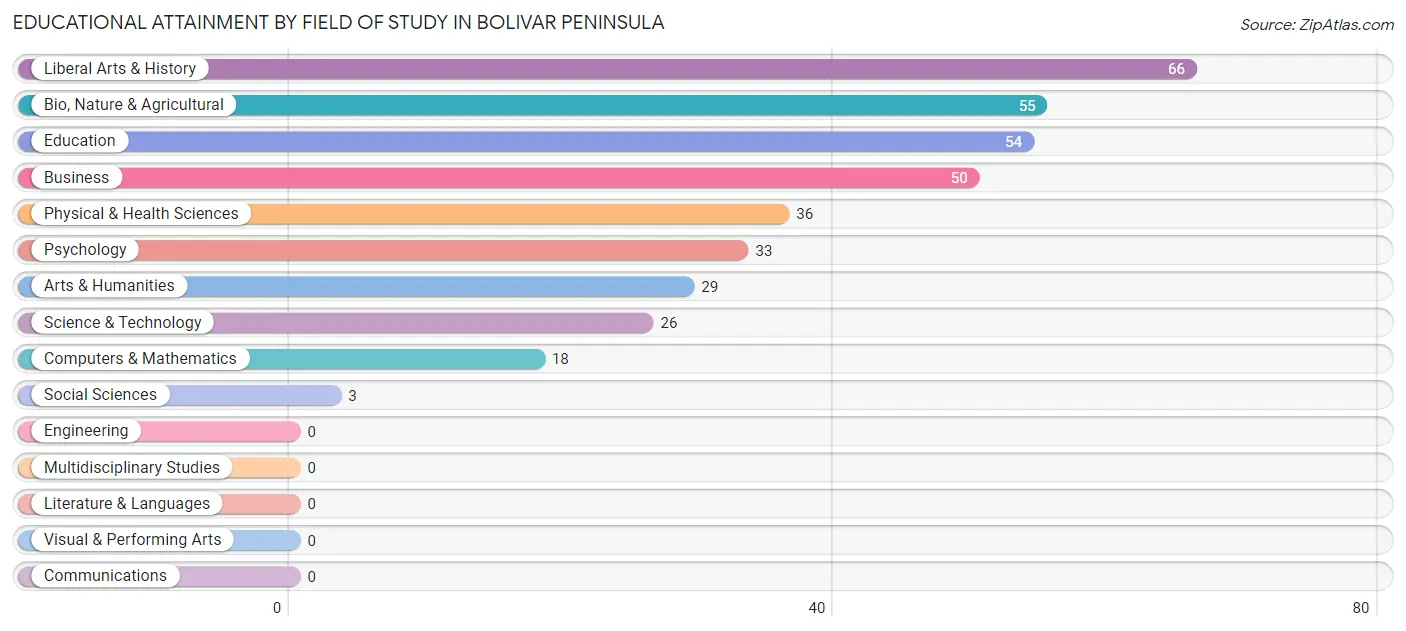
| Field of Study | # Graduates | % Graduates |
| Computers & Mathematics | 18 | 4.9% |
| Bio, Nature & Agricultural | 55 | 14.9% |
| Physical & Health Sciences | 36 | 9.7% |
| Psychology | 33 | 8.9% |
| Social Sciences | 3 | 0.8% |
| Engineering | 0 | 0.0% |
| Multidisciplinary Studies | 0 | 0.0% |
| Science & Technology | 26 | 7.0% |
| Business | 50 | 13.5% |
| Education | 54 | 14.6% |
| Literature & Languages | 0 | 0.0% |
| Liberal Arts & History | 66 | 17.8% |
| Visual & Performing Arts | 0 | 0.0% |
| Communications | 0 | 0.0% |
| Arts & Humanities | 29 | 7.8% |
| Total | 370 | 100.0% |
Transportation & Commute in Bolivar Peninsula
Vehicle Availability by Sex in Bolivar Peninsula
The most prevalent vehicle ownership categories in Bolivar Peninsula are males with 1 vehicle (138, accounting for 36.4%) and females with 1 vehicle (105, making up 25.8%).
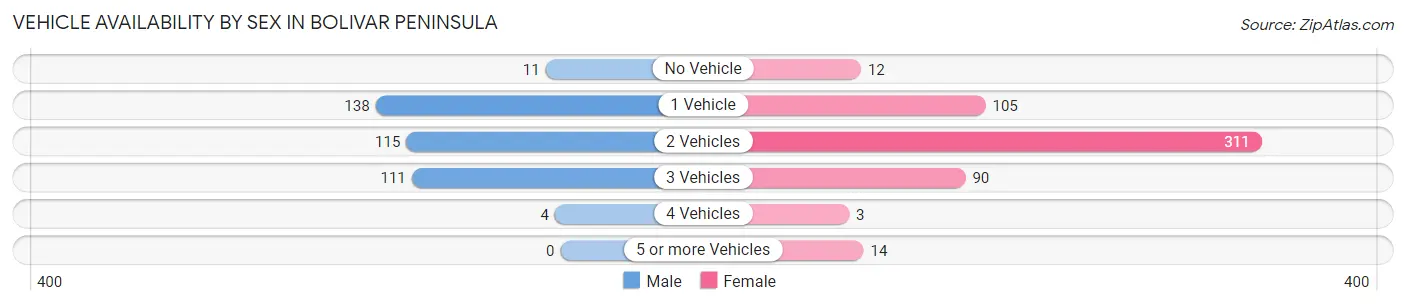
| Vehicles Available | Male | Female |
| No Vehicle | 11 (2.9%) | 12 (2.2%) |
| 1 Vehicle | 138 (36.4%) | 105 (19.6%) |
| 2 Vehicles | 115 (30.3%) | 311 (58.1%) |
| 3 Vehicles | 111 (29.3%) | 90 (16.8%) |
| 4 Vehicles | 4 (1.1%) | 3 (0.6%) |
| 5 or more Vehicles | 0 (0.0%) | 14 (2.6%) |
| Total | 379 (100.0%) | 535 (100.0%) |
Commute Time in Bolivar Peninsula
The most frequently occuring commute durations in Bolivar Peninsula are 10 to 14 minutes (149 commuters, 17.8%), 45 to 59 minutes (149 commuters, 17.8%), and less than 5 minutes (104 commuters, 12.4%).
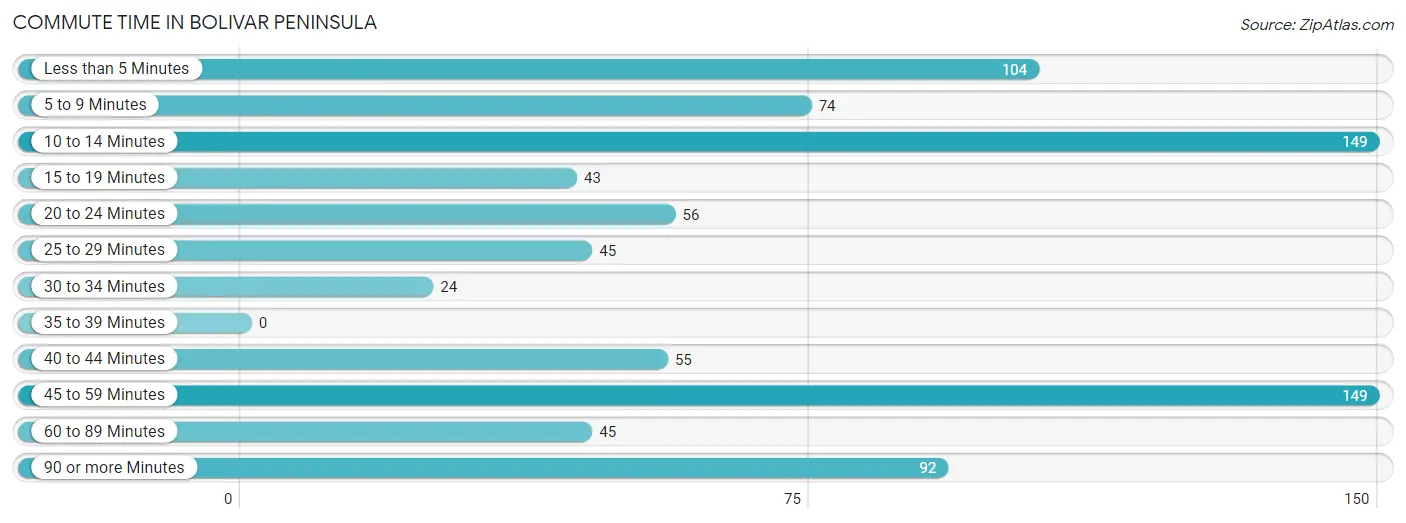
| Commute Time | # Commuters | % Commuters |
| Less than 5 Minutes | 104 | 12.4% |
| 5 to 9 Minutes | 74 | 8.8% |
| 10 to 14 Minutes | 149 | 17.8% |
| 15 to 19 Minutes | 43 | 5.1% |
| 20 to 24 Minutes | 56 | 6.7% |
| 25 to 29 Minutes | 45 | 5.4% |
| 30 to 34 Minutes | 24 | 2.9% |
| 35 to 39 Minutes | 0 | 0.0% |
| 40 to 44 Minutes | 55 | 6.6% |
| 45 to 59 Minutes | 149 | 17.8% |
| 60 to 89 Minutes | 45 | 5.4% |
| 90 or more Minutes | 92 | 11.0% |
Commute Time by Sex in Bolivar Peninsula
The most common commute times in Bolivar Peninsula are 45 to 59 minutes (113 commuters, 30.1%) for males and less than 5 minutes (95 commuters, 20.6%) for females.
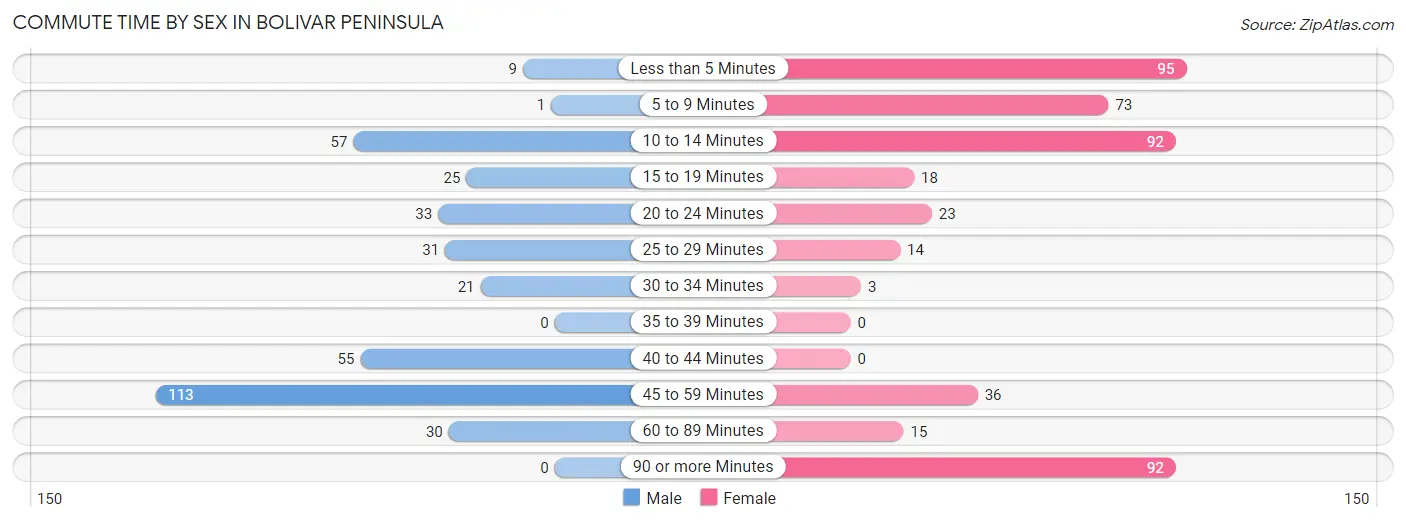
| Commute Time | Male | Female |
| Less than 5 Minutes | 9 (2.4%) | 95 (20.6%) |
| 5 to 9 Minutes | 1 (0.3%) | 73 (15.8%) |
| 10 to 14 Minutes | 57 (15.2%) | 92 (20.0%) |
| 15 to 19 Minutes | 25 (6.7%) | 18 (3.9%) |
| 20 to 24 Minutes | 33 (8.8%) | 23 (5.0%) |
| 25 to 29 Minutes | 31 (8.3%) | 14 (3.0%) |
| 30 to 34 Minutes | 21 (5.6%) | 3 (0.6%) |
| 35 to 39 Minutes | 0 (0.0%) | 0 (0.0%) |
| 40 to 44 Minutes | 55 (14.7%) | 0 (0.0%) |
| 45 to 59 Minutes | 113 (30.1%) | 36 (7.8%) |
| 60 to 89 Minutes | 30 (8.0%) | 15 (3.3%) |
| 90 or more Minutes | 0 (0.0%) | 92 (20.0%) |
Time of Departure to Work by Sex in Bolivar Peninsula
The most frequent times of departure to work in Bolivar Peninsula are 7:00 AM to 7:29 AM (121, 32.3%) for males and 10:00 AM to 10:59 AM (98, 21.3%) for females.
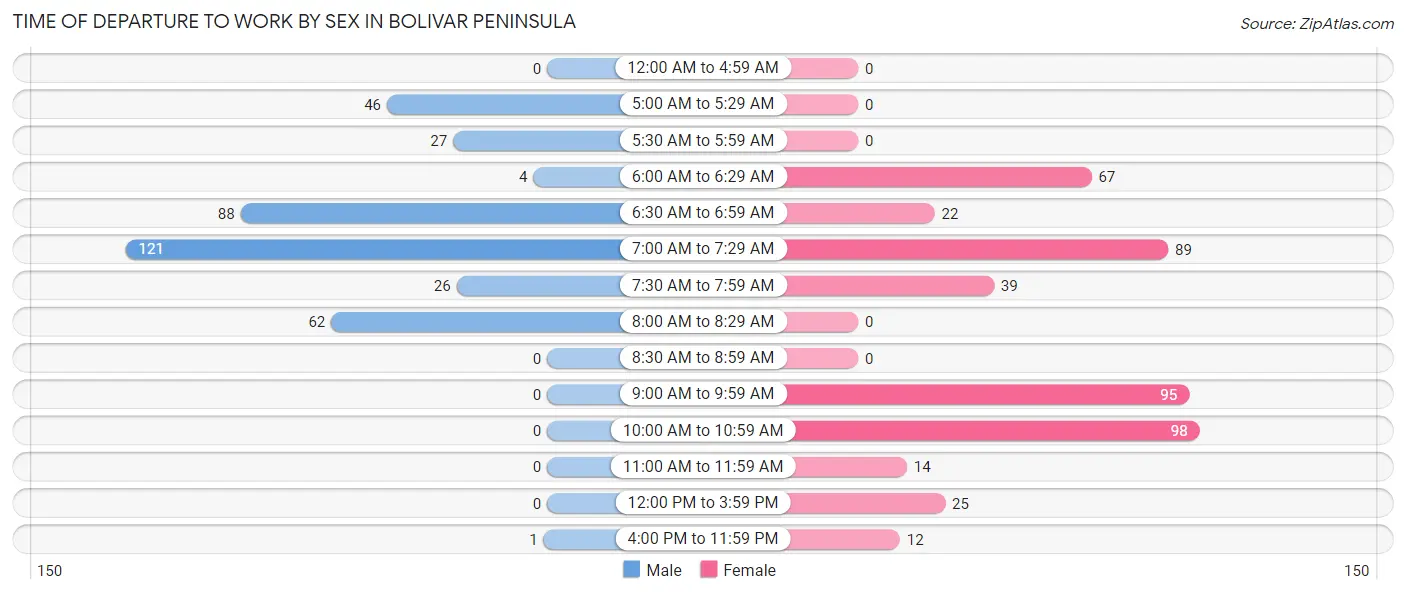
| Time of Departure | Male | Female |
| 12:00 AM to 4:59 AM | 0 (0.0%) | 0 (0.0%) |
| 5:00 AM to 5:29 AM | 46 (12.3%) | 0 (0.0%) |
| 5:30 AM to 5:59 AM | 27 (7.2%) | 0 (0.0%) |
| 6:00 AM to 6:29 AM | 4 (1.1%) | 67 (14.5%) |
| 6:30 AM to 6:59 AM | 88 (23.5%) | 22 (4.8%) |
| 7:00 AM to 7:29 AM | 121 (32.3%) | 89 (19.3%) |
| 7:30 AM to 7:59 AM | 26 (6.9%) | 39 (8.5%) |
| 8:00 AM to 8:29 AM | 62 (16.5%) | 0 (0.0%) |
| 8:30 AM to 8:59 AM | 0 (0.0%) | 0 (0.0%) |
| 9:00 AM to 9:59 AM | 0 (0.0%) | 95 (20.6%) |
| 10:00 AM to 10:59 AM | 0 (0.0%) | 98 (21.3%) |
| 11:00 AM to 11:59 AM | 0 (0.0%) | 14 (3.0%) |
| 12:00 PM to 3:59 PM | 0 (0.0%) | 25 (5.4%) |
| 4:00 PM to 11:59 PM | 1 (0.3%) | 12 (2.6%) |
| Total | 375 (100.0%) | 461 (100.0%) |
Housing Occupancy in Bolivar Peninsula
Occupancy by Ownership in Bolivar Peninsula
Of the total 1,439 dwellings in Bolivar Peninsula, owner-occupied units account for 1,332 (92.6%), while renter-occupied units make up 107 (7.4%).
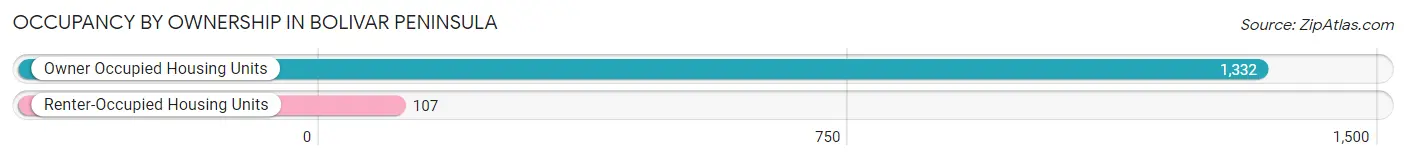
| Occupancy | # Housing Units | % Housing Units |
| Owner Occupied Housing Units | 1,332 | 92.6% |
| Renter-Occupied Housing Units | 107 | 7.4% |
| Total Occupied Housing Units | 1,439 | 100.0% |
Occupancy by Household Size in Bolivar Peninsula
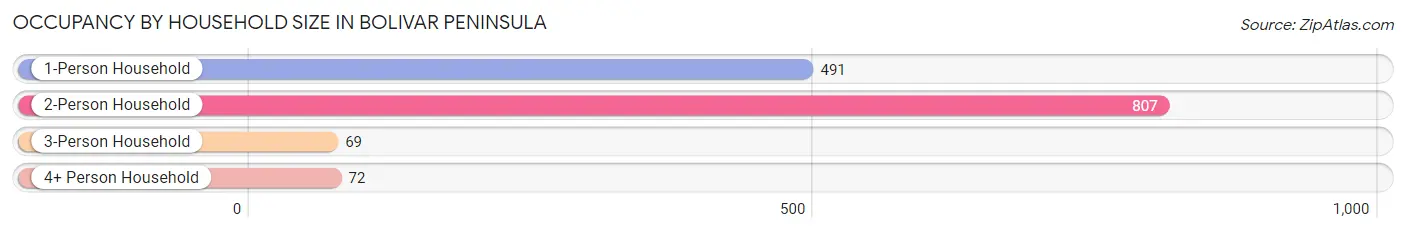
| Household Size | # Housing Units | % Housing Units |
| 1-Person Household | 491 | 34.1% |
| 2-Person Household | 807 | 56.1% |
| 3-Person Household | 69 | 4.8% |
| 4+ Person Household | 72 | 5.0% |
| Total Housing Units | 1,439 | 100.0% |
Occupancy by Ownership by Household Size in Bolivar Peninsula
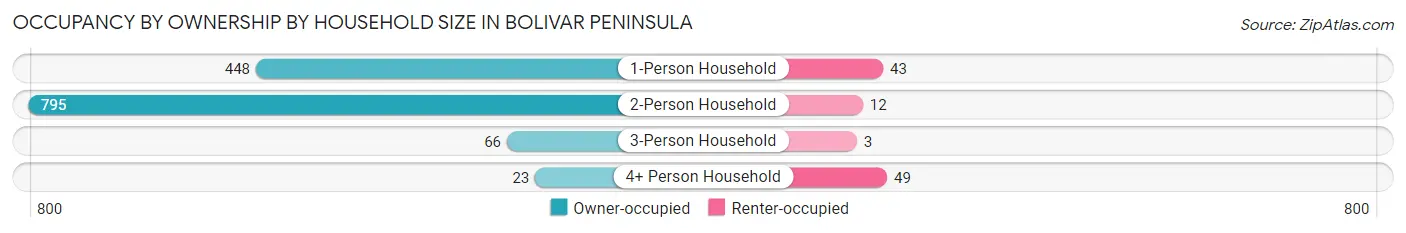
| Household Size | Owner-occupied | Renter-occupied |
| 1-Person Household | 448 (91.2%) | 43 (8.8%) |
| 2-Person Household | 795 (98.5%) | 12 (1.5%) |
| 3-Person Household | 66 (95.7%) | 3 (4.3%) |
| 4+ Person Household | 23 (31.9%) | 49 (68.1%) |
| Total Housing Units | 1,332 (92.6%) | 107 (7.4%) |
Occupancy by Educational Attainment in Bolivar Peninsula
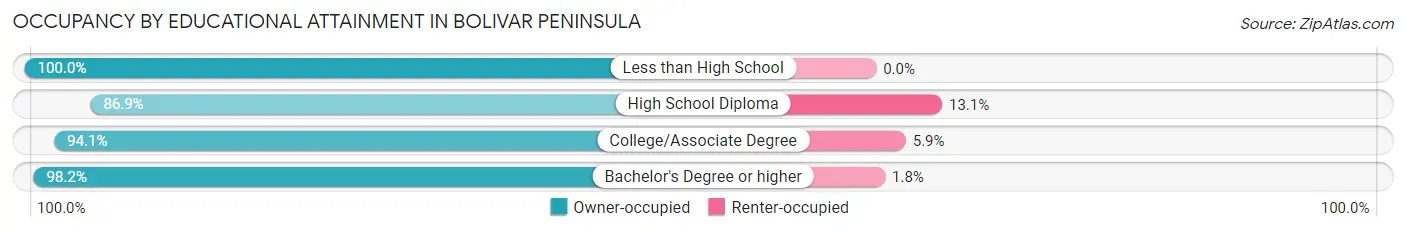
| Household Size | Owner-occupied | Renter-occupied |
| Less than High School | 59 (100.0%) | 0 (0.0%) |
| High School Diploma | 426 (86.9%) | 64 (13.1%) |
| College/Associate Degree | 625 (94.1%) | 39 (5.9%) |
| Bachelor's Degree or higher | 222 (98.2%) | 4 (1.8%) |
Occupancy by Age of Householder in Bolivar Peninsula
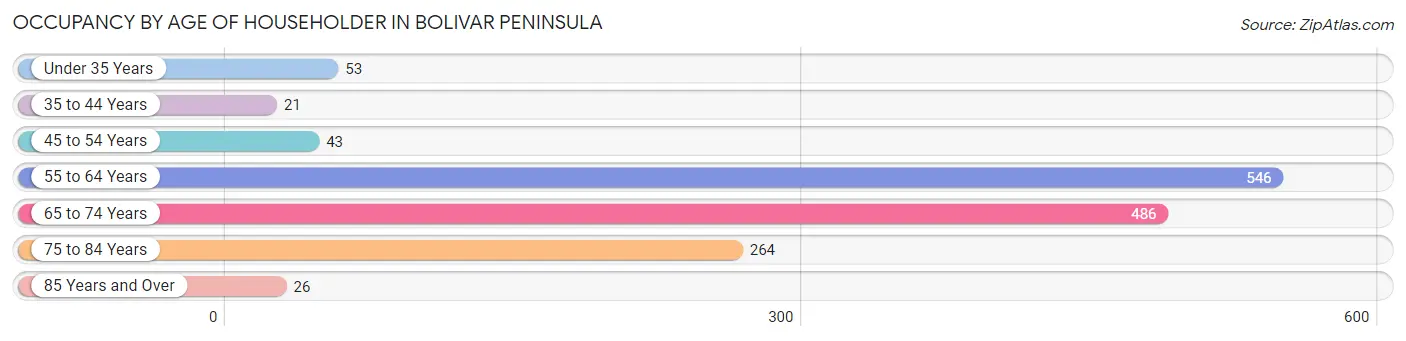
| Age Bracket | # Households | % Households |
| Under 35 Years | 53 | 3.7% |
| 35 to 44 Years | 21 | 1.5% |
| 45 to 54 Years | 43 | 3.0% |
| 55 to 64 Years | 546 | 37.9% |
| 65 to 74 Years | 486 | 33.8% |
| 75 to 84 Years | 264 | 18.3% |
| 85 Years and Over | 26 | 1.8% |
| Total | 1,439 | 100.0% |
Housing Finances in Bolivar Peninsula
Median Income by Occupancy in Bolivar Peninsula
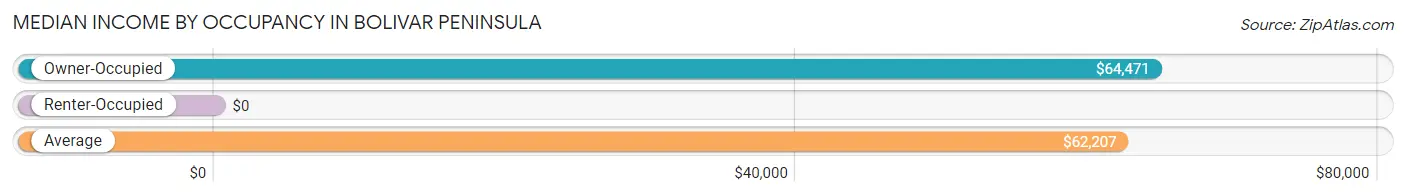
| Occupancy Type | # Households | Median Income |
| Owner-Occupied | 1,332 (92.6%) | $64,471 |
| Renter-Occupied | 107 (7.4%) | $0 |
| Average | 1,439 (100.0%) | $62,207 |
Occupancy by Householder Income Bracket in Bolivar Peninsula
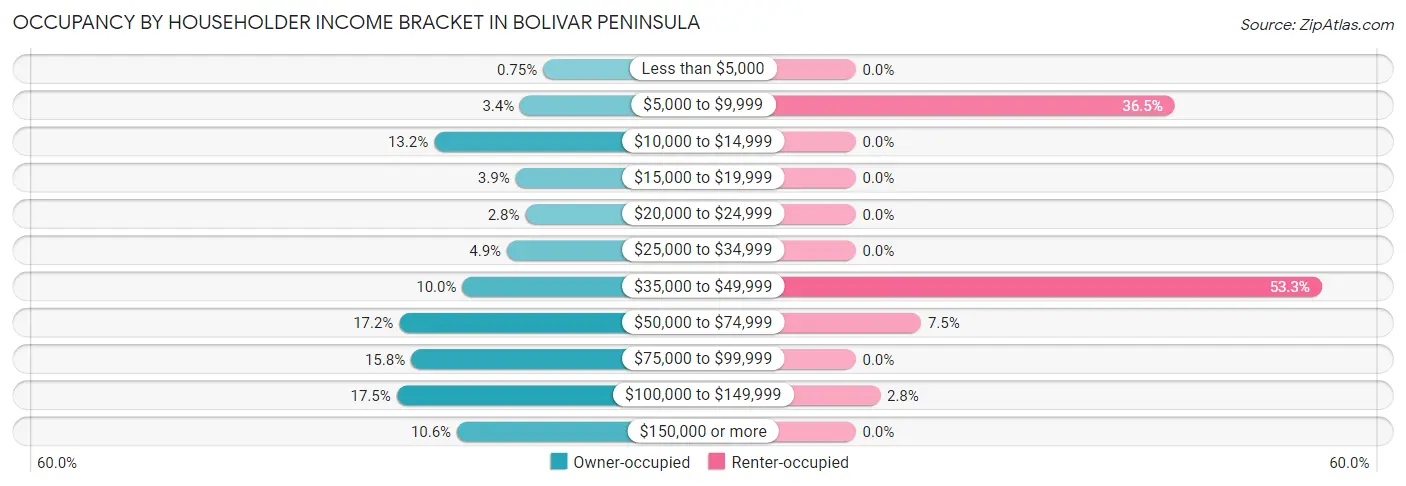
| Income Bracket | Owner-occupied | Renter-occupied |
| Less than $5,000 | 10 (0.7%) | 0 (0.0%) |
| $5,000 to $9,999 | 45 (3.4%) | 39 (36.4%) |
| $10,000 to $14,999 | 176 (13.2%) | 0 (0.0%) |
| $15,000 to $19,999 | 52 (3.9%) | 0 (0.0%) |
| $20,000 to $24,999 | 37 (2.8%) | 0 (0.0%) |
| $25,000 to $34,999 | 65 (4.9%) | 0 (0.0%) |
| $35,000 to $49,999 | 133 (10.0%) | 57 (53.3%) |
| $50,000 to $74,999 | 229 (17.2%) | 8 (7.5%) |
| $75,000 to $99,999 | 211 (15.8%) | 0 (0.0%) |
| $100,000 to $149,999 | 233 (17.5%) | 3 (2.8%) |
| $150,000 or more | 141 (10.6%) | 0 (0.0%) |
| Total | 1,332 (100.0%) | 107 (100.0%) |
Monthly Housing Cost Tiers in Bolivar Peninsula
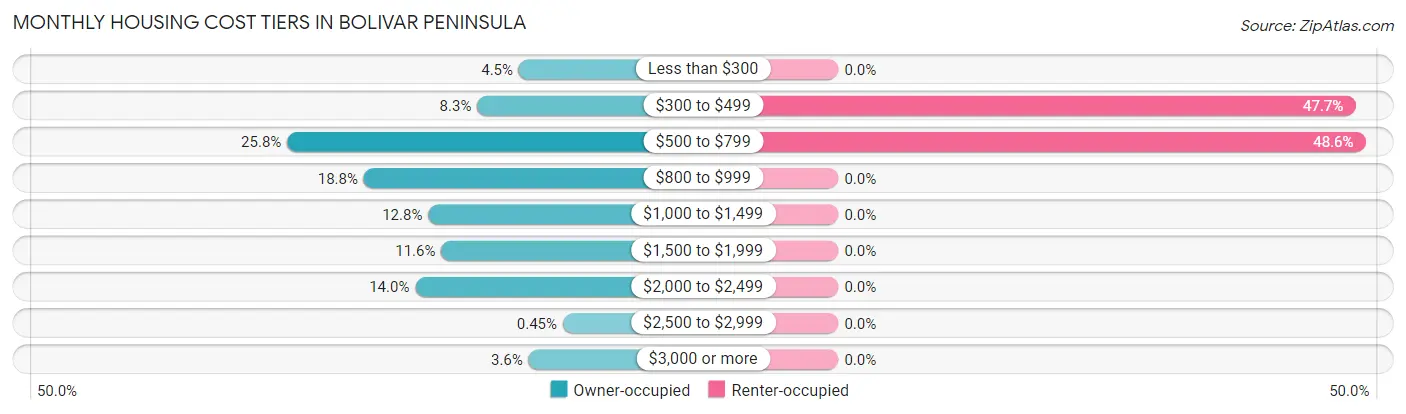
| Monthly Cost | Owner-occupied | Renter-occupied |
| Less than $300 | 60 (4.5%) | 0 (0.0%) |
| $300 to $499 | 111 (8.3%) | 51 (47.7%) |
| $500 to $799 | 344 (25.8%) | 52 (48.6%) |
| $800 to $999 | 250 (18.8%) | 0 (0.0%) |
| $1,000 to $1,499 | 171 (12.8%) | 0 (0.0%) |
| $1,500 to $1,999 | 155 (11.6%) | 0 (0.0%) |
| $2,000 to $2,499 | 187 (14.0%) | 0 (0.0%) |
| $2,500 to $2,999 | 6 (0.4%) | 0 (0.0%) |
| $3,000 or more | 48 (3.6%) | 0 (0.0%) |
| Total | 1,332 (100.0%) | 107 (100.0%) |
Physical Housing Characteristics in Bolivar Peninsula
Housing Structures in Bolivar Peninsula
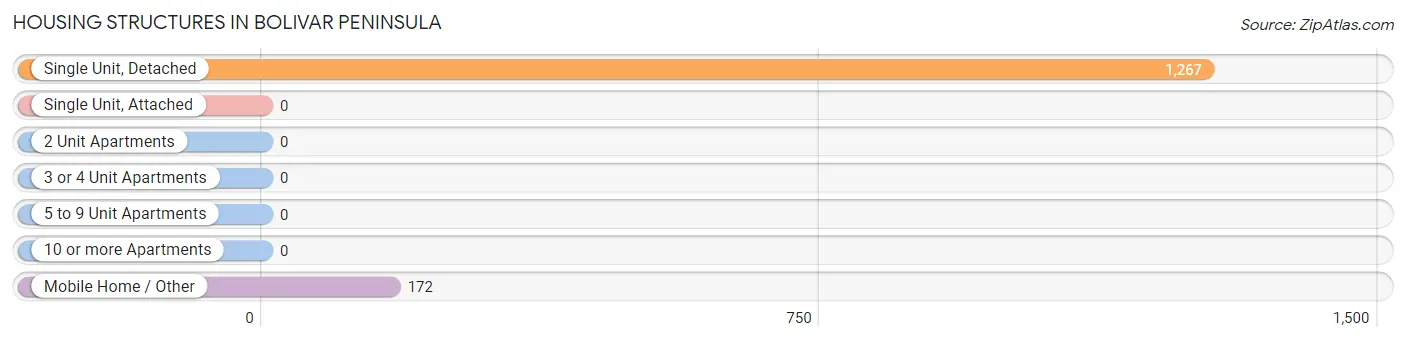
| Structure Type | # Housing Units | % Housing Units |
| Single Unit, Detached | 1,267 | 88.0% |
| Single Unit, Attached | 0 | 0.0% |
| 2 Unit Apartments | 0 | 0.0% |
| 3 or 4 Unit Apartments | 0 | 0.0% |
| 5 to 9 Unit Apartments | 0 | 0.0% |
| 10 or more Apartments | 0 | 0.0% |
| Mobile Home / Other | 172 | 11.9% |
| Total | 1,439 | 100.0% |
Housing Structures by Occupancy in Bolivar Peninsula
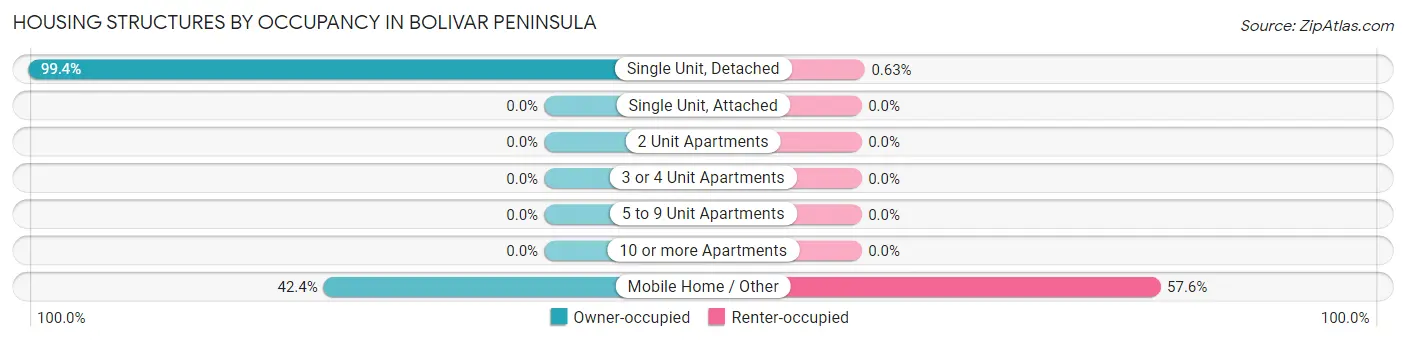
| Structure Type | Owner-occupied | Renter-occupied |
| Single Unit, Detached | 1,259 (99.4%) | 8 (0.6%) |
| Single Unit, Attached | 0 (0.0%) | 0 (0.0%) |
| 2 Unit Apartments | 0 (0.0%) | 0 (0.0%) |
| 3 or 4 Unit Apartments | 0 (0.0%) | 0 (0.0%) |
| 5 to 9 Unit Apartments | 0 (0.0%) | 0 (0.0%) |
| 10 or more Apartments | 0 (0.0%) | 0 (0.0%) |
| Mobile Home / Other | 73 (42.4%) | 99 (57.6%) |
| Total | 1,332 (92.6%) | 107 (7.4%) |
Housing Structures by Number of Rooms in Bolivar Peninsula
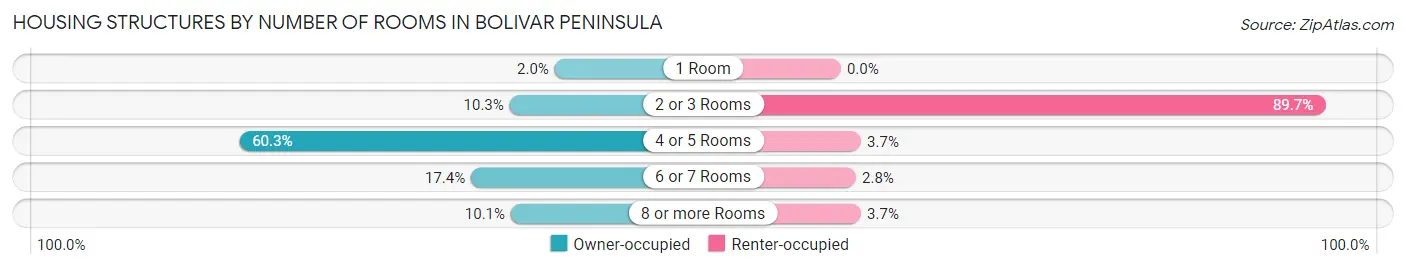
| Number of Rooms | Owner-occupied | Renter-occupied |
| 1 Room | 26 (1.9%) | 0 (0.0%) |
| 2 or 3 Rooms | 137 (10.3%) | 96 (89.7%) |
| 4 or 5 Rooms | 803 (60.3%) | 4 (3.7%) |
| 6 or 7 Rooms | 232 (17.4%) | 3 (2.8%) |
| 8 or more Rooms | 134 (10.1%) | 4 (3.7%) |
| Total | 1,332 (100.0%) | 107 (100.0%) |
Housing Structure by Heating Type in Bolivar Peninsula
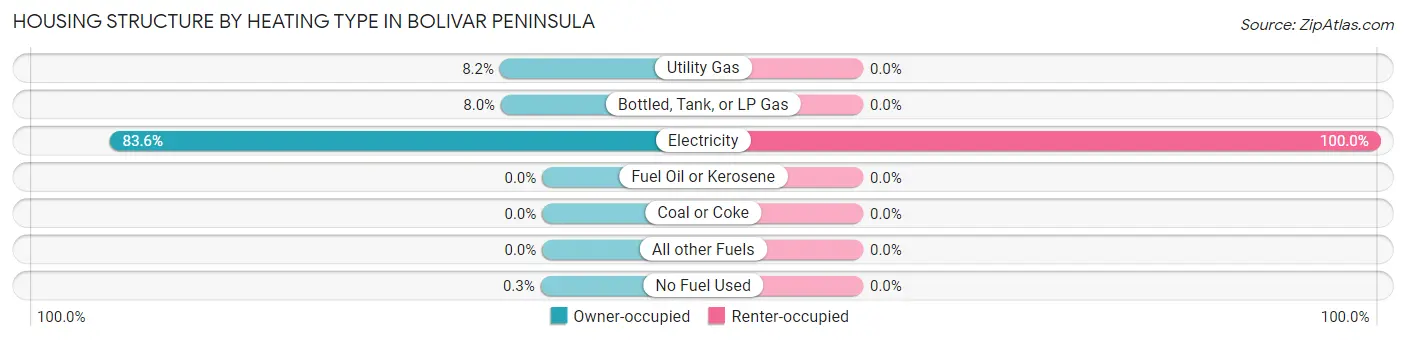
| Heating Type | Owner-occupied | Renter-occupied |
| Utility Gas | 109 (8.2%) | 0 (0.0%) |
| Bottled, Tank, or LP Gas | 106 (8.0%) | 0 (0.0%) |
| Electricity | 1,113 (83.6%) | 107 (100.0%) |
| Fuel Oil or Kerosene | 0 (0.0%) | 0 (0.0%) |
| Coal or Coke | 0 (0.0%) | 0 (0.0%) |
| All other Fuels | 0 (0.0%) | 0 (0.0%) |
| No Fuel Used | 4 (0.3%) | 0 (0.0%) |
| Total | 1,332 (100.0%) | 107 (100.0%) |
Household Vehicle Usage in Bolivar Peninsula
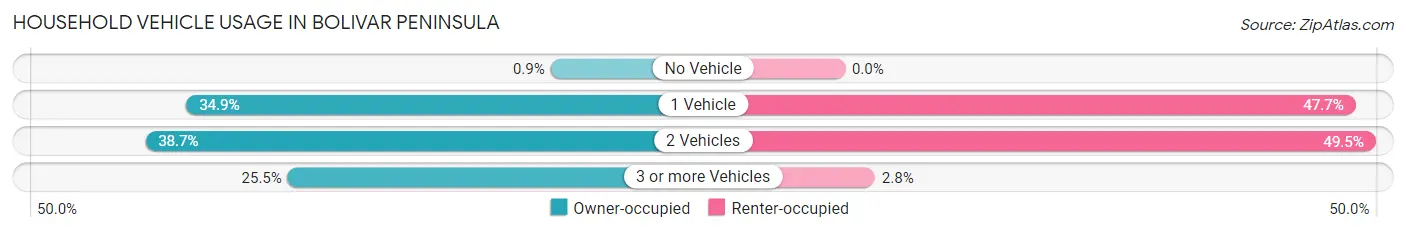
| Vehicles per Household | Owner-occupied | Renter-occupied |
| No Vehicle | 12 (0.9%) | 0 (0.0%) |
| 1 Vehicle | 465 (34.9%) | 51 (47.7%) |
| 2 Vehicles | 516 (38.7%) | 53 (49.5%) |
| 3 or more Vehicles | 339 (25.5%) | 3 (2.8%) |
| Total | 1,332 (100.0%) | 107 (100.0%) |
Real Estate & Mortgages in Bolivar Peninsula
Real Estate and Mortgage Overview in Bolivar Peninsula
| Characteristic | Without Mortgage | With Mortgage |
| Housing Units | 903 | 429 |
| Median Property Value | $343,300 | $300,400 |
| Median Household Income | $61,680 | $96 |
| Monthly Housing Costs | $679 | $0 |
| Real Estate Taxes | $3,602 | $0 |
Property Value by Mortgage Status in Bolivar Peninsula
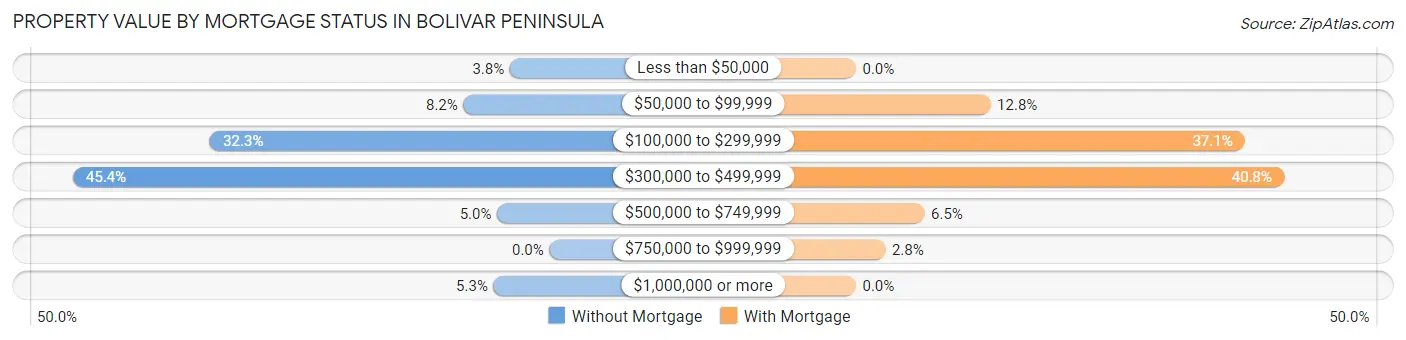
| Property Value | Without Mortgage | With Mortgage |
| Less than $50,000 | 34 (3.8%) | 0 (0.0%) |
| $50,000 to $99,999 | 74 (8.2%) | 55 (12.8%) |
| $100,000 to $299,999 | 292 (32.3%) | 159 (37.1%) |
| $300,000 to $499,999 | 410 (45.4%) | 175 (40.8%) |
| $500,000 to $749,999 | 45 (5.0%) | 28 (6.5%) |
| $750,000 to $999,999 | 0 (0.0%) | 12 (2.8%) |
| $1,000,000 or more | 48 (5.3%) | 0 (0.0%) |
| Total | 903 (100.0%) | 429 (100.0%) |
Household Income by Mortgage Status in Bolivar Peninsula
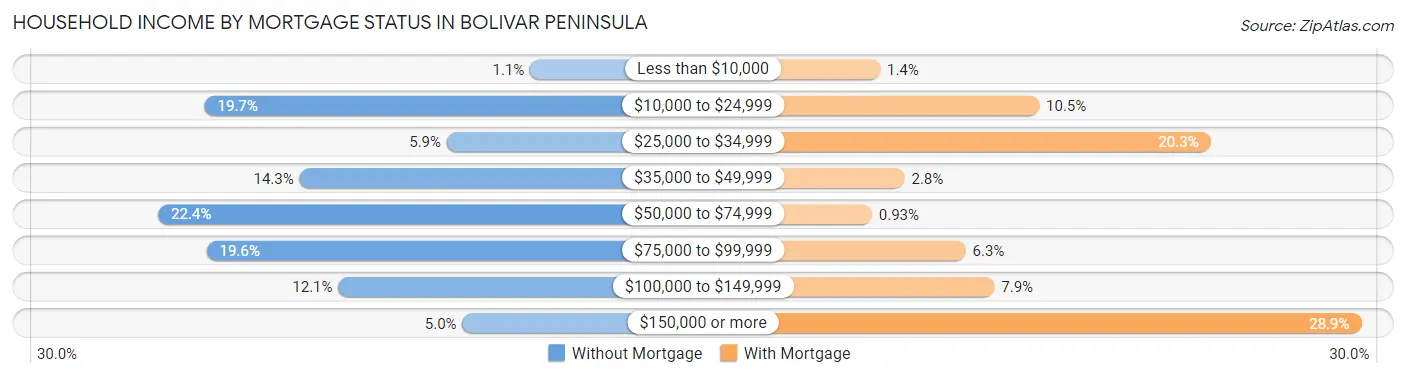
| Household Income | Without Mortgage | With Mortgage |
| Less than $10,000 | 10 (1.1%) | 6 (1.4%) |
| $10,000 to $24,999 | 178 (19.7%) | 45 (10.5%) |
| $25,000 to $34,999 | 53 (5.9%) | 87 (20.3%) |
| $35,000 to $49,999 | 129 (14.3%) | 12 (2.8%) |
| $50,000 to $74,999 | 202 (22.4%) | 4 (0.9%) |
| $75,000 to $99,999 | 177 (19.6%) | 27 (6.3%) |
| $100,000 to $149,999 | 109 (12.1%) | 34 (7.9%) |
| $150,000 or more | 45 (5.0%) | 124 (28.9%) |
| Total | 903 (100.0%) | 429 (100.0%) |
Property Value to Household Income Ratio in Bolivar Peninsula
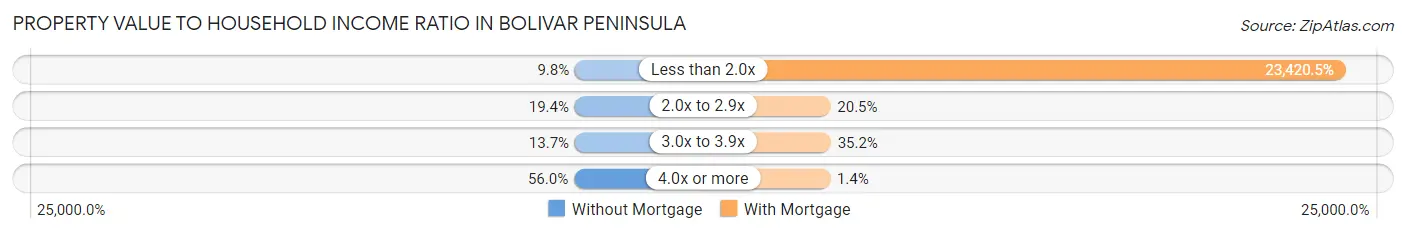
| Value-to-Income Ratio | Without Mortgage | With Mortgage |
| Less than 2.0x | 88 (9.8%) | 100,474 (23,420.5%) |
| 2.0x to 2.9x | 175 (19.4%) | 88 (20.5%) |
| 3.0x to 3.9x | 124 (13.7%) | 151 (35.2%) |
| 4.0x or more | 506 (56.0%) | 6 (1.4%) |
| Total | 903 (100.0%) | 429 (100.0%) |
Real Estate Taxes by Mortgage Status in Bolivar Peninsula
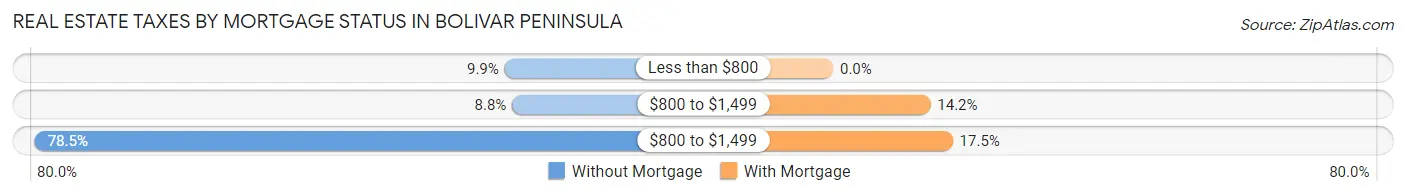
| Property Taxes | Without Mortgage | With Mortgage |
| Less than $800 | 89 (9.9%) | 0 (0.0%) |
| $800 to $1,499 | 79 (8.7%) | 61 (14.2%) |
| $800 to $1,499 | 709 (78.5%) | 75 (17.5%) |
| Total | 903 (100.0%) | 429 (100.0%) |
Health & Disability in Bolivar Peninsula
Health Insurance Coverage by Age in Bolivar Peninsula
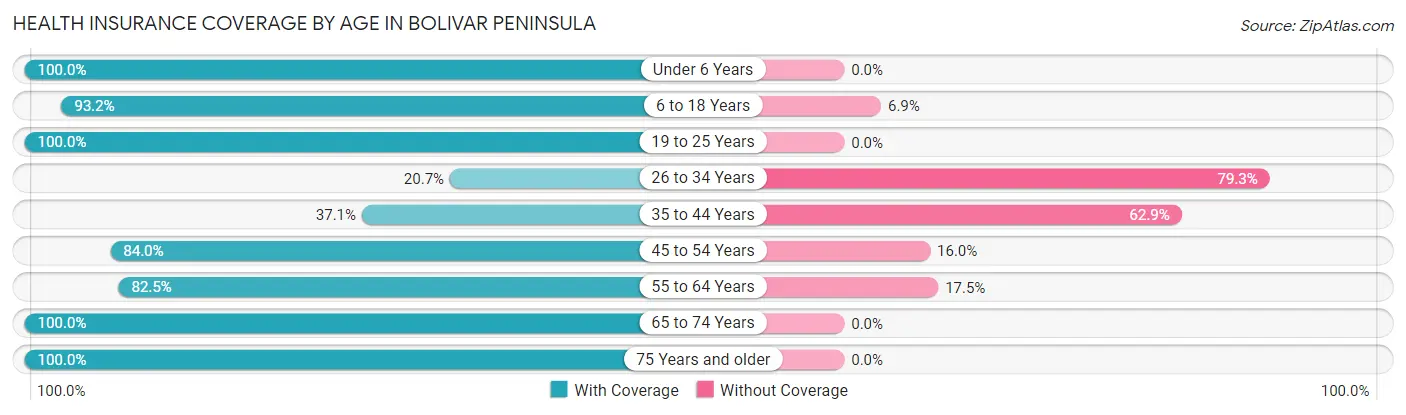
| Age Bracket | With Coverage | Without Coverage |
| Under 6 Years | 60 (100.0%) | 0 (0.0%) |
| 6 to 18 Years | 68 (93.1%) | 5 (6.9%) |
| 19 to 25 Years | 18 (100.0%) | 0 (0.0%) |
| 26 to 34 Years | 24 (20.7%) | 92 (79.3%) |
| 35 to 44 Years | 36 (37.1%) | 61 (62.9%) |
| 45 to 54 Years | 63 (84.0%) | 12 (16.0%) |
| 55 to 64 Years | 730 (82.5%) | 155 (17.5%) |
| 65 to 74 Years | 984 (100.0%) | 0 (0.0%) |
| 75 Years and older | 318 (100.0%) | 0 (0.0%) |
| Total | 2,301 (87.6%) | 325 (12.4%) |
Health Insurance Coverage by Citizenship Status in Bolivar Peninsula
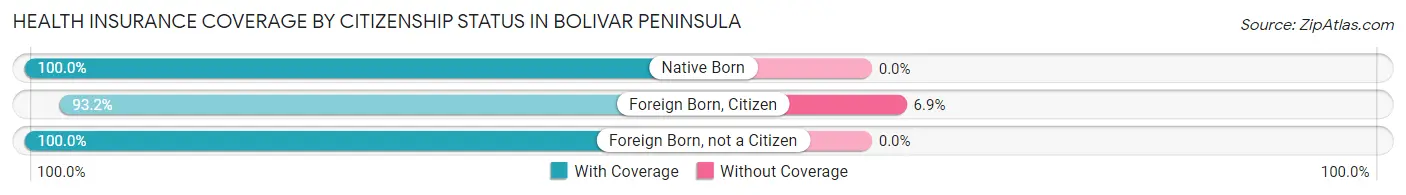
| Citizenship Status | With Coverage | Without Coverage |
| Native Born | 60 (100.0%) | 0 (0.0%) |
| Foreign Born, Citizen | 68 (93.1%) | 5 (6.9%) |
| Foreign Born, not a Citizen | 18 (100.0%) | 0 (0.0%) |
Health Insurance Coverage by Household Income in Bolivar Peninsula
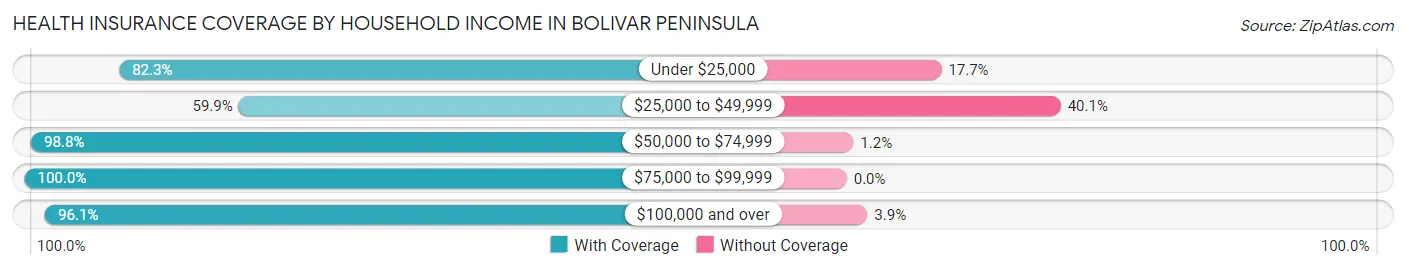
| Household Income | With Coverage | Without Coverage |
| Under $25,000 | 348 (82.3%) | 75 (17.7%) |
| $25,000 to $49,999 | 317 (59.9%) | 212 (40.1%) |
| $50,000 to $74,999 | 398 (98.8%) | 5 (1.2%) |
| $75,000 to $99,999 | 440 (100.0%) | 0 (0.0%) |
| $100,000 and over | 798 (96.1%) | 32 (3.9%) |
Public vs Private Health Insurance Coverage by Age in Bolivar Peninsula
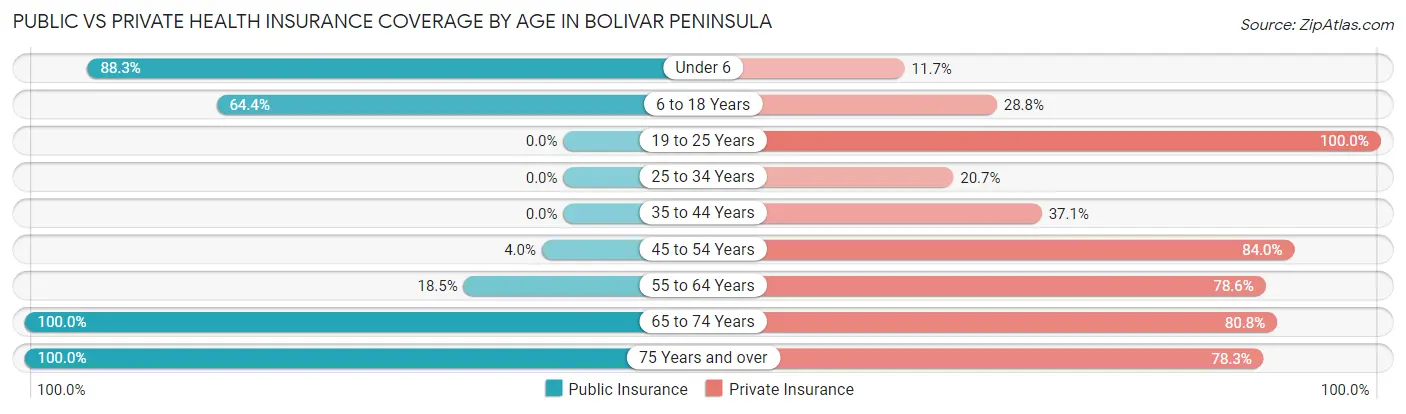
| Age Bracket | Public Insurance | Private Insurance |
| Under 6 | 53 (88.3%) | 7 (11.7%) |
| 6 to 18 Years | 47 (64.4%) | 21 (28.8%) |
| 19 to 25 Years | 0 (0.0%) | 18 (100.0%) |
| 25 to 34 Years | 0 (0.0%) | 24 (20.7%) |
| 35 to 44 Years | 0 (0.0%) | 36 (37.1%) |
| 45 to 54 Years | 3 (4.0%) | 63 (84.0%) |
| 55 to 64 Years | 164 (18.5%) | 696 (78.6%) |
| 65 to 74 Years | 984 (100.0%) | 795 (80.8%) |
| 75 Years and over | 318 (100.0%) | 249 (78.3%) |
| Total | 1,569 (59.8%) | 1,909 (72.7%) |
Disability Status by Sex by Age in Bolivar Peninsula
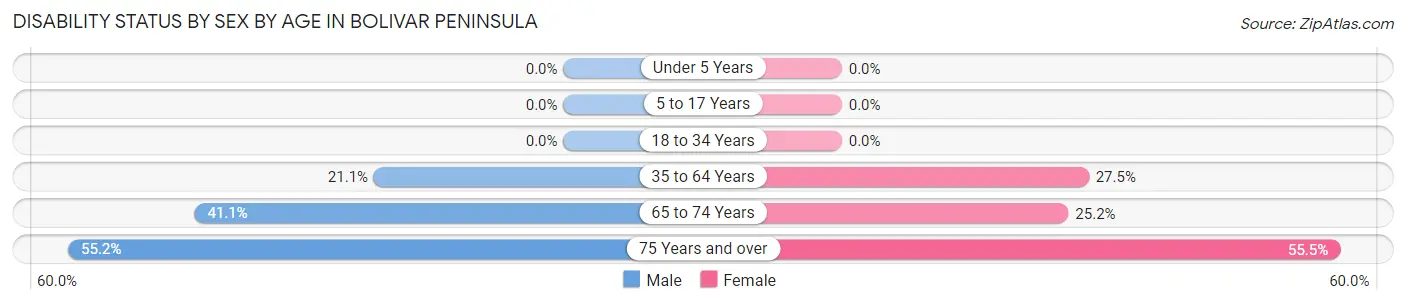
| Age Bracket | Male | Female |
| Under 5 Years | 0 (0.0%) | 0 (0.0%) |
| 5 to 17 Years | 0 (0.0%) | 0 (0.0%) |
| 18 to 34 Years | 0 (0.0%) | 0 (0.0%) |
| 35 to 64 Years | 88 (21.1%) | 176 (27.5%) |
| 65 to 74 Years | 191 (41.1%) | 131 (25.2%) |
| 75 Years and over | 75 (55.1%) | 101 (55.5%) |
Disability Class by Sex by Age in Bolivar Peninsula
Disability Class: Hearing Difficulty
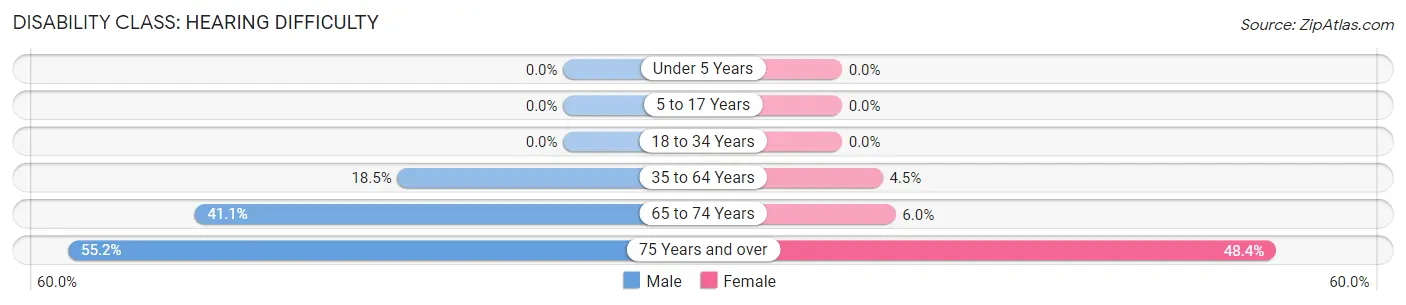
| Age Bracket | Male | Female |
| Under 5 Years | 0 (0.0%) | 0 (0.0%) |
| 5 to 17 Years | 0 (0.0%) | 0 (0.0%) |
| 18 to 34 Years | 0 (0.0%) | 0 (0.0%) |
| 35 to 64 Years | 77 (18.5%) | 29 (4.5%) |
| 65 to 74 Years | 191 (41.1%) | 31 (6.0%) |
| 75 Years and over | 75 (55.1%) | 88 (48.3%) |
Disability Class: Vision Difficulty
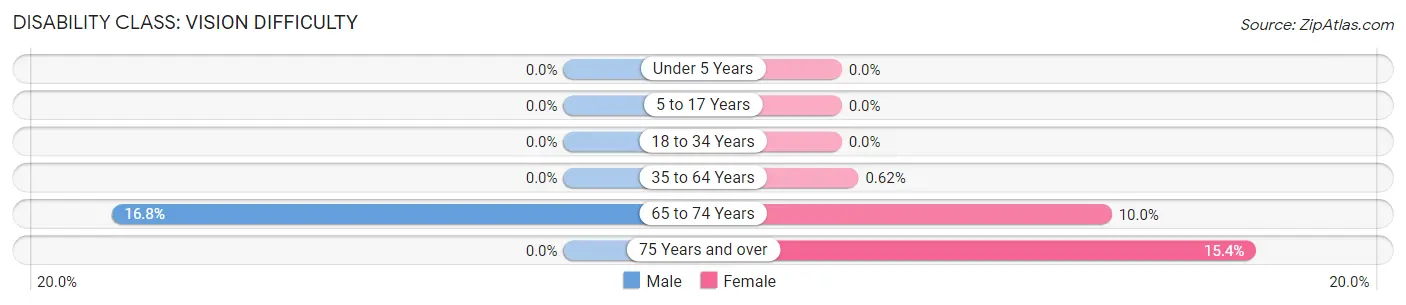
| Age Bracket | Male | Female |
| Under 5 Years | 0 (0.0%) | 0 (0.0%) |
| 5 to 17 Years | 0 (0.0%) | 0 (0.0%) |
| 18 to 34 Years | 0 (0.0%) | 0 (0.0%) |
| 35 to 64 Years | 0 (0.0%) | 4 (0.6%) |
| 65 to 74 Years | 78 (16.8%) | 52 (10.0%) |
| 75 Years and over | 0 (0.0%) | 28 (15.4%) |
Disability Class: Cognitive Difficulty
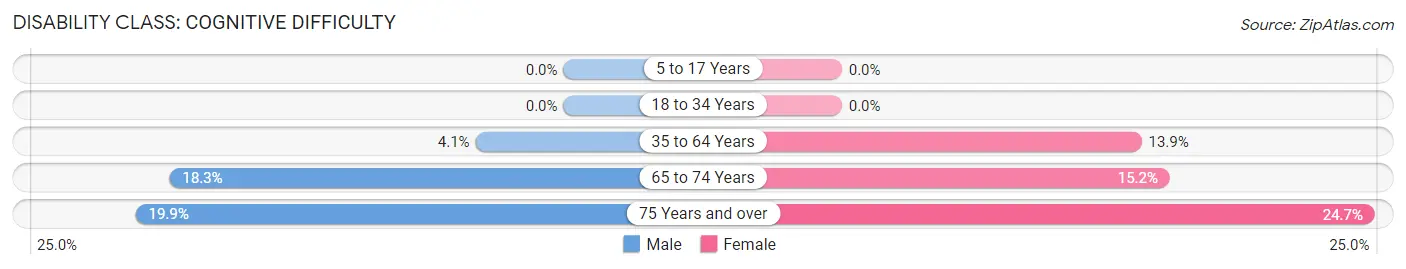
| Age Bracket | Male | Female |
| 5 to 17 Years | 0 (0.0%) | 0 (0.0%) |
| 18 to 34 Years | 0 (0.0%) | 0 (0.0%) |
| 35 to 64 Years | 17 (4.1%) | 89 (13.9%) |
| 65 to 74 Years | 85 (18.3%) | 79 (15.2%) |
| 75 Years and over | 27 (19.9%) | 45 (24.7%) |
Disability Class: Ambulatory Difficulty
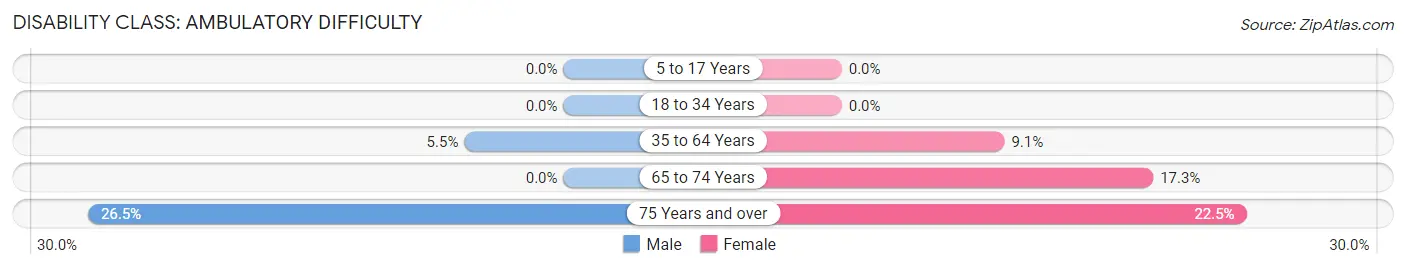
| Age Bracket | Male | Female |
| 5 to 17 Years | 0 (0.0%) | 0 (0.0%) |
| 18 to 34 Years | 0 (0.0%) | 0 (0.0%) |
| 35 to 64 Years | 23 (5.5%) | 58 (9.1%) |
| 65 to 74 Years | 0 (0.0%) | 90 (17.3%) |
| 75 Years and over | 36 (26.5%) | 41 (22.5%) |
Disability Class: Self-Care Difficulty
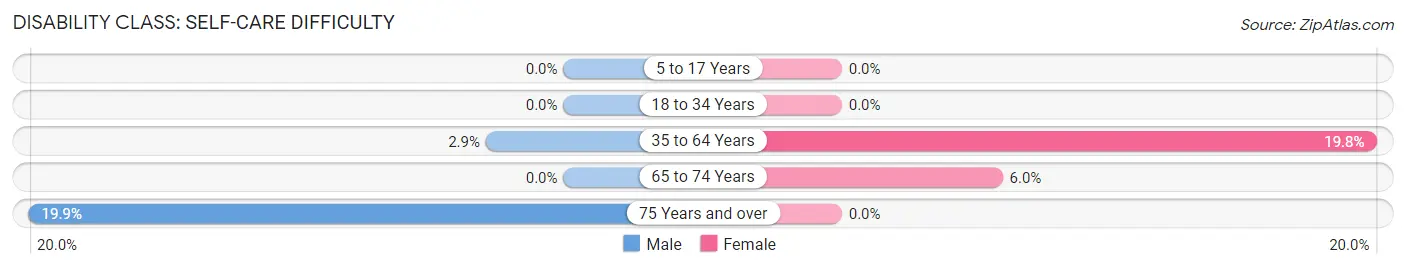
| Age Bracket | Male | Female |
| 5 to 17 Years | 0 (0.0%) | 0 (0.0%) |
| 18 to 34 Years | 0 (0.0%) | 0 (0.0%) |
| 35 to 64 Years | 12 (2.9%) | 127 (19.8%) |
| 65 to 74 Years | 0 (0.0%) | 31 (6.0%) |
| 75 Years and over | 27 (19.9%) | 0 (0.0%) |
Technology Access in Bolivar Peninsula
Computing Device Access in Bolivar Peninsula
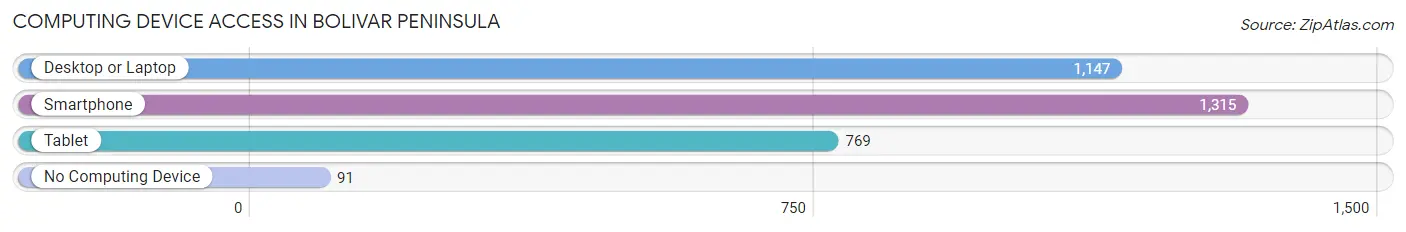
| Device Type | # Households | % Households |
| Desktop or Laptop | 1,147 | 79.7% |
| Smartphone | 1,315 | 91.4% |
| Tablet | 769 | 53.4% |
| No Computing Device | 91 | 6.3% |
| Total | 1,439 | 100.0% |
Internet Access in Bolivar Peninsula
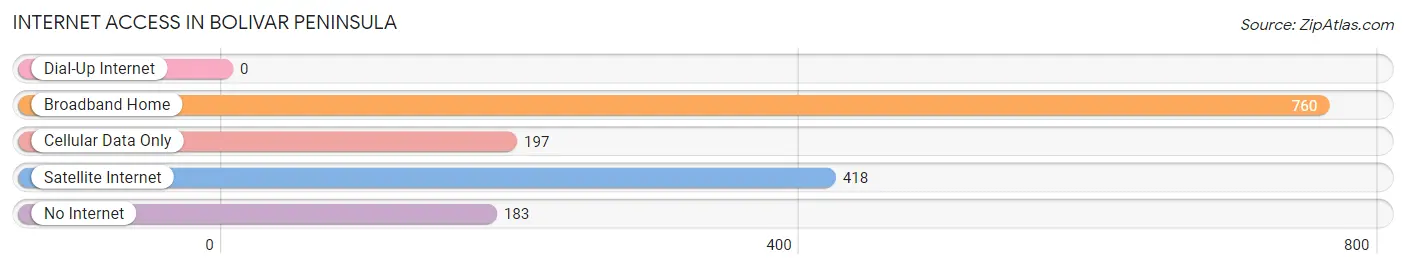
| Internet Type | # Households | % Households |
| Dial-Up Internet | 0 | 0.0% |
| Broadband Home | 760 | 52.8% |
| Cellular Data Only | 197 | 13.7% |
| Satellite Internet | 418 | 29.0% |
| No Internet | 183 | 12.7% |
| Total | 1,439 | 100.0% |
Bolivar Peninsula Summary
Bolivar Peninsula is a narrow strip of land located in the southeastern part of Texas, United States. It is situated between Galveston Bay and the Gulf of Mexico, and is part of the Galveston-Houston metropolitan area. The peninsula is approximately 30 miles long and 2 miles wide, and is divided into three distinct regions: Crystal Beach, Gilchrist, and Port Bolivar.
History
The Bolivar Peninsula has a long and varied history. The first inhabitants of the area were the Karankawa Indians, who lived in the area for thousands of years before the arrival of Europeans. The first Europeans to explore the area were Spanish explorers in the 16th century. The area was later claimed by France, and then by Mexico in 1821.
In 1836, the Republic of Texas was established, and the Bolivar Peninsula became part of the new nation. The area was sparsely populated until the late 19th century, when the Galveston-Houston and Henderson Railroad was built, connecting the peninsula to the mainland. This allowed for the development of the area, and the population began to grow.
In 1900, the Galveston Hurricane struck the area, causing massive destruction and loss of life. The peninsula was largely abandoned in the aftermath of the storm, and the population did not begin to recover until the 1950s.
Geography
The Bolivar Peninsula is located in the southeastern part of Texas, between Galveston Bay and the Gulf of Mexico. It is approximately 30 miles long and 2 miles wide, and is divided into three distinct regions: Crystal Beach, Gilchrist, and Port Bolivar.
The peninsula is mostly flat, with an average elevation of just 6 feet above sea level. The area is prone to flooding, and is protected by a series of levees and seawalls. The peninsula is also vulnerable to hurricanes and tropical storms, and has been hit by several major storms in recent years.
Economy
The economy of the Bolivar Peninsula is largely based on tourism and fishing. The area is a popular destination for beachgoers, and is home to several resorts and vacation rentals. Fishing is also an important part of the local economy, with the area's waters providing a variety of seafood, including shrimp, oysters, and crabs.
The area is also home to several oil and gas production facilities, as well as a number of industrial plants. The Port of Galveston is located on the peninsula, and is a major port for the region.
Demographics
As of the 2010 census, the population of the Bolivar Peninsula was 5,095. The population is largely white (83.3%), with smaller percentages of African Americans (7.2%), Hispanics (6.2%), and Asians (2.2%). The median household income is $45,938, and the median age is 44.
The area is largely rural, with most of the population living in small towns and villages. The largest town on the peninsula is Port Bolivar, with a population of 1,945. Other towns include Crystal Beach, Gilchrist, and High Island.
Common Questions
What is Per Capita Income in Bolivar Peninsula?
Per Capita income in Bolivar Peninsula is $36,821.
What is the Median Family Income in Bolivar Peninsula?
Median Family Income in Bolivar Peninsula is $77,222.
What is the Median Household income in Bolivar Peninsula?
Median Household Income in Bolivar Peninsula is $62,207.
What is Income or Wage Gap in Bolivar Peninsula?
Income or Wage Gap in Bolivar Peninsula is 42.0%.
Women in Bolivar Peninsula earn 58.0 cents for every dollar earned by a man.
What is Inequality or Gini Index in Bolivar Peninsula?
Inequality or Gini Index in Bolivar Peninsula is 0.41.
What is the Total Population of Bolivar Peninsula?
Total Population of Bolivar Peninsula is 2,626.
What is the Total Male Population of Bolivar Peninsula?
Total Male Population of Bolivar Peninsula is 1,160.
What is the Total Female Population of Bolivar Peninsula?
Total Female Population of Bolivar Peninsula is 1,466.
What is the Ratio of Males per 100 Females in Bolivar Peninsula?
There are 79.13 Males per 100 Females in Bolivar Peninsula.
What is the Ratio of Females per 100 Males in Bolivar Peninsula?
There are 126.38 Females per 100 Males in Bolivar Peninsula.
What is the Median Population Age in Bolivar Peninsula?
Median Population Age in Bolivar Peninsula is 64.9 Years.
What is the Average Family Size in Bolivar Peninsula
Average Family Size in Bolivar Peninsula is 2.3 People.
What is the Average Household Size in Bolivar Peninsula
Average Household Size in Bolivar Peninsula is 1.8 People.
How Large is the Labor Force in Bolivar Peninsula?
There are 915 People in the Labor Forcein in Bolivar Peninsula.
What is the Percentage of People in the Labor Force in Bolivar Peninsula?
36.7% of People are in the Labor Force in Bolivar Peninsula.