Zip Codes with the Highest Percentage of Population Employed in Administrative & Support Services in Baytown, TX
RELATED REPORTS & OPTIONS
Administrative & Support Services
Baytown
Compare Zip Codes
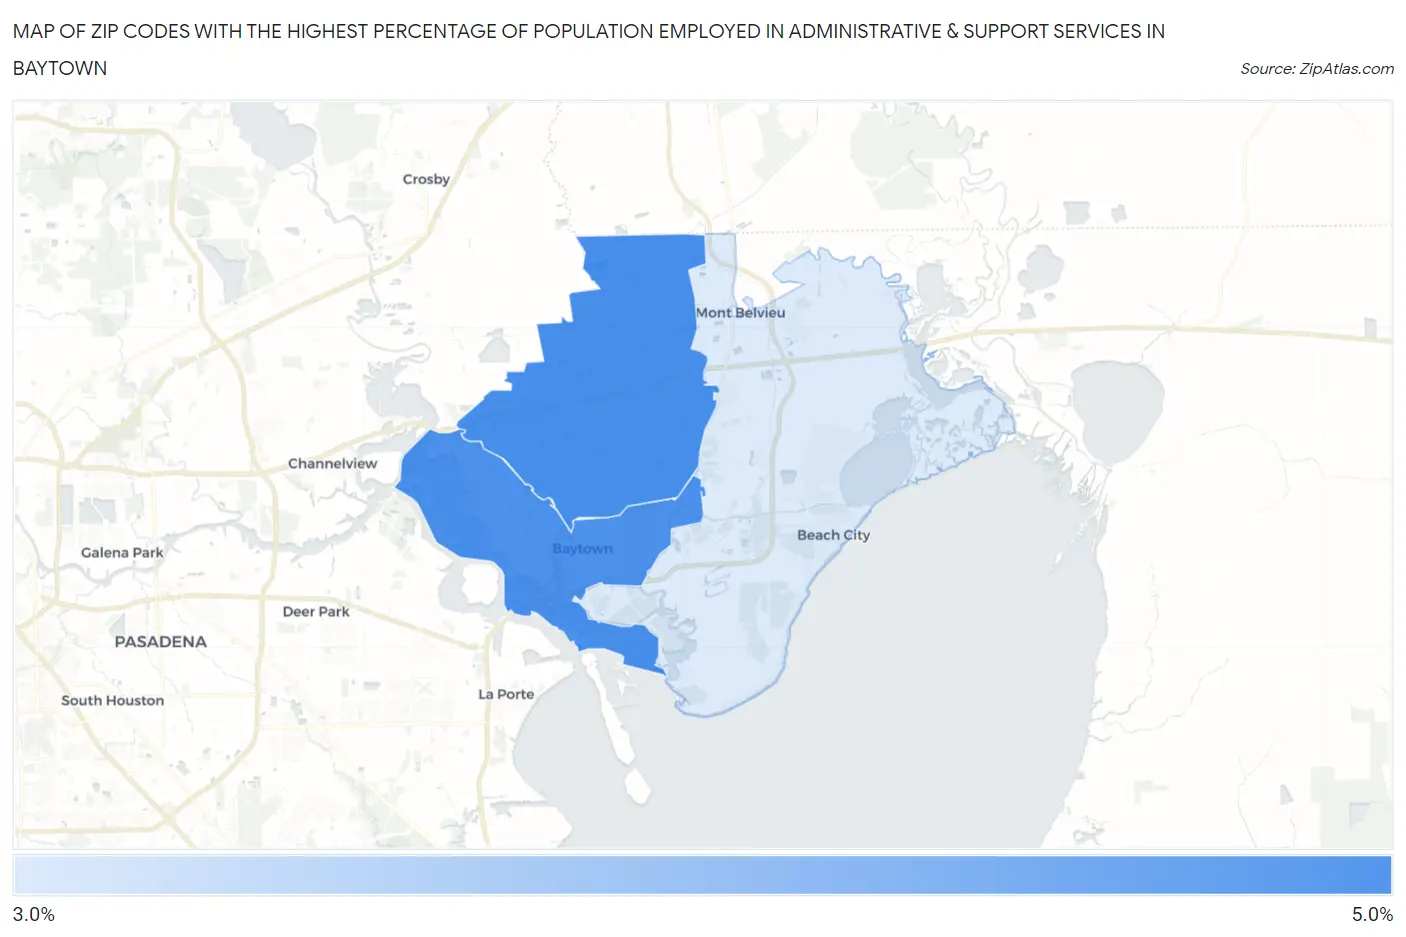
Map of Zip Codes with the Highest Percentage of Population Employed in Administrative & Support Services in Baytown
3.1%
4.1%
Zip Codes with the Highest Percentage of Population Employed in Administrative & Support Services in Baytown, TX
| Zip Code | % Employed | vs State | vs National | |
| 1. | 77521 | 4.1% | 4.4%(-0.347)#730 | 4.1%(-0.081)#10,380 |
| 2. | 77520 | 4.0% | 4.4%(-0.378)#737 | 4.1%(-0.112)#10,524 |
| 3. | 77523 | 3.1% | 4.4%(-1.35)#1,013 | 4.1%(-1.08)#15,158 |
1
Common Questions
What are the Top Zip Codes with the Highest Percentage of Population Employed in Administrative & Support Services in Baytown, TX?
Top Zip Codes with the Highest Percentage of Population Employed in Administrative & Support Services in Baytown, TX are:
What zip code has the Highest Percentage of Population Employed in Administrative & Support Services in Baytown, TX?
77521 has the Highest Percentage of Population Employed in Administrative & Support Services in Baytown, TX with 4.1%.
What is the Percentage of Population Employed in Administrative & Support Services in Baytown, TX?
Percentage of Population Employed in Administrative & Support Services in Baytown is 4.3%.
What is the Percentage of Population Employed in Administrative & Support Services in Texas?
Percentage of Population Employed in Administrative & Support Services in Texas is 4.4%.
What is the Percentage of Population Employed in Administrative & Support Services in the United States?
Percentage of Population Employed in Administrative & Support Services in the United States is 4.1%.