Rosharon, TX Map & Demographics
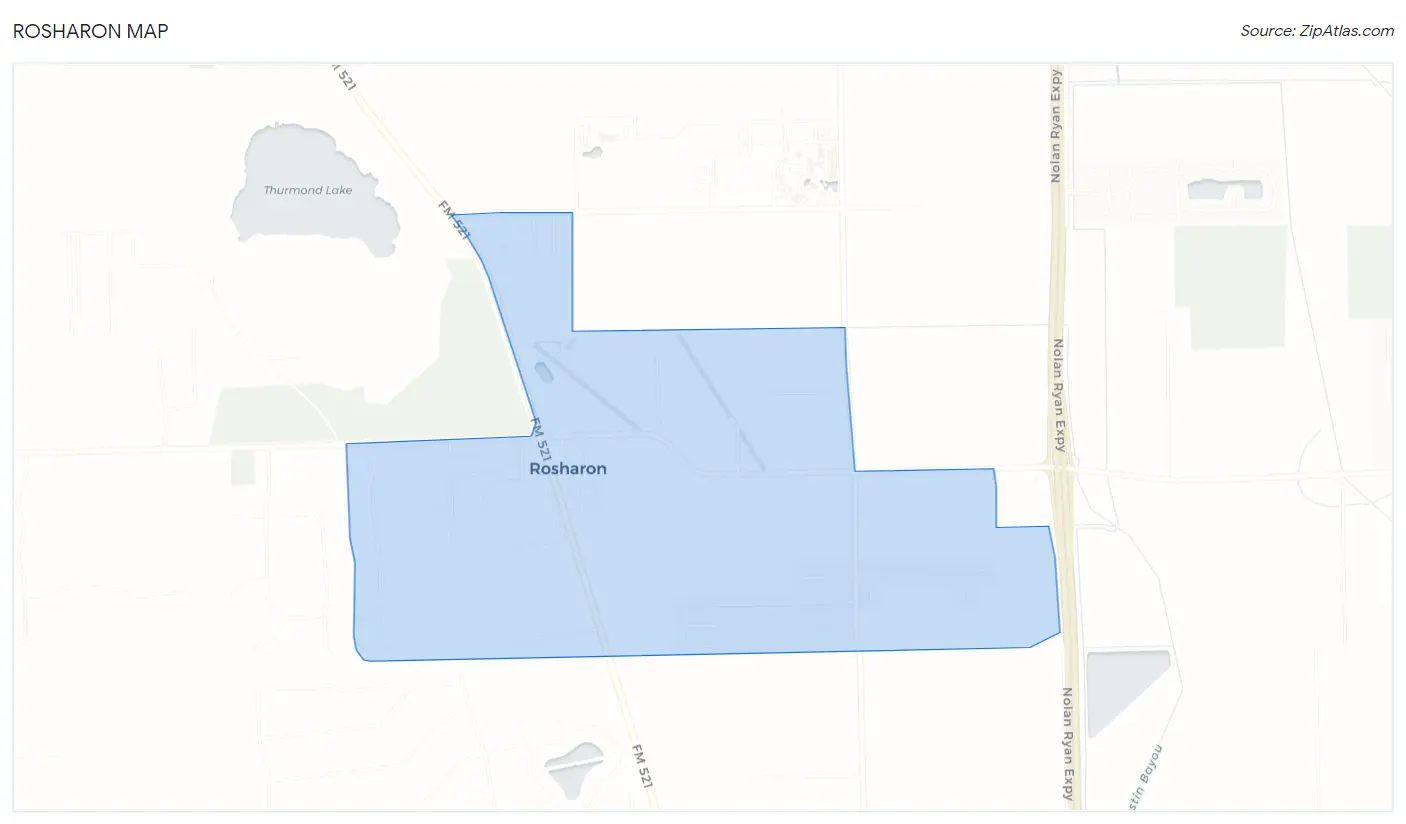
Rosharon Map
Rosharon Overview
$29,894
PER CAPITA INCOME
$95,890
AVG FAMILY INCOME
$83,708
AVG HOUSEHOLD INCOME
35.9%
WAGE / INCOME GAP [ % ]
64.1¢/ $1
WAGE / INCOME GAP [ $ ]
0.25
INEQUALITY / GINI INDEX
1,689
TOTAL POPULATION
828
MALE POPULATION
861
FEMALE POPULATION
96.17
MALES / 100 FEMALES
103.99
FEMALES / 100 MALES
52.1
MEDIAN AGE
3.7
AVG FAMILY SIZE
3.0
AVG HOUSEHOLD SIZE
809
LABOR FORCE [ PEOPLE ]
55.2%
PERCENT IN LABOR FORCE
36.6%
UNEMPLOYMENT RATE
Rosharon Zip Codes
Income in Rosharon
Income Overview in Rosharon
Per Capita Income in Rosharon is $29,894, while median incomes of families and households are $95,890 and $83,708 respectively.
| Characteristic | Number | Measure |
| Per Capita Income | 1,689 | $29,894 |
| Median Family Income | 391 | $95,890 |
| Mean Family Income | 391 | $82,072 |
| Median Household Income | 553 | $83,708 |
| Mean Household Income | 553 | $74,663 |
| Income Deficit | 391 | $0 |
| Wage / Income Gap (%) | 1,689 | 35.92% |
| Wage / Income Gap ($) | 1,689 | 64.08¢ per $1 |
| Gini / Inequality Index | 1,689 | 0.25 |
Earnings by Sex in Rosharon
Average Earnings in Rosharon are $65,431, $66,005 for men and $42,297 for women, a difference of 35.9%.
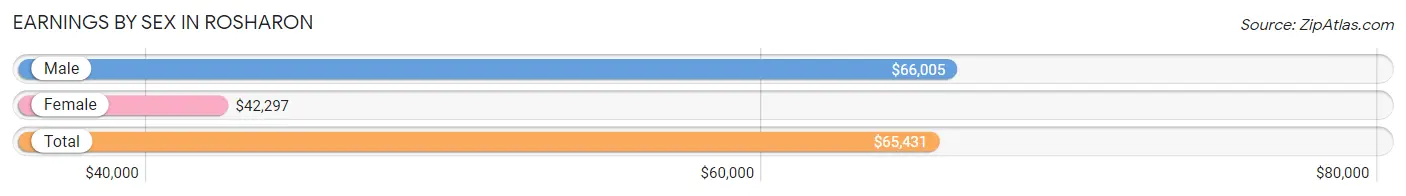
| Sex | Number | Average Earnings |
| Male | 661 (81.7%) | $66,005 |
| Female | 148 (18.3%) | $42,297 |
| Total | 809 (100.0%) | $65,431 |
Earnings by Sex by Income Bracket in Rosharon
The most common earnings brackets in Rosharon are $65,000 to $74,999 for men (400 | 60.5%) and $50,000 to $54,999 for women (61 | 41.2%).
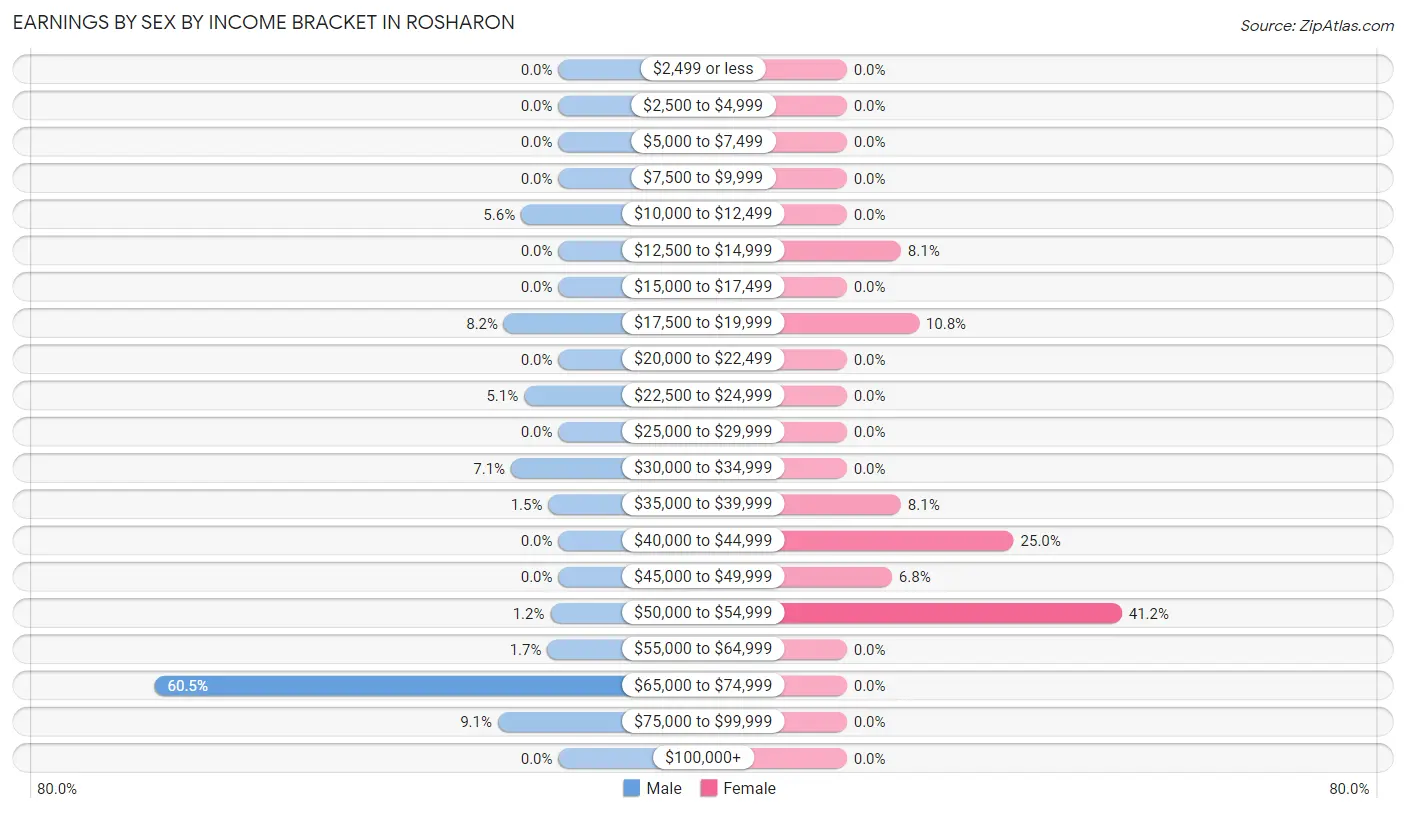
| Income | Male | Female |
| $2,499 or less | 0 (0.0%) | 0 (0.0%) |
| $2,500 to $4,999 | 0 (0.0%) | 0 (0.0%) |
| $5,000 to $7,499 | 0 (0.0%) | 0 (0.0%) |
| $7,500 to $9,999 | 0 (0.0%) | 0 (0.0%) |
| $10,000 to $12,499 | 37 (5.6%) | 0 (0.0%) |
| $12,500 to $14,999 | 0 (0.0%) | 12 (8.1%) |
| $15,000 to $17,499 | 0 (0.0%) | 0 (0.0%) |
| $17,500 to $19,999 | 54 (8.2%) | 16 (10.8%) |
| $20,000 to $22,499 | 0 (0.0%) | 0 (0.0%) |
| $22,500 to $24,999 | 34 (5.1%) | 0 (0.0%) |
| $25,000 to $29,999 | 0 (0.0%) | 0 (0.0%) |
| $30,000 to $34,999 | 47 (7.1%) | 0 (0.0%) |
| $35,000 to $39,999 | 10 (1.5%) | 12 (8.1%) |
| $40,000 to $44,999 | 0 (0.0%) | 37 (25.0%) |
| $45,000 to $49,999 | 0 (0.0%) | 10 (6.8%) |
| $50,000 to $54,999 | 8 (1.2%) | 61 (41.2%) |
| $55,000 to $64,999 | 11 (1.7%) | 0 (0.0%) |
| $65,000 to $74,999 | 400 (60.5%) | 0 (0.0%) |
| $75,000 to $99,999 | 60 (9.1%) | 0 (0.0%) |
| $100,000+ | 0 (0.0%) | 0 (0.0%) |
| Total | 661 (100.0%) | 148 (100.0%) |
Earnings by Sex by Educational Attainment in Rosharon
Average earnings in Rosharon are $66,005 for men and $42,297 for women, a difference of 35.9%. Men with an educational attainment of high school diploma enjoy the highest average annual earnings of $65,192, while those with high school diploma education earn the least with $65,192. Women with an educational attainment of college or associate's degree earn the most with the average annual earnings of $36,667, while those with college or associate's degree education have the smallest earnings of $36,667.
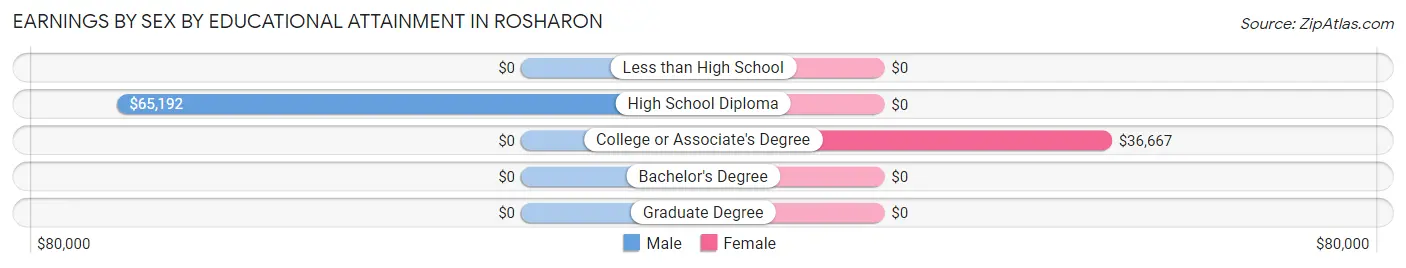
| Educational Attainment | Male Income | Female Income |
| Less than High School | - | - |
| High School Diploma | $65,192 | $0 |
| College or Associate's Degree | - | - |
| Bachelor's Degree | - | - |
| Graduate Degree | - | - |
| Total | $66,005 | $42,297 |
Family Income in Rosharon
Family Income Brackets in Rosharon
According to the Rosharon family income data, there are 184 families falling into the $75,000 to $99,999 income range, which is the most common income bracket and makes up 47.1% of all families.
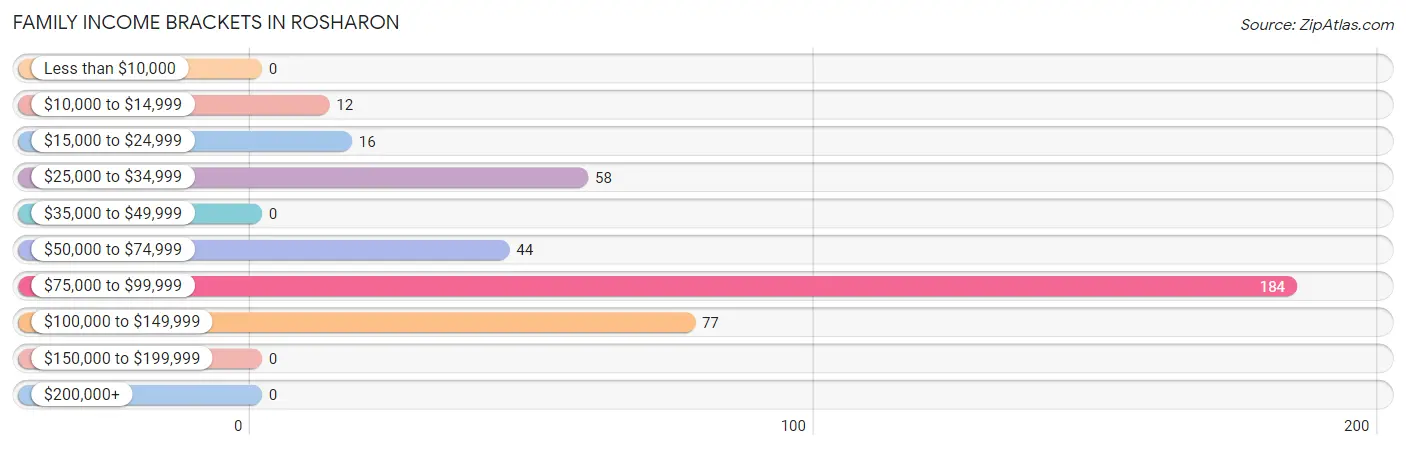
| Income Bracket | # Families | % Families |
| Less than $10,000 | 0 | 0.0% |
| $10,000 to $14,999 | 12 | 3.1% |
| $15,000 to $24,999 | 16 | 4.1% |
| $25,000 to $34,999 | 58 | 14.8% |
| $35,000 to $49,999 | 0 | 0.0% |
| $50,000 to $74,999 | 44 | 11.3% |
| $75,000 to $99,999 | 184 | 47.1% |
| $100,000 to $149,999 | 77 | 19.7% |
| $150,000 to $199,999 | 0 | 0.0% |
| $200,000+ | 0 | 0.0% |
Family Income by Famaliy Size in Rosharon
4-person families (108 | 27.6%) account for the highest median family income in Rosharon with $66,081 per family, while 4-person families (108 | 27.6%) have the highest median income of $16,520 per family member.
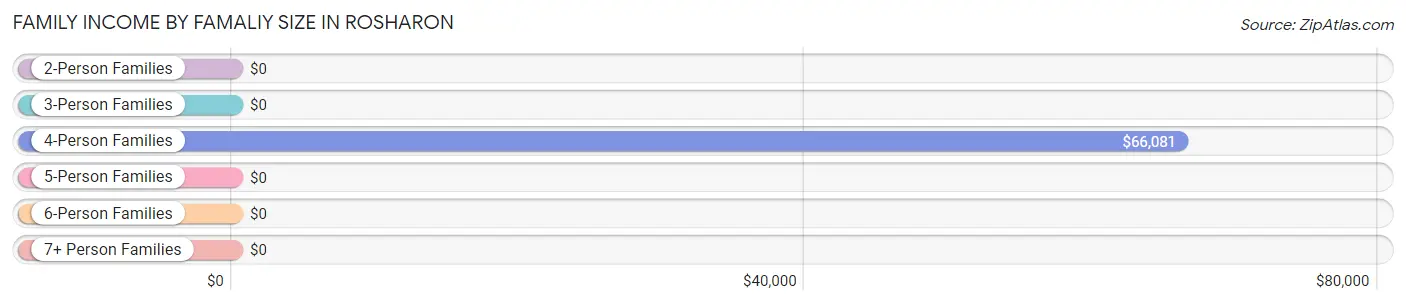
| Income Bracket | # Families | Median Income |
| 2-Person Families | 57 (14.6%) | $0 |
| 3-Person Families | 184 (47.1%) | $0 |
| 4-Person Families | 108 (27.6%) | $66,081 |
| 5-Person Families | 42 (10.7%) | $0 |
| 6-Person Families | 0 (0.0%) | $0 |
| 7+ Person Families | 0 (0.0%) | $0 |
| Total | 391 (100.0%) | $95,890 |
Family Income by Number of Earners in Rosharon
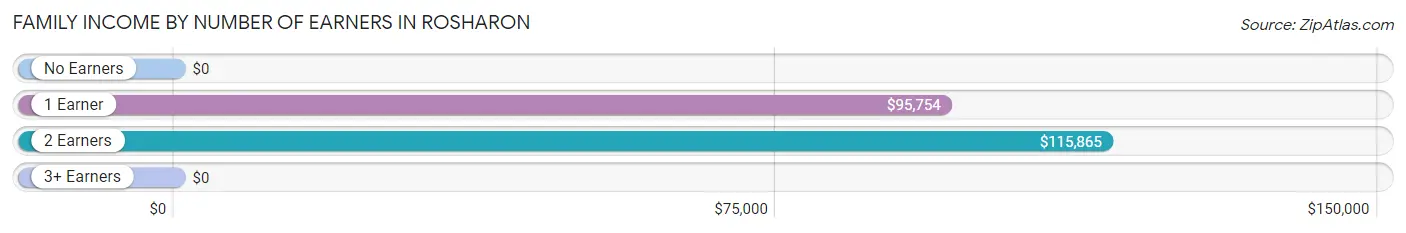
| Number of Earners | # Families | Median Income |
| No Earners | 20 (5.1%) | $0 |
| 1 Earner | 257 (65.7%) | $95,754 |
| 2 Earners | 114 (29.2%) | $115,865 |
| 3+ Earners | 0 (0.0%) | $0 |
| Total | 391 (100.0%) | $95,890 |
Household Income in Rosharon
Household Income Brackets in Rosharon
With 251 households falling in the category, the $75,000 to $99,999 income range is the most frequent in Rosharon, accounting for 45.4% of all households.
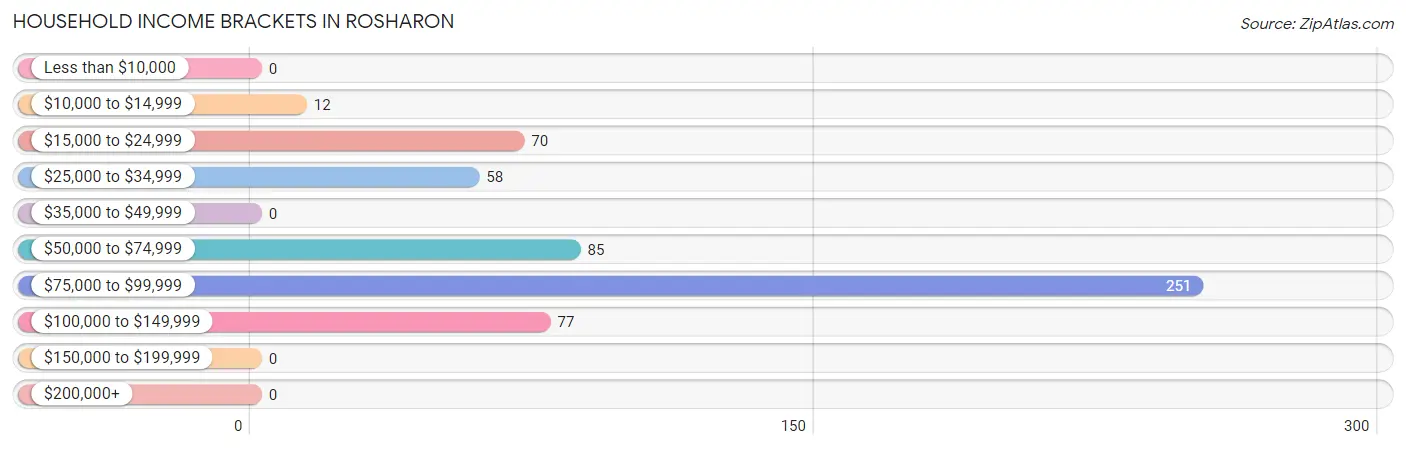
| Income Bracket | # Households | % Households |
| Less than $10,000 | 0 | 0.0% |
| $10,000 to $14,999 | 12 | 2.2% |
| $15,000 to $24,999 | 70 | 12.7% |
| $25,000 to $34,999 | 58 | 10.5% |
| $35,000 to $49,999 | 0 | 0.0% |
| $50,000 to $74,999 | 85 | 15.4% |
| $75,000 to $99,999 | 251 | 45.4% |
| $100,000 to $149,999 | 77 | 13.9% |
| $150,000 to $199,999 | 0 | 0.0% |
| $200,000+ | 0 | 0.0% |
Household Income by Householder Age in Rosharon
The median household income in Rosharon is $83,708, with the highest median household income of $95,550 found in the 45 to 64 years age bracket for the primary householder. A total of 329 households (59.5%) fall into this category.
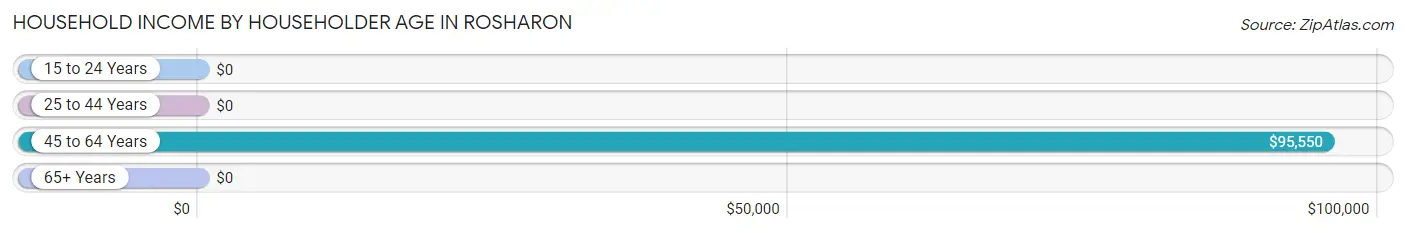
| Income Bracket | # Households | Median Income |
| 15 to 24 Years | 0 (0.0%) | $0 |
| 25 to 44 Years | 204 (36.9%) | $0 |
| 45 to 64 Years | 329 (59.5%) | $95,550 |
| 65+ Years | 20 (3.6%) | $0 |
| Total | 553 (100.0%) | $83,708 |
Poverty in Rosharon
Income Below Poverty by Sex and Age in Rosharon
With 7.7% poverty level for males and 12.0% for females among the residents of Rosharon, 16 and 17 year old males and 12 to 14 year old females are the most vulnerable to poverty, with 14 males (100.0%) and 13 females (100.0%) in their respective age groups living below the poverty level.
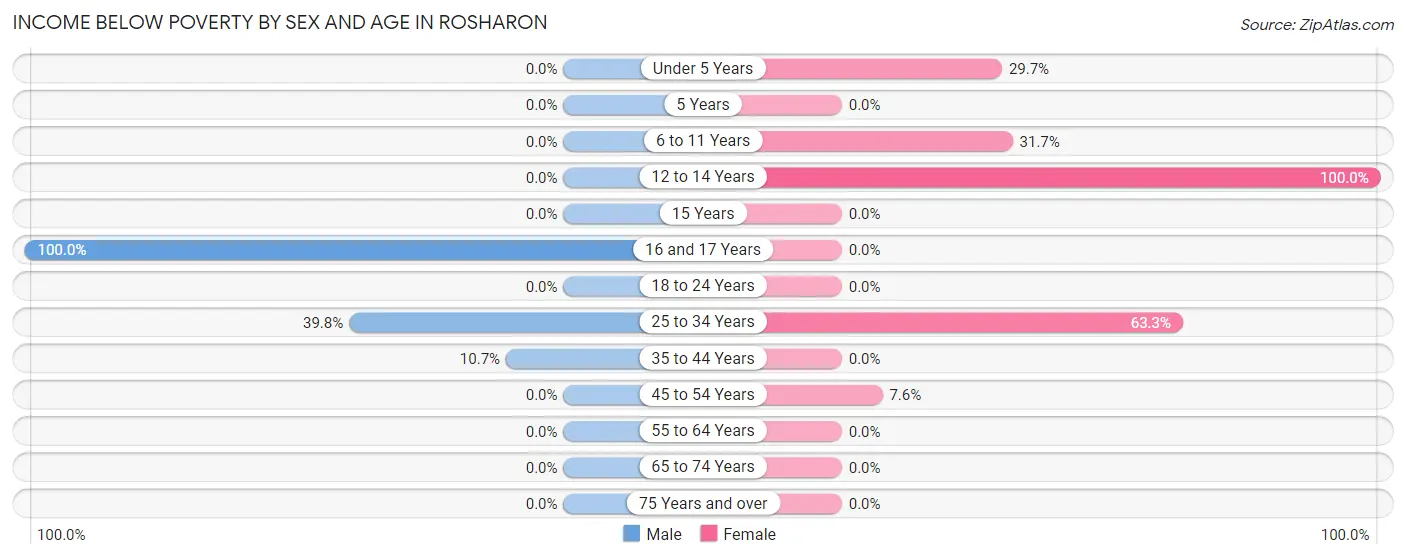
| Age Bracket | Male | Female |
| Under 5 Years | 0 (0.0%) | 11 (29.7%) |
| 5 Years | 0 (0.0%) | 0 (0.0%) |
| 6 to 11 Years | 0 (0.0%) | 13 (31.7%) |
| 12 to 14 Years | 0 (0.0%) | 13 (100.0%) |
| 15 Years | 0 (0.0%) | 0 (0.0%) |
| 16 and 17 Years | 14 (100.0%) | 0 (0.0%) |
| 18 to 24 Years | 0 (0.0%) | 0 (0.0%) |
| 25 to 34 Years | 37 (39.8%) | 50 (63.3%) |
| 35 to 44 Years | 13 (10.7%) | 0 (0.0%) |
| 45 to 54 Years | 0 (0.0%) | 16 (7.5%) |
| 55 to 64 Years | 0 (0.0%) | 0 (0.0%) |
| 65 to 74 Years | 0 (0.0%) | 0 (0.0%) |
| 75 Years and over | 0 (0.0%) | 0 (0.0%) |
| Total | 64 (7.7%) | 103 (12.0%) |
Income Above Poverty by Sex and Age in Rosharon
According to the poverty statistics in Rosharon, males aged 6 to 11 years and females aged 15 years are the age groups that are most secure financially, with 100.0% of males and 100.0% of females in these age groups living above the poverty line.
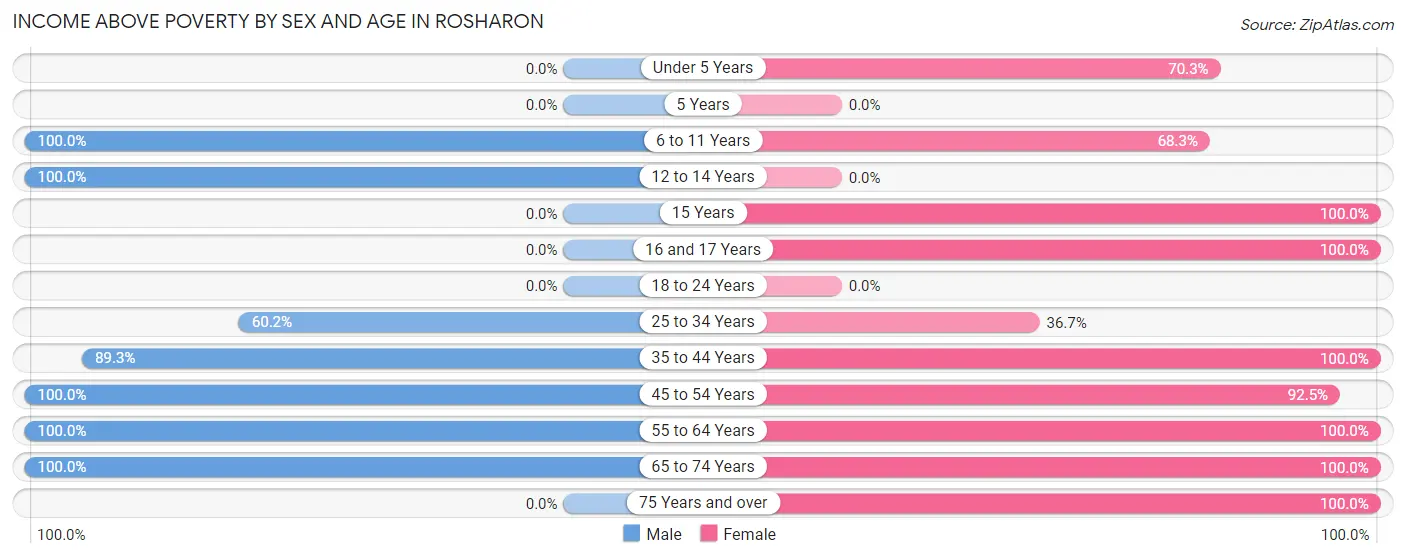
| Age Bracket | Male | Female |
| Under 5 Years | 0 (0.0%) | 26 (70.3%) |
| 5 Years | 0 (0.0%) | 0 (0.0%) |
| 6 to 11 Years | 94 (100.0%) | 28 (68.3%) |
| 12 to 14 Years | 31 (100.0%) | 0 (0.0%) |
| 15 Years | 0 (0.0%) | 8 (100.0%) |
| 16 and 17 Years | 0 (0.0%) | 71 (100.0%) |
| 18 to 24 Years | 0 (0.0%) | 0 (0.0%) |
| 25 to 34 Years | 56 (60.2%) | 29 (36.7%) |
| 35 to 44 Years | 109 (89.3%) | 114 (100.0%) |
| 45 to 54 Years | 78 (100.0%) | 196 (92.4%) |
| 55 to 64 Years | 381 (100.0%) | 107 (100.0%) |
| 65 to 74 Years | 15 (100.0%) | 20 (100.0%) |
| 75 Years and over | 0 (0.0%) | 159 (100.0%) |
| Total | 764 (92.3%) | 758 (88.0%) |
Income Below Poverty Among Married-Couple Families in Rosharon
The poverty statistics for married-couple families in Rosharon show that 3.5% or 12 of the total 338 families live below the poverty line. Families with 3 or 4 children have the highest poverty rate of 28.6%, comprising of 12 families. On the other hand, families with no children have the lowest poverty rate of 0.0%, which includes 0 families.
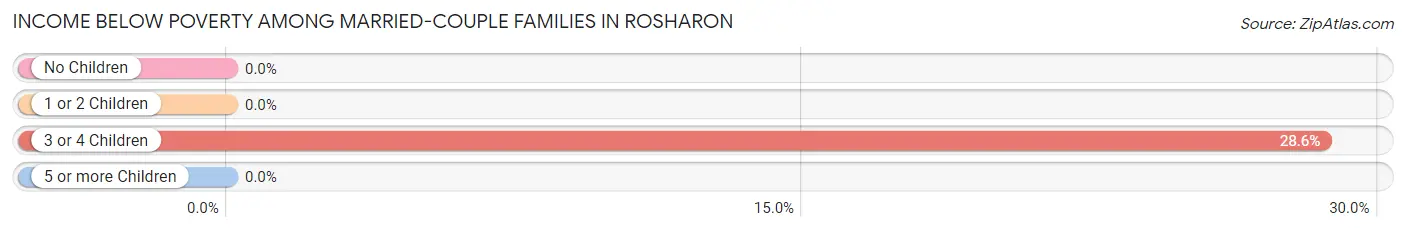
| Children | Above Poverty | Below Poverty |
| No Children | 225 (100.0%) | 0 (0.0%) |
| 1 or 2 Children | 71 (100.0%) | 0 (0.0%) |
| 3 or 4 Children | 30 (71.4%) | 12 (28.6%) |
| 5 or more Children | 0 (0.0%) | 0 (0.0%) |
| Total | 326 (96.5%) | 12 (3.5%) |
Income Below Poverty Among Single-Parent Households in Rosharon
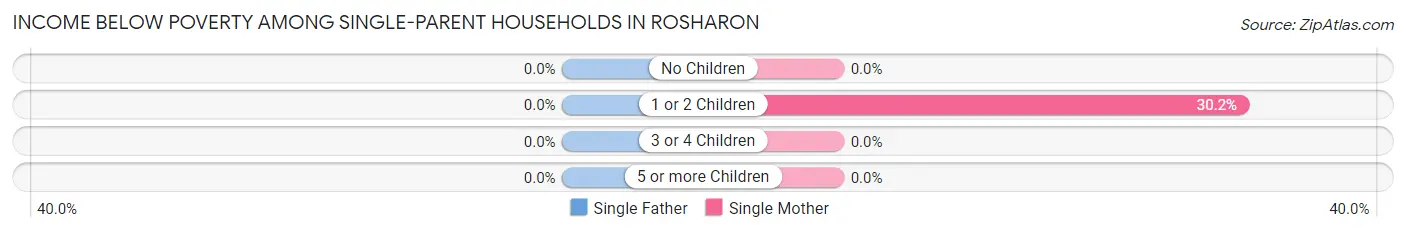
| Children | Single Father | Single Mother |
| No Children | 0 (0.0%) | 0 (0.0%) |
| 1 or 2 Children | 0 (0.0%) | 16 (30.2%) |
| 3 or 4 Children | 0 (0.0%) | 0 (0.0%) |
| 5 or more Children | 0 (0.0%) | 0 (0.0%) |
| Total | 0 (0.0%) | 16 (30.2%) |
Income Below Poverty Among Married-Couple vs Single-Parent Households in Rosharon
The poverty data for Rosharon shows that 12 of the married-couple family households (3.5%) and 16 of the single-parent households (30.2%) are living below the poverty level. Within the married-couple family households, those with 3 or 4 children have the highest poverty rate, with 12 households (28.6%) falling below the poverty line. Among the single-parent households, those with 1 or 2 children have the highest poverty rate, with 16 household (30.2%) living below poverty.
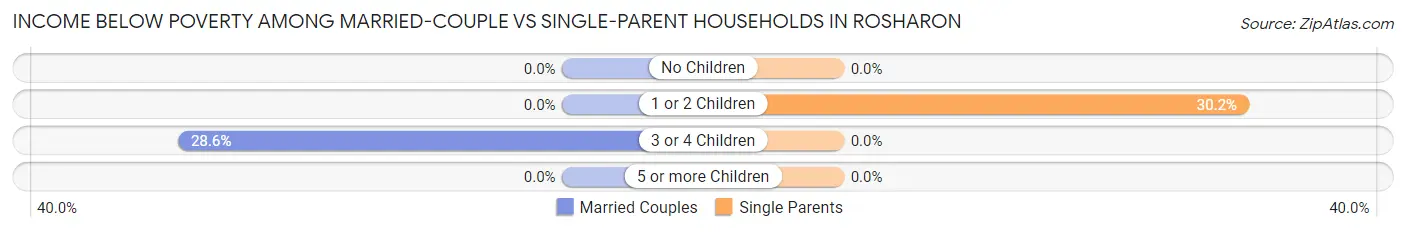
| Children | Married-Couple Families | Single-Parent Households |
| No Children | 0 (0.0%) | 0 (0.0%) |
| 1 or 2 Children | 0 (0.0%) | 16 (30.2%) |
| 3 or 4 Children | 12 (28.6%) | 0 (0.0%) |
| 5 or more Children | 0 (0.0%) | 0 (0.0%) |
| Total | 12 (3.5%) | 16 (30.2%) |
Race in Rosharon
The most populous races in Rosharon are Hispanic or Latino (1,447 | 85.7%), Two or more Races (639 | 37.8%), and White / Caucasian (546 | 32.3%).
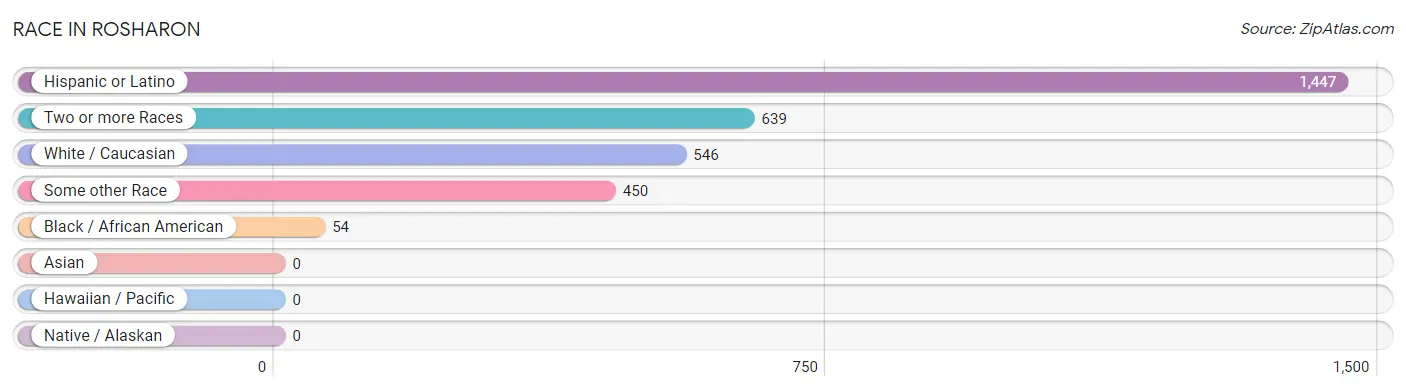
| Race | # Population | % Population |
| Asian | 0 | 0.0% |
| Black / African American | 54 | 3.2% |
| Hawaiian / Pacific | 0 | 0.0% |
| Hispanic or Latino | 1,447 | 85.7% |
| Native / Alaskan | 0 | 0.0% |
| White / Caucasian | 546 | 32.3% |
| Two or more Races | 639 | 37.8% |
| Some other Race | 450 | 26.6% |
| Total | 1,689 | 100.0% |
Ancestry in Rosharon
The most populous ancestries reported in Rosharon are Mexican (1,348 | 79.8%), Irish (92 | 5.4%), Central American (75 | 4.4%), Guatemalan (75 | 4.4%), and Puerto Rican (24 | 1.4%), together accounting for 95.6% of all Rosharon residents.
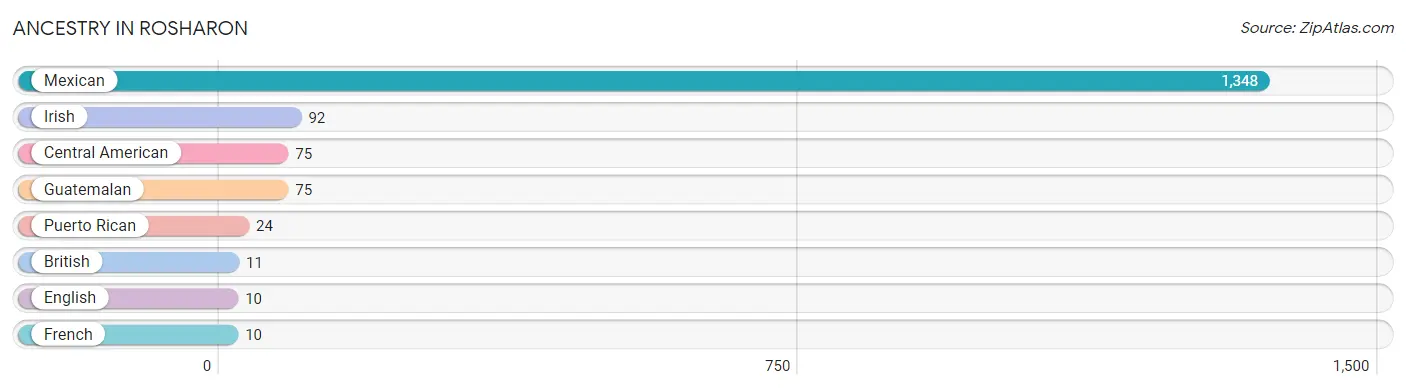
| Ancestry | # Population | % Population |
| British | 11 | 0.6% |
| Central American | 75 | 4.4% |
| English | 10 | 0.6% |
| French | 10 | 0.6% |
| Guatemalan | 75 | 4.4% |
| Irish | 92 | 5.4% |
| Mexican | 1,348 | 79.8% |
| Puerto Rican | 24 | 1.4% | View All 8 Rows |
Immigrants in Rosharon
The most numerous immigrant groups reported in Rosharon came from Central America (367 | 21.7%), Latin America (367 | 21.7%), Mexico (292 | 17.3%), El Salvador (38 | 2.2%), and Guatemala (37 | 2.2%), together accounting for 65.2% of all Rosharon residents.
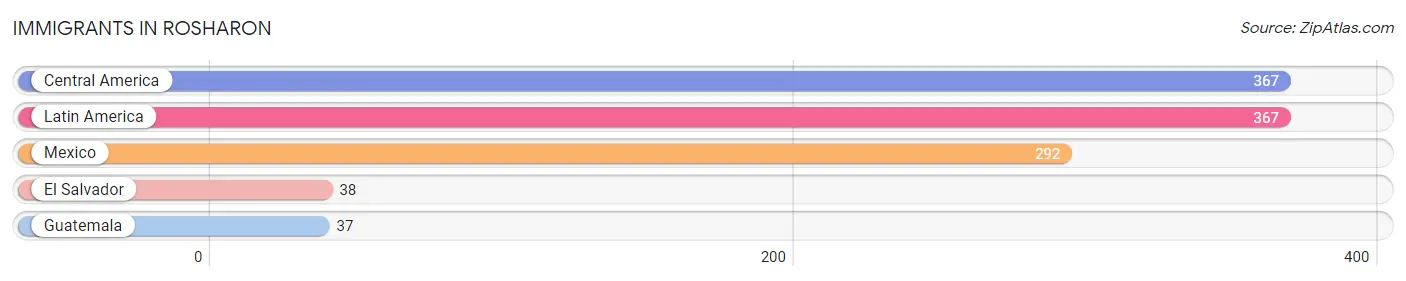
| Immigration Origin | # Population | % Population |
| Central America | 367 | 21.7% |
| El Salvador | 38 | 2.2% |
| Guatemala | 37 | 2.2% |
| Latin America | 367 | 21.7% |
| Mexico | 292 | 17.3% | View All 5 Rows |
Sex and Age in Rosharon
Sex and Age in Rosharon
The most populous age groups in Rosharon are 55 to 59 Years (351 | 42.4%) for men and 50 to 54 Years (184 | 21.4%) for women.
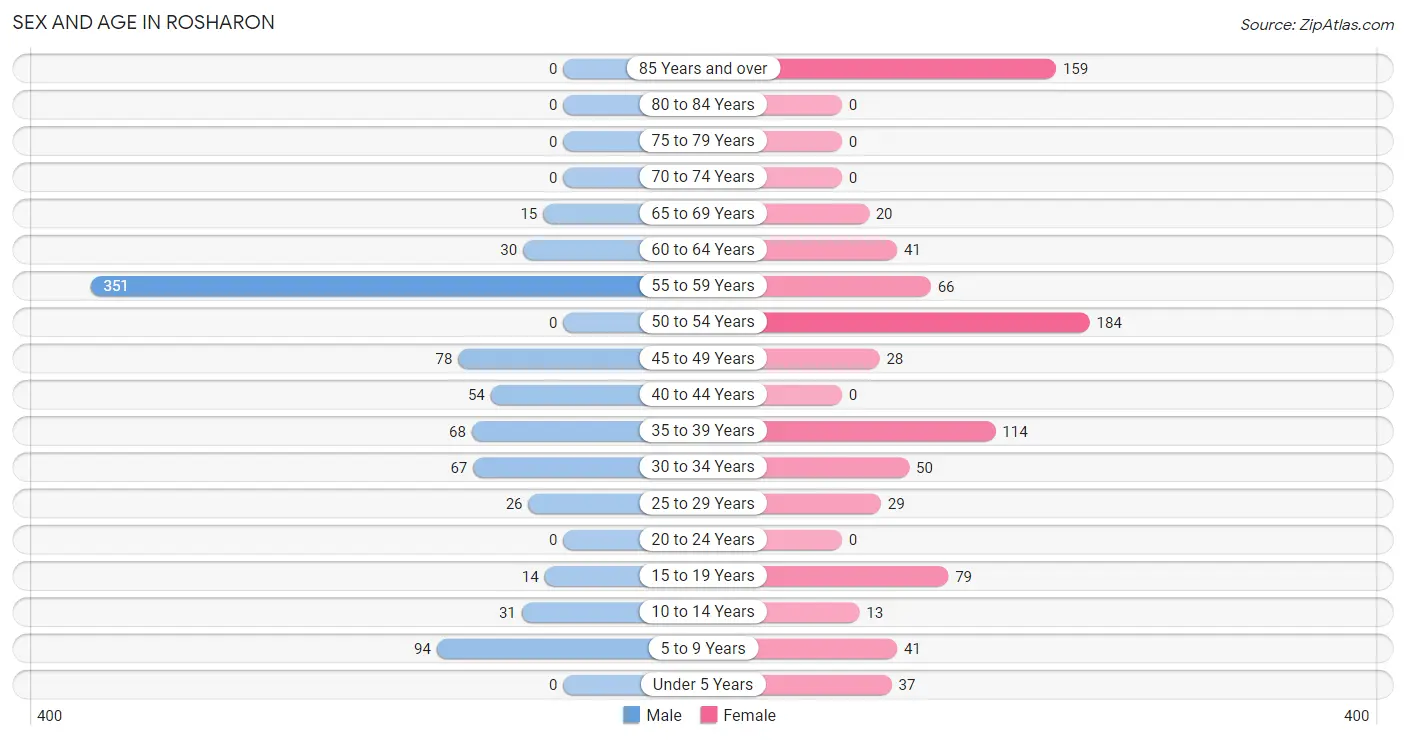
| Age Bracket | Male | Female |
| Under 5 Years | 0 (0.0%) | 37 (4.3%) |
| 5 to 9 Years | 94 (11.4%) | 41 (4.8%) |
| 10 to 14 Years | 31 (3.7%) | 13 (1.5%) |
| 15 to 19 Years | 14 (1.7%) | 79 (9.2%) |
| 20 to 24 Years | 0 (0.0%) | 0 (0.0%) |
| 25 to 29 Years | 26 (3.1%) | 29 (3.4%) |
| 30 to 34 Years | 67 (8.1%) | 50 (5.8%) |
| 35 to 39 Years | 68 (8.2%) | 114 (13.2%) |
| 40 to 44 Years | 54 (6.5%) | 0 (0.0%) |
| 45 to 49 Years | 78 (9.4%) | 28 (3.3%) |
| 50 to 54 Years | 0 (0.0%) | 184 (21.4%) |
| 55 to 59 Years | 351 (42.4%) | 66 (7.7%) |
| 60 to 64 Years | 30 (3.6%) | 41 (4.8%) |
| 65 to 69 Years | 15 (1.8%) | 20 (2.3%) |
| 70 to 74 Years | 0 (0.0%) | 0 (0.0%) |
| 75 to 79 Years | 0 (0.0%) | 0 (0.0%) |
| 80 to 84 Years | 0 (0.0%) | 0 (0.0%) |
| 85 Years and over | 0 (0.0%) | 159 (18.5%) |
| Total | 828 (100.0%) | 861 (100.0%) |
Families and Households in Rosharon
Median Family Size in Rosharon
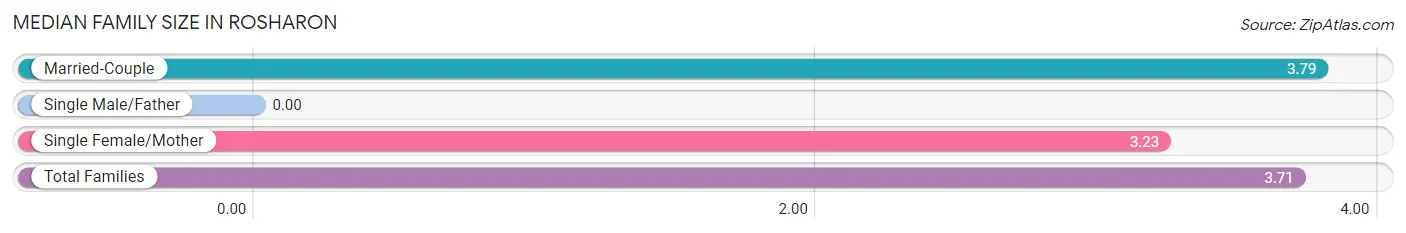
| Family Type | # Families | Family Size |
| Married-Couple | 338 (86.5%) | 3.79 |
| Single Male/Father | 0 (0.0%) | - |
| Single Female/Mother | 53 (13.6%) | 3.23 |
| Total Families | 391 (100.0%) | 3.71 |
Median Household Size in Rosharon
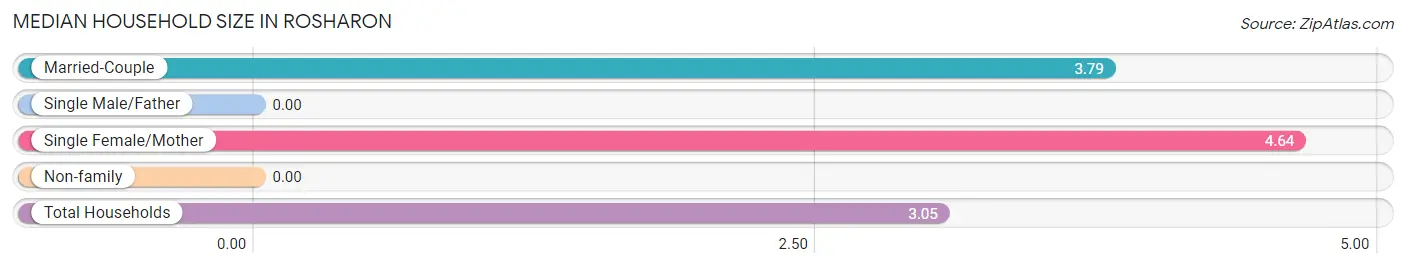
| Household Type | # Households | Household Size |
| Married-Couple | 338 (61.1%) | 3.79 |
| Single Male/Father | 0 (0.0%) | - |
| Single Female/Mother | 53 (9.6%) | 4.64 |
| Non-family | 162 (29.3%) | - |
| Total Households | 553 (100.0%) | 3.05 |
Household Size by Marriage Status in Rosharon
Out of a total of 553 households in Rosharon, 391 (70.7%) are family households, while 162 (29.3%) are nonfamily households. The most numerous type of family households are 3-person households, comprising 184, and the most common type of nonfamily households are 1-person households, comprising 162.
| Household Size | Family Households | Nonfamily Households |
| 1-Person Households | - | 162 (29.3%) |
| 2-Person Households | 57 (10.3%) | 0 (0.0%) |
| 3-Person Households | 184 (33.3%) | 0 (0.0%) |
| 4-Person Households | 71 (12.8%) | 0 (0.0%) |
| 5-Person Households | 42 (7.6%) | 0 (0.0%) |
| 6-Person Households | 37 (6.7%) | 0 (0.0%) |
| 7+ Person Households | 0 (0.0%) | 0 (0.0%) |
| Total | 391 (70.7%) | 162 (29.3%) |
Female Fertility in Rosharon
Fertility by Age in Rosharon
| Age Bracket | Women with Births | Births / 1,000 Women |
| 15 to 19 years | 0 (0.0%) | 0.0 |
| 20 to 34 years | 0 (0.0%) | 0.0 |
| 35 to 50 years | 0 (0.0%) | 0.0 |
| Total | 0 (0.0%) | 0.0 |
Fertility by Age by Marriage Status in Rosharon
| Age Bracket | Married | Unmarried |
| 15 to 19 years | 0 (0.0%) | 0 (0.0%) |
| 20 to 34 years | 0 (0.0%) | 0 (0.0%) |
| 35 to 50 years | 0 (0.0%) | 0 (0.0%) |
| Total | 0 (0.0%) | 0 (0.0%) |
Fertility by Education in Rosharon
| Educational Attainment | Women with Births | Births / 1,000 Women |
| Less than High School | 0 (0.0%) | 0.0 |
| High School Diploma | 0 (0.0%) | 0.0 |
| College or Associate's Degree | 0 (0.0%) | 0.0 |
| Bachelor's Degree | 0 (0.0%) | 0.0 |
| Graduate Degree | 0 (0.0%) | 0.0 |
| Total | 0 (0.0%) | 0.0 |
Fertility by Education by Marriage Status in Rosharon
| Educational Attainment | Married | Unmarried |
| Less than High School | 0 (0.0%) | 0 (0.0%) |
| High School Diploma | 0 (0.0%) | 0 (0.0%) |
| College or Associate's Degree | 0 (0.0%) | 0 (0.0%) |
| Bachelor's Degree | 0 (0.0%) | 0 (0.0%) |
| Graduate Degree | 0 (0.0%) | 0 (0.0%) |
| Total | 0 (0.0%) | 0 (0.0%) |
Employment Characteristics in Rosharon
Employment by Class of Employer in Rosharon
Among the 513 employed individuals in Rosharon, private company employees (308 | 60.0%), self-employed (not incorporated) (162 | 31.6%), and state government employees (33 | 6.4%) make up the most common classes of employment.
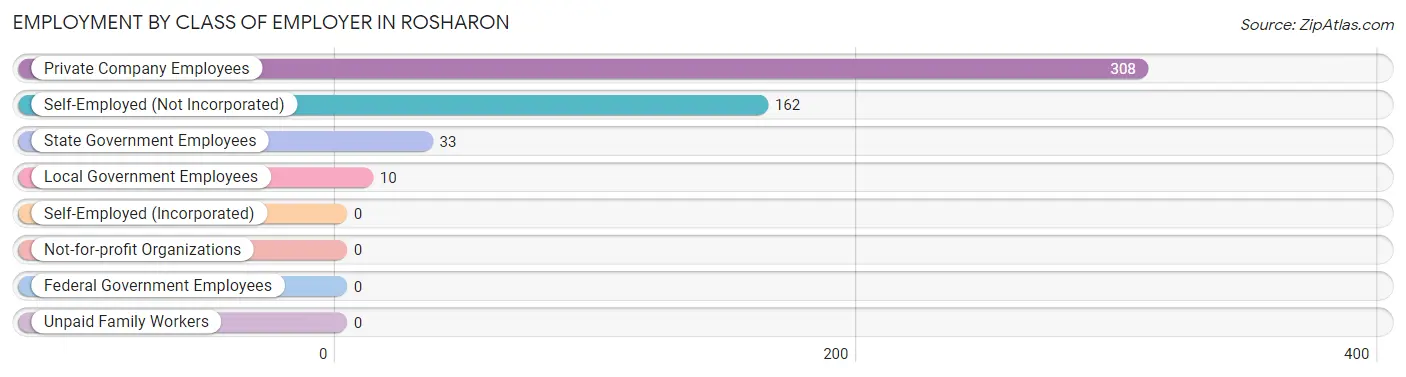
| Employer Class | # Employees | % Employees |
| Private Company Employees | 308 | 60.0% |
| Self-Employed (Incorporated) | 0 | 0.0% |
| Self-Employed (Not Incorporated) | 162 | 31.6% |
| Not-for-profit Organizations | 0 | 0.0% |
| Local Government Employees | 10 | 1.9% |
| State Government Employees | 33 | 6.4% |
| Federal Government Employees | 0 | 0.0% |
| Unpaid Family Workers | 0 | 0.0% |
| Total | 513 | 100.0% |
Employment Status by Age in Rosharon
According to the labor force statistics for Rosharon, out of the total population over 16 years of age (1,465), 55.2% or 809 individuals are in the labor force, with 36.6% or 296 of them unemployed. The age group with the highest labor force participation rate is 25 to 29 years, with 100.0% or 55 individuals in the labor force. Within the labor force, the 55 to 59 years age range has the highest percentage of unemployed individuals, with 84.3% or 296 of them being unemployed.
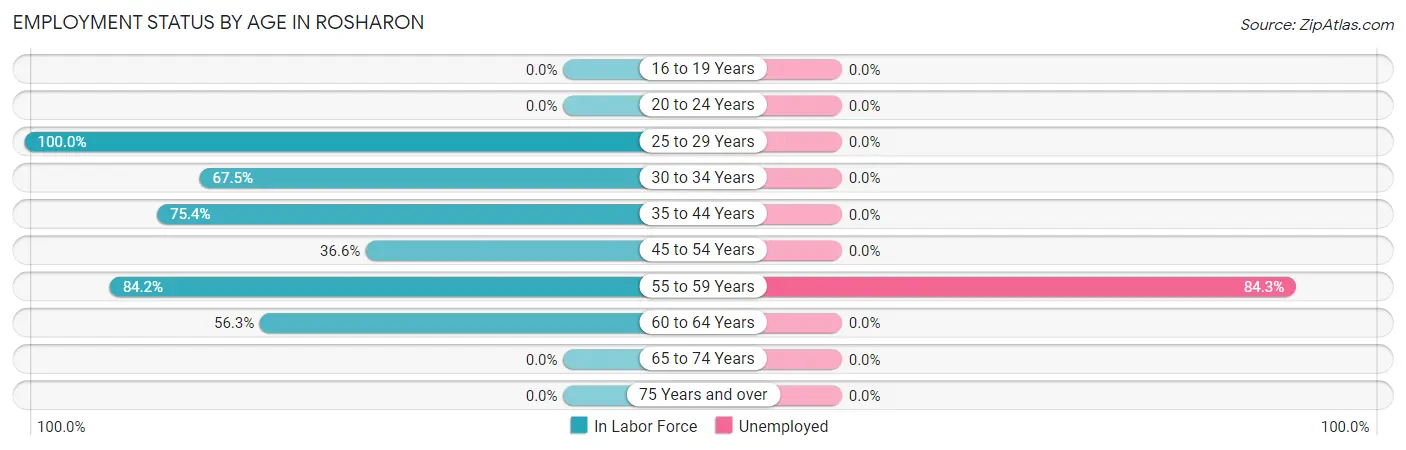
| Age Bracket | In Labor Force | Unemployed |
| 16 to 19 Years | 0 (0.0%) | 0 (0.0%) |
| 20 to 24 Years | 0 (0.0%) | 0 (0.0%) |
| 25 to 29 Years | 55 (100.0%) | 0 (0.0%) |
| 30 to 34 Years | 79 (67.5%) | 0 (0.0%) |
| 35 to 44 Years | 178 (75.4%) | 0 (0.0%) |
| 45 to 54 Years | 106 (36.6%) | 0 (0.0%) |
| 55 to 59 Years | 351 (84.2%) | 296 (84.3%) |
| 60 to 64 Years | 40 (56.3%) | 0 (0.0%) |
| 65 to 74 Years | 0 (0.0%) | 0 (0.0%) |
| 75 Years and over | 0 (0.0%) | 0 (0.0%) |
| Total | 809 (55.2%) | 296 (36.6%) |
Employment Status by Educational Attainment in Rosharon
According to labor force statistics for Rosharon, 68.2% of individuals (809) out of the total population between 25 and 64 years of age (1,186) are in the labor force, with 36.6% or 296 of them being unemployed. The group with the highest labor force participation rate are those with the educational attainment of college / associate degree, with 95.2% or 139 individuals in the labor force. Within the labor force, individuals with less than high school education have the highest percentage of unemployment, with 80.7% or 296 of them being unemployed.
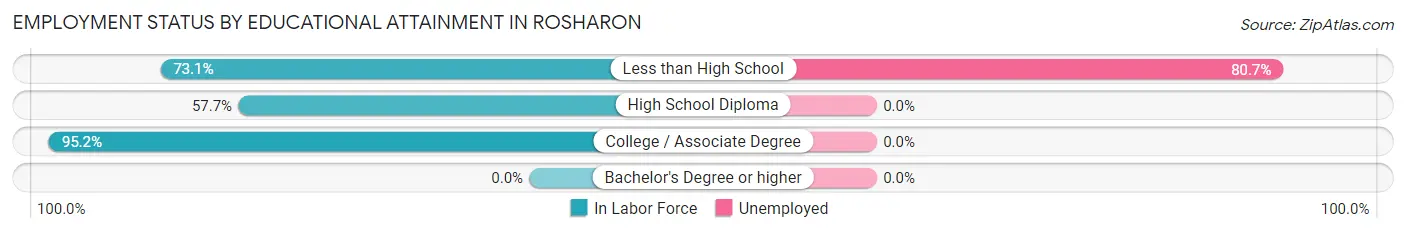
| Educational Attainment | In Labor Force | Unemployed |
| Less than High School | 367 (73.1%) | 405 (80.7%) |
| High School Diploma | 303 (57.7%) | 0 (0.0%) |
| College / Associate Degree | 139 (95.2%) | 0 (0.0%) |
| Bachelor's Degree or higher | 0 (0.0%) | 0 (0.0%) |
| Total | 809 (68.2%) | 434 (36.6%) |
Employment Occupations by Sex in Rosharon
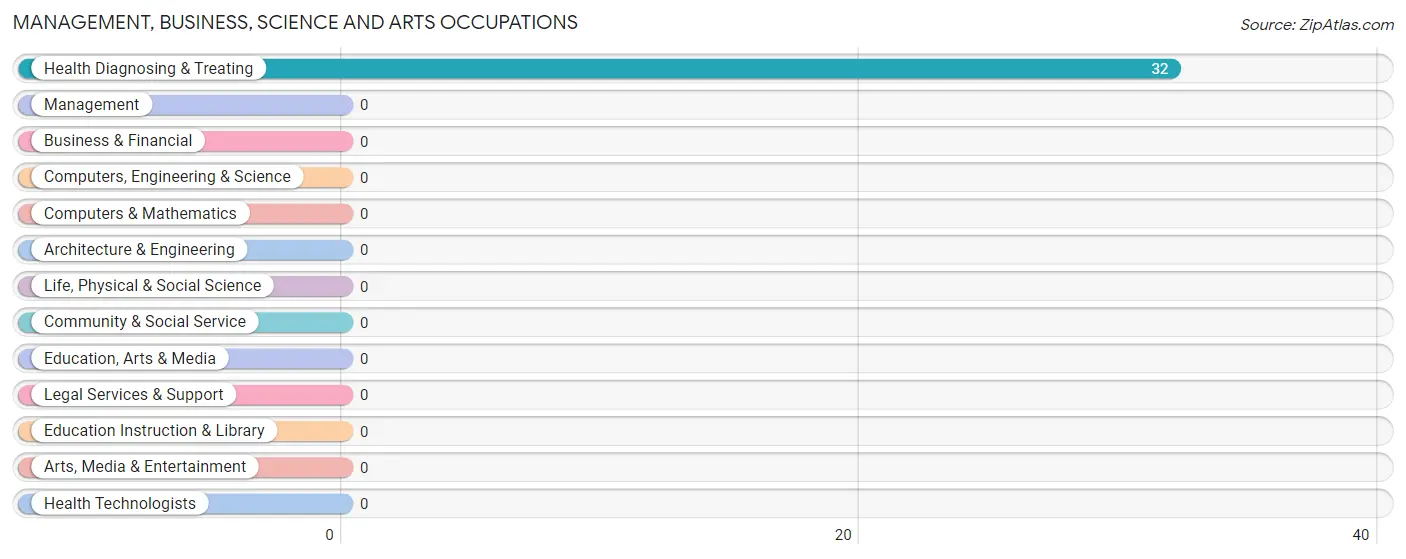
Management, Business, Science and Arts Occupations
The most common Management, Business, Science and Arts occupations in Rosharon are , and Health Diagnosing & Treating (32 | 6.2%).
Management, Business, Science and Arts Occupations by Sex
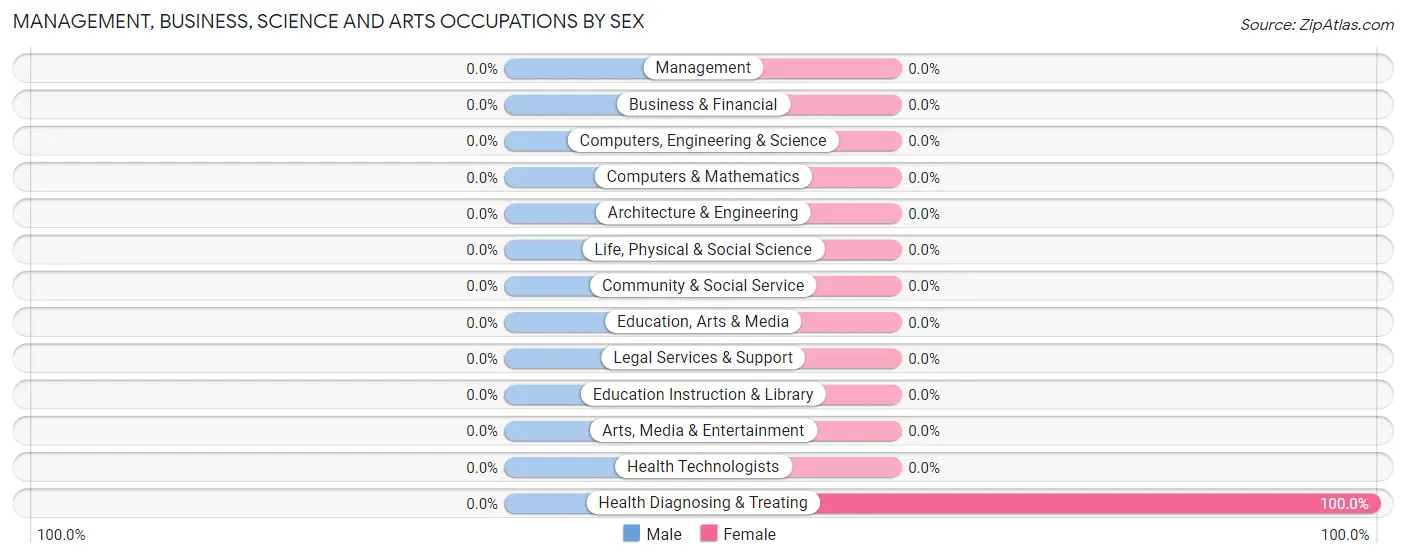
| Occupation | Male | Female |
| Management | 0 (0.0%) | 0 (0.0%) |
| Business & Financial | 0 (0.0%) | 0 (0.0%) |
| Computers, Engineering & Science | 0 (0.0%) | 0 (0.0%) |
| Computers & Mathematics | 0 (0.0%) | 0 (0.0%) |
| Architecture & Engineering | 0 (0.0%) | 0 (0.0%) |
| Life, Physical & Social Science | 0 (0.0%) | 0 (0.0%) |
| Community & Social Service | 0 (0.0%) | 0 (0.0%) |
| Education, Arts & Media | 0 (0.0%) | 0 (0.0%) |
| Legal Services & Support | 0 (0.0%) | 0 (0.0%) |
| Education Instruction & Library | 0 (0.0%) | 0 (0.0%) |
| Arts, Media & Entertainment | 0 (0.0%) | 0 (0.0%) |
| Health Diagnosing & Treating | 0 (0.0%) | 32 (100.0%) |
| Health Technologists | 0 (0.0%) | 0 (0.0%) |
| Total (Category) | 0 (0.0%) | 32 (100.0%) |
| Total (Overall) | 365 (71.2%) | 148 (28.8%) |
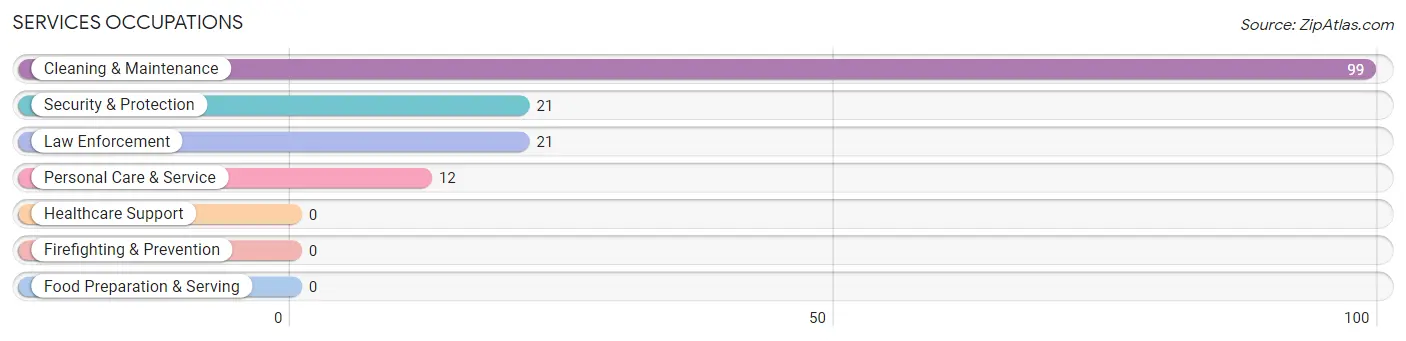
Services Occupations
The most common Services occupations in Rosharon are Cleaning & Maintenance (99 | 19.3%), Security & Protection (21 | 4.1%), Law Enforcement (21 | 4.1%), and Personal Care & Service (12 | 2.3%).
Services Occupations by Sex
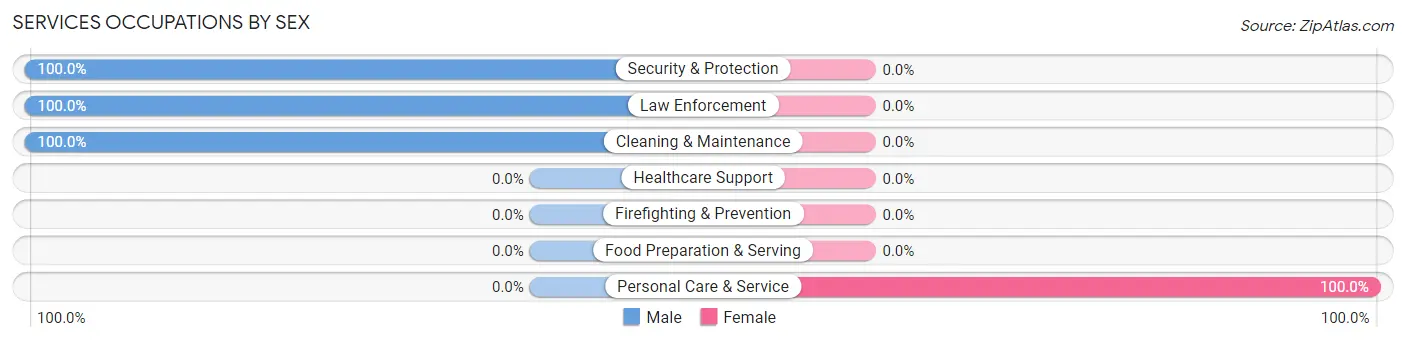
| Occupation | Male | Female |
| Healthcare Support | 0 (0.0%) | 0 (0.0%) |
| Security & Protection | 21 (100.0%) | 0 (0.0%) |
| Firefighting & Prevention | 0 (0.0%) | 0 (0.0%) |
| Law Enforcement | 21 (100.0%) | 0 (0.0%) |
| Food Preparation & Serving | 0 (0.0%) | 0 (0.0%) |
| Cleaning & Maintenance | 99 (100.0%) | 0 (0.0%) |
| Personal Care & Service | 0 (0.0%) | 12 (100.0%) |
| Total (Category) | 120 (90.9%) | 12 (9.1%) |
| Total (Overall) | 365 (71.2%) | 148 (28.8%) |
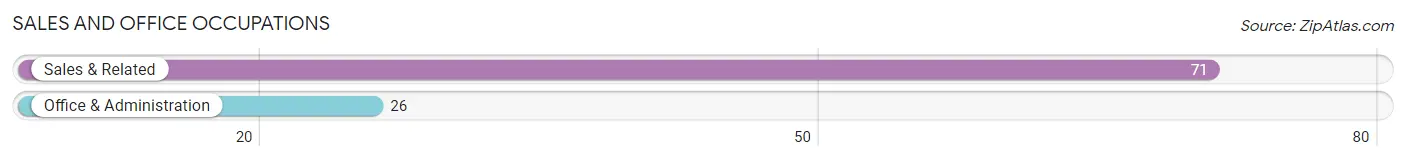
Sales and Office Occupations
The most common Sales and Office occupations in Rosharon are Sales & Related (71 | 13.8%), and Office & Administration (26 | 5.1%).
Sales and Office Occupations by Sex
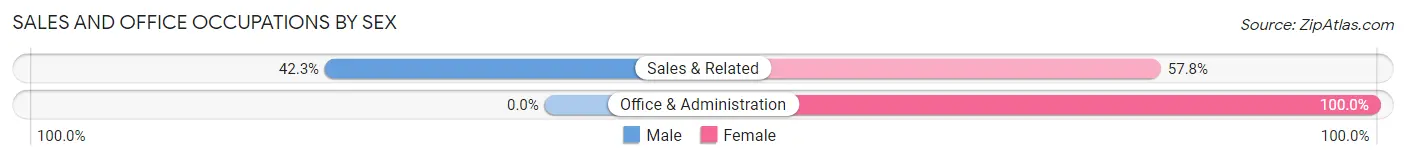
| Occupation | Male | Female |
| Sales & Related | 30 (42.2%) | 41 (57.8%) |
| Office & Administration | 0 (0.0%) | 26 (100.0%) |
| Total (Category) | 30 (30.9%) | 67 (69.1%) |
| Total (Overall) | 365 (71.2%) | 148 (28.8%) |
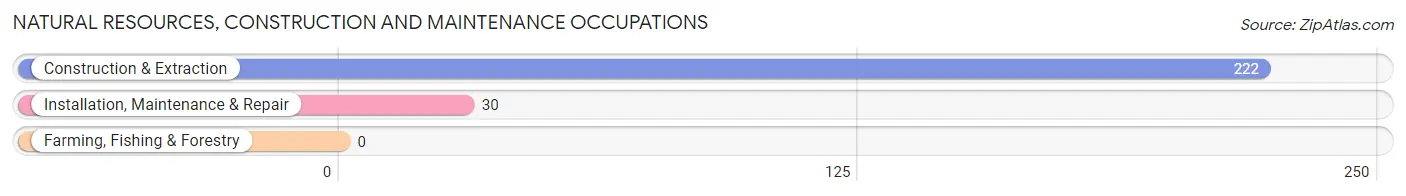
Natural Resources, Construction and Maintenance Occupations
The most common Natural Resources, Construction and Maintenance occupations in Rosharon are Construction & Extraction (222 | 43.3%), and Installation, Maintenance & Repair (30 | 5.9%).
Natural Resources, Construction and Maintenance Occupations by Sex
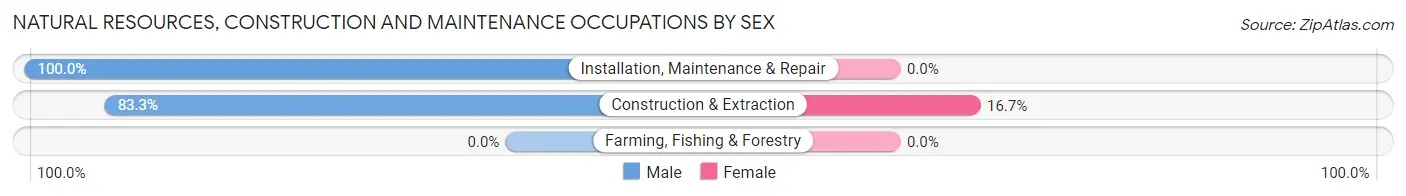
| Occupation | Male | Female |
| Farming, Fishing & Forestry | 0 (0.0%) | 0 (0.0%) |
| Construction & Extraction | 185 (83.3%) | 37 (16.7%) |
| Installation, Maintenance & Repair | 30 (100.0%) | 0 (0.0%) |
| Total (Category) | 215 (85.3%) | 37 (14.7%) |
| Total (Overall) | 365 (71.2%) | 148 (28.8%) |
Production, Transportation and Moving Occupations
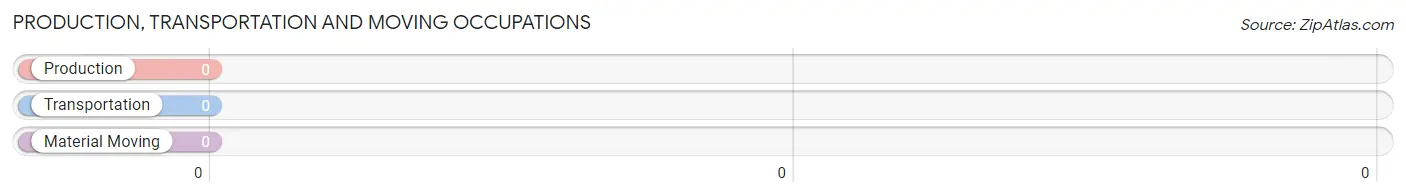
Production, Transportation and Moving Occupations by Sex
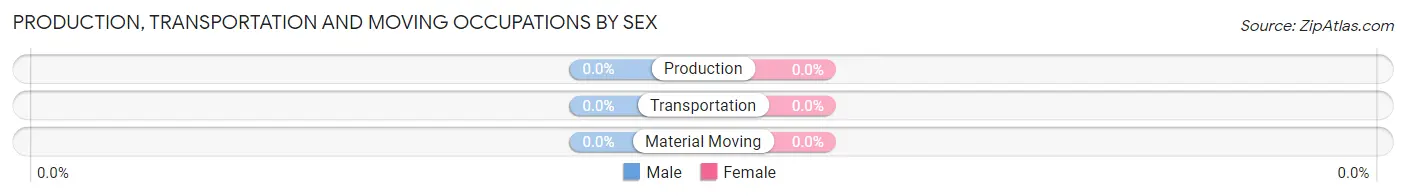
| Occupation | Male | Female |
| Production | 0 (0.0%) | 0 (0.0%) |
| Transportation | 0 (0.0%) | 0 (0.0%) |
| Material Moving | 0 (0.0%) | 0 (0.0%) |
| Total (Category) | 0 (0.0%) | 0 (0.0%) |
| Total (Overall) | 365 (71.2%) | 148 (28.8%) |
Employment Industries by Sex in Rosharon
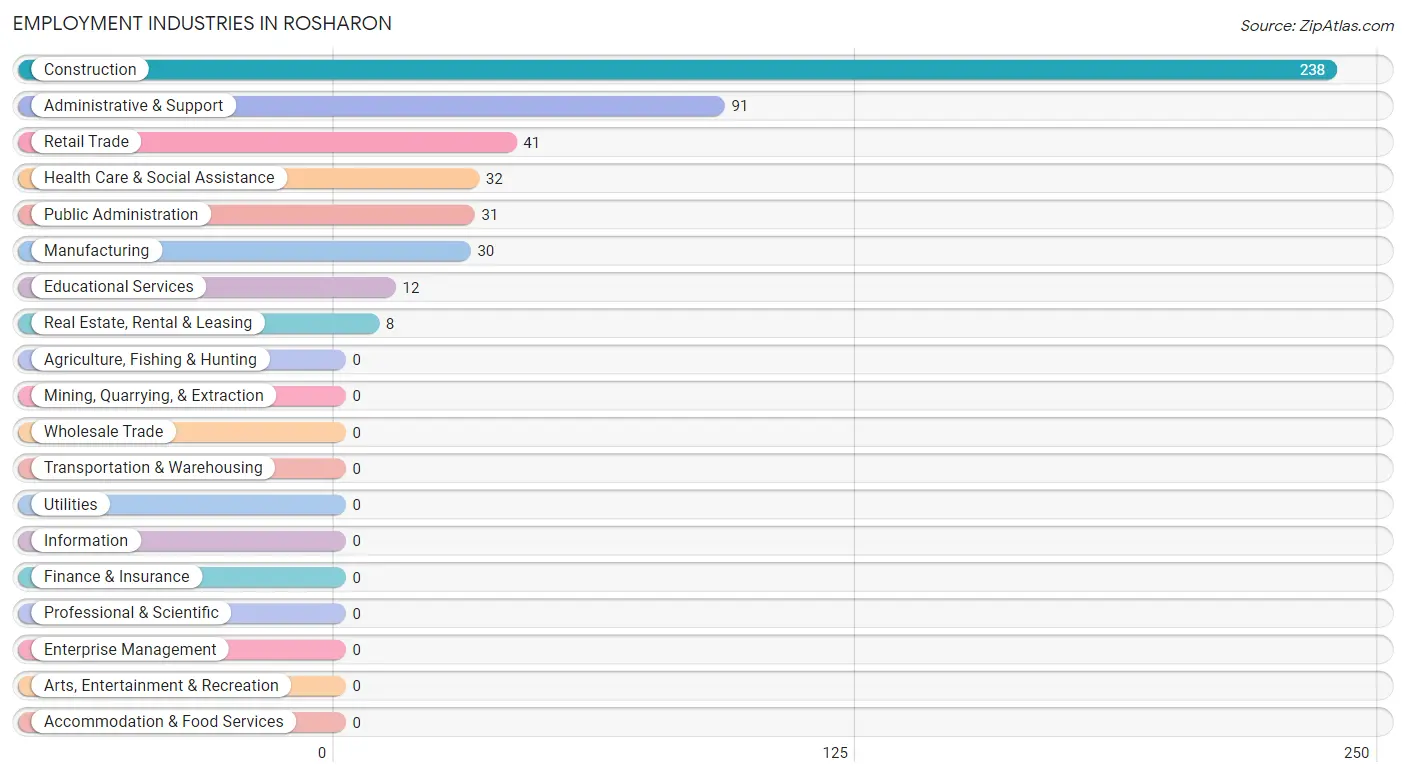
Employment Industries in Rosharon
The major employment industries in Rosharon include Construction (238 | 46.4%), Administrative & Support (91 | 17.7%), Retail Trade (41 | 8.0%), Health Care & Social Assistance (32 | 6.2%), and Public Administration (31 | 6.0%).
Employment Industries by Sex in Rosharon
The Rosharon industries that see more men than women are Manufacturing (100.0%), Real Estate, Rental & Leasing (100.0%), and Administrative & Support (100.0%), whereas the industries that tend to have a higher number of women are Retail Trade (100.0%), Educational Services (100.0%), and Health Care & Social Assistance (100.0%).
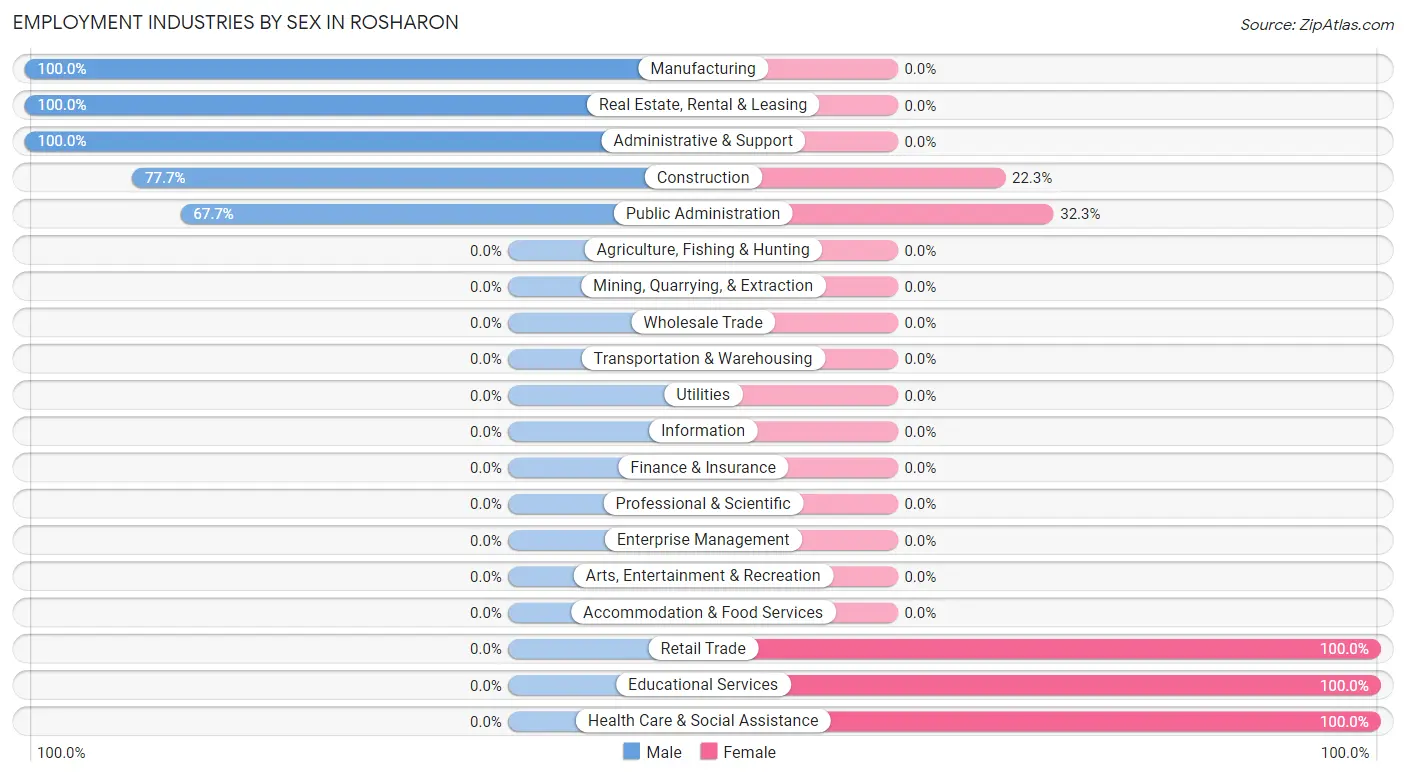
| Industry | Male | Female |
| Agriculture, Fishing & Hunting | 0 (0.0%) | 0 (0.0%) |
| Mining, Quarrying, & Extraction | 0 (0.0%) | 0 (0.0%) |
| Construction | 185 (77.7%) | 53 (22.3%) |
| Manufacturing | 30 (100.0%) | 0 (0.0%) |
| Wholesale Trade | 0 (0.0%) | 0 (0.0%) |
| Retail Trade | 0 (0.0%) | 41 (100.0%) |
| Transportation & Warehousing | 0 (0.0%) | 0 (0.0%) |
| Utilities | 0 (0.0%) | 0 (0.0%) |
| Information | 0 (0.0%) | 0 (0.0%) |
| Finance & Insurance | 0 (0.0%) | 0 (0.0%) |
| Real Estate, Rental & Leasing | 8 (100.0%) | 0 (0.0%) |
| Professional & Scientific | 0 (0.0%) | 0 (0.0%) |
| Enterprise Management | 0 (0.0%) | 0 (0.0%) |
| Administrative & Support | 91 (100.0%) | 0 (0.0%) |
| Educational Services | 0 (0.0%) | 12 (100.0%) |
| Health Care & Social Assistance | 0 (0.0%) | 32 (100.0%) |
| Arts, Entertainment & Recreation | 0 (0.0%) | 0 (0.0%) |
| Accommodation & Food Services | 0 (0.0%) | 0 (0.0%) |
| Public Administration | 21 (67.7%) | 10 (32.3%) |
| Total | 365 (71.2%) | 148 (28.8%) |
Education in Rosharon
School Enrollment in Rosharon
The most common levels of schooling among the 275 students in Rosharon are elementary school (94 | 34.2%), high school (93 | 33.8%), and college / undergraduate (44 | 16.0%).
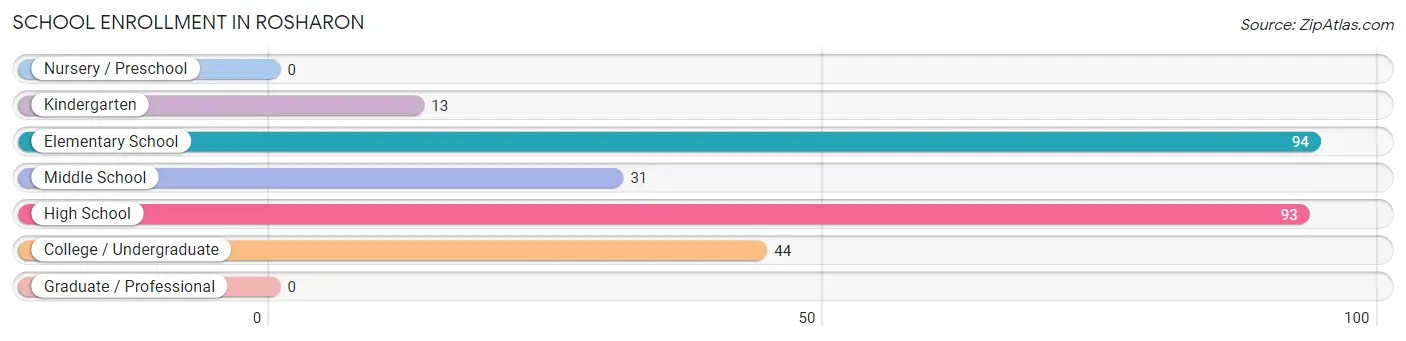
| School Level | # Students | % Students |
| Nursery / Preschool | 0 | 0.0% |
| Kindergarten | 13 | 4.7% |
| Elementary School | 94 | 34.2% |
| Middle School | 31 | 11.3% |
| High School | 93 | 33.8% |
| College / Undergraduate | 44 | 16.0% |
| Graduate / Professional | 0 | 0.0% |
| Total | 275 | 100.0% |
School Enrollment by Age by Funding Source in Rosharon
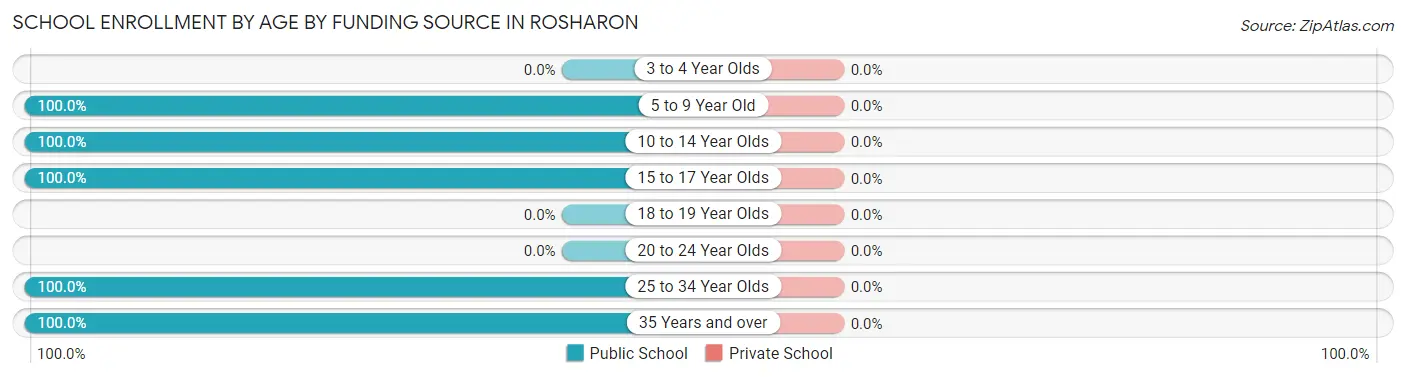
| Age Bracket | Public School | Private School |
| 3 to 4 Year Olds | 0 (0.0%) | 0 (0.0%) |
| 5 to 9 Year Old | 107 (100.0%) | 0 (0.0%) |
| 10 to 14 Year Olds | 31 (100.0%) | 0 (0.0%) |
| 15 to 17 Year Olds | 93 (100.0%) | 0 (0.0%) |
| 18 to 19 Year Olds | 0 (0.0%) | 0 (0.0%) |
| 20 to 24 Year Olds | 0 (0.0%) | 0 (0.0%) |
| 25 to 34 Year Olds | 12 (100.0%) | 0 (0.0%) |
| 35 Years and over | 32 (100.0%) | 0 (0.0%) |
| Total | 275 (100.0%) | 0 (0.0%) |
Educational Attainment by Field of Study in Rosharon
, and communications (13 | 100.0%) are the most common fields of study among 13 individuals in Rosharon who have obtained a bachelor's degree or higher.
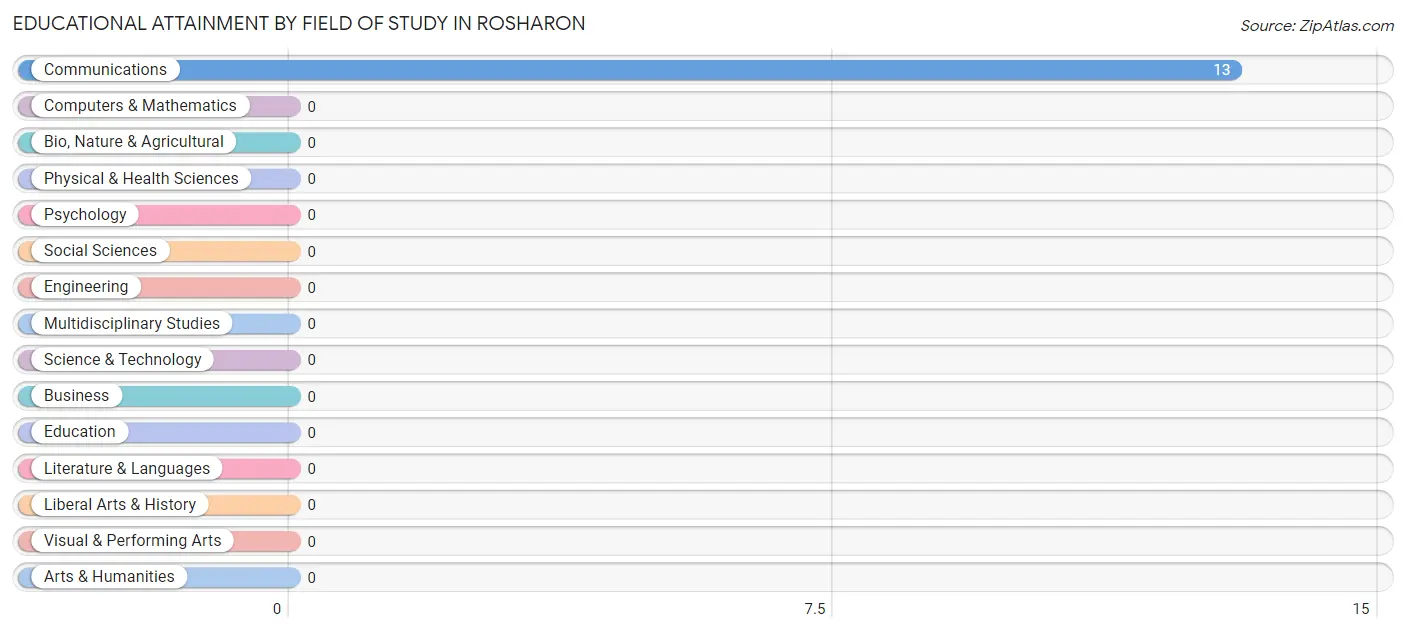
| Field of Study | # Graduates | % Graduates |
| Computers & Mathematics | 0 | 0.0% |
| Bio, Nature & Agricultural | 0 | 0.0% |
| Physical & Health Sciences | 0 | 0.0% |
| Psychology | 0 | 0.0% |
| Social Sciences | 0 | 0.0% |
| Engineering | 0 | 0.0% |
| Multidisciplinary Studies | 0 | 0.0% |
| Science & Technology | 0 | 0.0% |
| Business | 0 | 0.0% |
| Education | 0 | 0.0% |
| Literature & Languages | 0 | 0.0% |
| Liberal Arts & History | 0 | 0.0% |
| Visual & Performing Arts | 0 | 0.0% |
| Communications | 13 | 100.0% |
| Arts & Humanities | 0 | 0.0% |
| Total | 13 | 100.0% |
Transportation & Commute in Rosharon
Vehicle Availability by Sex in Rosharon
The most prevalent vehicle ownership categories in Rosharon are males with 1 vehicle (162, accounting for 44.4%) and females with 1 vehicle (0, making up 109.5%).
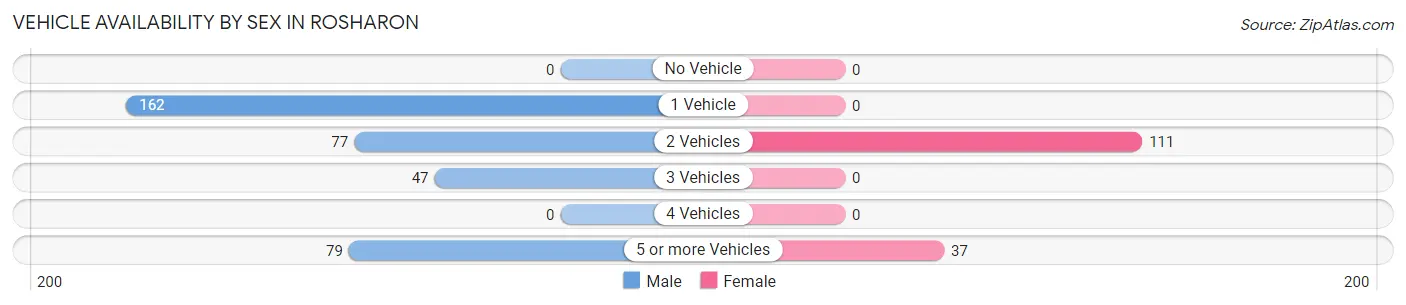
| Vehicles Available | Male | Female |
| No Vehicle | 0 (0.0%) | 0 (0.0%) |
| 1 Vehicle | 162 (44.4%) | 0 (0.0%) |
| 2 Vehicles | 77 (21.1%) | 111 (75.0%) |
| 3 Vehicles | 47 (12.9%) | 0 (0.0%) |
| 4 Vehicles | 0 (0.0%) | 0 (0.0%) |
| 5 or more Vehicles | 79 (21.6%) | 37 (25.0%) |
| Total | 365 (100.0%) | 148 (100.0%) |
Commute Time in Rosharon
The most frequently occuring commute durations in Rosharon are 30 to 34 minutes (108 commuters, 31.9%), 20 to 24 minutes (55 commuters, 16.2%), and 15 to 19 minutes (50 commuters, 14.7%).
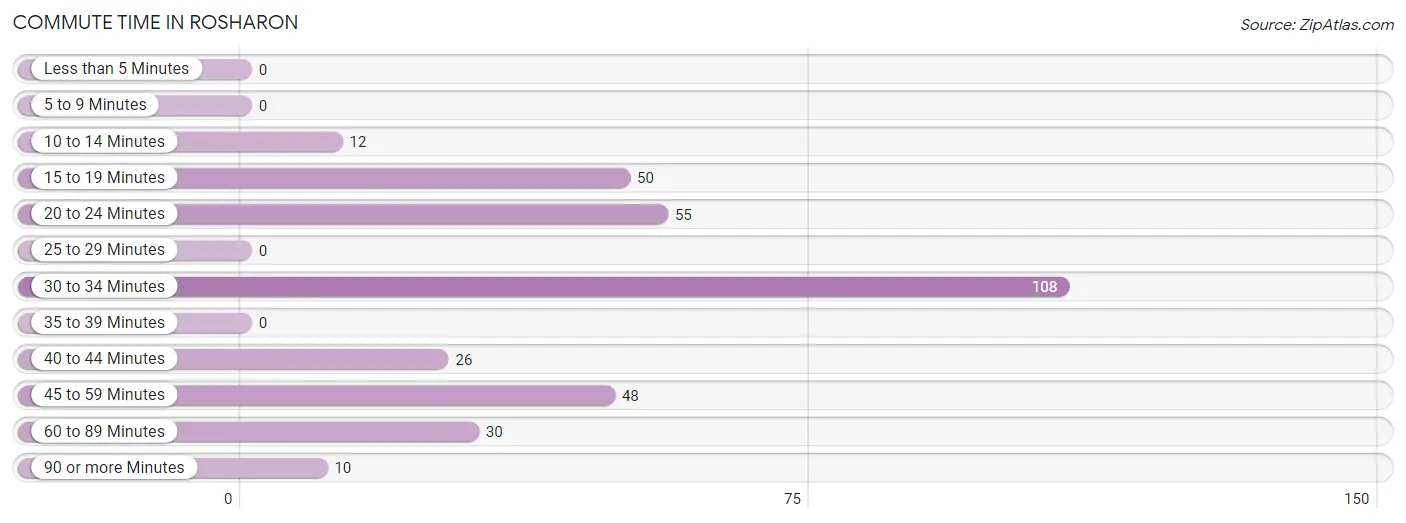
| Commute Time | # Commuters | % Commuters |
| Less than 5 Minutes | 0 | 0.0% |
| 5 to 9 Minutes | 0 | 0.0% |
| 10 to 14 Minutes | 12 | 3.5% |
| 15 to 19 Minutes | 50 | 14.7% |
| 20 to 24 Minutes | 55 | 16.2% |
| 25 to 29 Minutes | 0 | 0.0% |
| 30 to 34 Minutes | 108 | 31.9% |
| 35 to 39 Minutes | 0 | 0.0% |
| 40 to 44 Minutes | 26 | 7.7% |
| 45 to 59 Minutes | 48 | 14.2% |
| 60 to 89 Minutes | 30 | 8.8% |
| 90 or more Minutes | 10 | 2.9% |
Commute Time by Sex in Rosharon
The most common commute times in Rosharon are 30 to 34 minutes (108 commuters, 45.0%) for males and 45 to 59 minutes (48 commuters, 48.5%) for females.
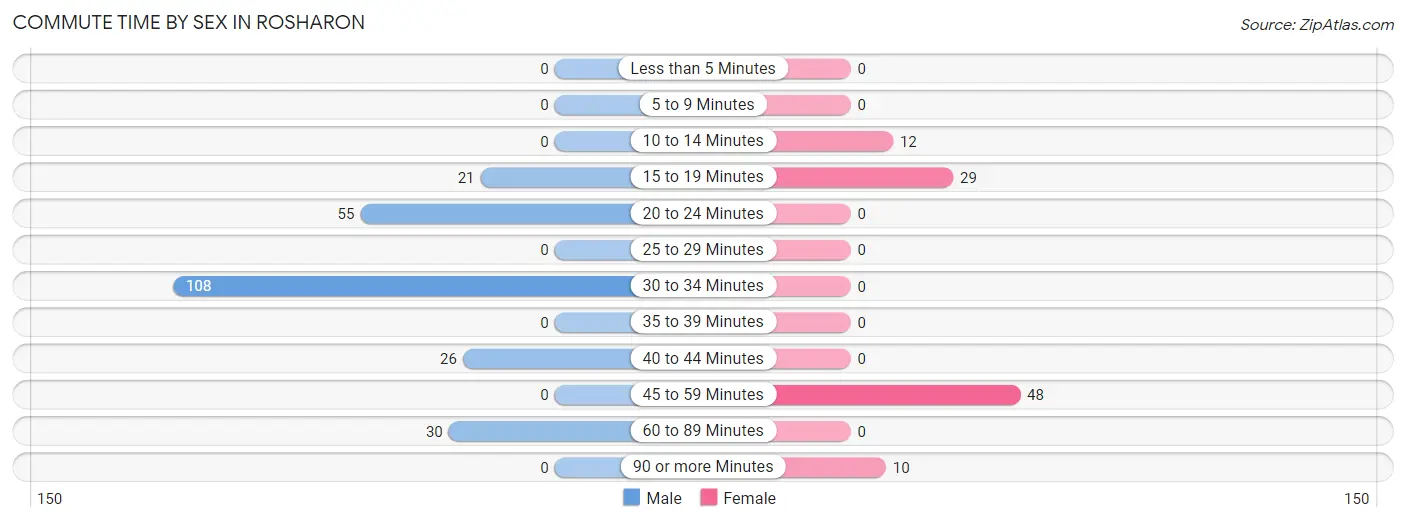
| Commute Time | Male | Female |
| Less than 5 Minutes | 0 (0.0%) | 0 (0.0%) |
| 5 to 9 Minutes | 0 (0.0%) | 0 (0.0%) |
| 10 to 14 Minutes | 0 (0.0%) | 12 (12.1%) |
| 15 to 19 Minutes | 21 (8.7%) | 29 (29.3%) |
| 20 to 24 Minutes | 55 (22.9%) | 0 (0.0%) |
| 25 to 29 Minutes | 0 (0.0%) | 0 (0.0%) |
| 30 to 34 Minutes | 108 (45.0%) | 0 (0.0%) |
| 35 to 39 Minutes | 0 (0.0%) | 0 (0.0%) |
| 40 to 44 Minutes | 26 (10.8%) | 0 (0.0%) |
| 45 to 59 Minutes | 0 (0.0%) | 48 (48.5%) |
| 60 to 89 Minutes | 30 (12.5%) | 0 (0.0%) |
| 90 or more Minutes | 0 (0.0%) | 10 (10.1%) |
Time of Departure to Work by Sex in Rosharon
The most frequent times of departure to work in Rosharon are 7:00 AM to 7:29 AM (133, 55.4%) for males and 6:00 AM to 6:29 AM (32, 32.3%) for females.
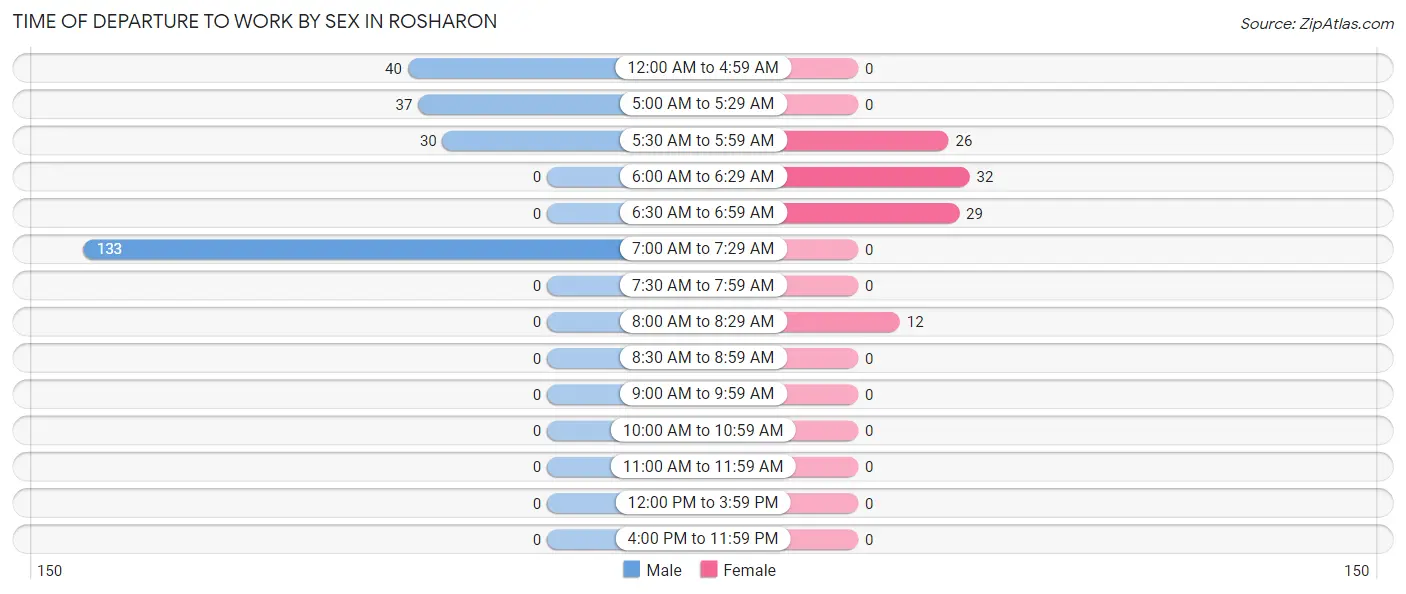
| Time of Departure | Male | Female |
| 12:00 AM to 4:59 AM | 40 (16.7%) | 0 (0.0%) |
| 5:00 AM to 5:29 AM | 37 (15.4%) | 0 (0.0%) |
| 5:30 AM to 5:59 AM | 30 (12.5%) | 26 (26.3%) |
| 6:00 AM to 6:29 AM | 0 (0.0%) | 32 (32.3%) |
| 6:30 AM to 6:59 AM | 0 (0.0%) | 29 (29.3%) |
| 7:00 AM to 7:29 AM | 133 (55.4%) | 0 (0.0%) |
| 7:30 AM to 7:59 AM | 0 (0.0%) | 0 (0.0%) |
| 8:00 AM to 8:29 AM | 0 (0.0%) | 12 (12.1%) |
| 8:30 AM to 8:59 AM | 0 (0.0%) | 0 (0.0%) |
| 9:00 AM to 9:59 AM | 0 (0.0%) | 0 (0.0%) |
| 10:00 AM to 10:59 AM | 0 (0.0%) | 0 (0.0%) |
| 11:00 AM to 11:59 AM | 0 (0.0%) | 0 (0.0%) |
| 12:00 PM to 3:59 PM | 0 (0.0%) | 0 (0.0%) |
| 4:00 PM to 11:59 PM | 0 (0.0%) | 0 (0.0%) |
| Total | 240 (100.0%) | 99 (100.0%) |
Housing Occupancy in Rosharon
Occupancy by Ownership in Rosharon
Of the total 553 dwellings in Rosharon, owner-occupied units account for 339 (61.3%), while renter-occupied units make up 214 (38.7%).
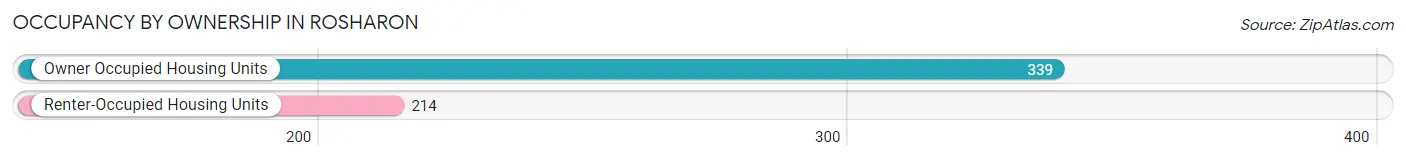
| Occupancy | # Housing Units | % Housing Units |
| Owner Occupied Housing Units | 339 | 61.3% |
| Renter-Occupied Housing Units | 214 | 38.7% |
| Total Occupied Housing Units | 553 | 100.0% |
Occupancy by Household Size in Rosharon
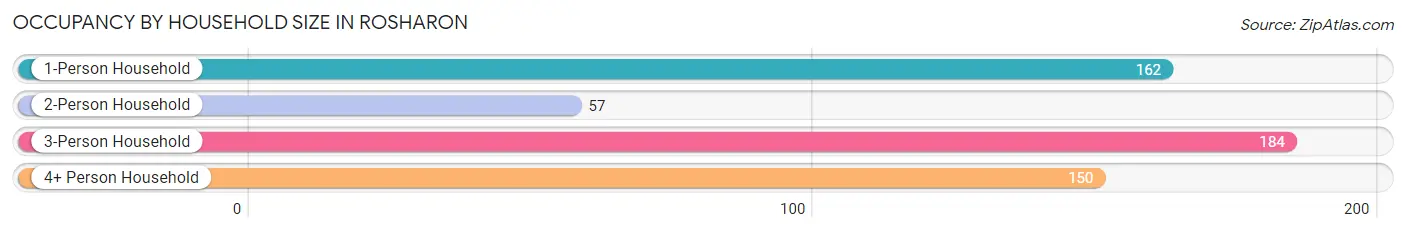
| Household Size | # Housing Units | % Housing Units |
| 1-Person Household | 162 | 29.3% |
| 2-Person Household | 57 | 10.3% |
| 3-Person Household | 184 | 33.3% |
| 4+ Person Household | 150 | 27.1% |
| Total Housing Units | 553 | 100.0% |
Occupancy by Ownership by Household Size in Rosharon
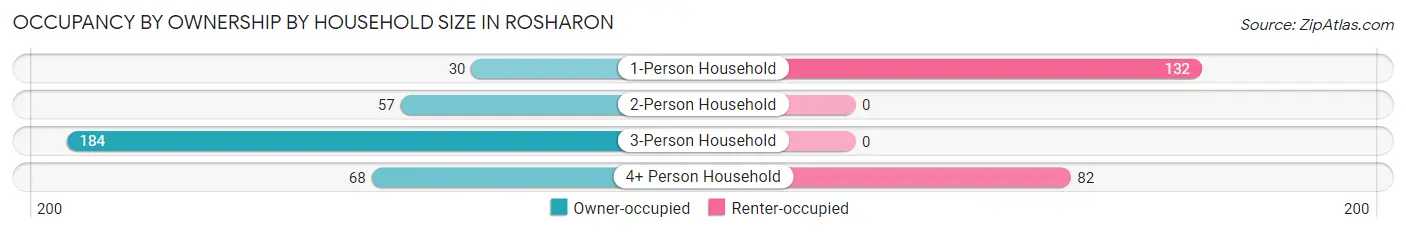
| Household Size | Owner-occupied | Renter-occupied |
| 1-Person Household | 30 (18.5%) | 132 (81.5%) |
| 2-Person Household | 57 (100.0%) | 0 (0.0%) |
| 3-Person Household | 184 (100.0%) | 0 (0.0%) |
| 4+ Person Household | 68 (45.3%) | 82 (54.7%) |
| Total Housing Units | 339 (61.3%) | 214 (38.7%) |
Occupancy by Educational Attainment in Rosharon
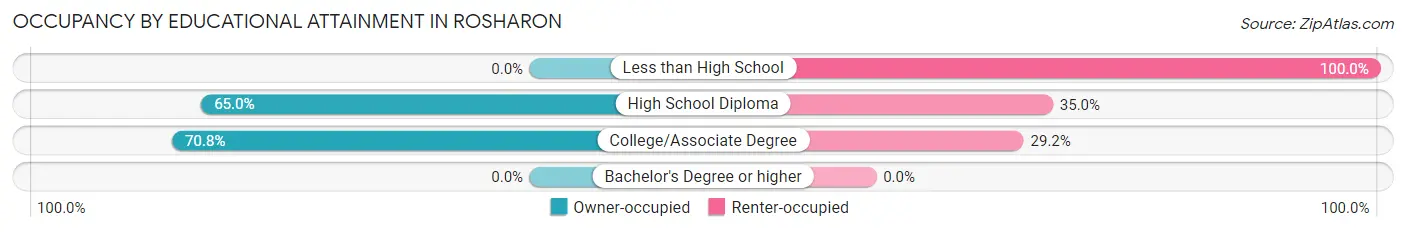
| Household Size | Owner-occupied | Renter-occupied |
| Less than High School | 0 (0.0%) | 37 (100.0%) |
| High School Diploma | 293 (65.0%) | 158 (35.0%) |
| College/Associate Degree | 46 (70.8%) | 19 (29.2%) |
| Bachelor's Degree or higher | 0 (0.0%) | 0 (0.0%) |
Occupancy by Age of Householder in Rosharon
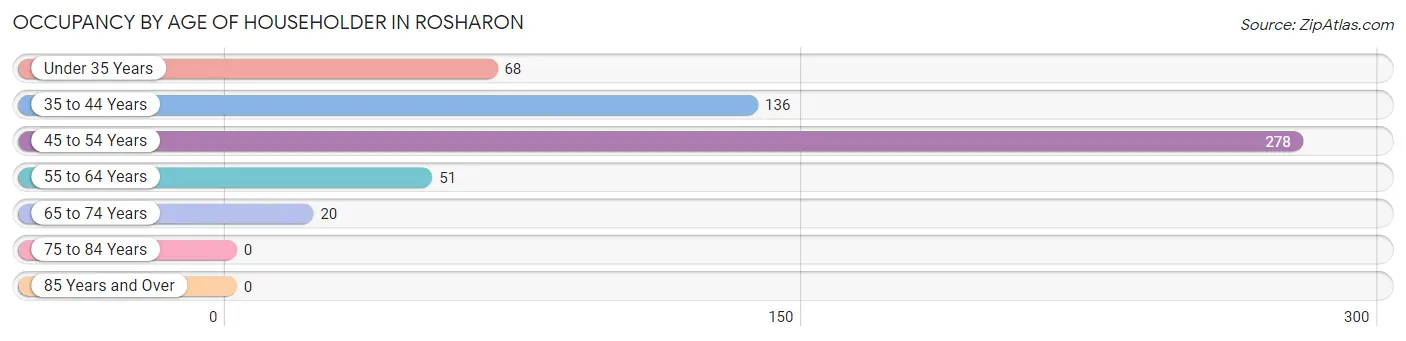
| Age Bracket | # Households | % Households |
| Under 35 Years | 68 | 12.3% |
| 35 to 44 Years | 136 | 24.6% |
| 45 to 54 Years | 278 | 50.3% |
| 55 to 64 Years | 51 | 9.2% |
| 65 to 74 Years | 20 | 3.6% |
| 75 to 84 Years | 0 | 0.0% |
| 85 Years and Over | 0 | 0.0% |
| Total | 553 | 100.0% |
Housing Finances in Rosharon
Median Income by Occupancy in Rosharon
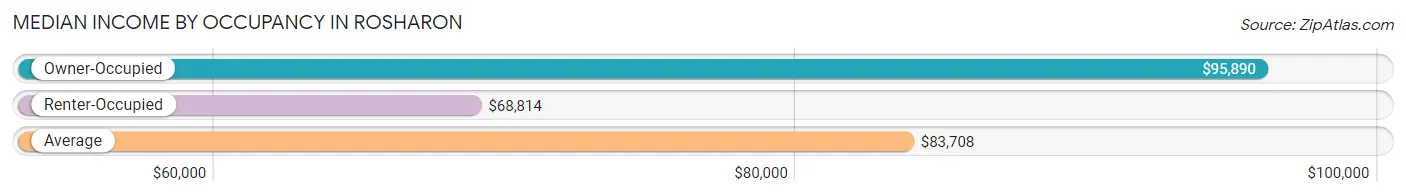
| Occupancy Type | # Households | Median Income |
| Owner-Occupied | 339 (61.3%) | $95,890 |
| Renter-Occupied | 214 (38.7%) | $68,814 |
| Average | 553 (100.0%) | $83,708 |
Occupancy by Householder Income Bracket in Rosharon
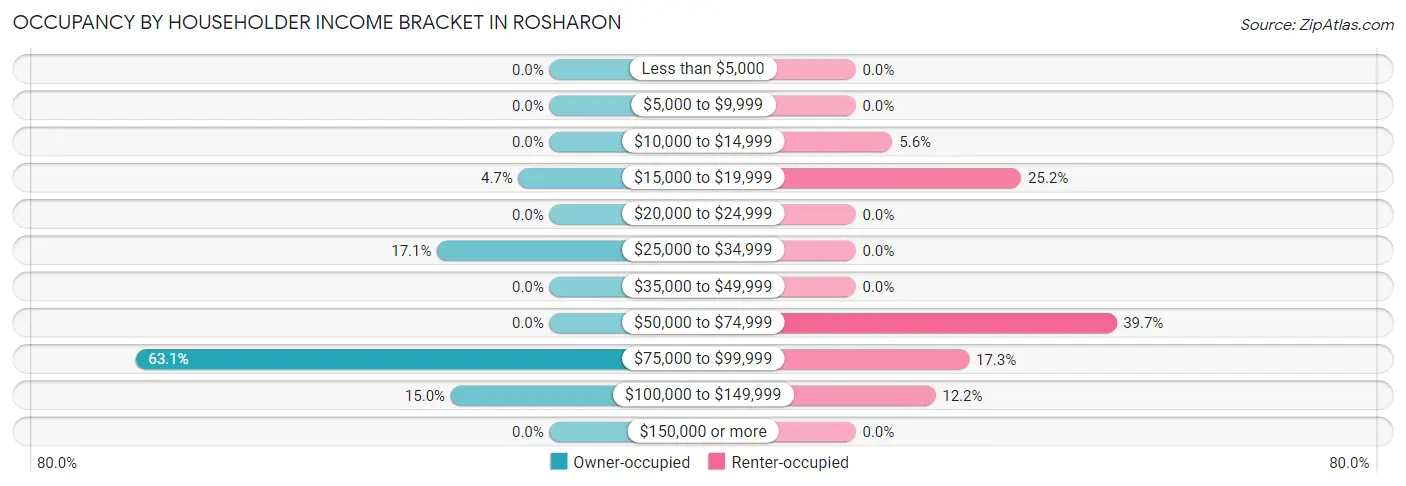
| Income Bracket | Owner-occupied | Renter-occupied |
| Less than $5,000 | 0 (0.0%) | 0 (0.0%) |
| $5,000 to $9,999 | 0 (0.0%) | 0 (0.0%) |
| $10,000 to $14,999 | 0 (0.0%) | 12 (5.6%) |
| $15,000 to $19,999 | 16 (4.7%) | 54 (25.2%) |
| $20,000 to $24,999 | 0 (0.0%) | 0 (0.0%) |
| $25,000 to $34,999 | 58 (17.1%) | 0 (0.0%) |
| $35,000 to $49,999 | 0 (0.0%) | 0 (0.0%) |
| $50,000 to $74,999 | 0 (0.0%) | 85 (39.7%) |
| $75,000 to $99,999 | 214 (63.1%) | 37 (17.3%) |
| $100,000 to $149,999 | 51 (15.0%) | 26 (12.1%) |
| $150,000 or more | 0 (0.0%) | 0 (0.0%) |
| Total | 339 (100.0%) | 214 (100.0%) |
Monthly Housing Cost Tiers in Rosharon
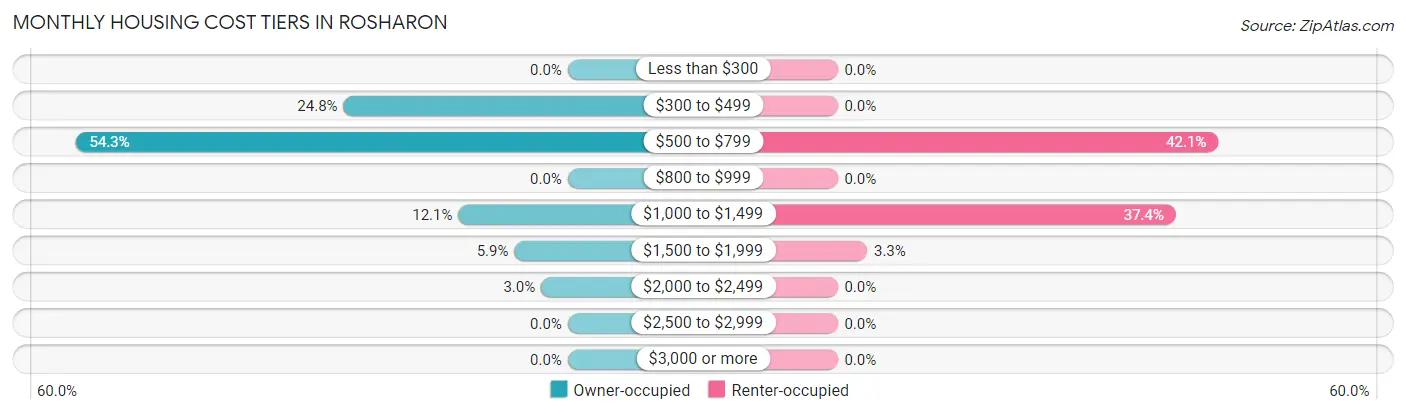
| Monthly Cost | Owner-occupied | Renter-occupied |
| Less than $300 | 0 (0.0%) | 0 (0.0%) |
| $300 to $499 | 84 (24.8%) | 0 (0.0%) |
| $500 to $799 | 184 (54.3%) | 90 (42.1%) |
| $800 to $999 | 0 (0.0%) | 0 (0.0%) |
| $1,000 to $1,499 | 41 (12.1%) | 80 (37.4%) |
| $1,500 to $1,999 | 20 (5.9%) | 7 (3.3%) |
| $2,000 to $2,499 | 10 (2.9%) | 0 (0.0%) |
| $2,500 to $2,999 | 0 (0.0%) | 0 (0.0%) |
| $3,000 or more | 0 (0.0%) | 0 (0.0%) |
| Total | 339 (100.0%) | 214 (100.0%) |
Physical Housing Characteristics in Rosharon
Housing Structures in Rosharon
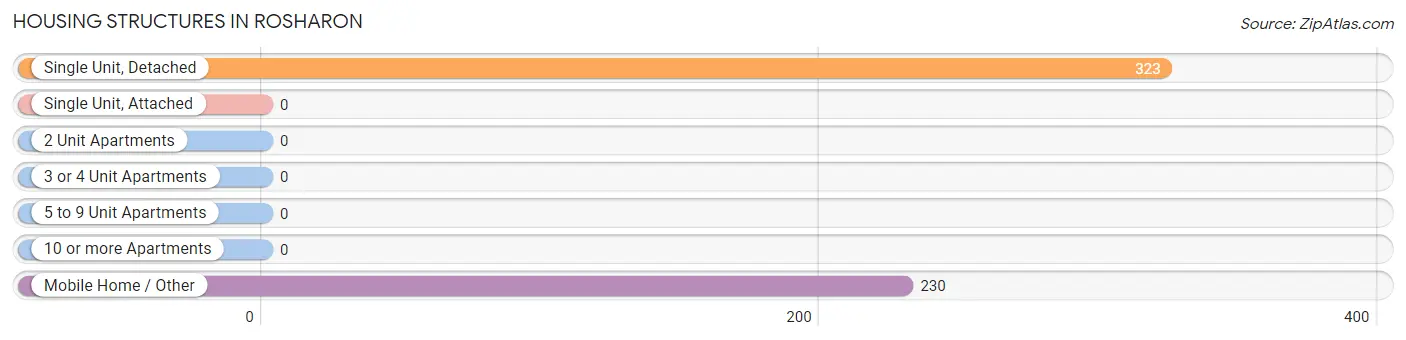
| Structure Type | # Housing Units | % Housing Units |
| Single Unit, Detached | 323 | 58.4% |
| Single Unit, Attached | 0 | 0.0% |
| 2 Unit Apartments | 0 | 0.0% |
| 3 or 4 Unit Apartments | 0 | 0.0% |
| 5 to 9 Unit Apartments | 0 | 0.0% |
| 10 or more Apartments | 0 | 0.0% |
| Mobile Home / Other | 230 | 41.6% |
| Total | 553 | 100.0% |
Housing Structures by Occupancy in Rosharon
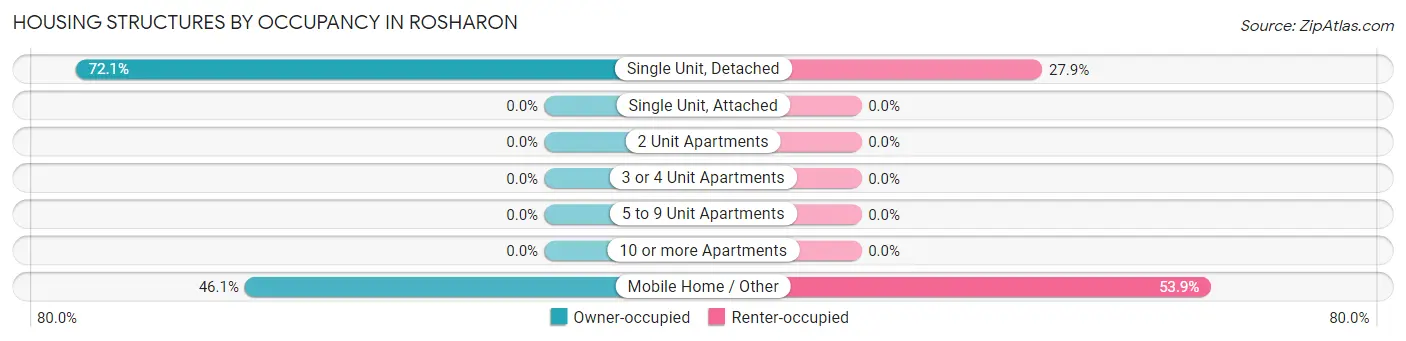
| Structure Type | Owner-occupied | Renter-occupied |
| Single Unit, Detached | 233 (72.1%) | 90 (27.9%) |
| Single Unit, Attached | 0 (0.0%) | 0 (0.0%) |
| 2 Unit Apartments | 0 (0.0%) | 0 (0.0%) |
| 3 or 4 Unit Apartments | 0 (0.0%) | 0 (0.0%) |
| 5 to 9 Unit Apartments | 0 (0.0%) | 0 (0.0%) |
| 10 or more Apartments | 0 (0.0%) | 0 (0.0%) |
| Mobile Home / Other | 106 (46.1%) | 124 (53.9%) |
| Total | 339 (61.3%) | 214 (38.7%) |
Housing Structures by Number of Rooms in Rosharon
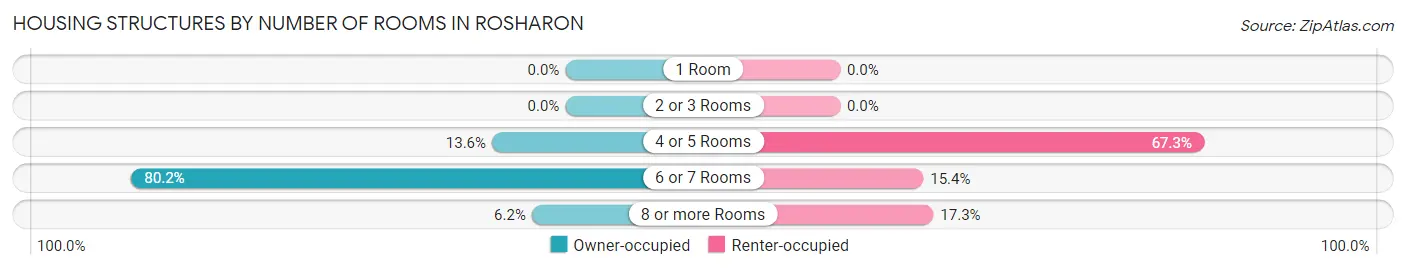
| Number of Rooms | Owner-occupied | Renter-occupied |
| 1 Room | 0 (0.0%) | 0 (0.0%) |
| 2 or 3 Rooms | 0 (0.0%) | 0 (0.0%) |
| 4 or 5 Rooms | 46 (13.6%) | 144 (67.3%) |
| 6 or 7 Rooms | 272 (80.2%) | 33 (15.4%) |
| 8 or more Rooms | 21 (6.2%) | 37 (17.3%) |
| Total | 339 (100.0%) | 214 (100.0%) |
Housing Structure by Heating Type in Rosharon
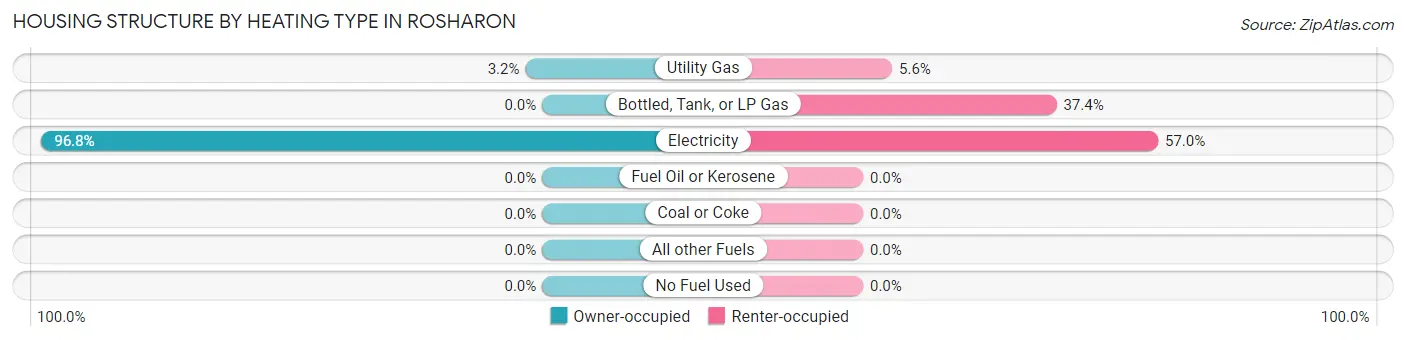
| Heating Type | Owner-occupied | Renter-occupied |
| Utility Gas | 11 (3.2%) | 12 (5.6%) |
| Bottled, Tank, or LP Gas | 0 (0.0%) | 80 (37.4%) |
| Electricity | 328 (96.8%) | 122 (57.0%) |
| Fuel Oil or Kerosene | 0 (0.0%) | 0 (0.0%) |
| Coal or Coke | 0 (0.0%) | 0 (0.0%) |
| All other Fuels | 0 (0.0%) | 0 (0.0%) |
| No Fuel Used | 0 (0.0%) | 0 (0.0%) |
| Total | 339 (100.0%) | 214 (100.0%) |
Household Vehicle Usage in Rosharon
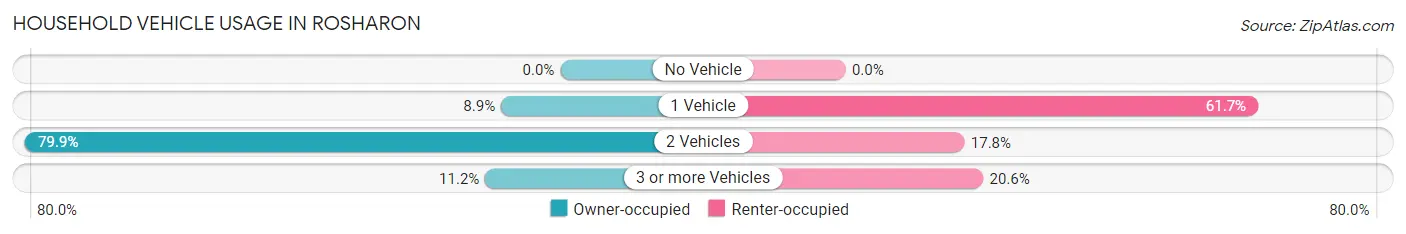
| Vehicles per Household | Owner-occupied | Renter-occupied |
| No Vehicle | 0 (0.0%) | 0 (0.0%) |
| 1 Vehicle | 30 (8.8%) | 132 (61.7%) |
| 2 Vehicles | 271 (79.9%) | 38 (17.8%) |
| 3 or more Vehicles | 38 (11.2%) | 44 (20.6%) |
| Total | 339 (100.0%) | 214 (100.0%) |
Real Estate & Mortgages in Rosharon
Real Estate and Mortgage Overview in Rosharon
| Characteristic | Without Mortgage | With Mortgage |
| Housing Units | 268 | 71 |
| Median Property Value | $213,600 | $154,600 |
| Median Household Income | $95,679 | $0 |
| Monthly Housing Costs | $527 | $0 |
| Real Estate Taxes | $3,272 | $0 |
Property Value by Mortgage Status in Rosharon
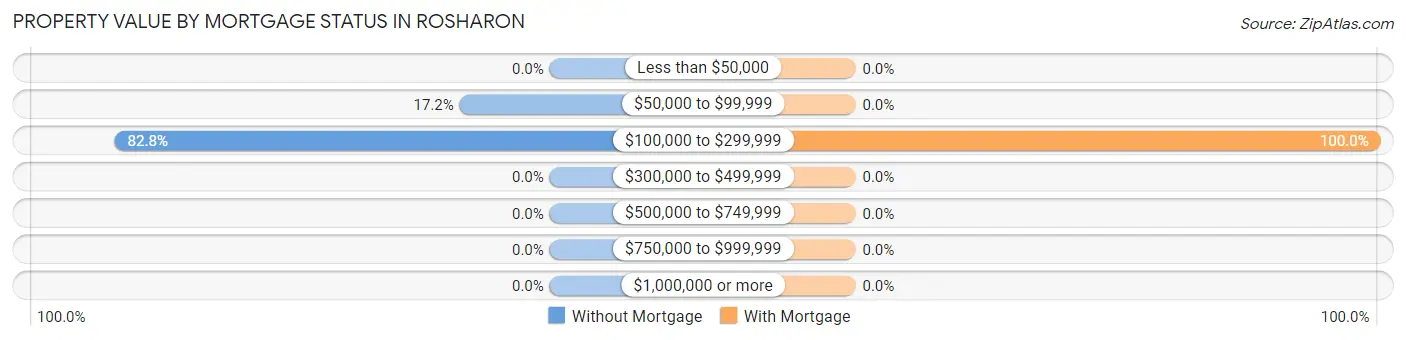
| Property Value | Without Mortgage | With Mortgage |
| Less than $50,000 | 0 (0.0%) | 0 (0.0%) |
| $50,000 to $99,999 | 46 (17.2%) | 0 (0.0%) |
| $100,000 to $299,999 | 222 (82.8%) | 71 (100.0%) |
| $300,000 to $499,999 | 0 (0.0%) | 0 (0.0%) |
| $500,000 to $749,999 | 0 (0.0%) | 0 (0.0%) |
| $750,000 to $999,999 | 0 (0.0%) | 0 (0.0%) |
| $1,000,000 or more | 0 (0.0%) | 0 (0.0%) |
| Total | 268 (100.0%) | 71 (100.0%) |
Household Income by Mortgage Status in Rosharon
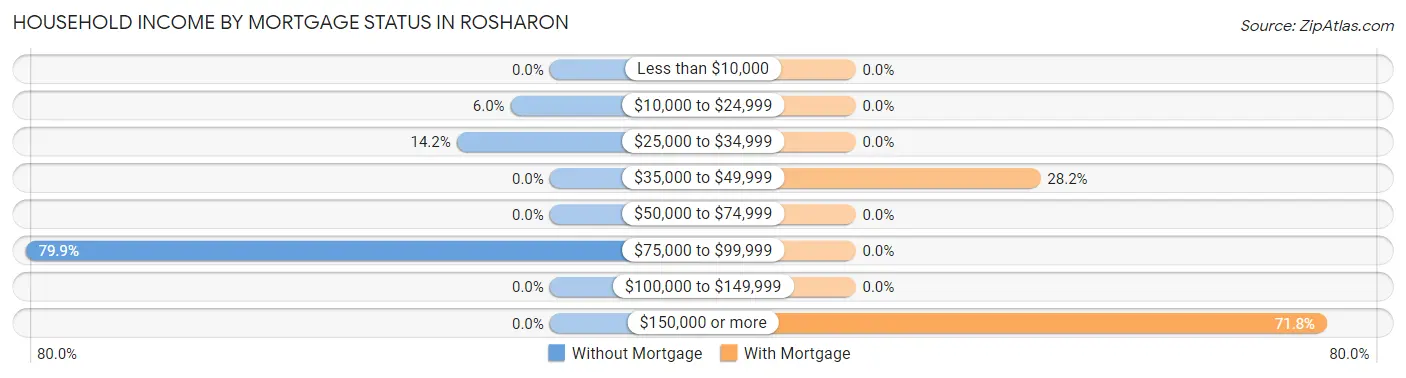
| Household Income | Without Mortgage | With Mortgage |
| Less than $10,000 | 0 (0.0%) | 0 (0.0%) |
| $10,000 to $24,999 | 16 (6.0%) | 0 (0.0%) |
| $25,000 to $34,999 | 38 (14.2%) | 0 (0.0%) |
| $35,000 to $49,999 | 0 (0.0%) | 20 (28.2%) |
| $50,000 to $74,999 | 0 (0.0%) | 0 (0.0%) |
| $75,000 to $99,999 | 214 (79.8%) | 0 (0.0%) |
| $100,000 to $149,999 | 0 (0.0%) | 0 (0.0%) |
| $150,000 or more | 0 (0.0%) | 51 (71.8%) |
| Total | 268 (100.0%) | 71 (100.0%) |
Property Value to Household Income Ratio in Rosharon
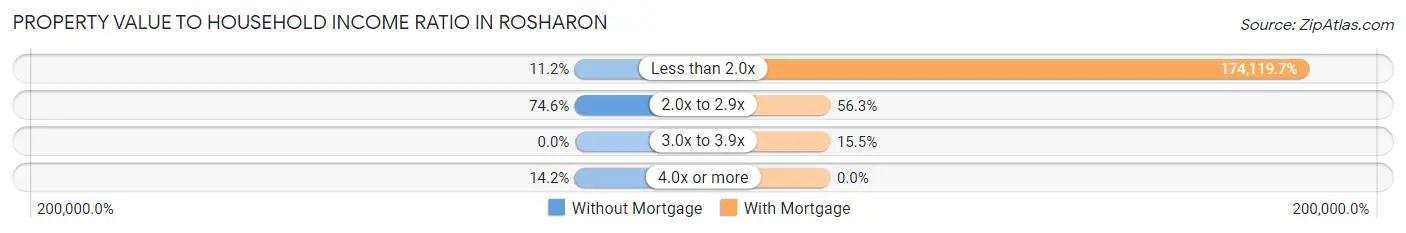
| Value-to-Income Ratio | Without Mortgage | With Mortgage |
| Less than 2.0x | 30 (11.2%) | 123,625 (174,119.7%) |
| 2.0x to 2.9x | 200 (74.6%) | 40 (56.3%) |
| 3.0x to 3.9x | 0 (0.0%) | 11 (15.5%) |
| 4.0x or more | 38 (14.2%) | 0 (0.0%) |
| Total | 268 (100.0%) | 71 (100.0%) |
Real Estate Taxes by Mortgage Status in Rosharon
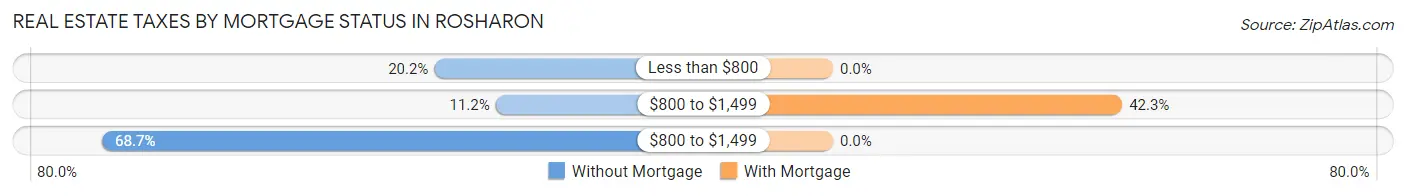
| Property Taxes | Without Mortgage | With Mortgage |
| Less than $800 | 54 (20.2%) | 0 (0.0%) |
| $800 to $1,499 | 30 (11.2%) | 30 (42.2%) |
| $800 to $1,499 | 184 (68.7%) | 0 (0.0%) |
| Total | 268 (100.0%) | 71 (100.0%) |
Health & Disability in Rosharon
Health Insurance Coverage by Age in Rosharon
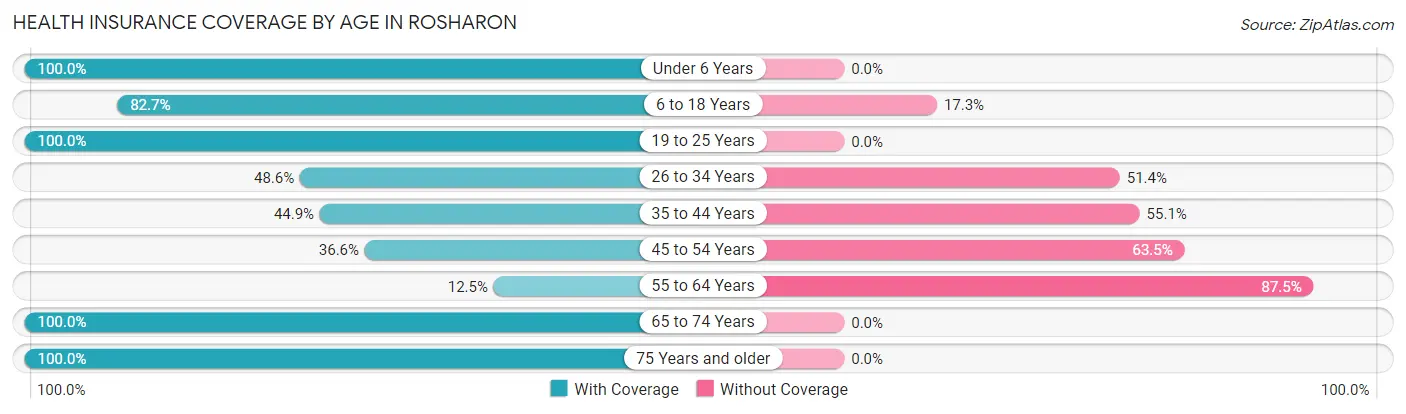
| Age Bracket | With Coverage | Without Coverage |
| Under 6 Years | 37 (100.0%) | 0 (0.0%) |
| 6 to 18 Years | 225 (82.7%) | 47 (17.3%) |
| 19 to 25 Years | 26 (100.0%) | 0 (0.0%) |
| 26 to 34 Years | 71 (48.6%) | 75 (51.4%) |
| 35 to 44 Years | 106 (44.9%) | 130 (55.1%) |
| 45 to 54 Years | 106 (36.5%) | 184 (63.4%) |
| 55 to 64 Years | 61 (12.5%) | 427 (87.5%) |
| 65 to 74 Years | 35 (100.0%) | 0 (0.0%) |
| 75 Years and older | 159 (100.0%) | 0 (0.0%) |
| Total | 826 (48.9%) | 863 (51.1%) |
Health Insurance Coverage by Citizenship Status in Rosharon
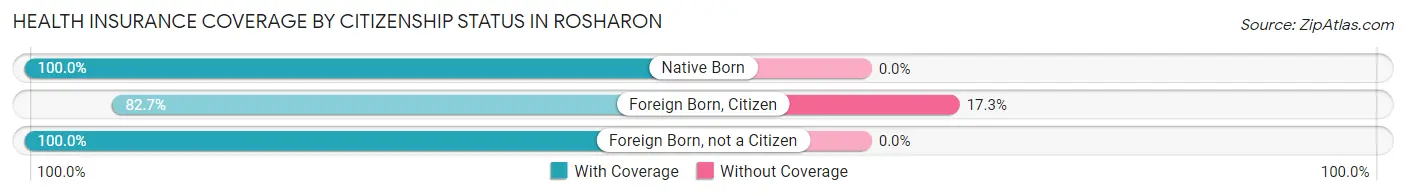
| Citizenship Status | With Coverage | Without Coverage |
| Native Born | 37 (100.0%) | 0 (0.0%) |
| Foreign Born, Citizen | 225 (82.7%) | 47 (17.3%) |
| Foreign Born, not a Citizen | 26 (100.0%) | 0 (0.0%) |
Health Insurance Coverage by Household Income in Rosharon
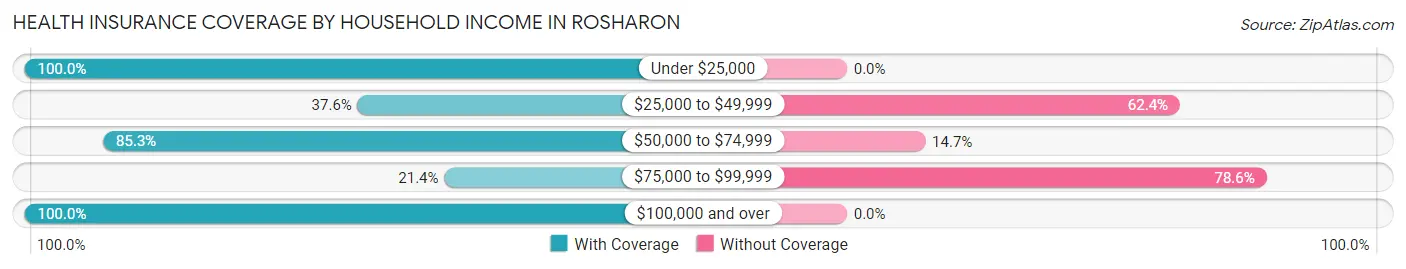
| Household Income | With Coverage | Without Coverage |
| Under $25,000 | 146 (100.0%) | 0 (0.0%) |
| $25,000 to $49,999 | 91 (37.6%) | 151 (62.4%) |
| $50,000 to $74,999 | 93 (85.3%) | 16 (14.7%) |
| $75,000 to $99,999 | 189 (21.4%) | 696 (78.6%) |
| $100,000 and over | 307 (100.0%) | 0 (0.0%) |
Public vs Private Health Insurance Coverage by Age in Rosharon
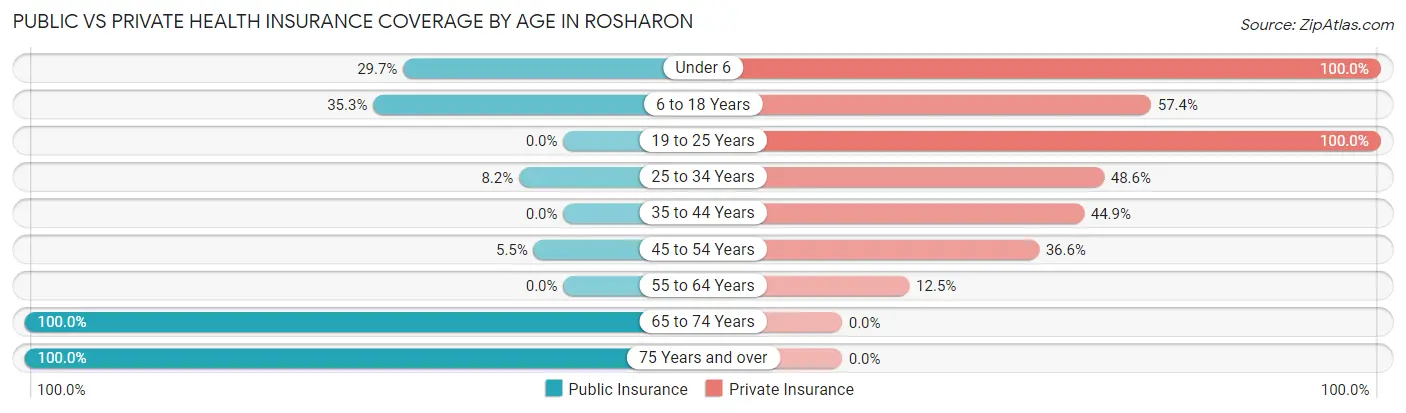
| Age Bracket | Public Insurance | Private Insurance |
| Under 6 | 11 (29.7%) | 37 (100.0%) |
| 6 to 18 Years | 96 (35.3%) | 156 (57.4%) |
| 19 to 25 Years | 0 (0.0%) | 26 (100.0%) |
| 25 to 34 Years | 12 (8.2%) | 71 (48.6%) |
| 35 to 44 Years | 0 (0.0%) | 106 (44.9%) |
| 45 to 54 Years | 16 (5.5%) | 106 (36.5%) |
| 55 to 64 Years | 0 (0.0%) | 61 (12.5%) |
| 65 to 74 Years | 35 (100.0%) | 0 (0.0%) |
| 75 Years and over | 159 (100.0%) | 0 (0.0%) |
| Total | 329 (19.5%) | 563 (33.3%) |
Disability Status by Sex by Age in Rosharon
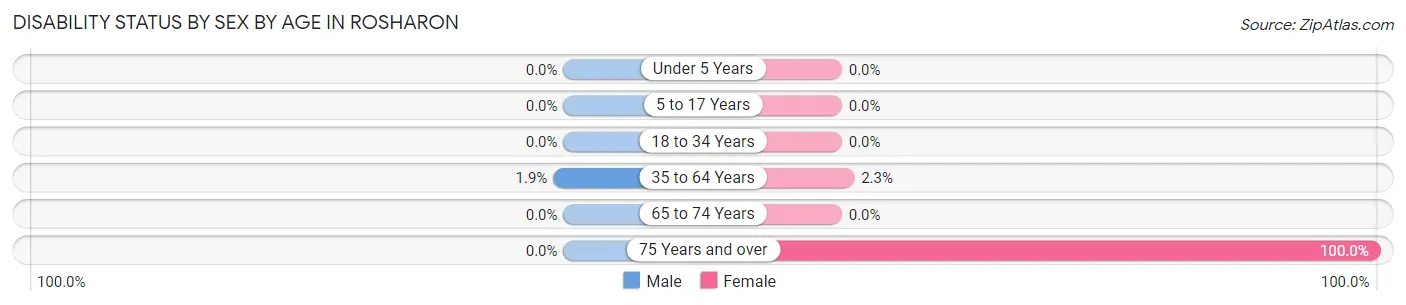
| Age Bracket | Male | Female |
| Under 5 Years | 0 (0.0%) | 0 (0.0%) |
| 5 to 17 Years | 0 (0.0%) | 0 (0.0%) |
| 18 to 34 Years | 0 (0.0%) | 0 (0.0%) |
| 35 to 64 Years | 11 (1.9%) | 10 (2.3%) |
| 65 to 74 Years | 0 (0.0%) | 0 (0.0%) |
| 75 Years and over | 0 (0.0%) | 159 (100.0%) |
Disability Class by Sex by Age in Rosharon
Disability Class: Hearing Difficulty
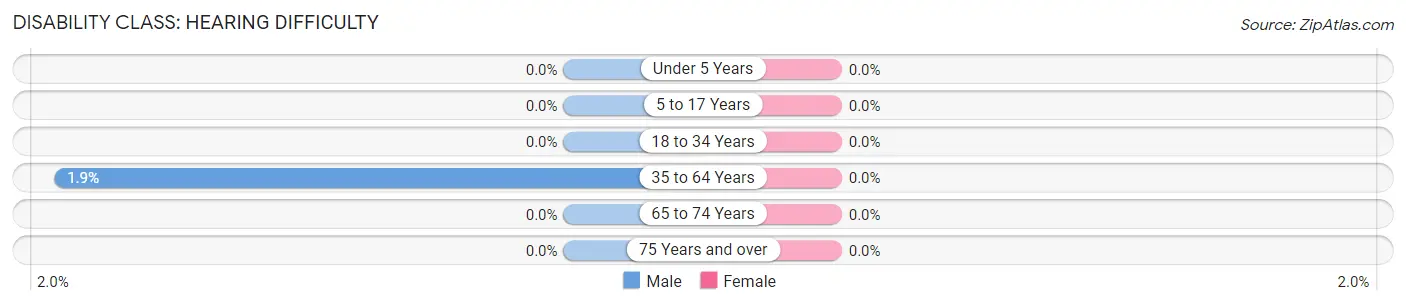
| Age Bracket | Male | Female |
| Under 5 Years | 0 (0.0%) | 0 (0.0%) |
| 5 to 17 Years | 0 (0.0%) | 0 (0.0%) |
| 18 to 34 Years | 0 (0.0%) | 0 (0.0%) |
| 35 to 64 Years | 11 (1.9%) | 0 (0.0%) |
| 65 to 74 Years | 0 (0.0%) | 0 (0.0%) |
| 75 Years and over | 0 (0.0%) | 0 (0.0%) |
Disability Class: Vision Difficulty
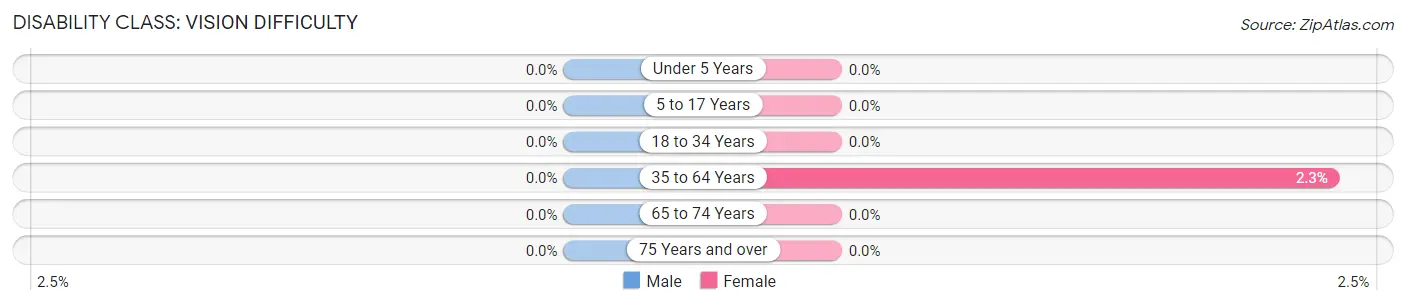
| Age Bracket | Male | Female |
| Under 5 Years | 0 (0.0%) | 0 (0.0%) |
| 5 to 17 Years | 0 (0.0%) | 0 (0.0%) |
| 18 to 34 Years | 0 (0.0%) | 0 (0.0%) |
| 35 to 64 Years | 0 (0.0%) | 10 (2.3%) |
| 65 to 74 Years | 0 (0.0%) | 0 (0.0%) |
| 75 Years and over | 0 (0.0%) | 0 (0.0%) |
Disability Class: Cognitive Difficulty
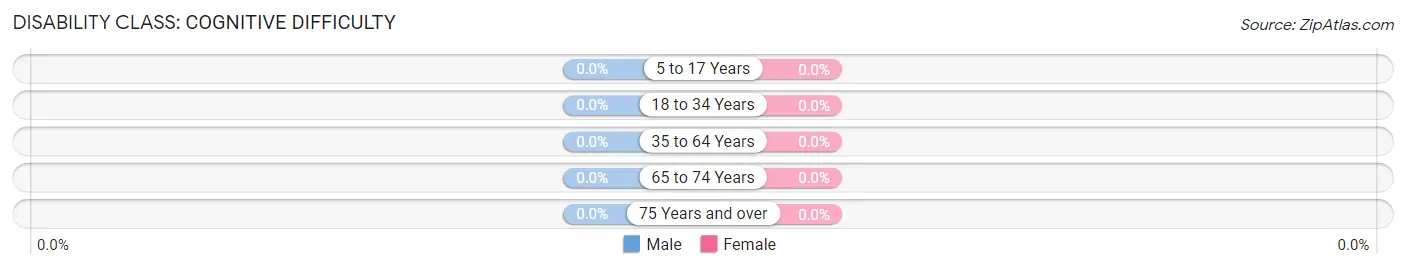
| Age Bracket | Male | Female |
| 5 to 17 Years | 0 (0.0%) | 0 (0.0%) |
| 18 to 34 Years | 0 (0.0%) | 0 (0.0%) |
| 35 to 64 Years | 0 (0.0%) | 0 (0.0%) |
| 65 to 74 Years | 0 (0.0%) | 0 (0.0%) |
| 75 Years and over | 0 (0.0%) | 0 (0.0%) |
Disability Class: Ambulatory Difficulty
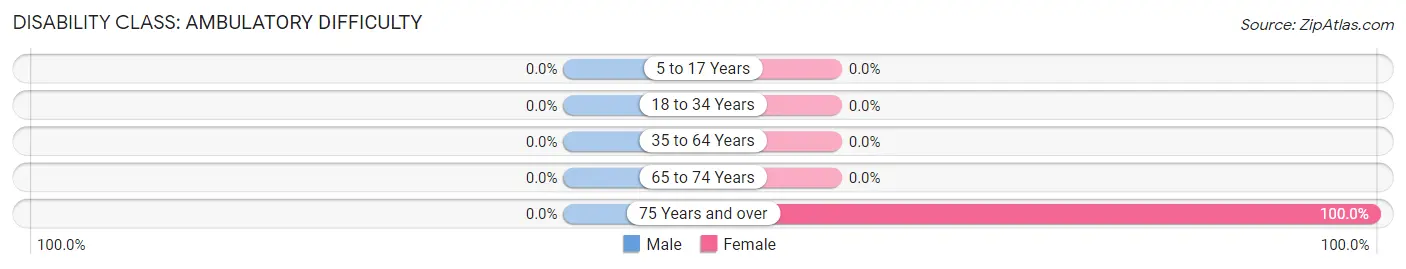
| Age Bracket | Male | Female |
| 5 to 17 Years | 0 (0.0%) | 0 (0.0%) |
| 18 to 34 Years | 0 (0.0%) | 0 (0.0%) |
| 35 to 64 Years | 0 (0.0%) | 0 (0.0%) |
| 65 to 74 Years | 0 (0.0%) | 0 (0.0%) |
| 75 Years and over | 0 (0.0%) | 159 (100.0%) |
Disability Class: Self-Care Difficulty
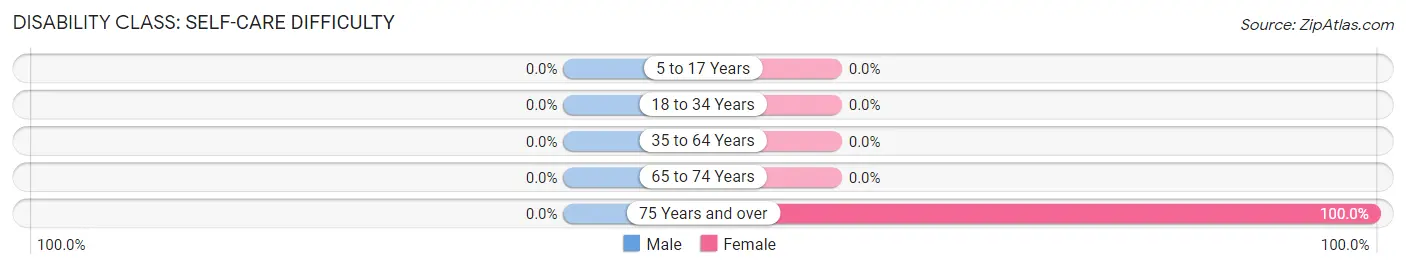
| Age Bracket | Male | Female |
| 5 to 17 Years | 0 (0.0%) | 0 (0.0%) |
| 18 to 34 Years | 0 (0.0%) | 0 (0.0%) |
| 35 to 64 Years | 0 (0.0%) | 0 (0.0%) |
| 65 to 74 Years | 0 (0.0%) | 0 (0.0%) |
| 75 Years and over | 0 (0.0%) | 159 (100.0%) |
Technology Access in Rosharon
Computing Device Access in Rosharon
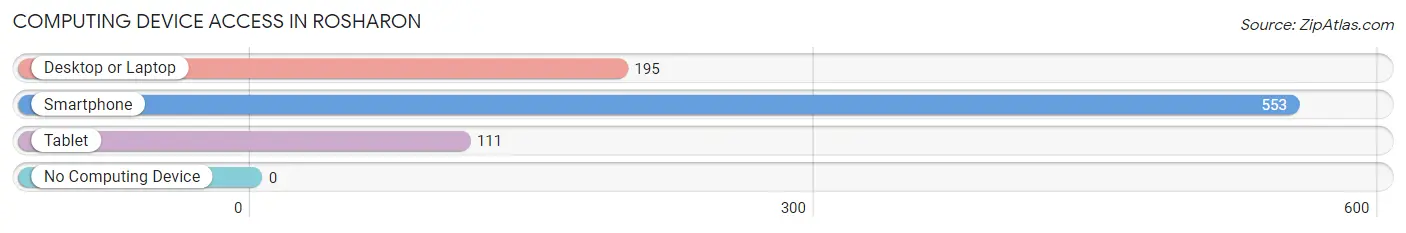
| Device Type | # Households | % Households |
| Desktop or Laptop | 195 | 35.3% |
| Smartphone | 553 | 100.0% |
| Tablet | 111 | 20.1% |
| No Computing Device | 0 | 0.0% |
| Total | 553 | 100.0% |
Internet Access in Rosharon
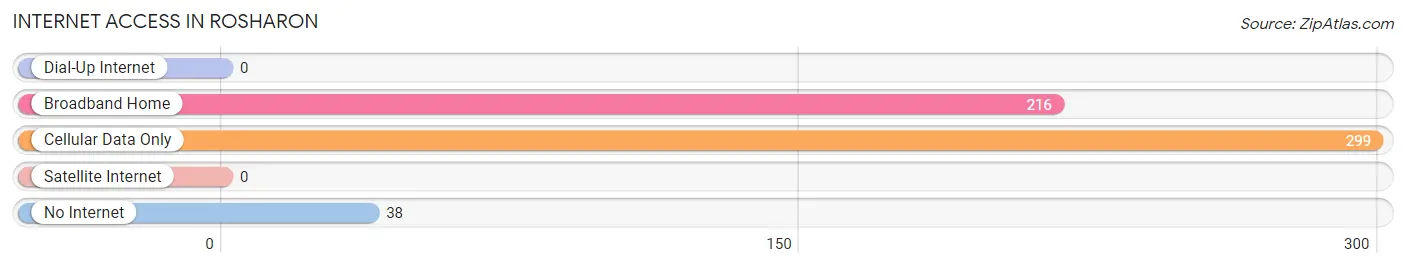
| Internet Type | # Households | % Households |
| Dial-Up Internet | 0 | 0.0% |
| Broadband Home | 216 | 39.1% |
| Cellular Data Only | 299 | 54.1% |
| Satellite Internet | 0 | 0.0% |
| No Internet | 38 | 6.9% |
| Total | 553 | 100.0% |
Rosharon Summary
Rosharon is a small unincorporated community located in Brazoria County, Texas, United States. It is situated about 25 miles south of Houston and is part of the Houston–The Woodlands–Sugar Land metropolitan area. The population of Rosharon was estimated to be 1,845 in 2019.
History
Rosharon was first settled in the late 1800s by a group of German immigrants. The town was originally known as “Rosenberg”, after the German word for rose. The name was later changed to Rosharon, which is derived from the Spanish phrase “rostro de aron”, meaning “face of Aaron”.
The town was officially incorporated in 1909 and was home to a variety of businesses, including a cotton gin, a general store, and a post office. The town also had a school, which was established in 1910.
Geography
Rosharon is located in Brazoria County, Texas, about 25 miles south of Houston. It is situated on the Gulf Coast, near the San Bernard River. The town is surrounded by prairies and wetlands, and is home to a variety of wildlife, including deer, alligators, and waterfowl.
The climate in Rosharon is humid subtropical, with hot summers and mild winters. The average annual temperature is around 70°F (21°C).
Economy
Rosharon’s economy is largely based on agriculture and oil and gas production. The town is home to several large farms, which produce cotton, corn, and other crops. The town is also home to several oil and gas production companies, which employ many of the town’s residents.
In addition to agriculture and oil and gas production, Rosharon is home to several small businesses, including restaurants, convenience stores, and auto repair shops.
Demographics
As of 2019, the population of Rosharon was estimated to be 1,845. The racial makeup of the town was 79.3% White, 11.2% Hispanic or Latino, 6.2% African American, and 3.3% other.
The median household income in Rosharon was $50,945 in 2019, and the median home value was $133,400. The town has a poverty rate of 16.3%, which is higher than the national average.
Rosharon is served by the Brazosport Independent School District. The town is home to several churches, including the First Baptist Church of Rosharon and the Church of Jesus Christ of Latter-day Saints.
Conclusion
Rosharon is a small unincorporated community located in Brazoria County, Texas, United States. It is situated about 25 miles south of Houston and is part of the Houston–The Woodlands–Sugar Land metropolitan area. The population of Rosharon was estimated to be 1,845 in 2019. The town is surrounded by prairies and wetlands, and is home to a variety of wildlife. The economy of Rosharon is largely based on agriculture and oil and gas production. The racial makeup of the town was 79.3% White, 11.2% Hispanic or Latino, 6.2% African American, and 3.3% other. The median household income in Rosharon was $50,945 in 2019, and the median home value was $133,400. The town is served by the Brazosport Independent School District and is home to several churches.
Common Questions
What is Per Capita Income in Rosharon?
Per Capita income in Rosharon is $29,894.
What is the Median Family Income in Rosharon?
Median Family Income in Rosharon is $95,890.
What is the Median Household income in Rosharon?
Median Household Income in Rosharon is $83,708.
What is Income or Wage Gap in Rosharon?
Income or Wage Gap in Rosharon is 35.9%.
Women in Rosharon earn 64.1 cents for every dollar earned by a man.
What is Inequality or Gini Index in Rosharon?
Inequality or Gini Index in Rosharon is 0.25.
What is the Total Population of Rosharon?
Total Population of Rosharon is 1,689.
What is the Total Male Population of Rosharon?
Total Male Population of Rosharon is 828.
What is the Total Female Population of Rosharon?
Total Female Population of Rosharon is 861.
What is the Ratio of Males per 100 Females in Rosharon?
There are 96.17 Males per 100 Females in Rosharon.
What is the Ratio of Females per 100 Males in Rosharon?
There are 103.99 Females per 100 Males in Rosharon.
What is the Median Population Age in Rosharon?
Median Population Age in Rosharon is 52.1 Years.
What is the Average Family Size in Rosharon
Average Family Size in Rosharon is 3.7 People.
What is the Average Household Size in Rosharon
Average Household Size in Rosharon is 3.0 People.
How Large is the Labor Force in Rosharon?
There are 809 People in the Labor Forcein in Rosharon.
What is the Percentage of People in the Labor Force in Rosharon?
55.2% of People are in the Labor Force in Rosharon.
What is the Unemployment Rate in Rosharon?
Unemployment Rate in Rosharon is 36.6%.