Zip Codes with the Highest Percentage of Population Employed in Administrative & Support Services in El Paso, TX
RELATED REPORTS & OPTIONS
Administrative & Support Services
El Paso
Compare Zip Codes
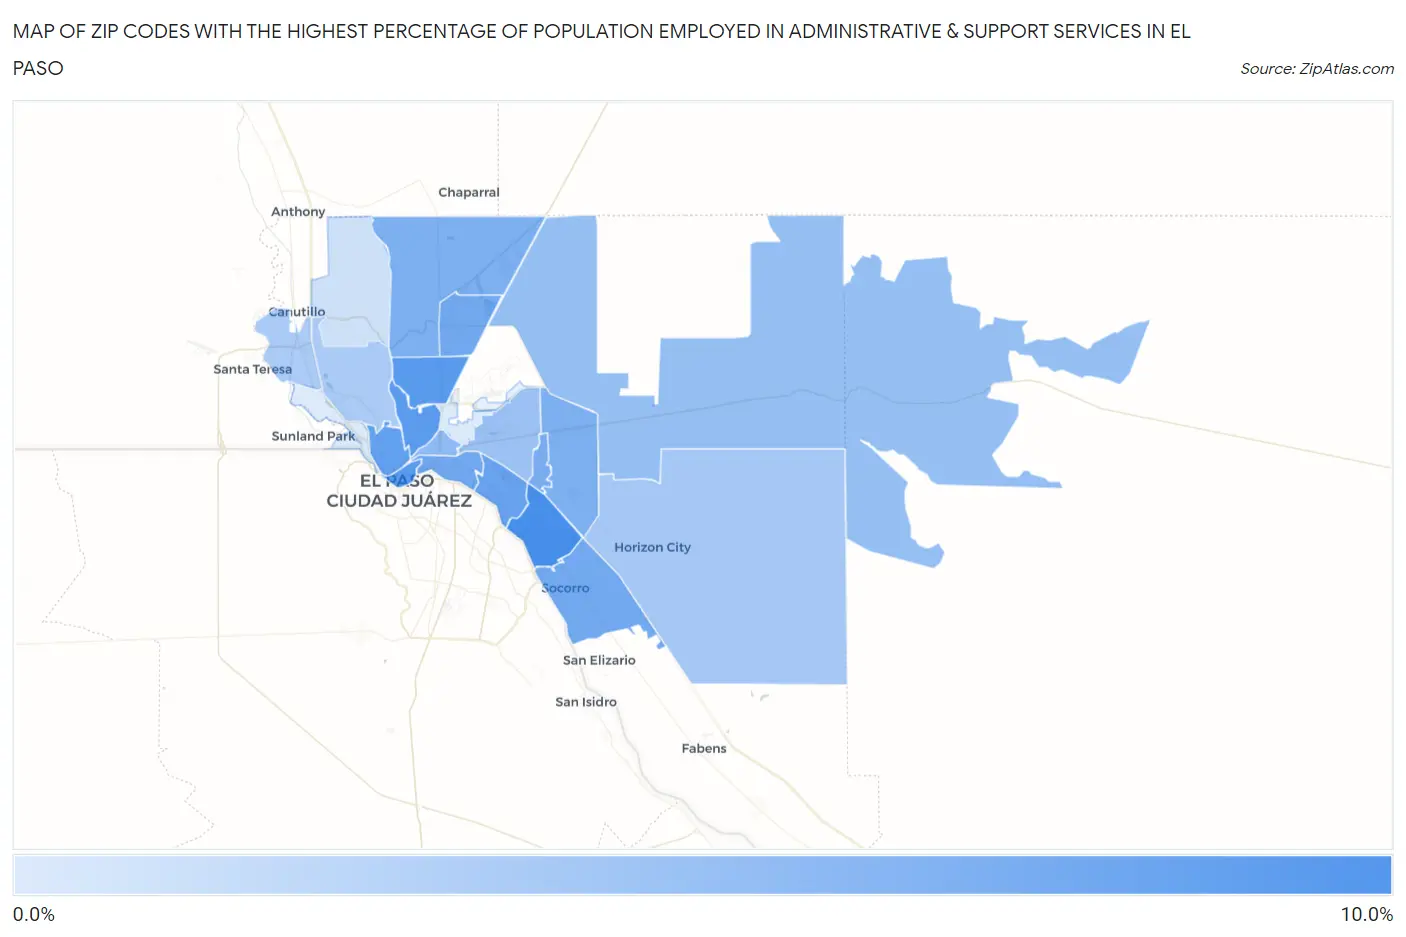
Map of Zip Codes with the Highest Percentage of Population Employed in Administrative & Support Services in El Paso
0.99%
9.7%
Zip Codes with the Highest Percentage of Population Employed in Administrative & Support Services in El Paso, TX
| Zip Code | % Employed | vs State | vs National | |
| 1. | 79907 | 9.7% | 4.4%(+5.24)#95 | 4.1%(+5.51)#1,413 |
| 2. | 79904 | 8.7% | 4.4%(+4.30)#120 | 4.1%(+4.57)#1,837 |
| 3. | 79901 | 8.7% | 4.4%(+4.28)#122 | 4.1%(+4.54)#1,853 |
| 4. | 79930 | 8.6% | 4.4%(+4.20)#128 | 4.1%(+4.47)#1,902 |
| 5. | 79902 | 8.0% | 4.4%(+3.58)#152 | 4.1%(+3.85)#2,278 |
| 6. | 79915 | 7.7% | 4.4%(+3.30)#174 | 4.1%(+3.56)#2,499 |
| 7. | 79905 | 7.2% | 4.4%(+2.74)#212 | 4.1%(+3.00)#3,026 |
| 8. | 79927 | 7.1% | 4.4%(+2.68)#220 | 4.1%(+2.95)#3,106 |
| 9. | 79924 | 7.1% | 4.4%(+2.67)#223 | 4.1%(+2.93)#3,124 |
| 10. | 79935 | 6.6% | 4.4%(+2.19)#277 | 4.1%(+2.45)#3,763 |
| 11. | 79934 | 6.5% | 4.4%(+2.11)#286 | 4.1%(+2.38)#3,869 |
| 12. | 79936 | 6.5% | 4.4%(+2.06)#291 | 4.1%(+2.32)#3,949 |
| 13. | 79903 | 5.4% | 4.4%(+0.986)#444 | 4.1%(+1.25)#6,071 |
| 14. | 79938 | 5.0% | 4.4%(+0.594)#517 | 4.1%(+0.860)#7,075 |
| 15. | 79925 | 4.8% | 4.4%(+0.379)#567 | 4.1%(+0.645)#7,736 |
| 16. | 79928 | 4.1% | 4.4%(-0.350)#731 | 4.1%(-0.084)#10,392 |
| 17. | 79932 | 3.9% | 4.4%(-0.507)#768 | 4.1%(-0.241)#11,063 |
| 18. | 79912 | 3.9% | 4.4%(-0.540)#775 | 4.1%(-0.273)#11,214 |
| 19. | 79911 | 1.7% | 4.4%(-2.68)#1,340 | 4.1%(-2.41)#21,794 |
| 20. | 79906 | 1.1% | 4.4%(-3.36)#1,448 | 4.1%(-3.10)#24,332 |
| 21. | 79922 | 0.99% | 4.4%(-3.42)#1,453 | 4.1%(-3.16)#24,505 |
1
Common Questions
What are the Top 10 Zip Codes with the Highest Percentage of Population Employed in Administrative & Support Services in El Paso, TX?
Top 10 Zip Codes with the Highest Percentage of Population Employed in Administrative & Support Services in El Paso, TX are:
What zip code has the Highest Percentage of Population Employed in Administrative & Support Services in El Paso, TX?
79907 has the Highest Percentage of Population Employed in Administrative & Support Services in El Paso, TX with 9.7%.
What is the Percentage of Population Employed in Administrative & Support Services in El Paso, TX?
Percentage of Population Employed in Administrative & Support Services in El Paso is 6.2%.
What is the Percentage of Population Employed in Administrative & Support Services in Texas?
Percentage of Population Employed in Administrative & Support Services in Texas is 4.4%.
What is the Percentage of Population Employed in Administrative & Support Services in the United States?
Percentage of Population Employed in Administrative & Support Services in the United States is 4.1%.