Zip Codes with the Highest Percentage of Population Employed in Administrative & Support Services in Port Arthur, TX
RELATED REPORTS & OPTIONS
Administrative & Support Services
Port Arthur
Compare Zip Codes
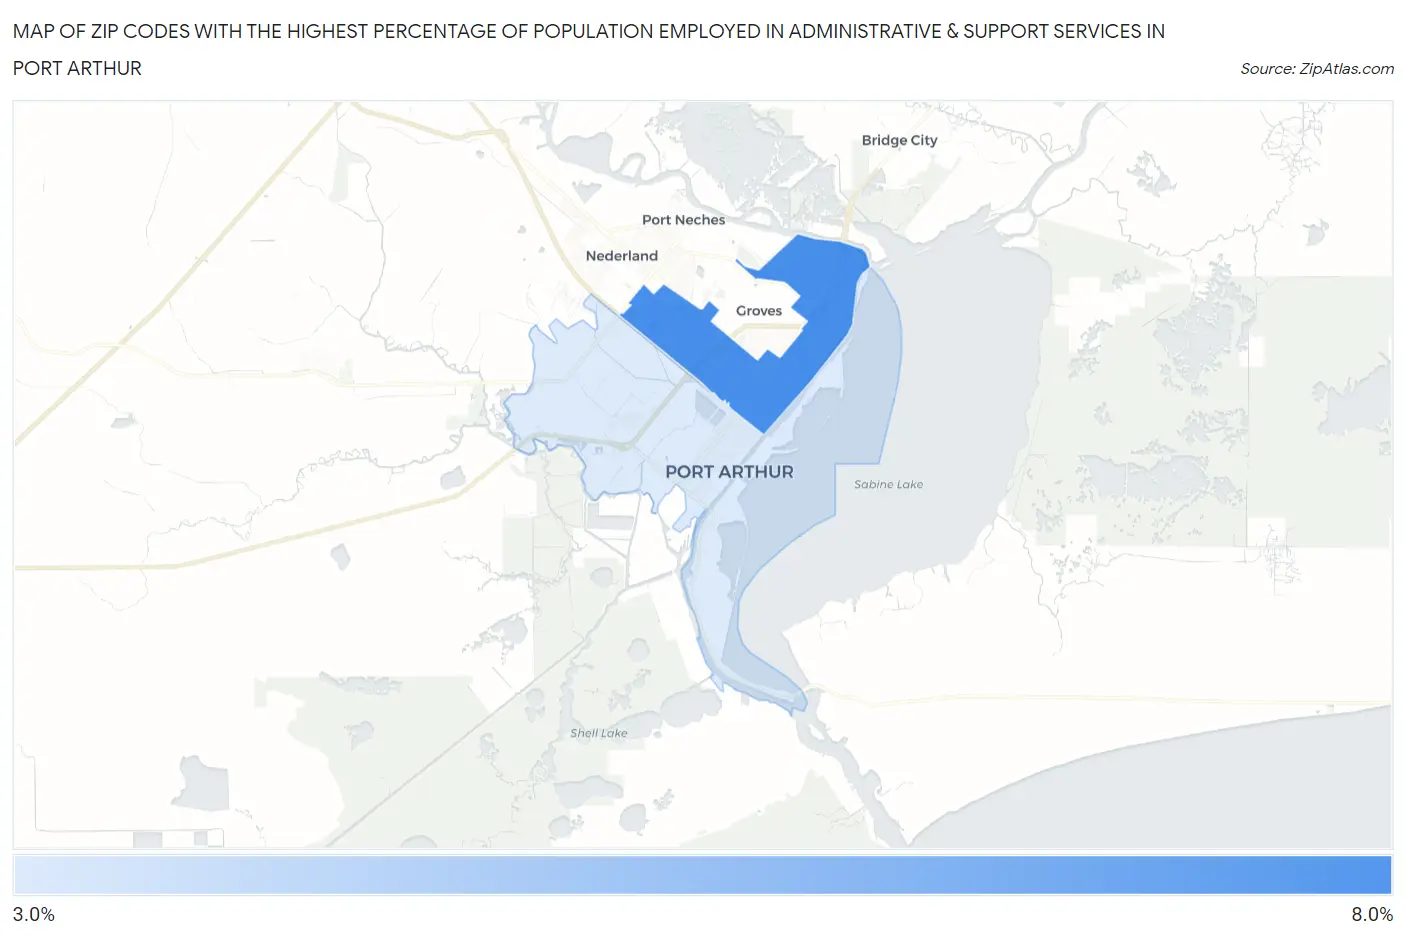
Map of Zip Codes with the Highest Percentage of Population Employed in Administrative & Support Services in Port Arthur
3.7%
7.0%
Zip Codes with the Highest Percentage of Population Employed in Administrative & Support Services in Port Arthur, TX
| Zip Code | % Employed | vs State | vs National | |
| 1. | 77642 | 7.0% | 4.4%(+2.56)#231 | 4.1%(+2.83)#3,252 |
| 2. | 77640 | 3.7% | 4.4%(-0.675)#811 | 4.1%(-0.409)#11,810 |
1
Common Questions
What are the Top Zip Codes with the Highest Percentage of Population Employed in Administrative & Support Services in Port Arthur, TX?
Top Zip Codes with the Highest Percentage of Population Employed in Administrative & Support Services in Port Arthur, TX are:
What zip code has the Highest Percentage of Population Employed in Administrative & Support Services in Port Arthur, TX?
77642 has the Highest Percentage of Population Employed in Administrative & Support Services in Port Arthur, TX with 7.0%.
What is the Percentage of Population Employed in Administrative & Support Services in Port Arthur, TX?
Percentage of Population Employed in Administrative & Support Services in Port Arthur is 6.0%.
What is the Percentage of Population Employed in Administrative & Support Services in Texas?
Percentage of Population Employed in Administrative & Support Services in Texas is 4.4%.
What is the Percentage of Population Employed in Administrative & Support Services in the United States?
Percentage of Population Employed in Administrative & Support Services in the United States is 4.1%.