Zip Codes with the Highest Percentage of Population Employed in Administrative & Support Services in Tyler, TX
RELATED REPORTS & OPTIONS
Administrative & Support Services
Tyler
Compare Zip Codes
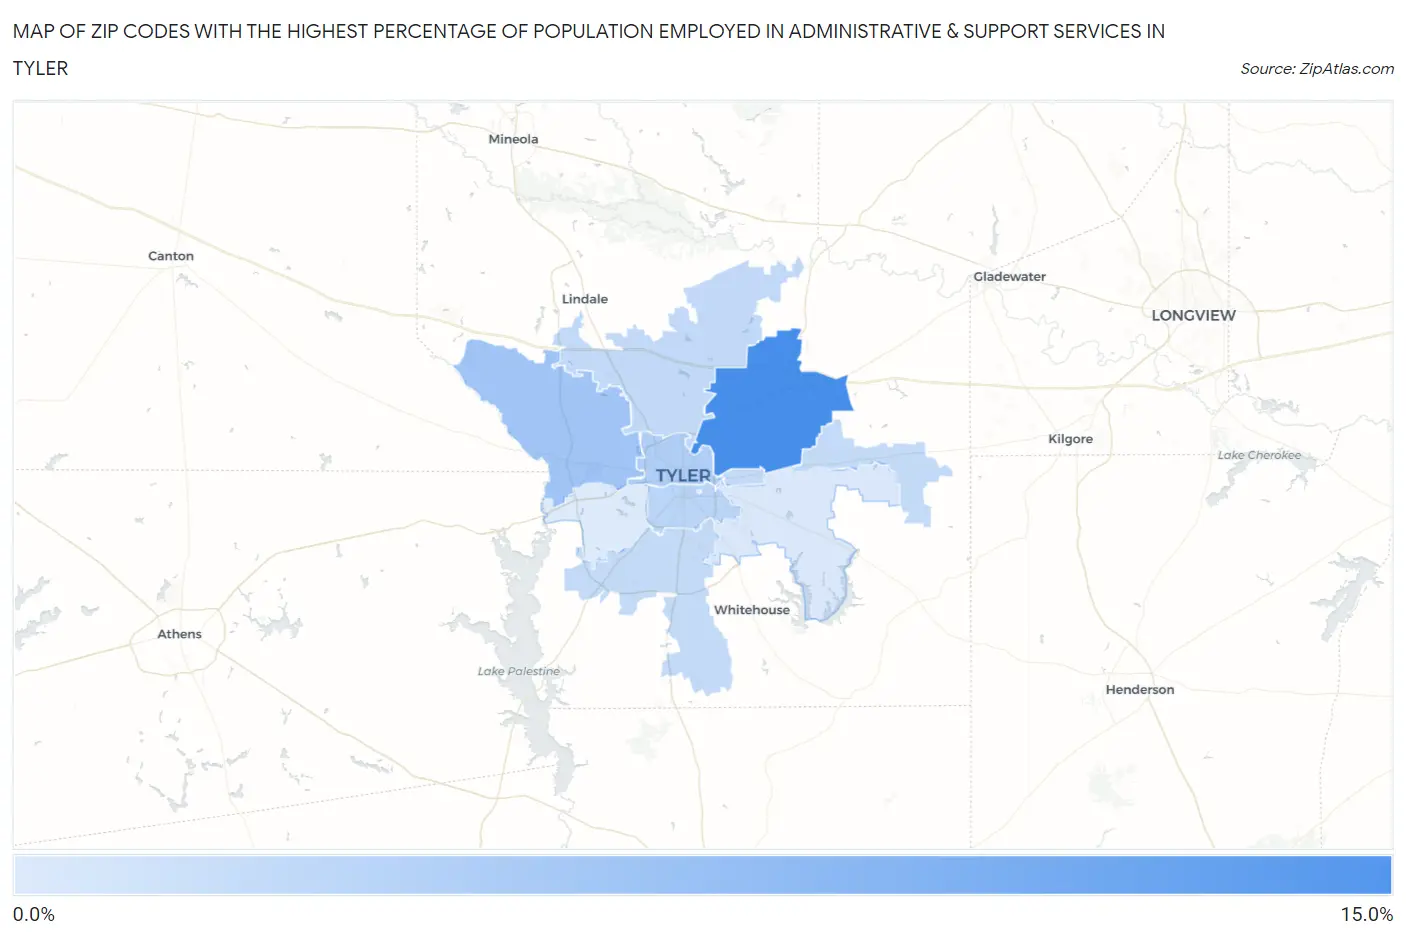
Map of Zip Codes with the Highest Percentage of Population Employed in Administrative & Support Services in Tyler
1.6%
10.7%
Zip Codes with the Highest Percentage of Population Employed in Administrative & Support Services in Tyler, TX
| Zip Code | % Employed | vs State | vs National | |
| 1. | 75708 | 10.7% | 4.4%(+6.30)#71 | 4.1%(+6.56)#1,089 |
| 2. | 75704 | 5.1% | 4.4%(+0.709)#500 | 4.1%(+0.976)#6,778 |
| 3. | 75702 | 4.2% | 4.4%(-0.236)#701 | 4.1%(+0.031)#9,913 |
| 4. | 75711 | 3.7% | 4.4%(-0.712)#819 | 4.1%(-0.446)#11,980 |
| 5. | 75701 | 3.7% | 4.4%(-0.725)#822 | 4.1%(-0.459)#12,024 |
| 6. | 75706 | 3.3% | 4.4%(-1.14)#943 | 4.1%(-0.874)#14,075 |
| 7. | 75703 | 3.2% | 4.4%(-1.24)#983 | 4.1%(-0.975)#14,607 |
| 8. | 75705 | 3.1% | 4.4%(-1.33)#1,005 | 4.1%(-1.06)#15,067 |
| 9. | 75707 | 1.8% | 4.4%(-2.64)#1,328 | 4.1%(-2.38)#21,644 |
| 10. | 75709 | 1.6% | 4.4%(-2.78)#1,364 | 4.1%(-2.52)#22,234 |
1
Common Questions
What are the Top 5 Zip Codes with the Highest Percentage of Population Employed in Administrative & Support Services in Tyler, TX?
Top 5 Zip Codes with the Highest Percentage of Population Employed in Administrative & Support Services in Tyler, TX are:
What zip code has the Highest Percentage of Population Employed in Administrative & Support Services in Tyler, TX?
75708 has the Highest Percentage of Population Employed in Administrative & Support Services in Tyler, TX with 10.7%.
What is the Percentage of Population Employed in Administrative & Support Services in Tyler, TX?
Percentage of Population Employed in Administrative & Support Services in Tyler is 3.3%.
What is the Percentage of Population Employed in Administrative & Support Services in Texas?
Percentage of Population Employed in Administrative & Support Services in Texas is 4.4%.
What is the Percentage of Population Employed in Administrative & Support Services in the United States?
Percentage of Population Employed in Administrative & Support Services in the United States is 4.1%.