Snook, TX Map & Demographics
Snook Map
Snook Overview
$59,214
PER CAPITA INCOME
$118,750
AVG FAMILY INCOME
$76,576
AVG HOUSEHOLD INCOME
41.4%
WAGE / INCOME GAP [ % ]
58.6¢/ $1
WAGE / INCOME GAP [ $ ]
0.38
INEQUALITY / GINI INDEX
514
TOTAL POPULATION
246
MALE POPULATION
268
FEMALE POPULATION
91.79
MALES / 100 FEMALES
108.94
FEMALES / 100 MALES
49.5
MEDIAN AGE
2.4
AVG FAMILY SIZE
1.9
AVG HOUSEHOLD SIZE
340
LABOR FORCE [ PEOPLE ]
69.7%
PERCENT IN LABOR FORCE
Snook Zip Codes
Snook Area Codes
Income in Snook
Income Overview in Snook
Per Capita Income in Snook is $59,214, while median incomes of families and households are $118,750 and $76,576 respectively.
| Characteristic | Number | Measure |
| Per Capita Income | 514 | $59,214 |
| Median Family Income | 164 | $118,750 |
| Mean Family Income | 164 | $124,471 |
| Median Household Income | 273 | $76,576 |
| Mean Household Income | 273 | $104,798 |
| Income Deficit | 164 | $0 |
| Wage / Income Gap (%) | 514 | 41.36% |
| Wage / Income Gap ($) | 514 | 58.64¢ per $1 |
| Gini / Inequality Index | 514 | 0.38 |
Earnings by Sex in Snook
Average Earnings in Snook are $65,250, $77,969 for men and $45,724 for women, a difference of 41.4%.
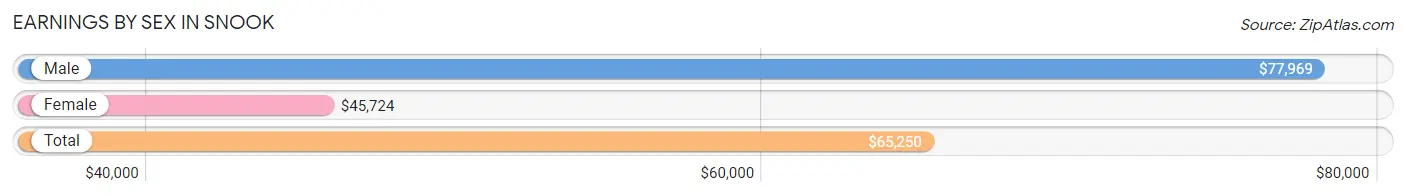
| Sex | Number | Average Earnings |
| Male | 177 (49.2%) | $77,969 |
| Female | 183 (50.8%) | $45,724 |
| Total | 360 (100.0%) | $65,250 |
Earnings by Sex by Income Bracket in Snook
The most common earnings brackets in Snook are $100,000+ for men (70 | 39.6%) and $65,000 to $74,999 for women (37 | 20.2%).
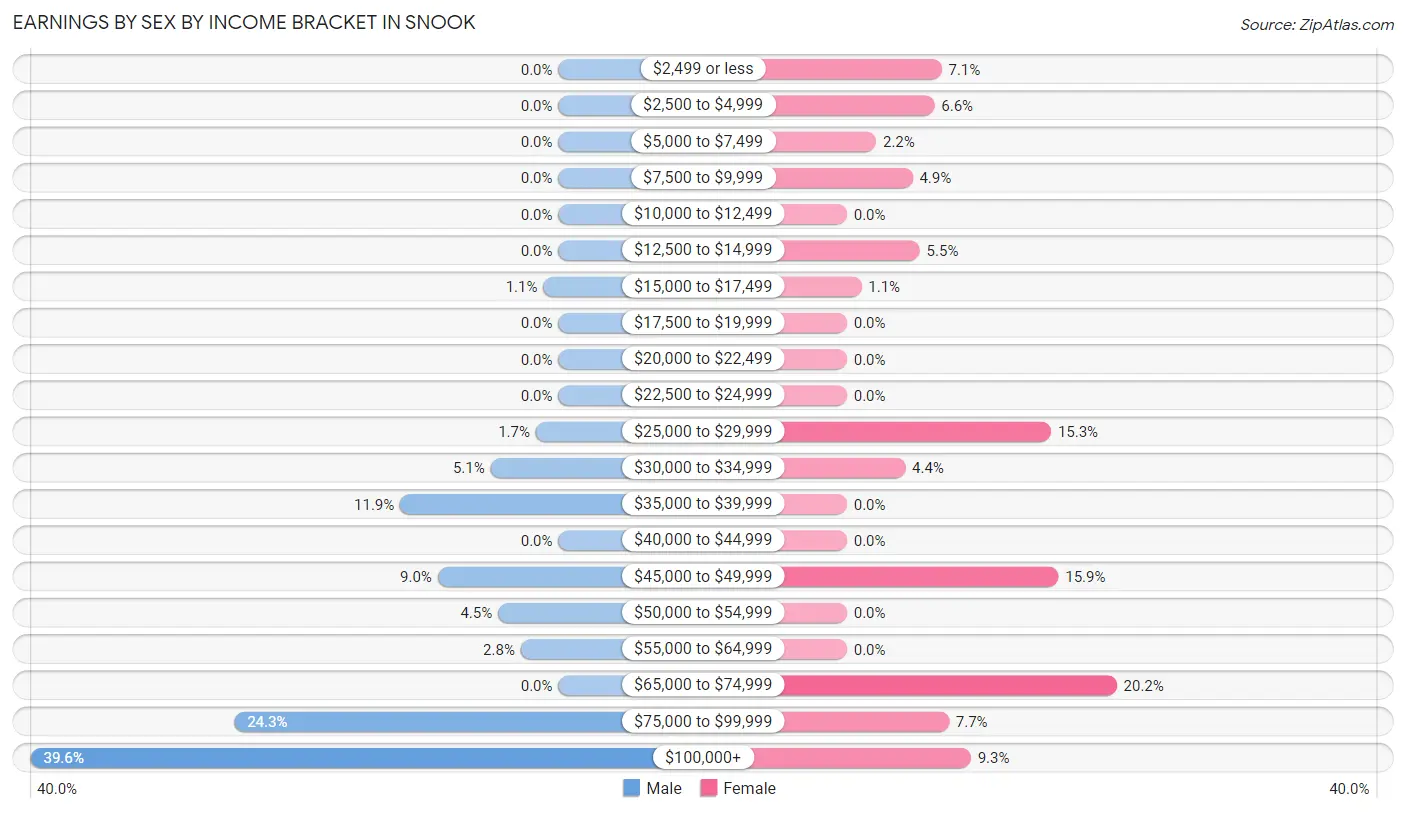
| Income | Male | Female |
| $2,499 or less | 0 (0.0%) | 13 (7.1%) |
| $2,500 to $4,999 | 0 (0.0%) | 12 (6.6%) |
| $5,000 to $7,499 | 0 (0.0%) | 4 (2.2%) |
| $7,500 to $9,999 | 0 (0.0%) | 9 (4.9%) |
| $10,000 to $12,499 | 0 (0.0%) | 0 (0.0%) |
| $12,500 to $14,999 | 0 (0.0%) | 10 (5.5%) |
| $15,000 to $17,499 | 2 (1.1%) | 2 (1.1%) |
| $17,500 to $19,999 | 0 (0.0%) | 0 (0.0%) |
| $20,000 to $22,499 | 0 (0.0%) | 0 (0.0%) |
| $22,500 to $24,999 | 0 (0.0%) | 0 (0.0%) |
| $25,000 to $29,999 | 3 (1.7%) | 28 (15.3%) |
| $30,000 to $34,999 | 9 (5.1%) | 8 (4.4%) |
| $35,000 to $39,999 | 21 (11.9%) | 0 (0.0%) |
| $40,000 to $44,999 | 0 (0.0%) | 0 (0.0%) |
| $45,000 to $49,999 | 16 (9.0%) | 29 (15.9%) |
| $50,000 to $54,999 | 8 (4.5%) | 0 (0.0%) |
| $55,000 to $64,999 | 5 (2.8%) | 0 (0.0%) |
| $65,000 to $74,999 | 0 (0.0%) | 37 (20.2%) |
| $75,000 to $99,999 | 43 (24.3%) | 14 (7.6%) |
| $100,000+ | 70 (39.6%) | 17 (9.3%) |
| Total | 177 (100.0%) | 183 (100.0%) |
Earnings by Sex by Educational Attainment in Snook
Average earnings in Snook are $77,969 for men and $47,875 for women, a difference of 38.6%. Men with an educational attainment of less than high school enjoy the highest average annual earnings of $158,321, while those with college or associate's degree education earn the least with $75,489. Women with an educational attainment of graduate degree earn the most with the average annual earnings of $69,259, while those with college or associate's degree education have the smallest earnings of $28,563.
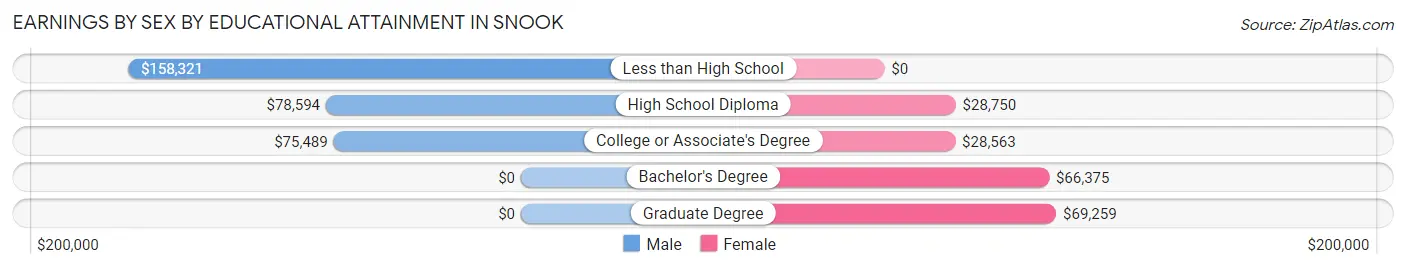
| Educational Attainment | Male Income | Female Income |
| Less than High School | $158,321 | $0 |
| High School Diploma | $78,594 | $28,750 |
| College or Associate's Degree | $75,489 | $28,563 |
| Bachelor's Degree | - | - |
| Graduate Degree | - | - |
| Total | $77,969 | $47,875 |
Family Income in Snook
Family Income Brackets in Snook
According to the Snook family income data, there are 45 families falling into the $150,000 to $199,999 income range, which is the most common income bracket and makes up 27.4% of all families.
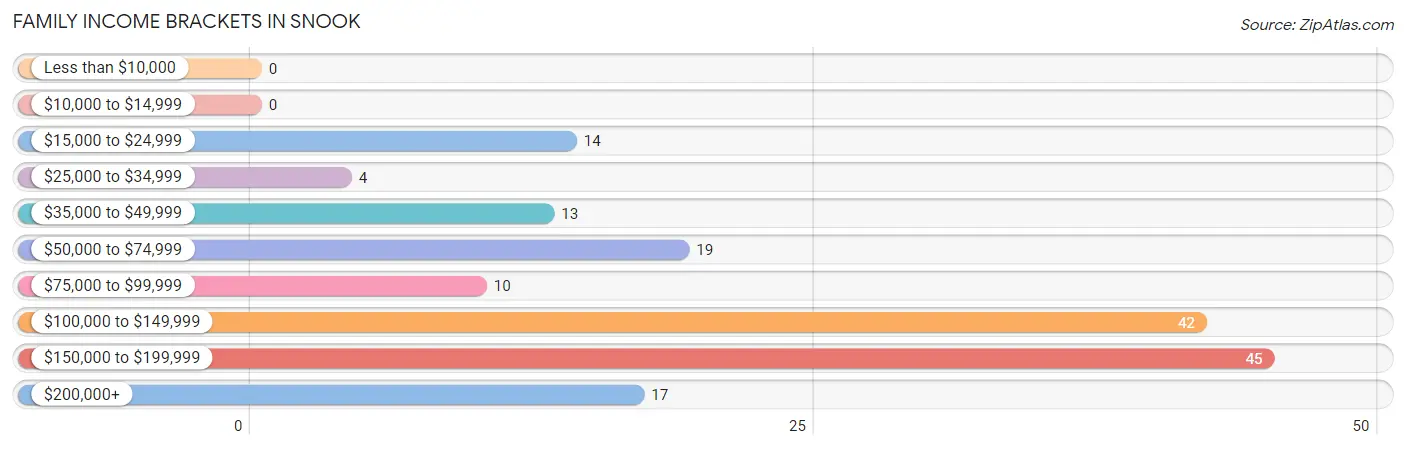
| Income Bracket | # Families | % Families |
| Less than $10,000 | 0 | 0.0% |
| $10,000 to $14,999 | 0 | 0.0% |
| $15,000 to $24,999 | 14 | 8.5% |
| $25,000 to $34,999 | 4 | 2.4% |
| $35,000 to $49,999 | 13 | 7.9% |
| $50,000 to $74,999 | 19 | 11.6% |
| $75,000 to $99,999 | 10 | 6.1% |
| $100,000 to $149,999 | 42 | 25.6% |
| $150,000 to $199,999 | 45 | 27.4% |
| $200,000+ | 17 | 10.4% |
Family Income by Famaliy Size in Snook
2-person families (122 | 74.4%) account for the highest median family income in Snook with $155,250 per family, while 2-person families (122 | 74.4%) have the highest median income of $77,625 per family member.
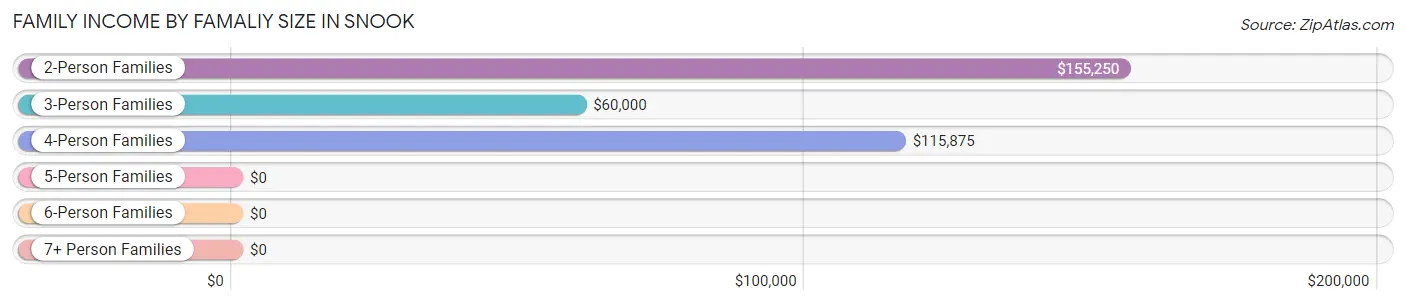
| Income Bracket | # Families | Median Income |
| 2-Person Families | 122 (74.4%) | $155,250 |
| 3-Person Families | 16 (9.8%) | $60,000 |
| 4-Person Families | 26 (15.9%) | $115,875 |
| 5-Person Families | 0 (0.0%) | $0 |
| 6-Person Families | 0 (0.0%) | $0 |
| 7+ Person Families | 0 (0.0%) | $0 |
| Total | 164 (100.0%) | $118,750 |
Family Income by Number of Earners in Snook
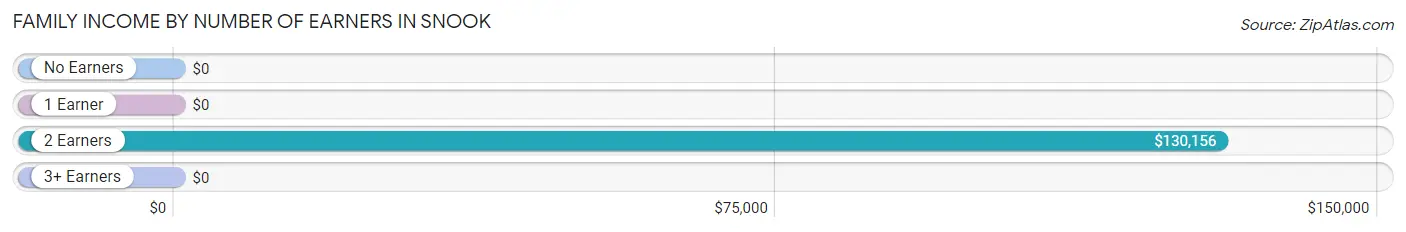
| Number of Earners | # Families | Median Income |
| No Earners | 13 (7.9%) | $0 |
| 1 Earner | 63 (38.4%) | $0 |
| 2 Earners | 79 (48.2%) | $130,156 |
| 3+ Earners | 9 (5.5%) | $0 |
| Total | 164 (100.0%) | $118,750 |
Household Income in Snook
Household Income Brackets in Snook
With 49 households falling in the category, the $50,000 to $74,999 income range is the most frequent in Snook, accounting for 17.9% of all households. In contrast, only 5 households (1.8%) fall into the $10,000 to $14,999 income bracket, making it the least populous group.
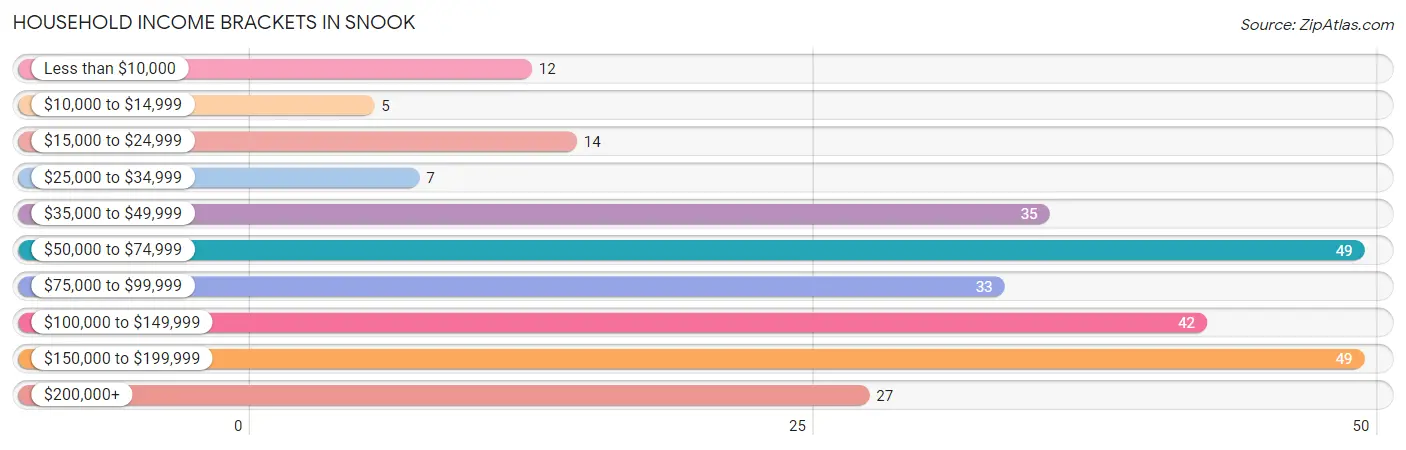
| Income Bracket | # Households | % Households |
| Less than $10,000 | 12 | 4.4% |
| $10,000 to $14,999 | 5 | 1.8% |
| $15,000 to $24,999 | 14 | 5.1% |
| $25,000 to $34,999 | 7 | 2.6% |
| $35,000 to $49,999 | 35 | 12.8% |
| $50,000 to $74,999 | 49 | 17.9% |
| $75,000 to $99,999 | 33 | 12.1% |
| $100,000 to $149,999 | 42 | 15.4% |
| $150,000 to $199,999 | 49 | 17.9% |
| $200,000+ | 27 | 9.9% |
Household Income by Householder Age in Snook
The median household income in Snook is $76,576, with the highest median household income of $117,250 found in the 45 to 64 years age bracket for the primary householder. A total of 119 households (43.6%) fall into this category. Meanwhile, the 15 to 24 years age bracket for the primary householder has the lowest median household income of $0, with 17 households (6.2%) in this group.
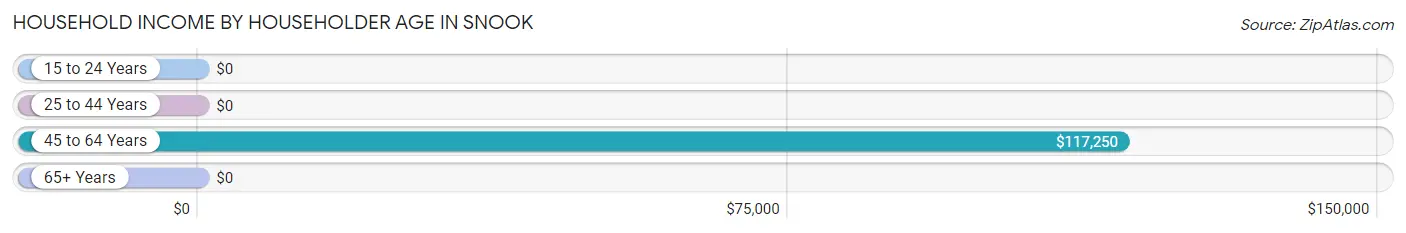
| Income Bracket | # Households | Median Income |
| 15 to 24 Years | 17 (6.2%) | $0 |
| 25 to 44 Years | 75 (27.5%) | $0 |
| 45 to 64 Years | 119 (43.6%) | $117,250 |
| 65+ Years | 62 (22.7%) | $0 |
| Total | 273 (100.0%) | $76,576 |
Poverty in Snook
Income Below Poverty by Sex and Age in Snook
With 8.1% poverty level for males and 8.2% for females among the residents of Snook, 18 to 24 year old males and 45 to 54 year old females are the most vulnerable to poverty, with 10 males (38.5%) and 10 females (50.0%) in their respective age groups living below the poverty level.
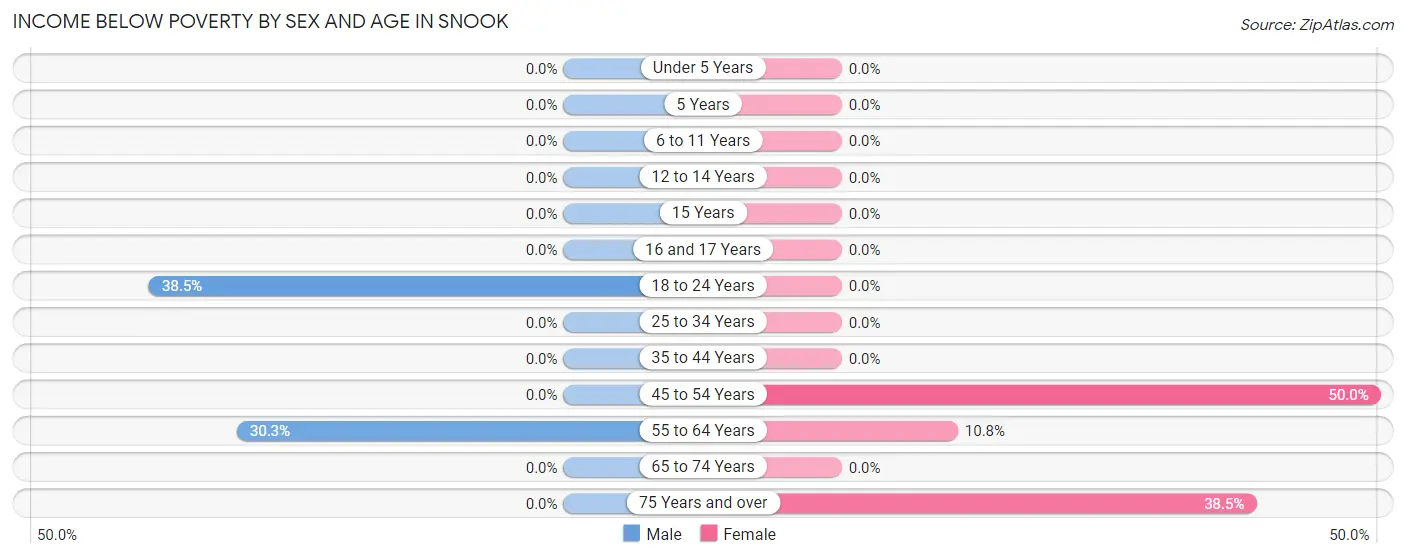
| Age Bracket | Male | Female |
| Under 5 Years | 0 (0.0%) | 0 (0.0%) |
| 5 Years | 0 (0.0%) | 0 (0.0%) |
| 6 to 11 Years | 0 (0.0%) | 0 (0.0%) |
| 12 to 14 Years | 0 (0.0%) | 0 (0.0%) |
| 15 Years | 0 (0.0%) | 0 (0.0%) |
| 16 and 17 Years | 0 (0.0%) | 0 (0.0%) |
| 18 to 24 Years | 10 (38.5%) | 0 (0.0%) |
| 25 to 34 Years | 0 (0.0%) | 0 (0.0%) |
| 35 to 44 Years | 0 (0.0%) | 0 (0.0%) |
| 45 to 54 Years | 0 (0.0%) | 10 (50.0%) |
| 55 to 64 Years | 10 (30.3%) | 7 (10.8%) |
| 65 to 74 Years | 0 (0.0%) | 0 (0.0%) |
| 75 Years and over | 0 (0.0%) | 5 (38.5%) |
| Total | 20 (8.1%) | 22 (8.2%) |
Income Above Poverty by Sex and Age in Snook
According to the poverty statistics in Snook, males aged 12 to 14 years and females aged 6 to 11 years are the age groups that are most secure financially, with 100.0% of males and 100.0% of females in these age groups living above the poverty line.
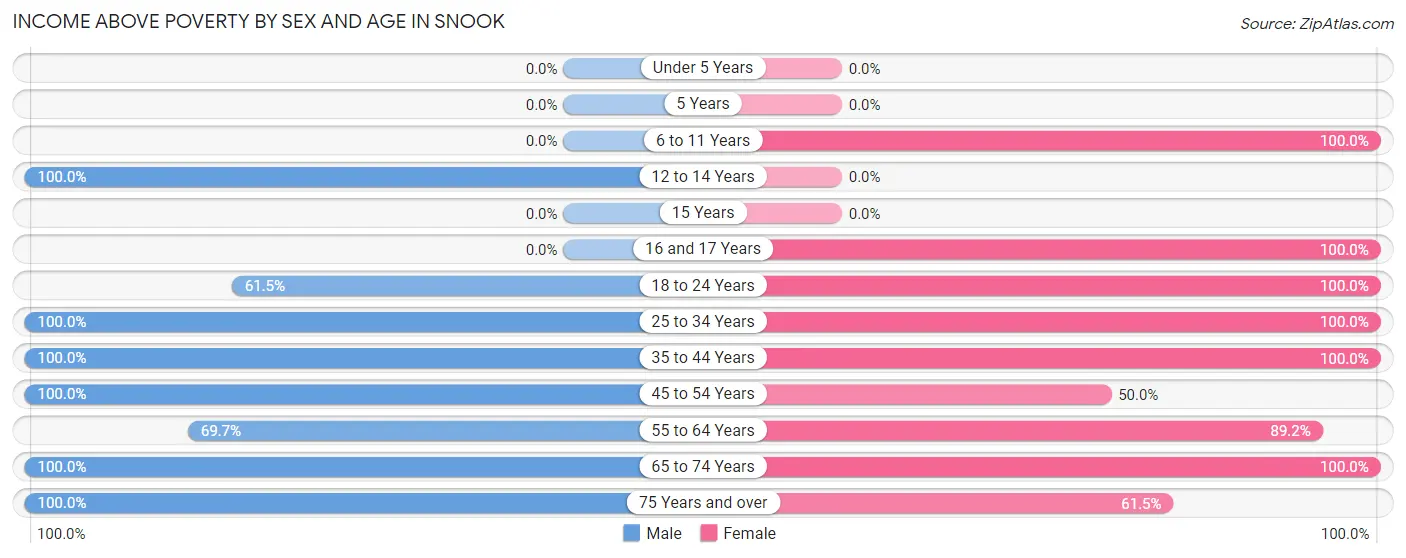
| Age Bracket | Male | Female |
| Under 5 Years | 0 (0.0%) | 0 (0.0%) |
| 5 Years | 0 (0.0%) | 0 (0.0%) |
| 6 to 11 Years | 0 (0.0%) | 13 (100.0%) |
| 12 to 14 Years | 13 (100.0%) | 0 (0.0%) |
| 15 Years | 0 (0.0%) | 0 (0.0%) |
| 16 and 17 Years | 0 (0.0%) | 7 (100.0%) |
| 18 to 24 Years | 16 (61.5%) | 31 (100.0%) |
| 25 to 34 Years | 13 (100.0%) | 60 (100.0%) |
| 35 to 44 Years | 25 (100.0%) | 22 (100.0%) |
| 45 to 54 Years | 56 (100.0%) | 10 (50.0%) |
| 55 to 64 Years | 23 (69.7%) | 58 (89.2%) |
| 65 to 74 Years | 70 (100.0%) | 37 (100.0%) |
| 75 Years and over | 10 (100.0%) | 8 (61.5%) |
| Total | 226 (91.9%) | 246 (91.8%) |
Income Below Poverty Among Married-Couple Families in Snook
| Children | Above Poverty | Below Poverty |
| No Children | 96 (100.0%) | 0 (0.0%) |
| 1 or 2 Children | 29 (100.0%) | 0 (0.0%) |
| 3 or 4 Children | 0 (0.0%) | 0 (0.0%) |
| 5 or more Children | 0 (0.0%) | 0 (0.0%) |
| Total | 125 (100.0%) | 0 (0.0%) |
Income Below Poverty Among Single-Parent Households in Snook
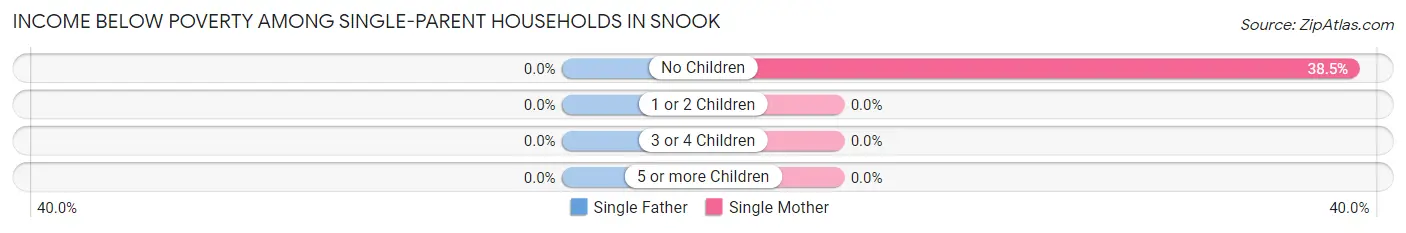
| Children | Single Father | Single Mother |
| No Children | 0 (0.0%) | 10 (38.5%) |
| 1 or 2 Children | 0 (0.0%) | 0 (0.0%) |
| 3 or 4 Children | 0 (0.0%) | 0 (0.0%) |
| 5 or more Children | 0 (0.0%) | 0 (0.0%) |
| Total | 0 (0.0%) | 10 (38.5%) |
Income Below Poverty Among Married-Couple vs Single-Parent Households in Snook
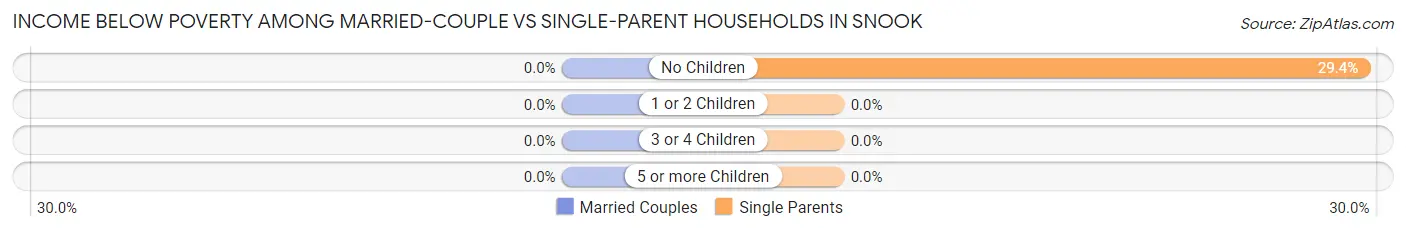
| Children | Married-Couple Families | Single-Parent Households |
| No Children | 0 (0.0%) | 10 (29.4%) |
| 1 or 2 Children | 0 (0.0%) | 0 (0.0%) |
| 3 or 4 Children | 0 (0.0%) | 0 (0.0%) |
| 5 or more Children | 0 (0.0%) | 0 (0.0%) |
| Total | 0 (0.0%) | 10 (25.6%) |
Race in Snook
The most populous races in Snook are White / Caucasian (441 | 85.8%), Hispanic or Latino (56 | 10.9%), and Two or more Races (36 | 7.0%).
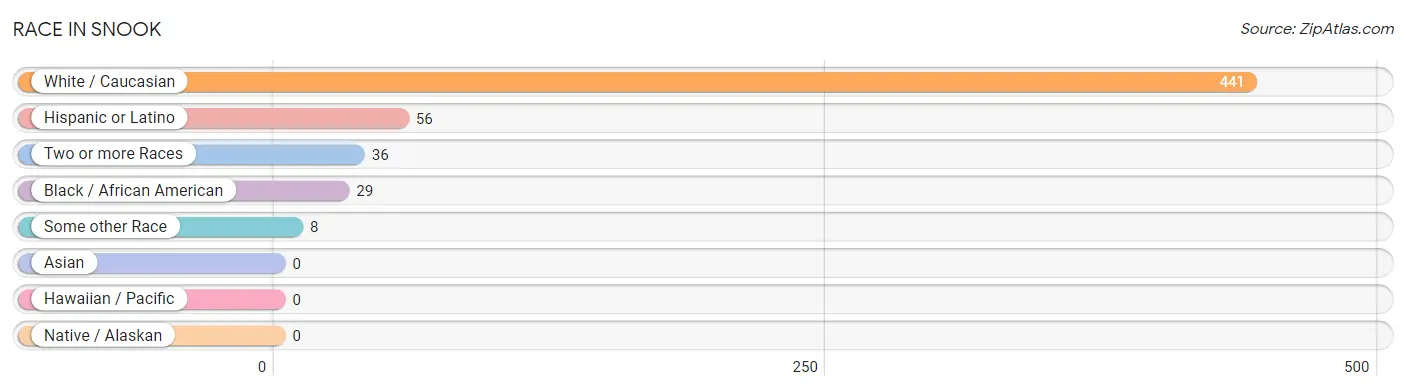
| Race | # Population | % Population |
| Asian | 0 | 0.0% |
| Black / African American | 29 | 5.6% |
| Hawaiian / Pacific | 0 | 0.0% |
| Hispanic or Latino | 56 | 10.9% |
| Native / Alaskan | 0 | 0.0% |
| White / Caucasian | 441 | 85.8% |
| Two or more Races | 36 | 7.0% |
| Some other Race | 8 | 1.6% |
| Total | 514 | 100.0% |
Ancestry in Snook
The most populous ancestries reported in Snook are Czech (146 | 28.4%), German (129 | 25.1%), Irish (105 | 20.4%), English (59 | 11.5%), and Mexican (56 | 10.9%), together accounting for 96.3% of all Snook residents.
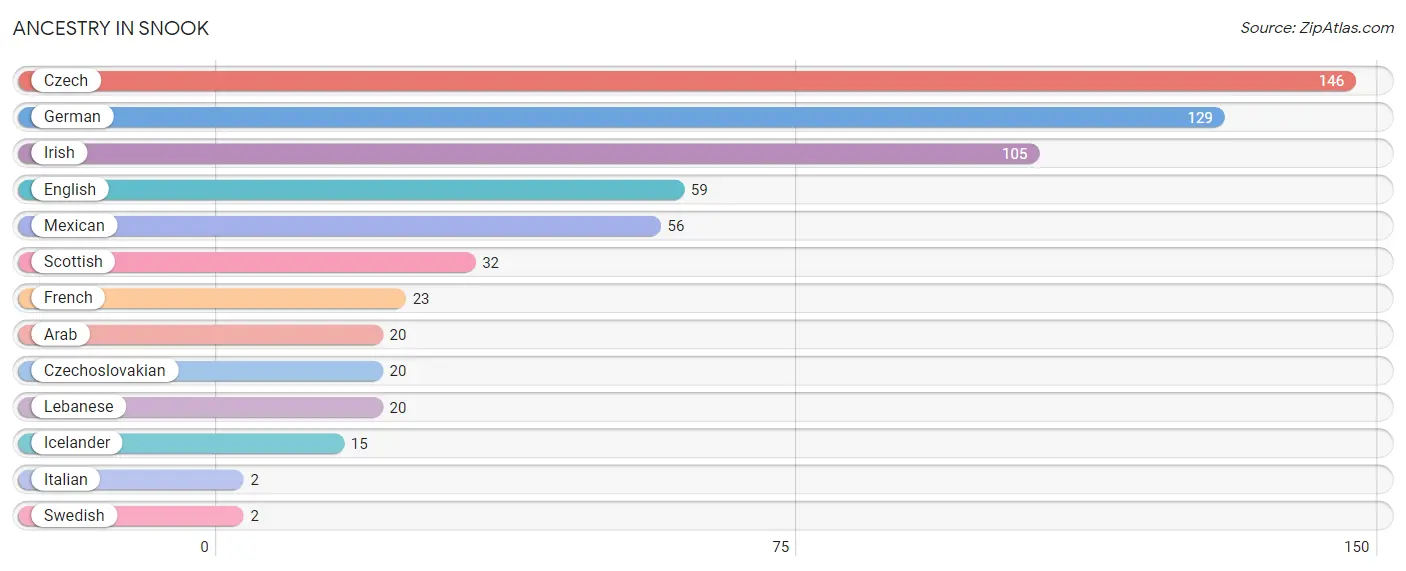
| Ancestry | # Population | % Population |
| Arab | 20 | 3.9% |
| Czech | 146 | 28.4% |
| Czechoslovakian | 20 | 3.9% |
| English | 59 | 11.5% |
| French | 23 | 4.5% |
| German | 129 | 25.1% |
| Icelander | 15 | 2.9% |
| Irish | 105 | 20.4% |
| Italian | 2 | 0.4% |
| Lebanese | 20 | 3.9% |
| Mexican | 56 | 10.9% |
| Scottish | 32 | 6.2% |
| Swedish | 2 | 0.4% | View All 13 Rows |
Immigrants in Snook
The most numerous immigrant groups reported in Snook came from Central America (11 | 2.1%), Latin America (11 | 2.1%), and Mexico (11 | 2.1%), together accounting for 6.4% of all Snook residents.
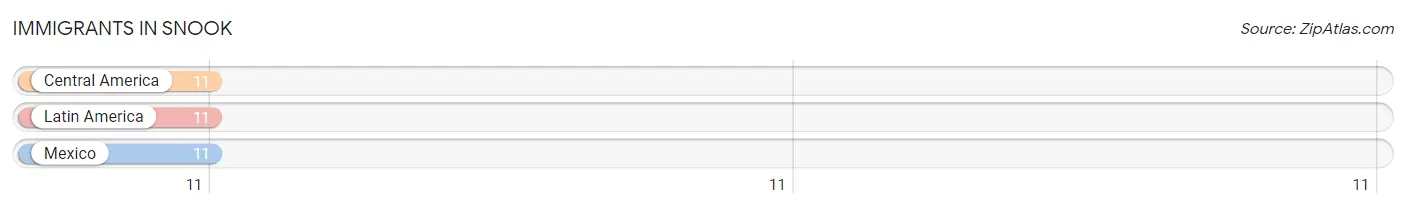
| Immigration Origin | # Population | % Population |
| Central America | 11 | 2.1% |
| Latin America | 11 | 2.1% |
| Mexico | 11 | 2.1% | View All 3 Rows |
Sex and Age in Snook
Sex and Age in Snook
The most populous age groups in Snook are 65 to 69 Years (48 | 19.5%) for men and 55 to 59 Years (47 | 17.5%) for women.
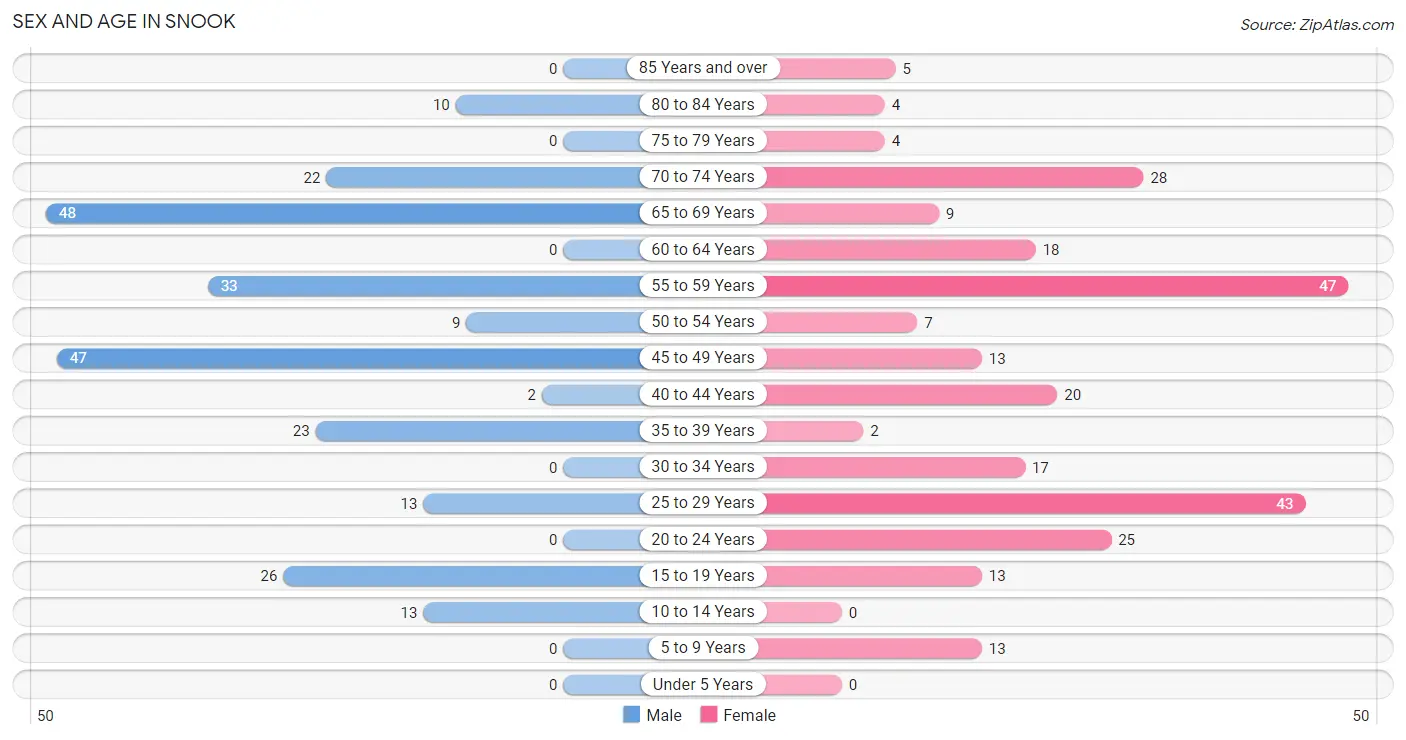
| Age Bracket | Male | Female |
| Under 5 Years | 0 (0.0%) | 0 (0.0%) |
| 5 to 9 Years | 0 (0.0%) | 13 (4.9%) |
| 10 to 14 Years | 13 (5.3%) | 0 (0.0%) |
| 15 to 19 Years | 26 (10.6%) | 13 (4.9%) |
| 20 to 24 Years | 0 (0.0%) | 25 (9.3%) |
| 25 to 29 Years | 13 (5.3%) | 43 (16.0%) |
| 30 to 34 Years | 0 (0.0%) | 17 (6.3%) |
| 35 to 39 Years | 23 (9.3%) | 2 (0.7%) |
| 40 to 44 Years | 2 (0.8%) | 20 (7.5%) |
| 45 to 49 Years | 47 (19.1%) | 13 (4.9%) |
| 50 to 54 Years | 9 (3.7%) | 7 (2.6%) |
| 55 to 59 Years | 33 (13.4%) | 47 (17.5%) |
| 60 to 64 Years | 0 (0.0%) | 18 (6.7%) |
| 65 to 69 Years | 48 (19.5%) | 9 (3.4%) |
| 70 to 74 Years | 22 (8.9%) | 28 (10.4%) |
| 75 to 79 Years | 0 (0.0%) | 4 (1.5%) |
| 80 to 84 Years | 10 (4.1%) | 4 (1.5%) |
| 85 Years and over | 0 (0.0%) | 5 (1.9%) |
| Total | 246 (100.0%) | 268 (100.0%) |
Families and Households in Snook
Median Family Size in Snook
The median family size in Snook is 2.44 persons per family, with single male/father families (13 | 7.9%) accounting for the largest median family size of 2.85 persons per family. On the other hand, single female/mother families (26 | 15.9%) represent the smallest median family size with 2.27 persons per family.
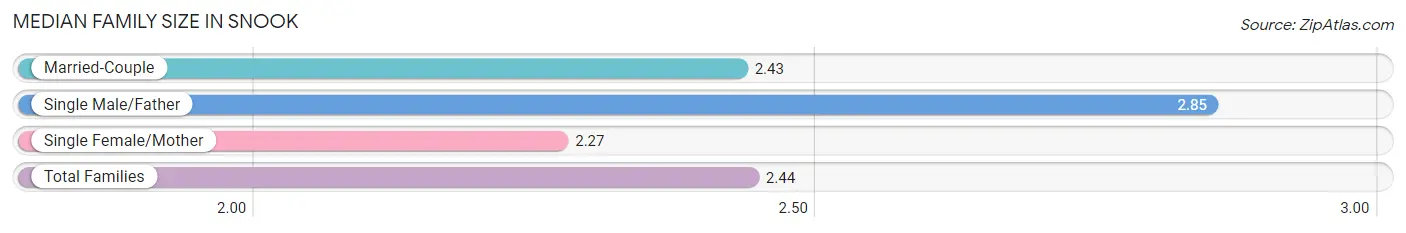
| Family Type | # Families | Family Size |
| Married-Couple | 125 (76.2%) | 2.43 |
| Single Male/Father | 13 (7.9%) | 2.85 |
| Single Female/Mother | 26 (15.9%) | 2.27 |
| Total Families | 164 (100.0%) | 2.44 |
Median Household Size in Snook
The median household size in Snook is 1.88 persons per household, with single male/father households (13 | 4.8%) accounting for the largest median household size of 2.85 persons per household. non-family households (109 | 39.9%) represent the smallest median household size with 1.05 persons per household.
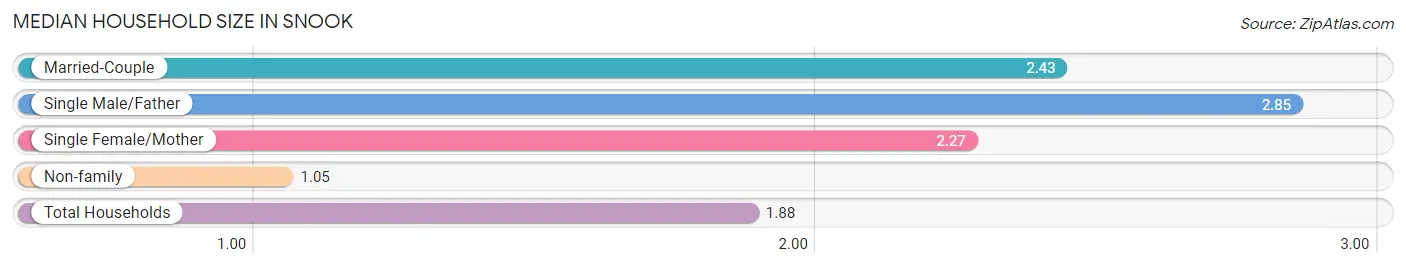
| Household Type | # Households | Household Size |
| Married-Couple | 125 (45.8%) | 2.43 |
| Single Male/Father | 13 (4.8%) | 2.85 |
| Single Female/Mother | 26 (9.5%) | 2.27 |
| Non-family | 109 (39.9%) | 1.05 |
| Total Households | 273 (100.0%) | 1.88 |
Household Size by Marriage Status in Snook
Out of a total of 273 households in Snook, 164 (60.1%) are family households, while 109 (39.9%) are nonfamily households. The most numerous type of family households are 2-person households, comprising 122, and the most common type of nonfamily households are 1-person households, comprising 104.
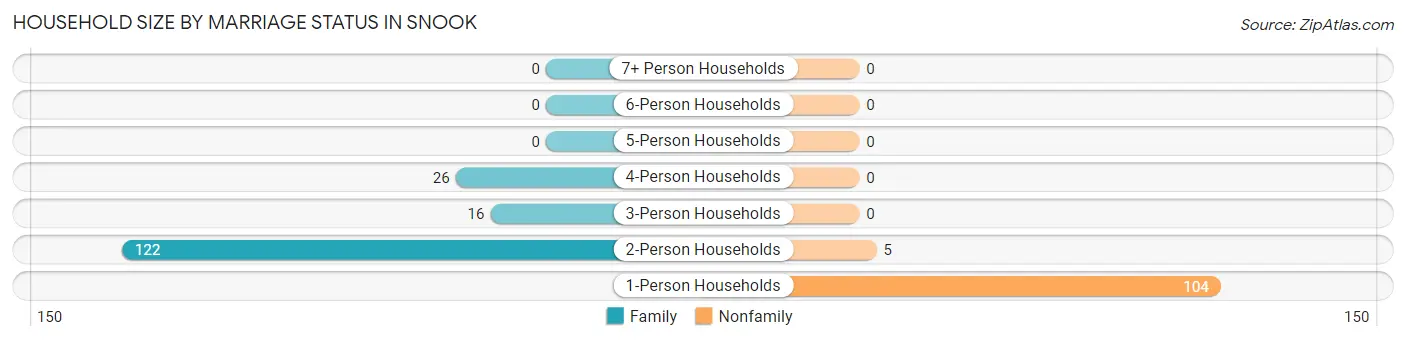
| Household Size | Family Households | Nonfamily Households |
| 1-Person Households | - | 104 (38.1%) |
| 2-Person Households | 122 (44.7%) | 5 (1.8%) |
| 3-Person Households | 16 (5.9%) | 0 (0.0%) |
| 4-Person Households | 26 (9.5%) | 0 (0.0%) |
| 5-Person Households | 0 (0.0%) | 0 (0.0%) |
| 6-Person Households | 0 (0.0%) | 0 (0.0%) |
| 7+ Person Households | 0 (0.0%) | 0 (0.0%) |
| Total | 164 (60.1%) | 109 (39.9%) |
Female Fertility in Snook
Fertility by Age in Snook
| Age Bracket | Women with Births | Births / 1,000 Women |
| 15 to 19 years | 0 (0.0%) | 0.0 |
| 20 to 34 years | 0 (0.0%) | 0.0 |
| 35 to 50 years | 0 (0.0%) | 0.0 |
| Total | 0 (0.0%) | 0.0 |
Fertility by Age by Marriage Status in Snook
| Age Bracket | Married | Unmarried |
| 15 to 19 years | 0 (0.0%) | 0 (0.0%) |
| 20 to 34 years | 0 (0.0%) | 0 (0.0%) |
| 35 to 50 years | 0 (0.0%) | 0 (0.0%) |
| Total | 0 (0.0%) | 0 (0.0%) |
Fertility by Education in Snook
| Educational Attainment | Women with Births | Births / 1,000 Women |
| Less than High School | 0 (0.0%) | 0.0 |
| High School Diploma | 0 (0.0%) | 0.0 |
| College or Associate's Degree | 0 (0.0%) | 0.0 |
| Bachelor's Degree | 0 (0.0%) | 0.0 |
| Graduate Degree | 0 (0.0%) | 0.0 |
| Total | 0 (0.0%) | 0.0 |
Fertility by Education by Marriage Status in Snook
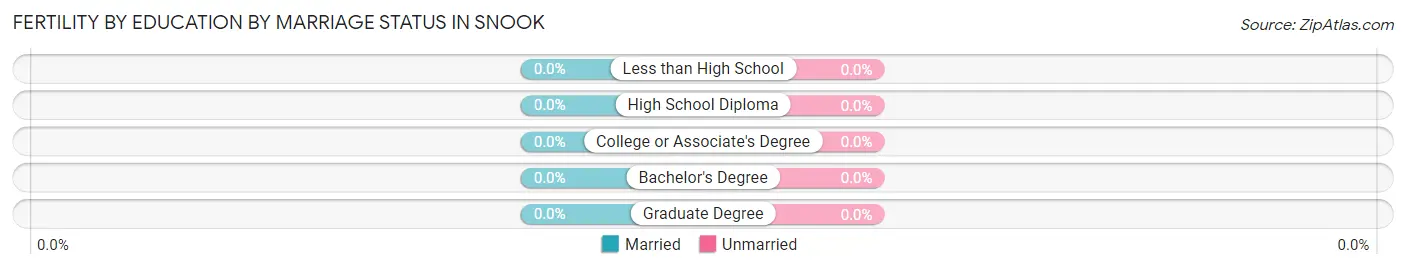
| Educational Attainment | Married | Unmarried |
| Less than High School | 0 (0.0%) | 0 (0.0%) |
| High School Diploma | 0 (0.0%) | 0 (0.0%) |
| College or Associate's Degree | 0 (0.0%) | 0 (0.0%) |
| Bachelor's Degree | 0 (0.0%) | 0 (0.0%) |
| Graduate Degree | 0 (0.0%) | 0 (0.0%) |
| Total | 0 (0.0%) | 0 (0.0%) |
Employment Characteristics in Snook
Employment by Class of Employer in Snook
Among the 340 employed individuals in Snook, private company employees (144 | 42.3%), self-employed (not incorporated) (72 | 21.2%), and local government employees (60 | 17.6%) make up the most common classes of employment.
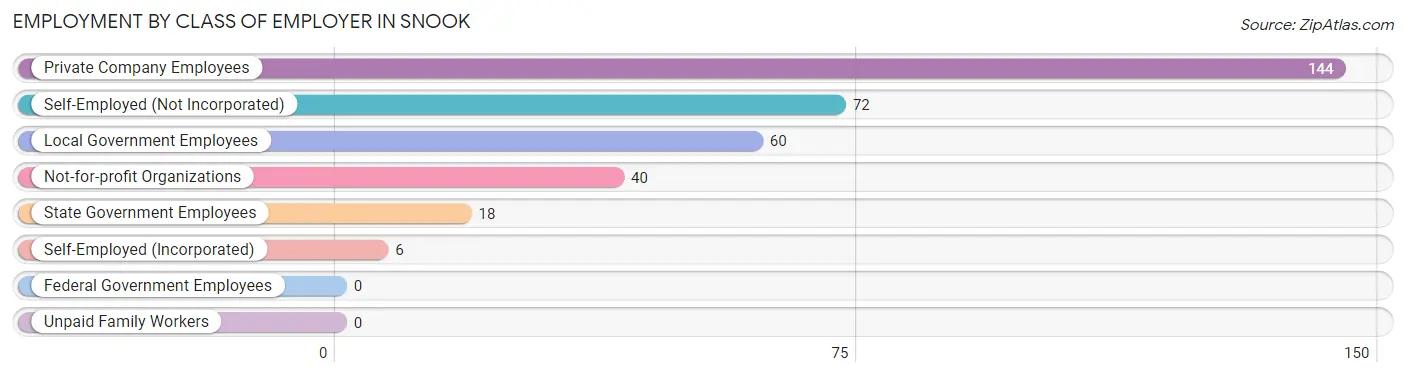
| Employer Class | # Employees | % Employees |
| Private Company Employees | 144 | 42.3% |
| Self-Employed (Incorporated) | 6 | 1.8% |
| Self-Employed (Not Incorporated) | 72 | 21.2% |
| Not-for-profit Organizations | 40 | 11.8% |
| Local Government Employees | 60 | 17.6% |
| State Government Employees | 18 | 5.3% |
| Federal Government Employees | 0 | 0.0% |
| Unpaid Family Workers | 0 | 0.0% |
| Total | 340 | 100.0% |
Employment Status by Age in Snook
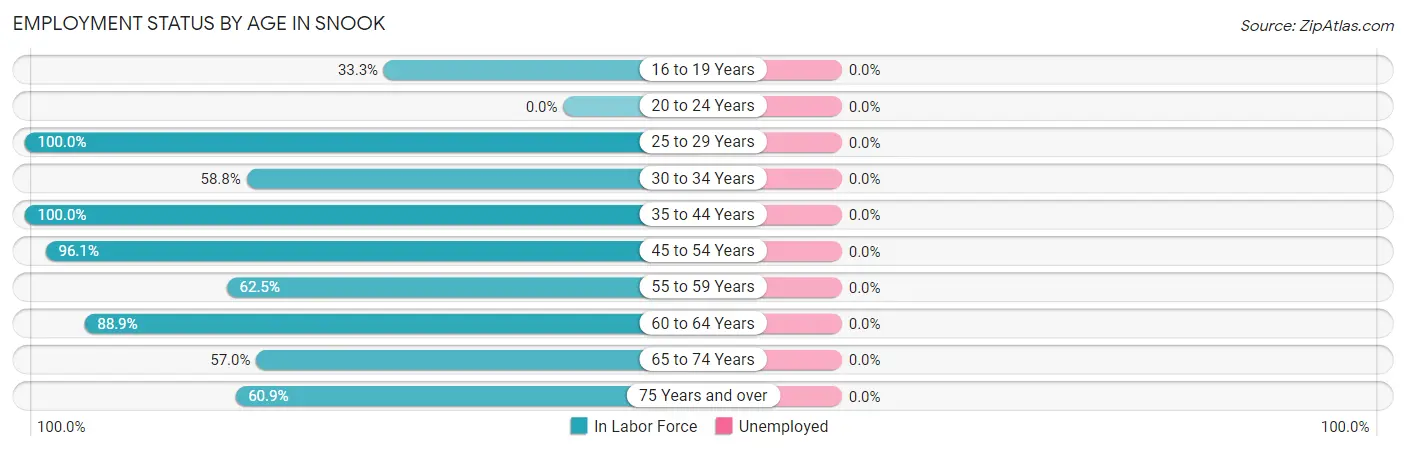
| Age Bracket | In Labor Force | Unemployed |
| 16 to 19 Years | 13 (33.3%) | 0 (0.0%) |
| 20 to 24 Years | 0 (0.0%) | 0 (0.0%) |
| 25 to 29 Years | 56 (100.0%) | 0 (0.0%) |
| 30 to 34 Years | 10 (58.8%) | 0 (0.0%) |
| 35 to 44 Years | 47 (100.0%) | 0 (0.0%) |
| 45 to 54 Years | 73 (96.1%) | 0 (0.0%) |
| 55 to 59 Years | 50 (62.5%) | 0 (0.0%) |
| 60 to 64 Years | 16 (88.9%) | 0 (0.0%) |
| 65 to 74 Years | 61 (57.0%) | 0 (0.0%) |
| 75 Years and over | 14 (60.9%) | 0 (0.0%) |
| Total | 340 (69.7%) | 0 (0.0%) |
Employment Status by Educational Attainment in Snook
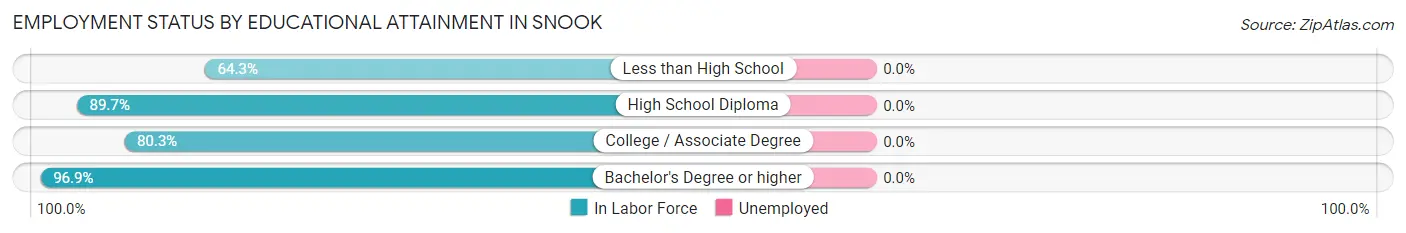
| Educational Attainment | In Labor Force | Unemployed |
| Less than High School | 9 (64.3%) | 0 (0.0%) |
| High School Diploma | 70 (89.7%) | 0 (0.0%) |
| College / Associate Degree | 110 (80.3%) | 0 (0.0%) |
| Bachelor's Degree or higher | 63 (96.9%) | 0 (0.0%) |
| Total | 252 (85.7%) | 0 (0.0%) |
Employment Occupations by Sex in Snook
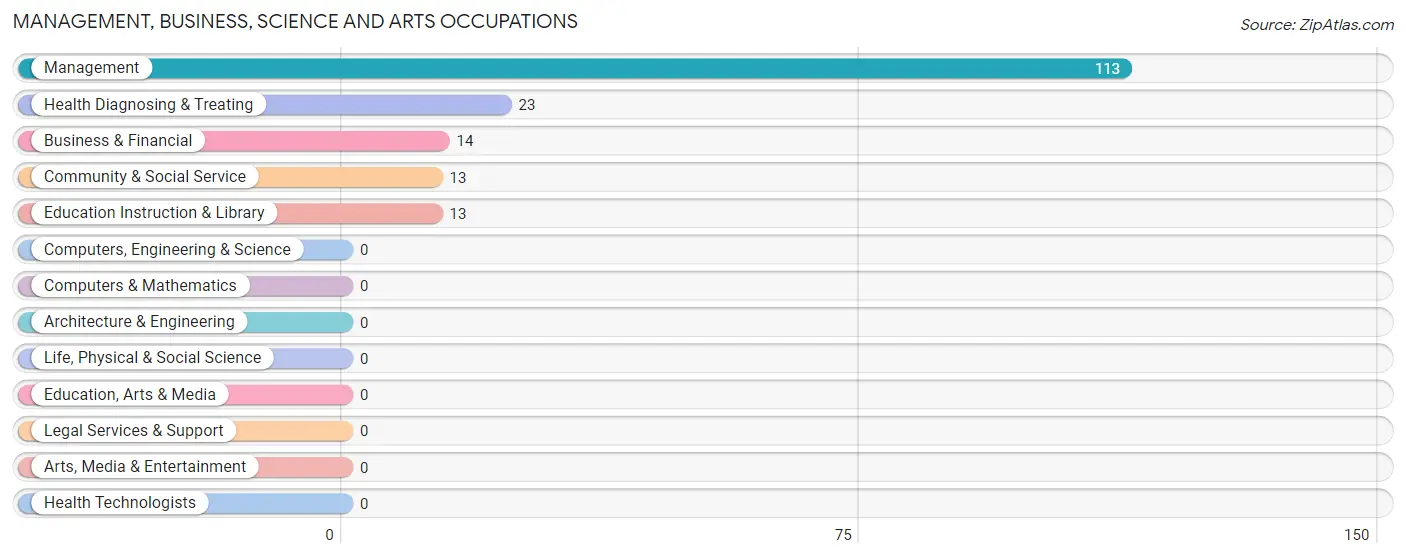
Management, Business, Science and Arts Occupations
The most common Management, Business, Science and Arts occupations in Snook are Management (113 | 33.2%), Health Diagnosing & Treating (23 | 6.8%), Business & Financial (14 | 4.1%), Community & Social Service (13 | 3.8%), and Education Instruction & Library (13 | 3.8%).
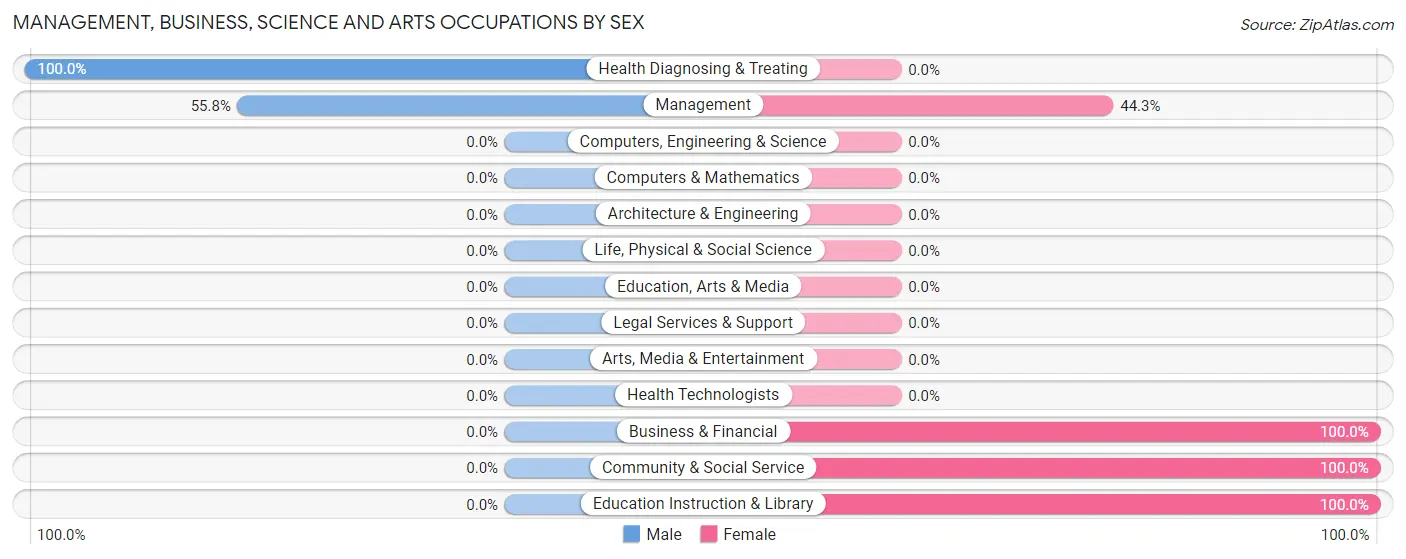
Management, Business, Science and Arts Occupations by Sex
Within the Management, Business, Science and Arts occupations in Snook, the most male-oriented occupations are Health Diagnosing & Treating (100.0%), and Management (55.7%), while the most female-oriented occupations are Business & Financial (100.0%), Community & Social Service (100.0%), and Education Instruction & Library (100.0%).
| Occupation | Male | Female |
| Management | 63 (55.7%) | 50 (44.3%) |
| Business & Financial | 0 (0.0%) | 14 (100.0%) |
| Computers, Engineering & Science | 0 (0.0%) | 0 (0.0%) |
| Computers & Mathematics | 0 (0.0%) | 0 (0.0%) |
| Architecture & Engineering | 0 (0.0%) | 0 (0.0%) |
| Life, Physical & Social Science | 0 (0.0%) | 0 (0.0%) |
| Community & Social Service | 0 (0.0%) | 13 (100.0%) |
| Education, Arts & Media | 0 (0.0%) | 0 (0.0%) |
| Legal Services & Support | 0 (0.0%) | 0 (0.0%) |
| Education Instruction & Library | 0 (0.0%) | 13 (100.0%) |
| Arts, Media & Entertainment | 0 (0.0%) | 0 (0.0%) |
| Health Diagnosing & Treating | 23 (100.0%) | 0 (0.0%) |
| Health Technologists | 0 (0.0%) | 0 (0.0%) |
| Total (Category) | 86 (52.8%) | 77 (47.2%) |
| Total (Overall) | 177 (52.1%) | 163 (47.9%) |
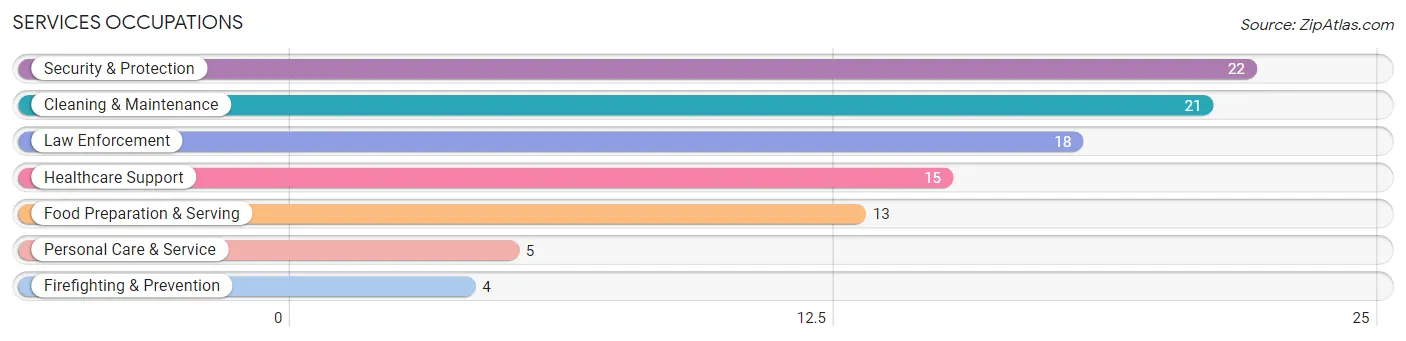
Services Occupations
The most common Services occupations in Snook are Security & Protection (22 | 6.5%), Cleaning & Maintenance (21 | 6.2%), Law Enforcement (18 | 5.3%), Healthcare Support (15 | 4.4%), and Food Preparation & Serving (13 | 3.8%).
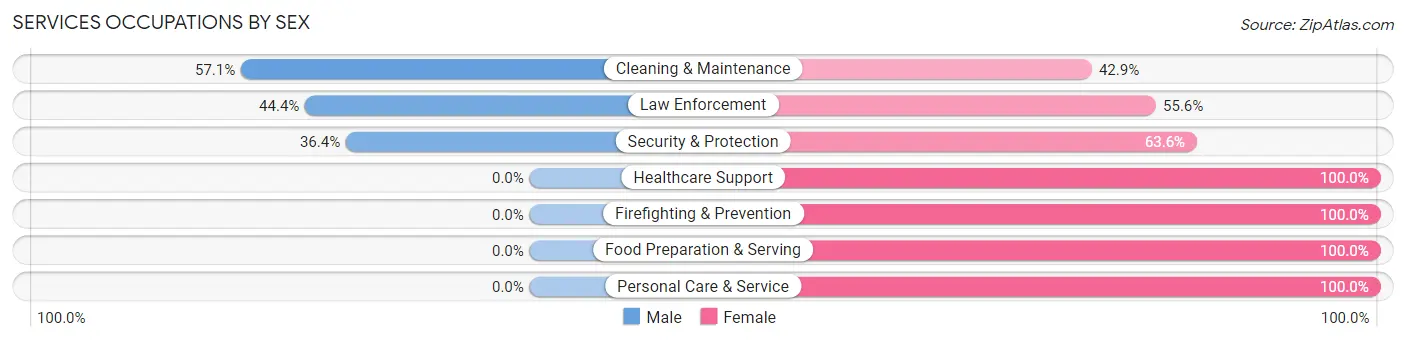
Services Occupations by Sex
Within the Services occupations in Snook, the most male-oriented occupations are Cleaning & Maintenance (57.1%), Law Enforcement (44.4%), and Security & Protection (36.4%), while the most female-oriented occupations are Healthcare Support (100.0%), Firefighting & Prevention (100.0%), and Food Preparation & Serving (100.0%).
| Occupation | Male | Female |
| Healthcare Support | 0 (0.0%) | 15 (100.0%) |
| Security & Protection | 8 (36.4%) | 14 (63.6%) |
| Firefighting & Prevention | 0 (0.0%) | 4 (100.0%) |
| Law Enforcement | 8 (44.4%) | 10 (55.6%) |
| Food Preparation & Serving | 0 (0.0%) | 13 (100.0%) |
| Cleaning & Maintenance | 12 (57.1%) | 9 (42.9%) |
| Personal Care & Service | 0 (0.0%) | 5 (100.0%) |
| Total (Category) | 20 (26.3%) | 56 (73.7%) |
| Total (Overall) | 177 (52.1%) | 163 (47.9%) |
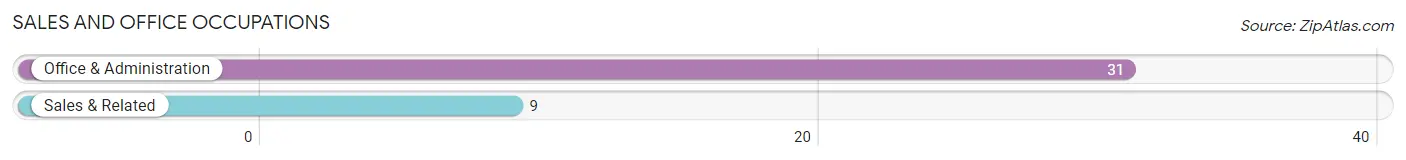
Sales and Office Occupations
The most common Sales and Office occupations in Snook are Office & Administration (31 | 9.1%), and Sales & Related (9 | 2.6%).
Sales and Office Occupations by Sex
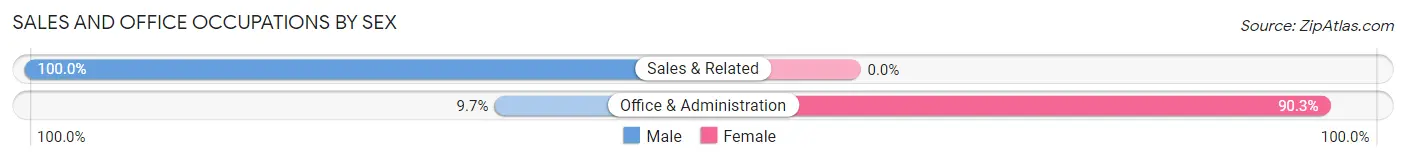
| Occupation | Male | Female |
| Sales & Related | 9 (100.0%) | 0 (0.0%) |
| Office & Administration | 3 (9.7%) | 28 (90.3%) |
| Total (Category) | 12 (30.0%) | 28 (70.0%) |
| Total (Overall) | 177 (52.1%) | 163 (47.9%) |
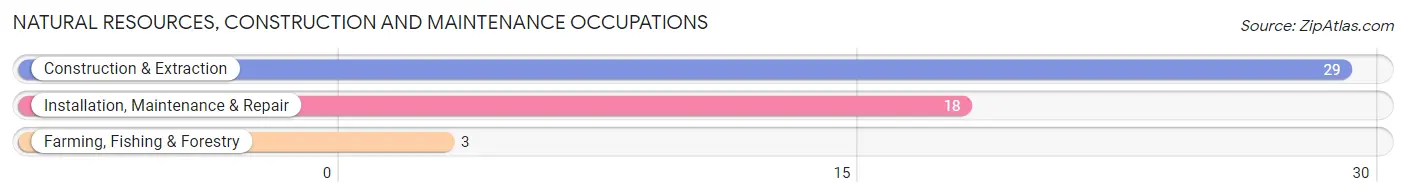
Natural Resources, Construction and Maintenance Occupations
The most common Natural Resources, Construction and Maintenance occupations in Snook are Construction & Extraction (29 | 8.5%), Installation, Maintenance & Repair (18 | 5.3%), and Farming, Fishing & Forestry (3 | 0.9%).
Natural Resources, Construction and Maintenance Occupations by Sex
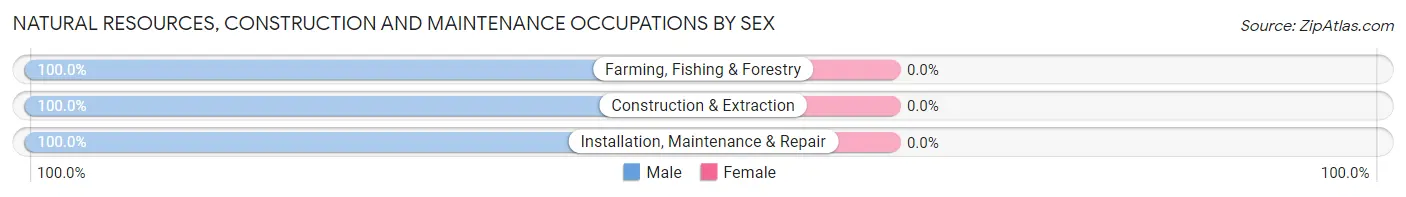
| Occupation | Male | Female |
| Farming, Fishing & Forestry | 3 (100.0%) | 0 (0.0%) |
| Construction & Extraction | 29 (100.0%) | 0 (0.0%) |
| Installation, Maintenance & Repair | 18 (100.0%) | 0 (0.0%) |
| Total (Category) | 50 (100.0%) | 0 (0.0%) |
| Total (Overall) | 177 (52.1%) | 163 (47.9%) |
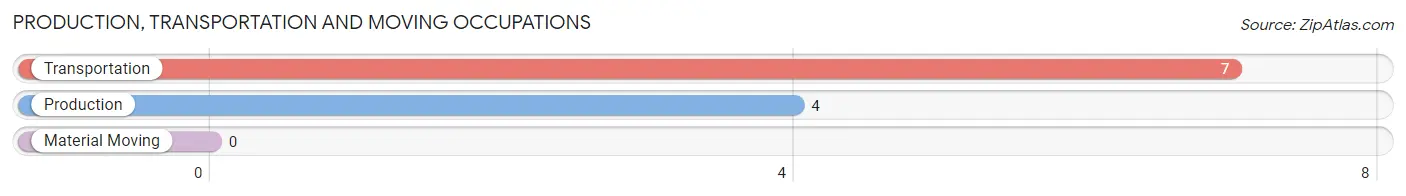
Production, Transportation and Moving Occupations
The most common Production, Transportation and Moving occupations in Snook are Transportation (7 | 2.1%), and Production (4 | 1.2%).
Production, Transportation and Moving Occupations by Sex
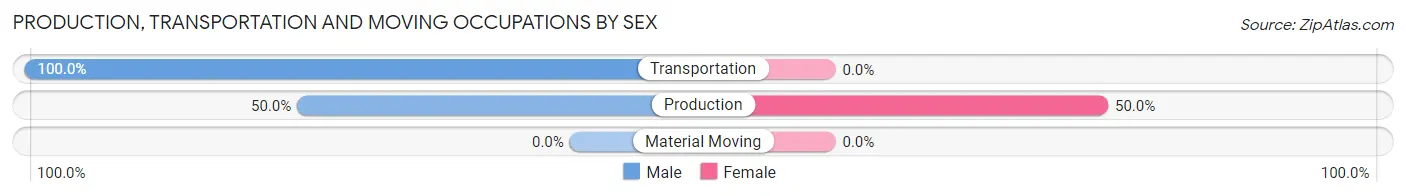
| Occupation | Male | Female |
| Production | 2 (50.0%) | 2 (50.0%) |
| Transportation | 7 (100.0%) | 0 (0.0%) |
| Material Moving | 0 (0.0%) | 0 (0.0%) |
| Total (Category) | 9 (81.8%) | 2 (18.2%) |
| Total (Overall) | 177 (52.1%) | 163 (47.9%) |
Employment Industries by Sex in Snook
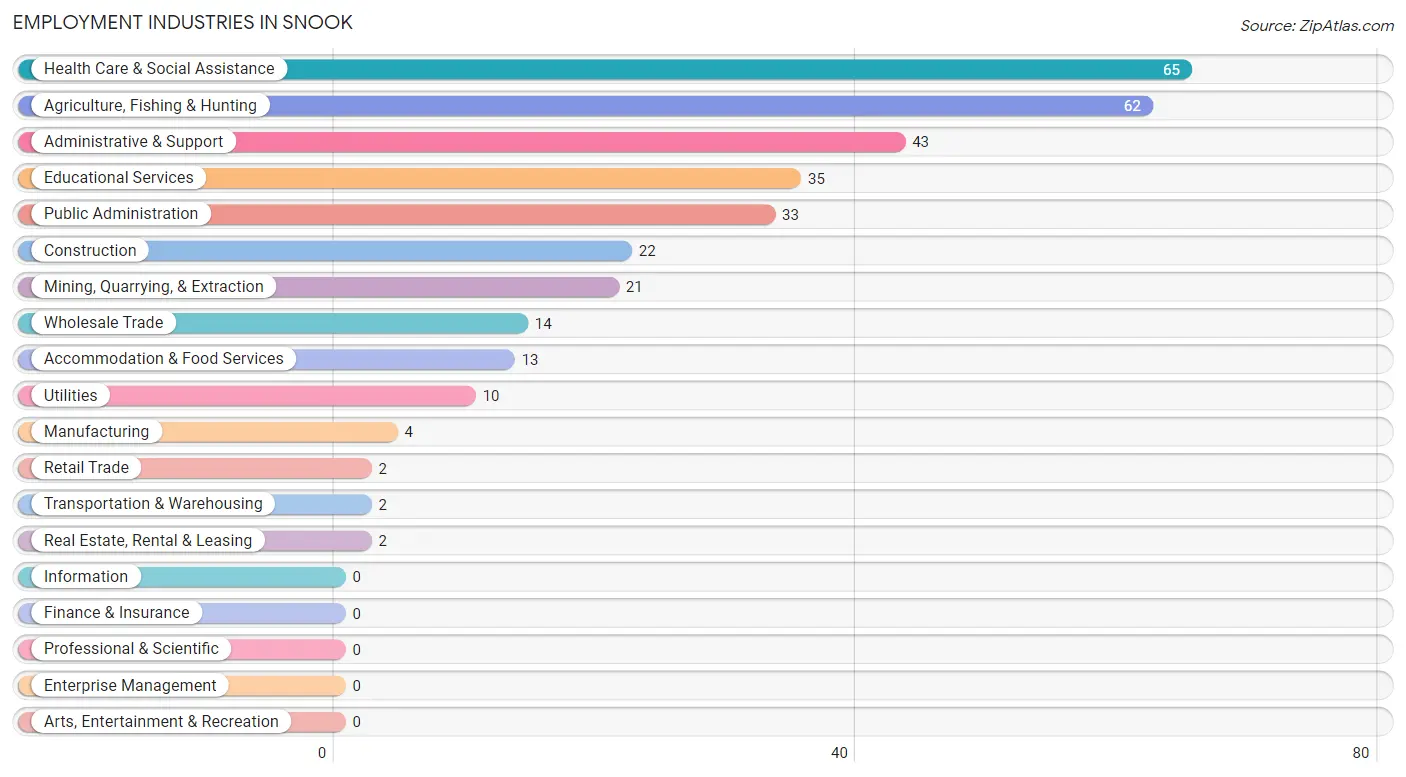
Employment Industries in Snook
The major employment industries in Snook include Health Care & Social Assistance (65 | 19.1%), Agriculture, Fishing & Hunting (62 | 18.2%), Administrative & Support (43 | 12.7%), Educational Services (35 | 10.3%), and Public Administration (33 | 9.7%).
Employment Industries by Sex in Snook
The Snook industries that see more men than women are Mining, Quarrying, & Extraction (100.0%), Construction (100.0%), and Wholesale Trade (100.0%), whereas the industries that tend to have a higher number of women are Retail Trade (100.0%), Educational Services (100.0%), and Accommodation & Food Services (100.0%).
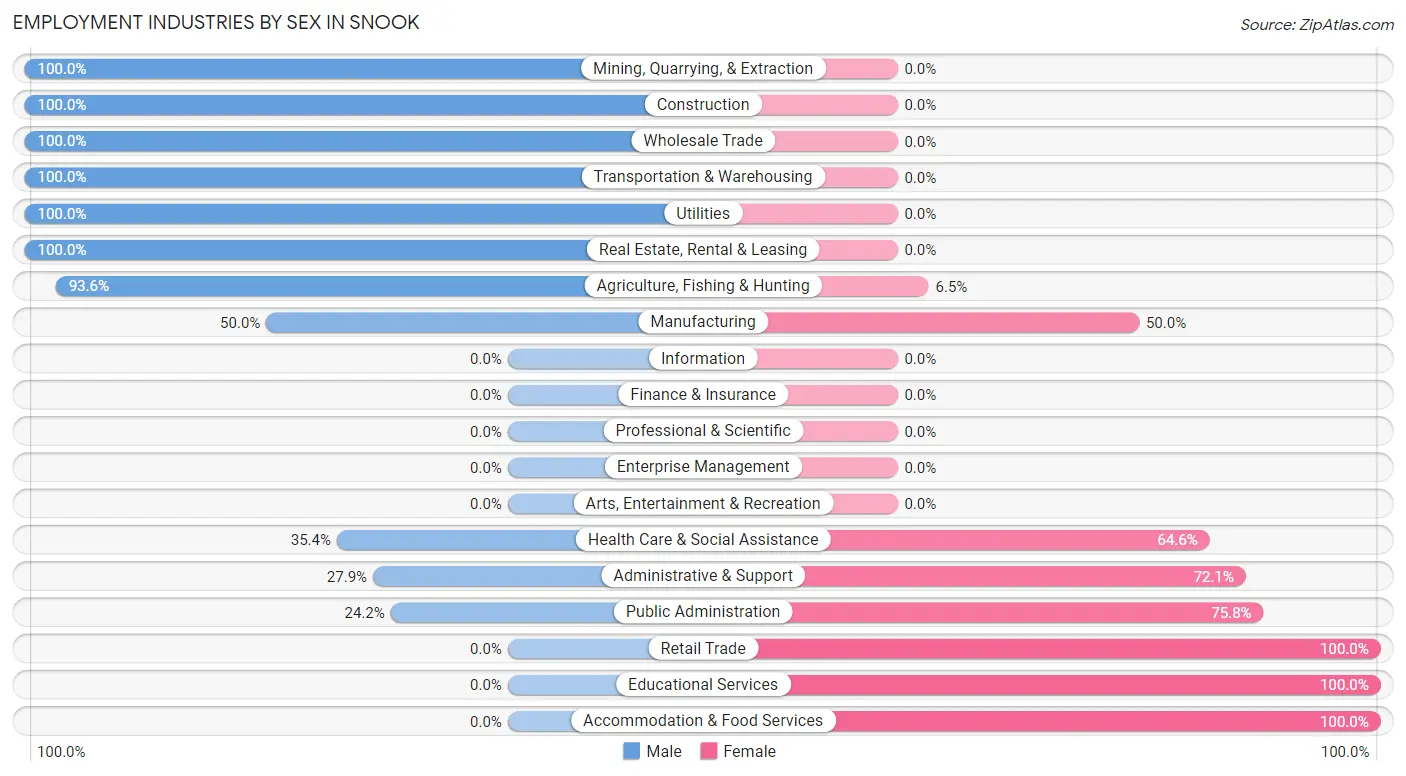
| Industry | Male | Female |
| Agriculture, Fishing & Hunting | 58 (93.5%) | 4 (6.5%) |
| Mining, Quarrying, & Extraction | 21 (100.0%) | 0 (0.0%) |
| Construction | 22 (100.0%) | 0 (0.0%) |
| Manufacturing | 2 (50.0%) | 2 (50.0%) |
| Wholesale Trade | 14 (100.0%) | 0 (0.0%) |
| Retail Trade | 0 (0.0%) | 2 (100.0%) |
| Transportation & Warehousing | 2 (100.0%) | 0 (0.0%) |
| Utilities | 10 (100.0%) | 0 (0.0%) |
| Information | 0 (0.0%) | 0 (0.0%) |
| Finance & Insurance | 0 (0.0%) | 0 (0.0%) |
| Real Estate, Rental & Leasing | 2 (100.0%) | 0 (0.0%) |
| Professional & Scientific | 0 (0.0%) | 0 (0.0%) |
| Enterprise Management | 0 (0.0%) | 0 (0.0%) |
| Administrative & Support | 12 (27.9%) | 31 (72.1%) |
| Educational Services | 0 (0.0%) | 35 (100.0%) |
| Health Care & Social Assistance | 23 (35.4%) | 42 (64.6%) |
| Arts, Entertainment & Recreation | 0 (0.0%) | 0 (0.0%) |
| Accommodation & Food Services | 0 (0.0%) | 13 (100.0%) |
| Public Administration | 8 (24.2%) | 25 (75.8%) |
| Total | 177 (52.1%) | 163 (47.9%) |
Education in Snook
School Enrollment in Snook
The most common levels of schooling among the 55 students in Snook are high school (23 | 41.8%), elementary school (13 | 23.6%), and middle school (13 | 23.6%).
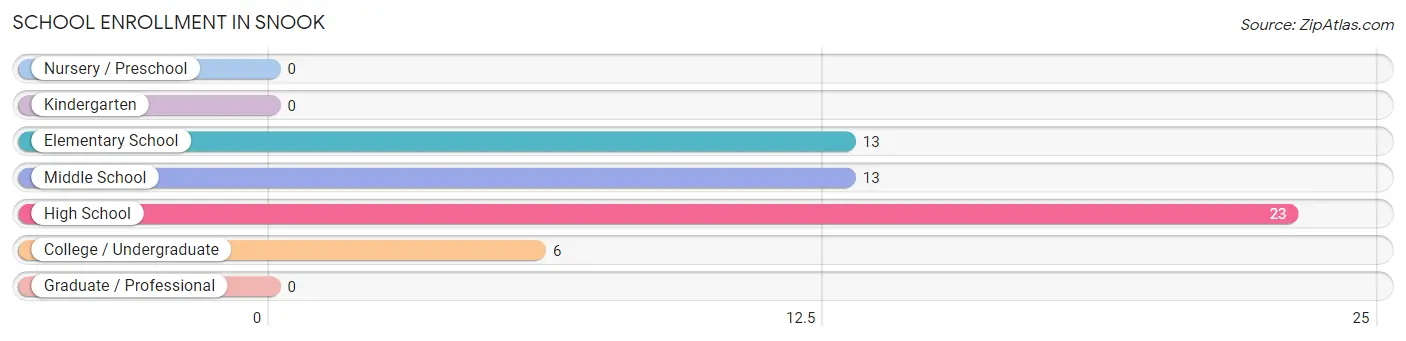
| School Level | # Students | % Students |
| Nursery / Preschool | 0 | 0.0% |
| Kindergarten | 0 | 0.0% |
| Elementary School | 13 | 23.6% |
| Middle School | 13 | 23.6% |
| High School | 23 | 41.8% |
| College / Undergraduate | 6 | 10.9% |
| Graduate / Professional | 0 | 0.0% |
| Total | 55 | 100.0% |
School Enrollment by Age by Funding Source in Snook
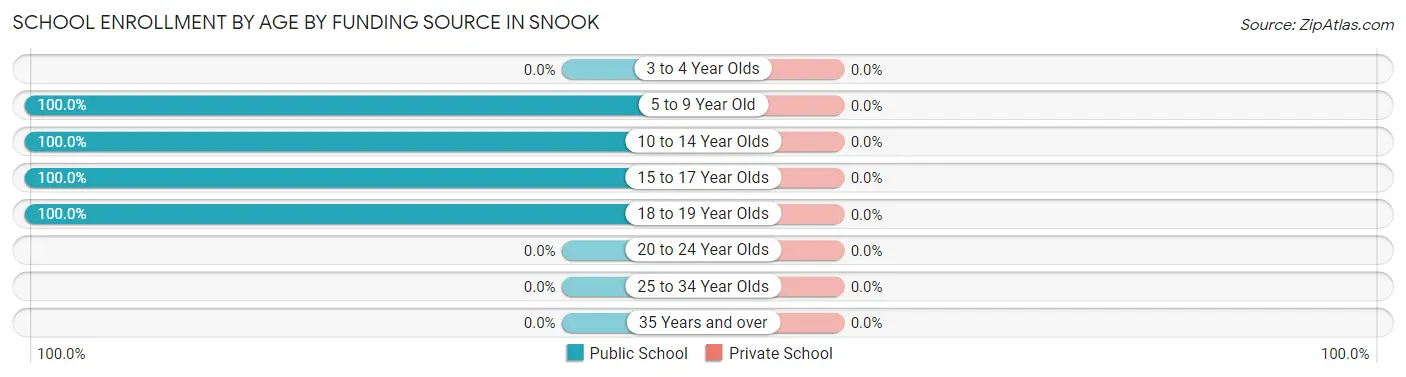
| Age Bracket | Public School | Private School |
| 3 to 4 Year Olds | 0 (0.0%) | 0 (0.0%) |
| 5 to 9 Year Old | 13 (100.0%) | 0 (0.0%) |
| 10 to 14 Year Olds | 13 (100.0%) | 0 (0.0%) |
| 15 to 17 Year Olds | 7 (100.0%) | 0 (0.0%) |
| 18 to 19 Year Olds | 22 (100.0%) | 0 (0.0%) |
| 20 to 24 Year Olds | 0 (0.0%) | 0 (0.0%) |
| 25 to 34 Year Olds | 0 (0.0%) | 0 (0.0%) |
| 35 Years and over | 0 (0.0%) | 0 (0.0%) |
| Total | 55 (100.0%) | 0 (0.0%) |
Educational Attainment by Field of Study in Snook
Education (29 | 31.9%), physical & health sciences (27 | 29.7%), business (16 | 17.6%), bio, nature & agricultural (10 | 11.0%), and arts & humanities (9 | 9.9%) are the most common fields of study among 91 individuals in Snook who have obtained a bachelor's degree or higher.
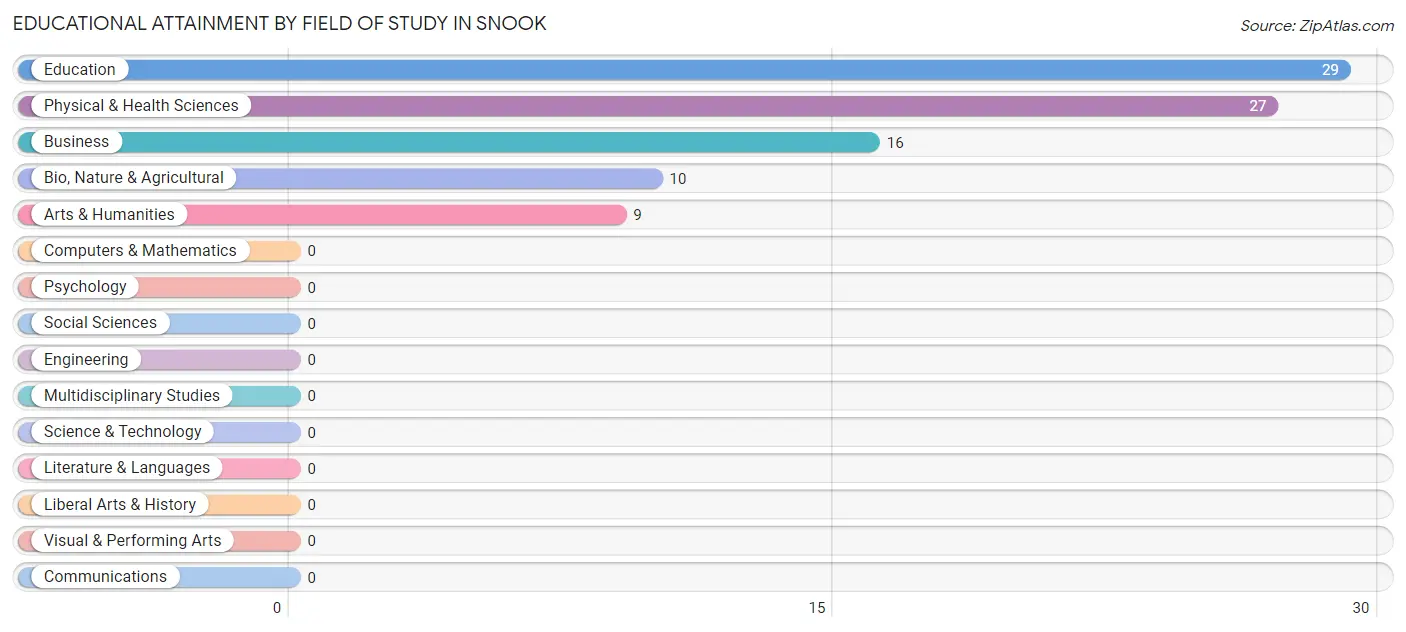
| Field of Study | # Graduates | % Graduates |
| Computers & Mathematics | 0 | 0.0% |
| Bio, Nature & Agricultural | 10 | 11.0% |
| Physical & Health Sciences | 27 | 29.7% |
| Psychology | 0 | 0.0% |
| Social Sciences | 0 | 0.0% |
| Engineering | 0 | 0.0% |
| Multidisciplinary Studies | 0 | 0.0% |
| Science & Technology | 0 | 0.0% |
| Business | 16 | 17.6% |
| Education | 29 | 31.9% |
| Literature & Languages | 0 | 0.0% |
| Liberal Arts & History | 0 | 0.0% |
| Visual & Performing Arts | 0 | 0.0% |
| Communications | 0 | 0.0% |
| Arts & Humanities | 9 | 9.9% |
| Total | 91 | 100.0% |
Transportation & Commute in Snook
Vehicle Availability by Sex in Snook
The most prevalent vehicle ownership categories in Snook are males with 2 vehicles (110, accounting for 62.2%) and females with 2 vehicles (49, making up 67.5%).
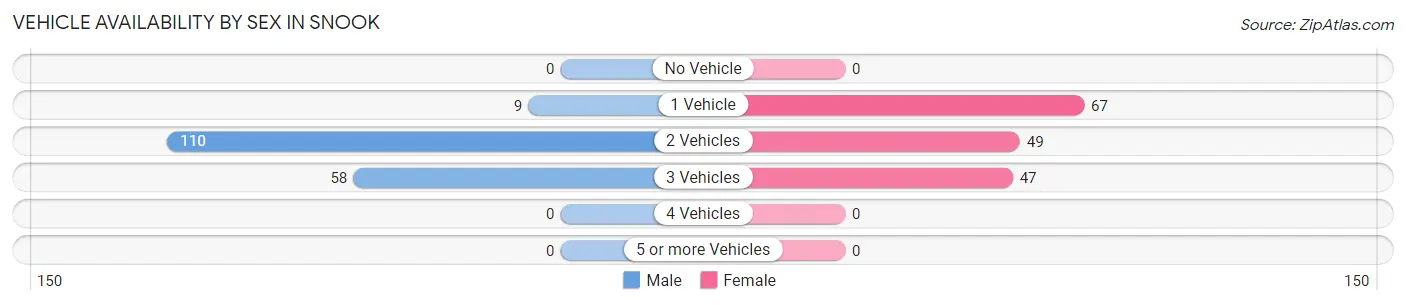
| Vehicles Available | Male | Female |
| No Vehicle | 0 (0.0%) | 0 (0.0%) |
| 1 Vehicle | 9 (5.1%) | 67 (41.1%) |
| 2 Vehicles | 110 (62.2%) | 49 (30.1%) |
| 3 Vehicles | 58 (32.8%) | 47 (28.8%) |
| 4 Vehicles | 0 (0.0%) | 0 (0.0%) |
| 5 or more Vehicles | 0 (0.0%) | 0 (0.0%) |
| Total | 177 (100.0%) | 163 (100.0%) |
Commute Time in Snook
The most frequently occuring commute durations in Snook are 20 to 24 minutes (78 commuters, 24.1%), less than 5 minutes (61 commuters, 18.9%), and 30 to 34 minutes (54 commuters, 16.7%).
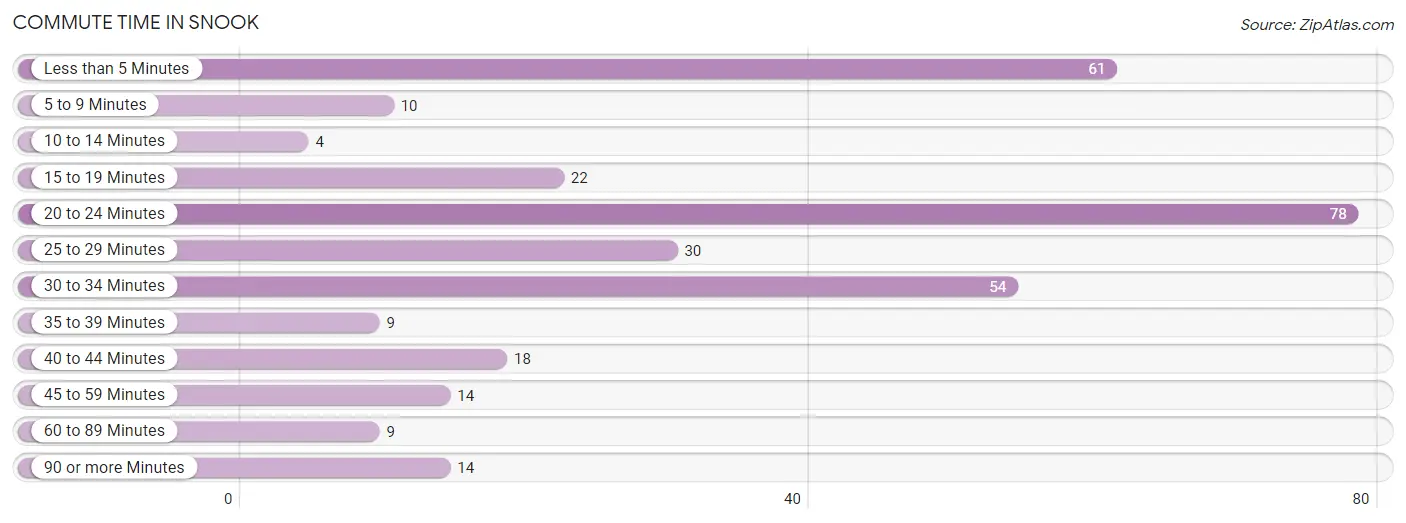
| Commute Time | # Commuters | % Commuters |
| Less than 5 Minutes | 61 | 18.9% |
| 5 to 9 Minutes | 10 | 3.1% |
| 10 to 14 Minutes | 4 | 1.2% |
| 15 to 19 Minutes | 22 | 6.8% |
| 20 to 24 Minutes | 78 | 24.1% |
| 25 to 29 Minutes | 30 | 9.3% |
| 30 to 34 Minutes | 54 | 16.7% |
| 35 to 39 Minutes | 9 | 2.8% |
| 40 to 44 Minutes | 18 | 5.6% |
| 45 to 59 Minutes | 14 | 4.3% |
| 60 to 89 Minutes | 9 | 2.8% |
| 90 or more Minutes | 14 | 4.3% |
Commute Time by Sex in Snook
The most common commute times in Snook are 30 to 34 minutes (39 commuters, 22.4%) for males and 20 to 24 minutes (50 commuters, 33.6%) for females.
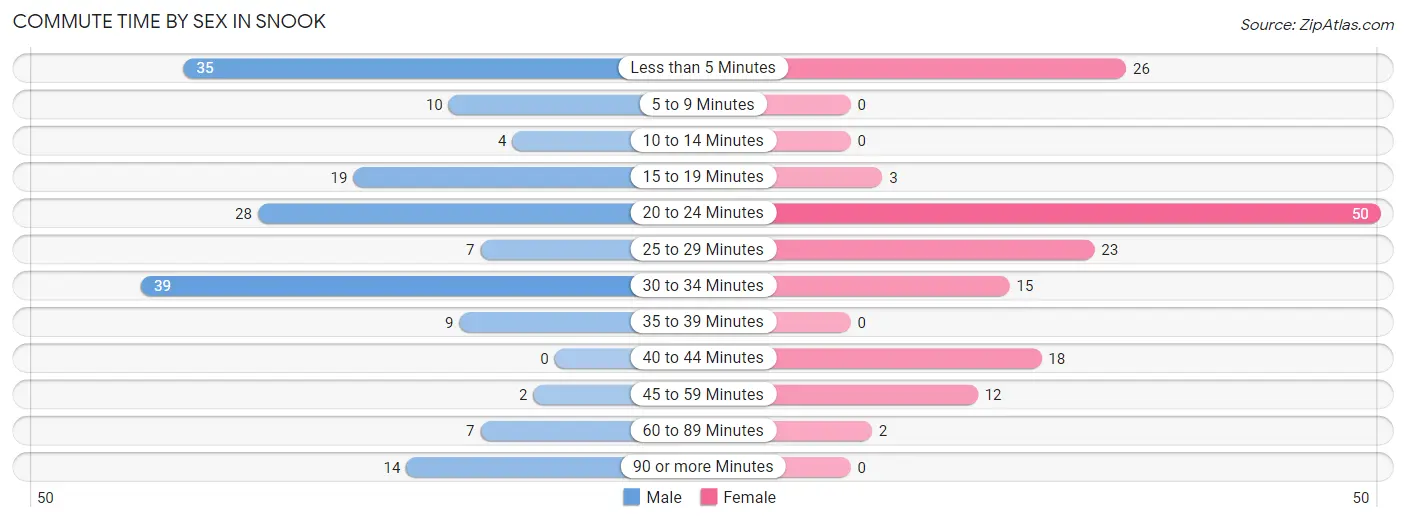
| Commute Time | Male | Female |
| Less than 5 Minutes | 35 (20.1%) | 26 (17.4%) |
| 5 to 9 Minutes | 10 (5.8%) | 0 (0.0%) |
| 10 to 14 Minutes | 4 (2.3%) | 0 (0.0%) |
| 15 to 19 Minutes | 19 (10.9%) | 3 (2.0%) |
| 20 to 24 Minutes | 28 (16.1%) | 50 (33.6%) |
| 25 to 29 Minutes | 7 (4.0%) | 23 (15.4%) |
| 30 to 34 Minutes | 39 (22.4%) | 15 (10.1%) |
| 35 to 39 Minutes | 9 (5.2%) | 0 (0.0%) |
| 40 to 44 Minutes | 0 (0.0%) | 18 (12.1%) |
| 45 to 59 Minutes | 2 (1.1%) | 12 (8.1%) |
| 60 to 89 Minutes | 7 (4.0%) | 2 (1.3%) |
| 90 or more Minutes | 14 (8.1%) | 0 (0.0%) |
Time of Departure to Work by Sex in Snook
The most frequent times of departure to work in Snook are 6:30 AM to 6:59 AM (49, 28.2%) for males and 7:00 AM to 7:29 AM (52, 34.9%) for females.
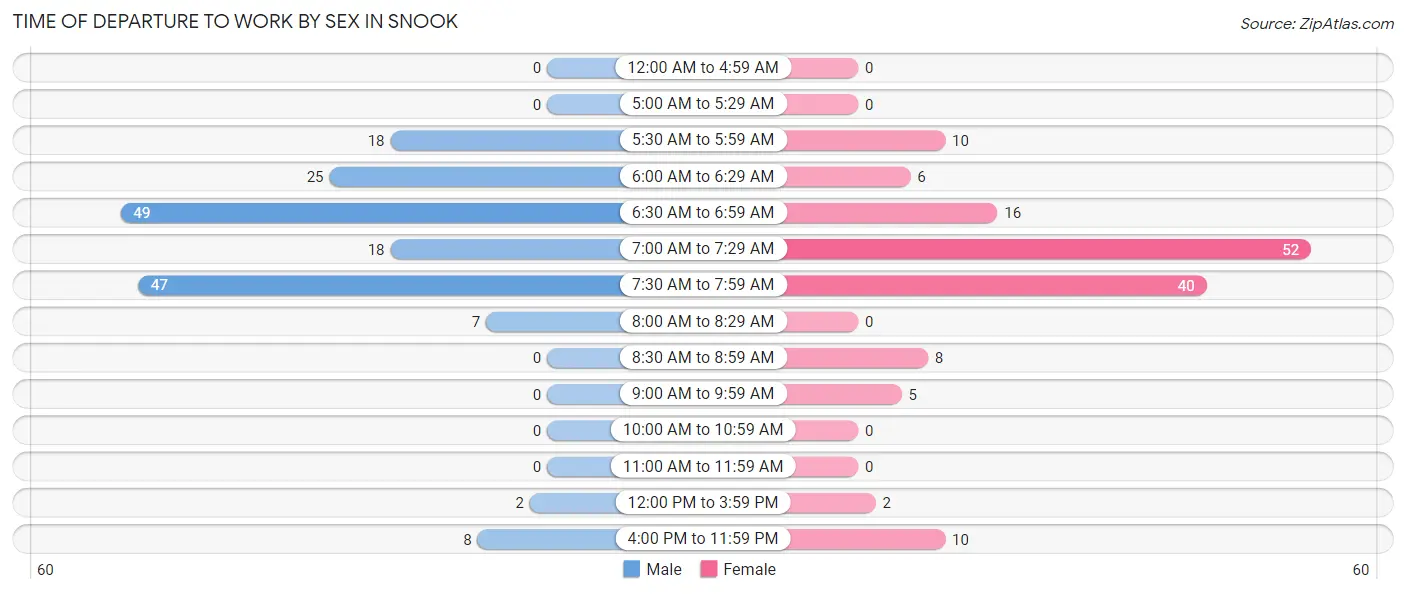
| Time of Departure | Male | Female |
| 12:00 AM to 4:59 AM | 0 (0.0%) | 0 (0.0%) |
| 5:00 AM to 5:29 AM | 0 (0.0%) | 0 (0.0%) |
| 5:30 AM to 5:59 AM | 18 (10.3%) | 10 (6.7%) |
| 6:00 AM to 6:29 AM | 25 (14.4%) | 6 (4.0%) |
| 6:30 AM to 6:59 AM | 49 (28.2%) | 16 (10.7%) |
| 7:00 AM to 7:29 AM | 18 (10.3%) | 52 (34.9%) |
| 7:30 AM to 7:59 AM | 47 (27.0%) | 40 (26.9%) |
| 8:00 AM to 8:29 AM | 7 (4.0%) | 0 (0.0%) |
| 8:30 AM to 8:59 AM | 0 (0.0%) | 8 (5.4%) |
| 9:00 AM to 9:59 AM | 0 (0.0%) | 5 (3.4%) |
| 10:00 AM to 10:59 AM | 0 (0.0%) | 0 (0.0%) |
| 11:00 AM to 11:59 AM | 0 (0.0%) | 0 (0.0%) |
| 12:00 PM to 3:59 PM | 2 (1.1%) | 2 (1.3%) |
| 4:00 PM to 11:59 PM | 8 (4.6%) | 10 (6.7%) |
| Total | 174 (100.0%) | 149 (100.0%) |
Housing Occupancy in Snook
Occupancy by Ownership in Snook
Of the total 273 dwellings in Snook, owner-occupied units account for 196 (71.8%), while renter-occupied units make up 77 (28.2%).
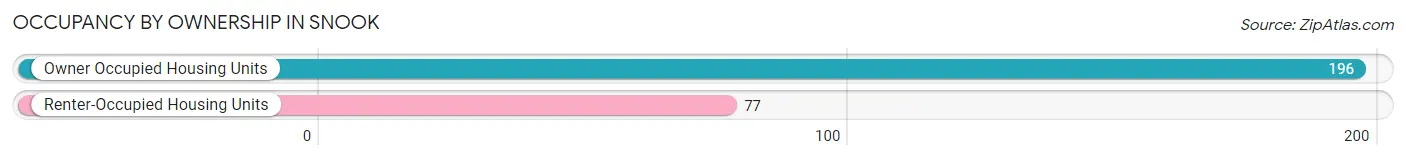
| Occupancy | # Housing Units | % Housing Units |
| Owner Occupied Housing Units | 196 | 71.8% |
| Renter-Occupied Housing Units | 77 | 28.2% |
| Total Occupied Housing Units | 273 | 100.0% |
Occupancy by Household Size in Snook
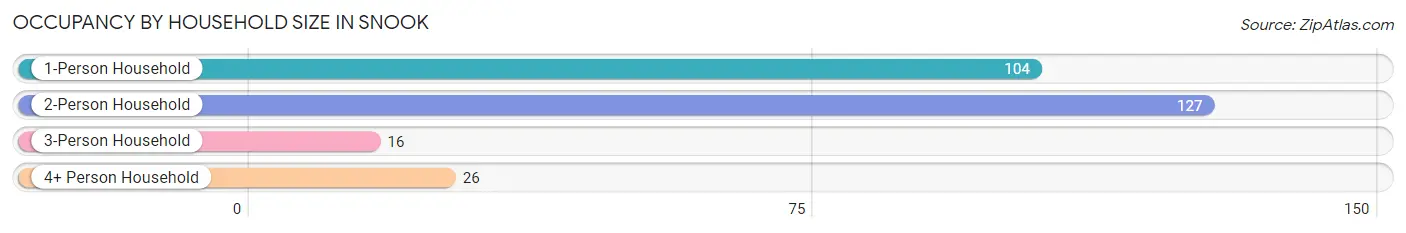
| Household Size | # Housing Units | % Housing Units |
| 1-Person Household | 104 | 38.1% |
| 2-Person Household | 127 | 46.5% |
| 3-Person Household | 16 | 5.9% |
| 4+ Person Household | 26 | 9.5% |
| Total Housing Units | 273 | 100.0% |
Occupancy by Ownership by Household Size in Snook
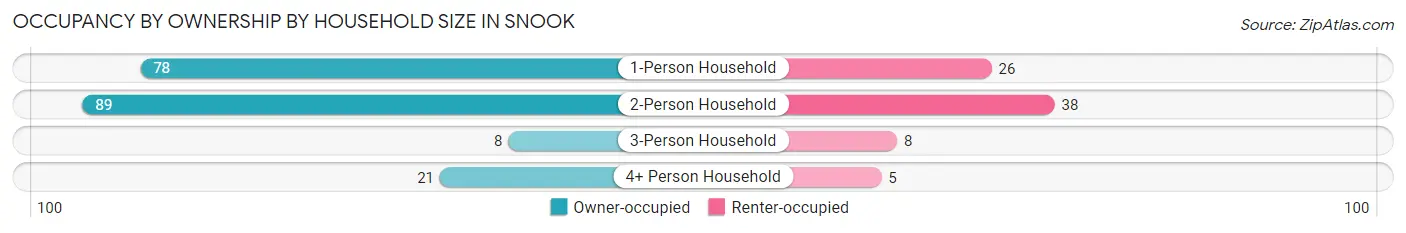
| Household Size | Owner-occupied | Renter-occupied |
| 1-Person Household | 78 (75.0%) | 26 (25.0%) |
| 2-Person Household | 89 (70.1%) | 38 (29.9%) |
| 3-Person Household | 8 (50.0%) | 8 (50.0%) |
| 4+ Person Household | 21 (80.8%) | 5 (19.2%) |
| Total Housing Units | 196 (71.8%) | 77 (28.2%) |
Occupancy by Educational Attainment in Snook
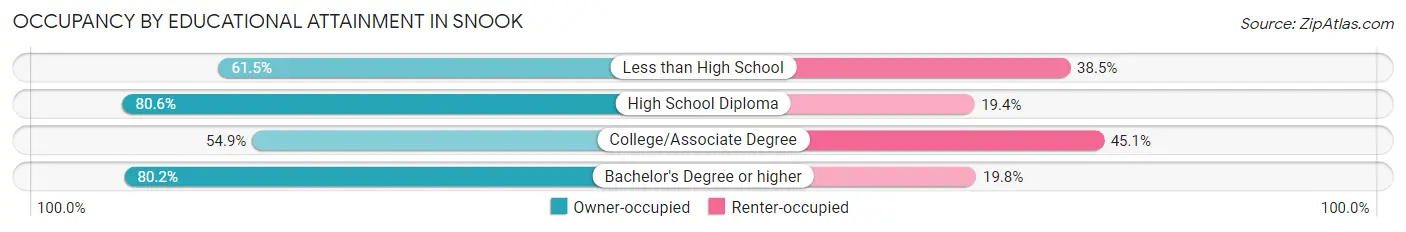
| Household Size | Owner-occupied | Renter-occupied |
| Less than High School | 8 (61.5%) | 5 (38.5%) |
| High School Diploma | 58 (80.6%) | 14 (19.4%) |
| College/Associate Degree | 45 (54.9%) | 37 (45.1%) |
| Bachelor's Degree or higher | 85 (80.2%) | 21 (19.8%) |
Occupancy by Age of Householder in Snook
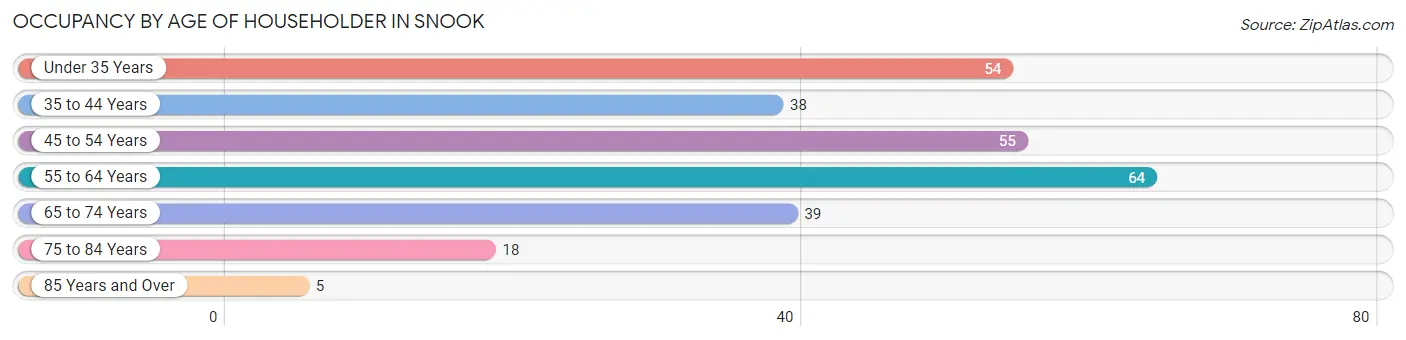
| Age Bracket | # Households | % Households |
| Under 35 Years | 54 | 19.8% |
| 35 to 44 Years | 38 | 13.9% |
| 45 to 54 Years | 55 | 20.2% |
| 55 to 64 Years | 64 | 23.4% |
| 65 to 74 Years | 39 | 14.3% |
| 75 to 84 Years | 18 | 6.6% |
| 85 Years and Over | 5 | 1.8% |
| Total | 273 | 100.0% |
Housing Finances in Snook
Median Income by Occupancy in Snook
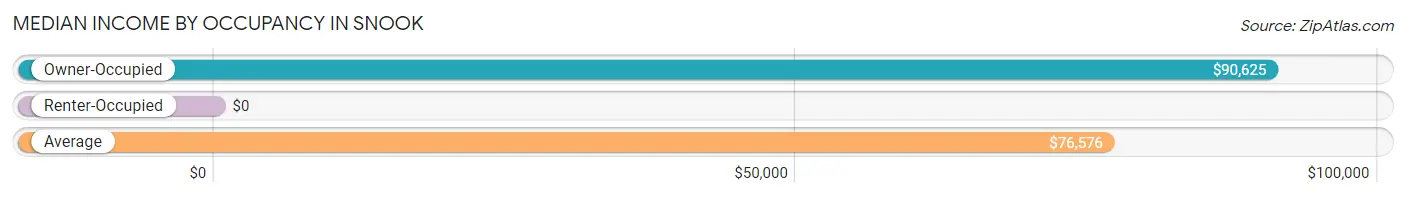
| Occupancy Type | # Households | Median Income |
| Owner-Occupied | 196 (71.8%) | $90,625 |
| Renter-Occupied | 77 (28.2%) | $0 |
| Average | 273 (100.0%) | $76,576 |
Occupancy by Householder Income Bracket in Snook
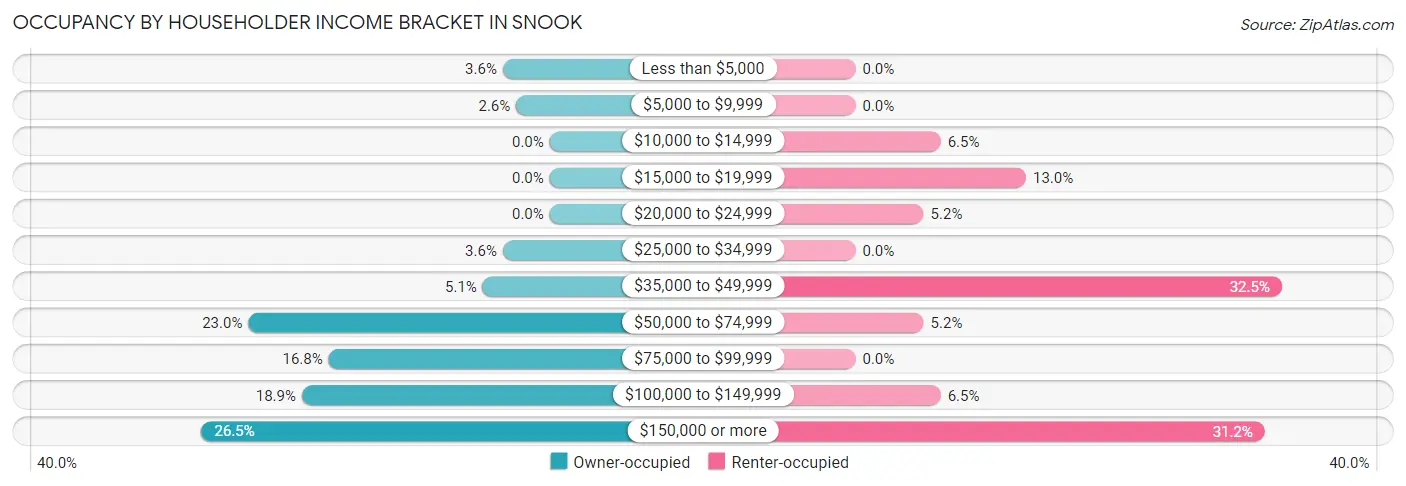
| Income Bracket | Owner-occupied | Renter-occupied |
| Less than $5,000 | 7 (3.6%) | 0 (0.0%) |
| $5,000 to $9,999 | 5 (2.5%) | 0 (0.0%) |
| $10,000 to $14,999 | 0 (0.0%) | 5 (6.5%) |
| $15,000 to $19,999 | 0 (0.0%) | 10 (13.0%) |
| $20,000 to $24,999 | 0 (0.0%) | 4 (5.2%) |
| $25,000 to $34,999 | 7 (3.6%) | 0 (0.0%) |
| $35,000 to $49,999 | 10 (5.1%) | 25 (32.5%) |
| $50,000 to $74,999 | 45 (23.0%) | 4 (5.2%) |
| $75,000 to $99,999 | 33 (16.8%) | 0 (0.0%) |
| $100,000 to $149,999 | 37 (18.9%) | 5 (6.5%) |
| $150,000 or more | 52 (26.5%) | 24 (31.2%) |
| Total | 196 (100.0%) | 77 (100.0%) |
Monthly Housing Cost Tiers in Snook
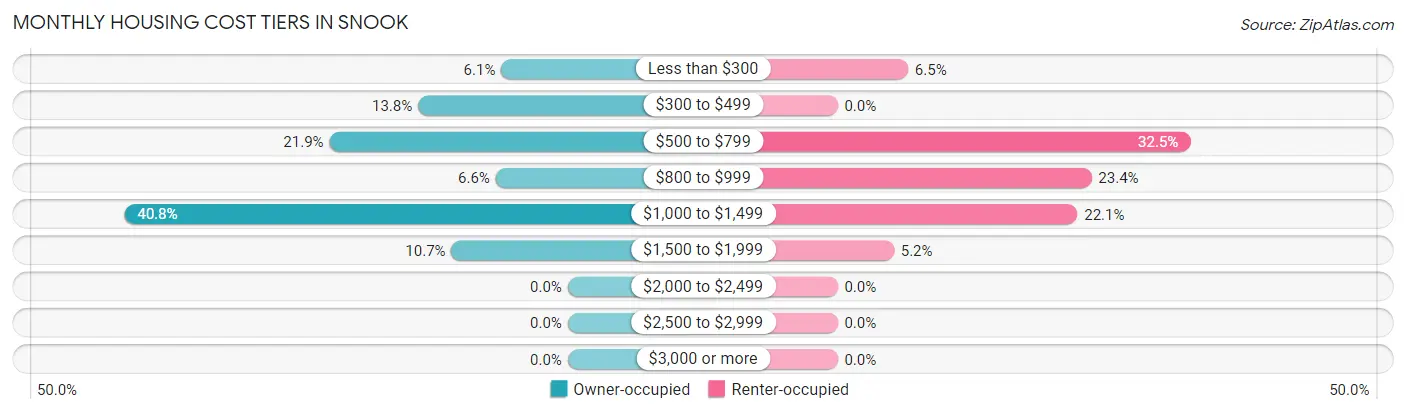
| Monthly Cost | Owner-occupied | Renter-occupied |
| Less than $300 | 12 (6.1%) | 5 (6.5%) |
| $300 to $499 | 27 (13.8%) | 0 (0.0%) |
| $500 to $799 | 43 (21.9%) | 25 (32.5%) |
| $800 to $999 | 13 (6.6%) | 18 (23.4%) |
| $1,000 to $1,499 | 80 (40.8%) | 17 (22.1%) |
| $1,500 to $1,999 | 21 (10.7%) | 4 (5.2%) |
| $2,000 to $2,499 | 0 (0.0%) | 0 (0.0%) |
| $2,500 to $2,999 | 0 (0.0%) | 0 (0.0%) |
| $3,000 or more | 0 (0.0%) | 0 (0.0%) |
| Total | 196 (100.0%) | 77 (100.0%) |
Physical Housing Characteristics in Snook
Housing Structures in Snook
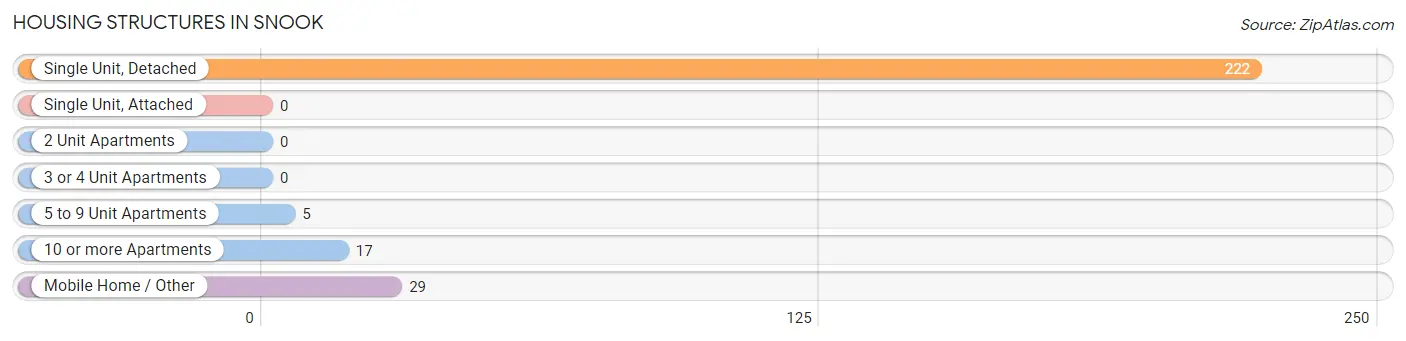
| Structure Type | # Housing Units | % Housing Units |
| Single Unit, Detached | 222 | 81.3% |
| Single Unit, Attached | 0 | 0.0% |
| 2 Unit Apartments | 0 | 0.0% |
| 3 or 4 Unit Apartments | 0 | 0.0% |
| 5 to 9 Unit Apartments | 5 | 1.8% |
| 10 or more Apartments | 17 | 6.2% |
| Mobile Home / Other | 29 | 10.6% |
| Total | 273 | 100.0% |
Housing Structures by Occupancy in Snook
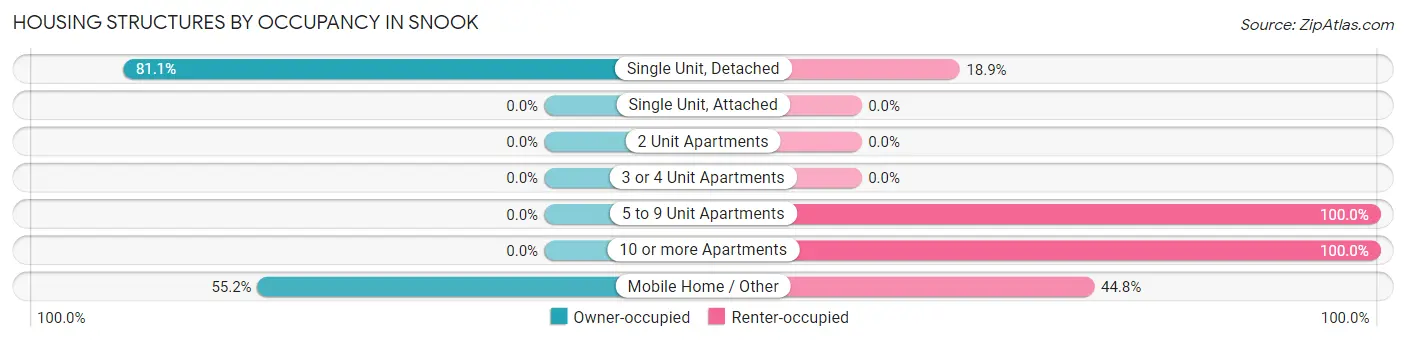
| Structure Type | Owner-occupied | Renter-occupied |
| Single Unit, Detached | 180 (81.1%) | 42 (18.9%) |
| Single Unit, Attached | 0 (0.0%) | 0 (0.0%) |
| 2 Unit Apartments | 0 (0.0%) | 0 (0.0%) |
| 3 or 4 Unit Apartments | 0 (0.0%) | 0 (0.0%) |
| 5 to 9 Unit Apartments | 0 (0.0%) | 5 (100.0%) |
| 10 or more Apartments | 0 (0.0%) | 17 (100.0%) |
| Mobile Home / Other | 16 (55.2%) | 13 (44.8%) |
| Total | 196 (71.8%) | 77 (28.2%) |
Housing Structures by Number of Rooms in Snook
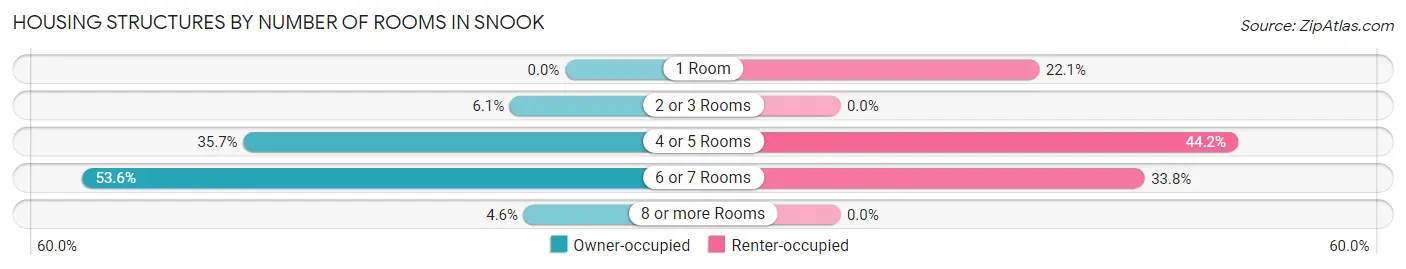
| Number of Rooms | Owner-occupied | Renter-occupied |
| 1 Room | 0 (0.0%) | 17 (22.1%) |
| 2 or 3 Rooms | 12 (6.1%) | 0 (0.0%) |
| 4 or 5 Rooms | 70 (35.7%) | 34 (44.2%) |
| 6 or 7 Rooms | 105 (53.6%) | 26 (33.8%) |
| 8 or more Rooms | 9 (4.6%) | 0 (0.0%) |
| Total | 196 (100.0%) | 77 (100.0%) |
Housing Structure by Heating Type in Snook
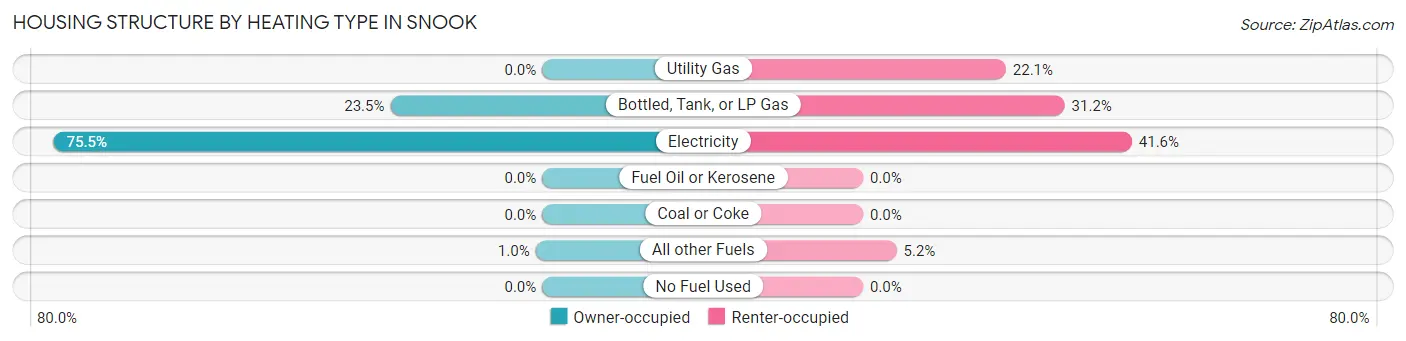
| Heating Type | Owner-occupied | Renter-occupied |
| Utility Gas | 0 (0.0%) | 17 (22.1%) |
| Bottled, Tank, or LP Gas | 46 (23.5%) | 24 (31.2%) |
| Electricity | 148 (75.5%) | 32 (41.6%) |
| Fuel Oil or Kerosene | 0 (0.0%) | 0 (0.0%) |
| Coal or Coke | 0 (0.0%) | 0 (0.0%) |
| All other Fuels | 2 (1.0%) | 4 (5.2%) |
| No Fuel Used | 0 (0.0%) | 0 (0.0%) |
| Total | 196 (100.0%) | 77 (100.0%) |
Household Vehicle Usage in Snook
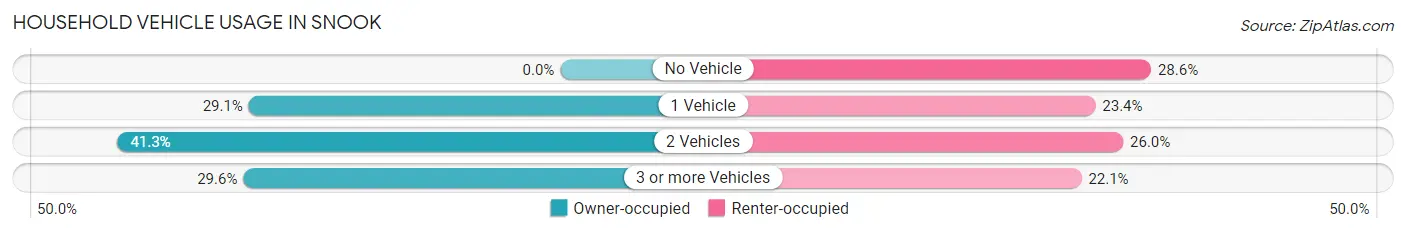
| Vehicles per Household | Owner-occupied | Renter-occupied |
| No Vehicle | 0 (0.0%) | 22 (28.6%) |
| 1 Vehicle | 57 (29.1%) | 18 (23.4%) |
| 2 Vehicles | 81 (41.3%) | 20 (26.0%) |
| 3 or more Vehicles | 58 (29.6%) | 17 (22.1%) |
| Total | 196 (100.0%) | 77 (100.0%) |
Real Estate & Mortgages in Snook
Real Estate and Mortgage Overview in Snook
| Characteristic | Without Mortgage | With Mortgage |
| Housing Units | 90 | 106 |
| Median Property Value | $140,000 | $167,300 |
| Median Household Income | $131,875 | $9 |
| Monthly Housing Costs | $586 | $0 |
| Real Estate Taxes | $2,545 | $0 |
Property Value by Mortgage Status in Snook
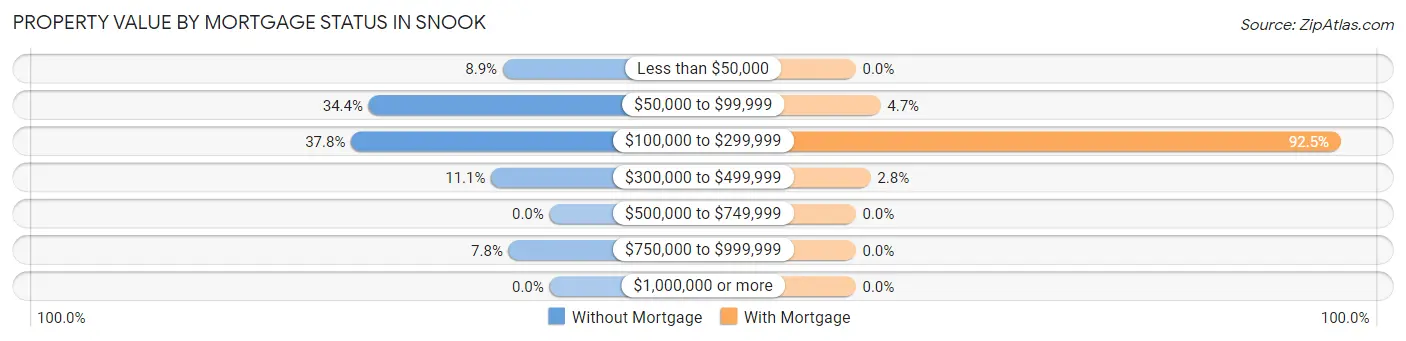
| Property Value | Without Mortgage | With Mortgage |
| Less than $50,000 | 8 (8.9%) | 0 (0.0%) |
| $50,000 to $99,999 | 31 (34.4%) | 5 (4.7%) |
| $100,000 to $299,999 | 34 (37.8%) | 98 (92.4%) |
| $300,000 to $499,999 | 10 (11.1%) | 3 (2.8%) |
| $500,000 to $749,999 | 0 (0.0%) | 0 (0.0%) |
| $750,000 to $999,999 | 7 (7.8%) | 0 (0.0%) |
| $1,000,000 or more | 0 (0.0%) | 0 (0.0%) |
| Total | 90 (100.0%) | 106 (100.0%) |
Household Income by Mortgage Status in Snook
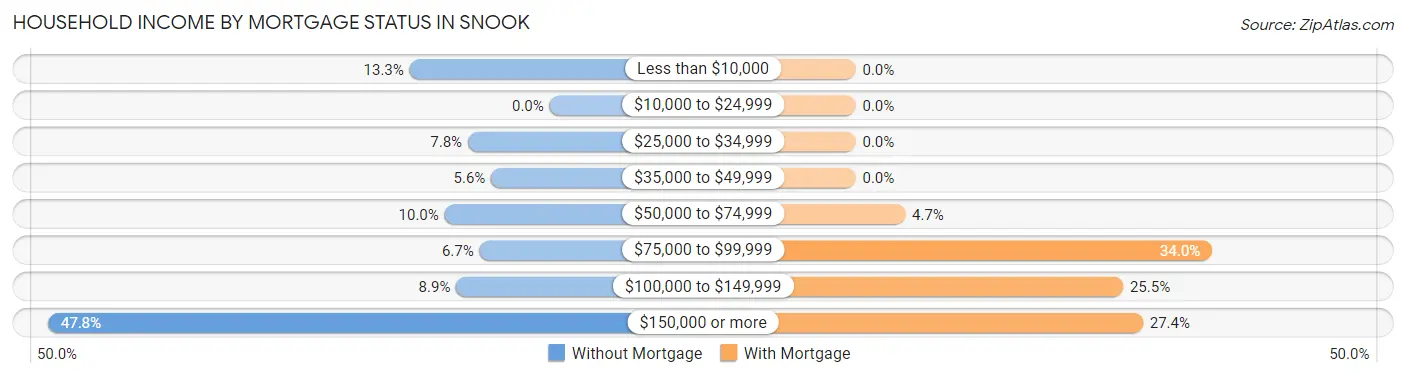
| Household Income | Without Mortgage | With Mortgage |
| Less than $10,000 | 12 (13.3%) | 0 (0.0%) |
| $10,000 to $24,999 | 0 (0.0%) | 0 (0.0%) |
| $25,000 to $34,999 | 7 (7.8%) | 0 (0.0%) |
| $35,000 to $49,999 | 5 (5.6%) | 0 (0.0%) |
| $50,000 to $74,999 | 9 (10.0%) | 5 (4.7%) |
| $75,000 to $99,999 | 6 (6.7%) | 36 (34.0%) |
| $100,000 to $149,999 | 8 (8.9%) | 27 (25.5%) |
| $150,000 or more | 43 (47.8%) | 29 (27.4%) |
| Total | 90 (100.0%) | 106 (100.0%) |
Property Value to Household Income Ratio in Snook
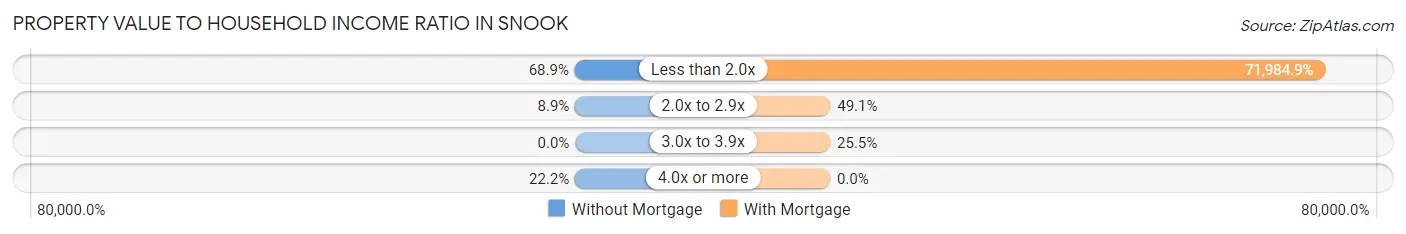
| Value-to-Income Ratio | Without Mortgage | With Mortgage |
| Less than 2.0x | 62 (68.9%) | 76,304 (71,984.9%) |
| 2.0x to 2.9x | 8 (8.9%) | 52 (49.1%) |
| 3.0x to 3.9x | 0 (0.0%) | 27 (25.5%) |
| 4.0x or more | 20 (22.2%) | 0 (0.0%) |
| Total | 90 (100.0%) | 106 (100.0%) |
Real Estate Taxes by Mortgage Status in Snook
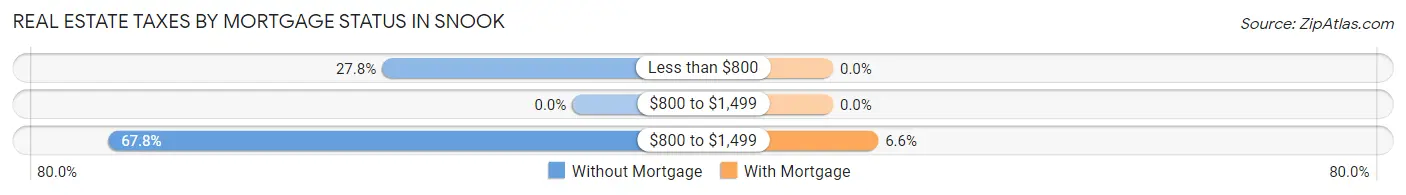
| Property Taxes | Without Mortgage | With Mortgage |
| Less than $800 | 25 (27.8%) | 0 (0.0%) |
| $800 to $1,499 | 0 (0.0%) | 0 (0.0%) |
| $800 to $1,499 | 61 (67.8%) | 7 (6.6%) |
| Total | 90 (100.0%) | 106 (100.0%) |
Health & Disability in Snook
Health Insurance Coverage by Age in Snook
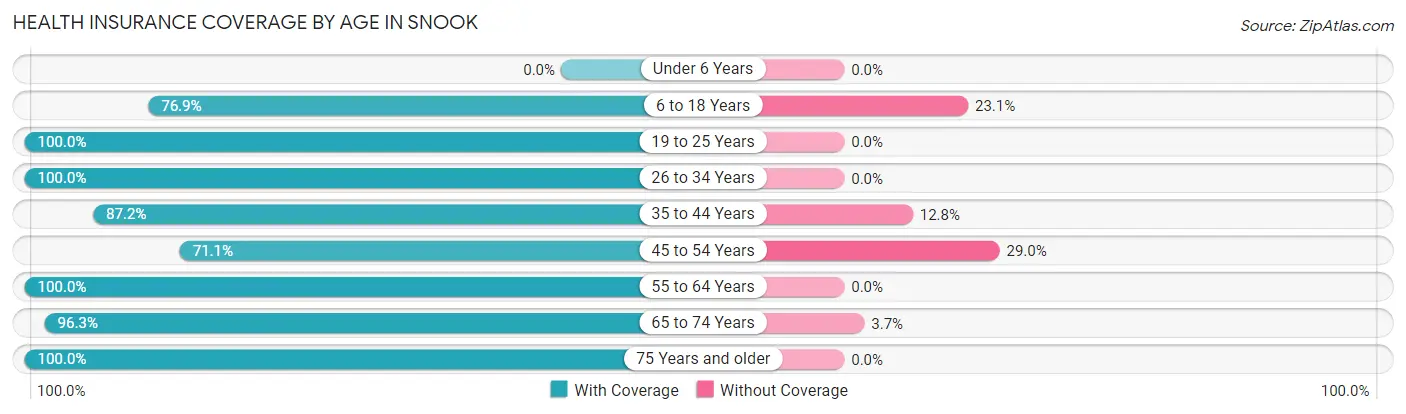
| Age Bracket | With Coverage | Without Coverage |
| Under 6 Years | 0 (0.0%) | 0 (0.0%) |
| 6 to 18 Years | 50 (76.9%) | 15 (23.1%) |
| 19 to 25 Years | 28 (100.0%) | 0 (0.0%) |
| 26 to 34 Years | 70 (100.0%) | 0 (0.0%) |
| 35 to 44 Years | 41 (87.2%) | 6 (12.8%) |
| 45 to 54 Years | 54 (71.1%) | 22 (28.9%) |
| 55 to 64 Years | 98 (100.0%) | 0 (0.0%) |
| 65 to 74 Years | 103 (96.3%) | 4 (3.7%) |
| 75 Years and older | 23 (100.0%) | 0 (0.0%) |
| Total | 467 (90.9%) | 47 (9.1%) |
Health Insurance Coverage by Citizenship Status in Snook
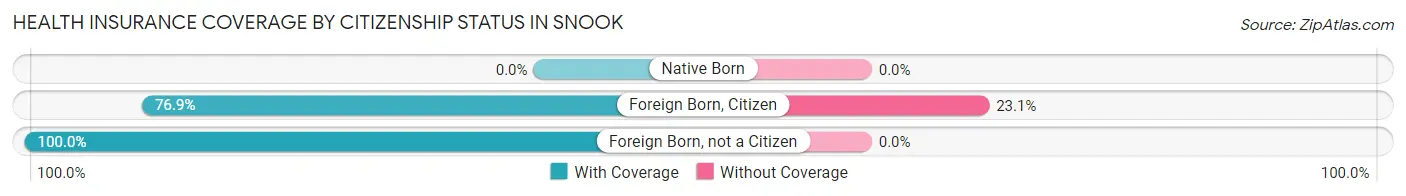
| Citizenship Status | With Coverage | Without Coverage |
| Native Born | 0 (0.0%) | 0 (0.0%) |
| Foreign Born, Citizen | 50 (76.9%) | 15 (23.1%) |
| Foreign Born, not a Citizen | 28 (100.0%) | 0 (0.0%) |
Health Insurance Coverage by Household Income in Snook
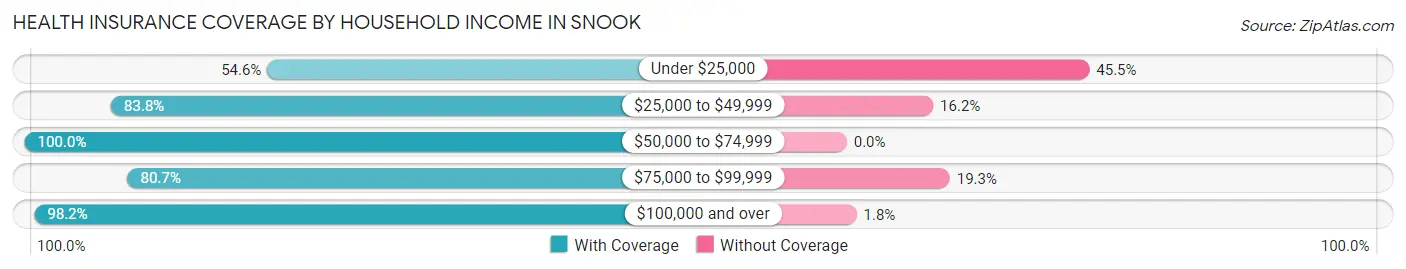
| Household Income | With Coverage | Without Coverage |
| Under $25,000 | 24 (54.5%) | 20 (45.5%) |
| $25,000 to $49,999 | 57 (83.8%) | 11 (16.2%) |
| $50,000 to $74,999 | 73 (100.0%) | 0 (0.0%) |
| $75,000 to $99,999 | 46 (80.7%) | 11 (19.3%) |
| $100,000 and over | 267 (98.2%) | 5 (1.8%) |
Public vs Private Health Insurance Coverage by Age in Snook
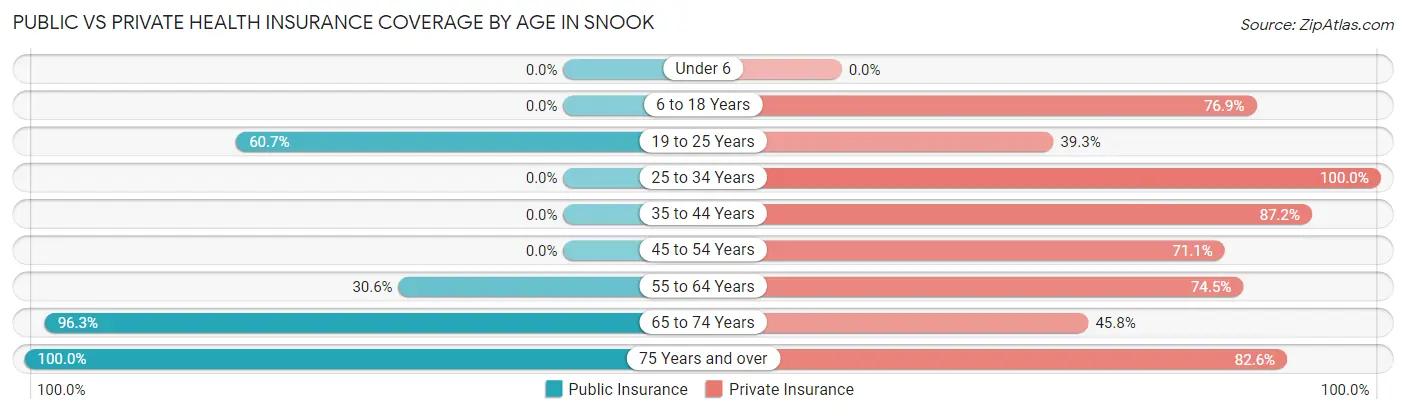
| Age Bracket | Public Insurance | Private Insurance |
| Under 6 | 0 (0.0%) | 0 (0.0%) |
| 6 to 18 Years | 0 (0.0%) | 50 (76.9%) |
| 19 to 25 Years | 17 (60.7%) | 11 (39.3%) |
| 25 to 34 Years | 0 (0.0%) | 70 (100.0%) |
| 35 to 44 Years | 0 (0.0%) | 41 (87.2%) |
| 45 to 54 Years | 0 (0.0%) | 54 (71.1%) |
| 55 to 64 Years | 30 (30.6%) | 73 (74.5%) |
| 65 to 74 Years | 103 (96.3%) | 49 (45.8%) |
| 75 Years and over | 23 (100.0%) | 19 (82.6%) |
| Total | 173 (33.7%) | 367 (71.4%) |
Disability Status by Sex by Age in Snook
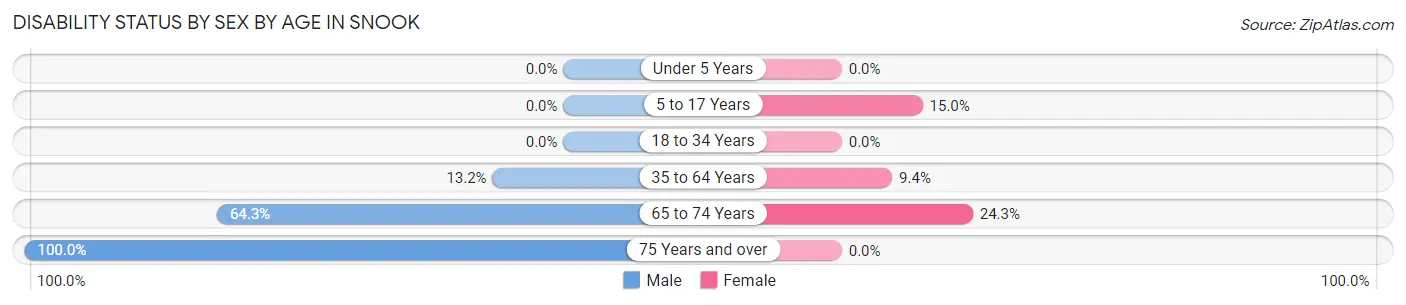
| Age Bracket | Male | Female |
| Under 5 Years | 0 (0.0%) | 0 (0.0%) |
| 5 to 17 Years | 0 (0.0%) | 3 (15.0%) |
| 18 to 34 Years | 0 (0.0%) | 0 (0.0%) |
| 35 to 64 Years | 15 (13.2%) | 10 (9.3%) |
| 65 to 74 Years | 45 (64.3%) | 9 (24.3%) |
| 75 Years and over | 10 (100.0%) | 0 (0.0%) |
Disability Class by Sex by Age in Snook
Disability Class: Hearing Difficulty
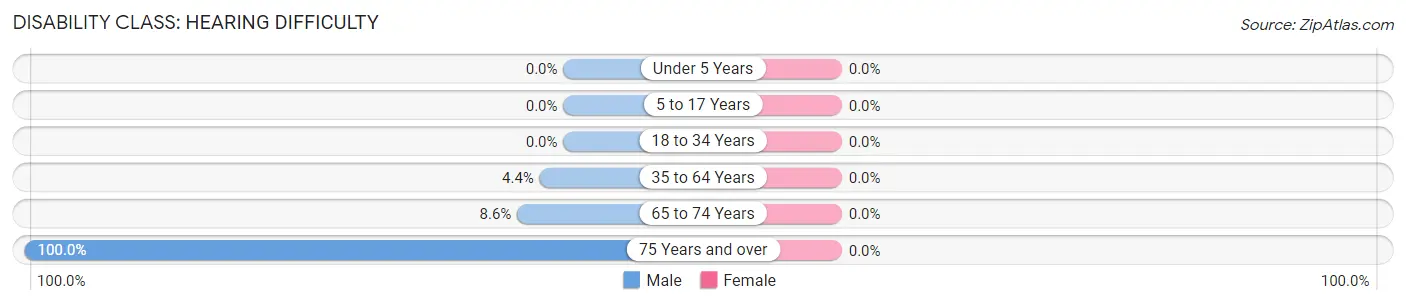
| Age Bracket | Male | Female |
| Under 5 Years | 0 (0.0%) | 0 (0.0%) |
| 5 to 17 Years | 0 (0.0%) | 0 (0.0%) |
| 18 to 34 Years | 0 (0.0%) | 0 (0.0%) |
| 35 to 64 Years | 5 (4.4%) | 0 (0.0%) |
| 65 to 74 Years | 6 (8.6%) | 0 (0.0%) |
| 75 Years and over | 10 (100.0%) | 0 (0.0%) |
Disability Class: Vision Difficulty
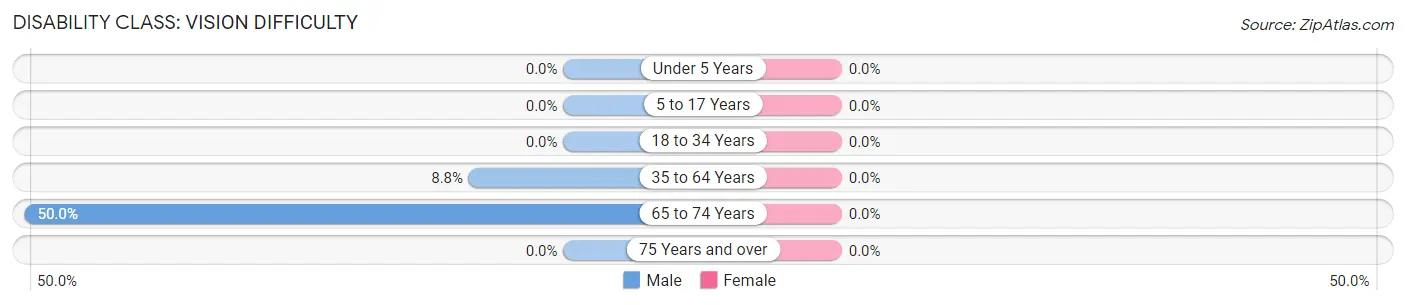
| Age Bracket | Male | Female |
| Under 5 Years | 0 (0.0%) | 0 (0.0%) |
| 5 to 17 Years | 0 (0.0%) | 0 (0.0%) |
| 18 to 34 Years | 0 (0.0%) | 0 (0.0%) |
| 35 to 64 Years | 10 (8.8%) | 0 (0.0%) |
| 65 to 74 Years | 35 (50.0%) | 0 (0.0%) |
| 75 Years and over | 0 (0.0%) | 0 (0.0%) |
Disability Class: Cognitive Difficulty
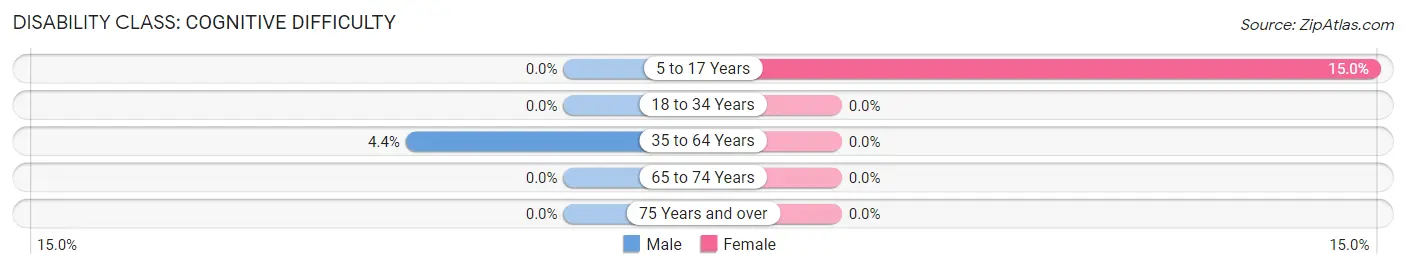
| Age Bracket | Male | Female |
| 5 to 17 Years | 0 (0.0%) | 3 (15.0%) |
| 18 to 34 Years | 0 (0.0%) | 0 (0.0%) |
| 35 to 64 Years | 5 (4.4%) | 0 (0.0%) |
| 65 to 74 Years | 0 (0.0%) | 0 (0.0%) |
| 75 Years and over | 0 (0.0%) | 0 (0.0%) |
Disability Class: Ambulatory Difficulty
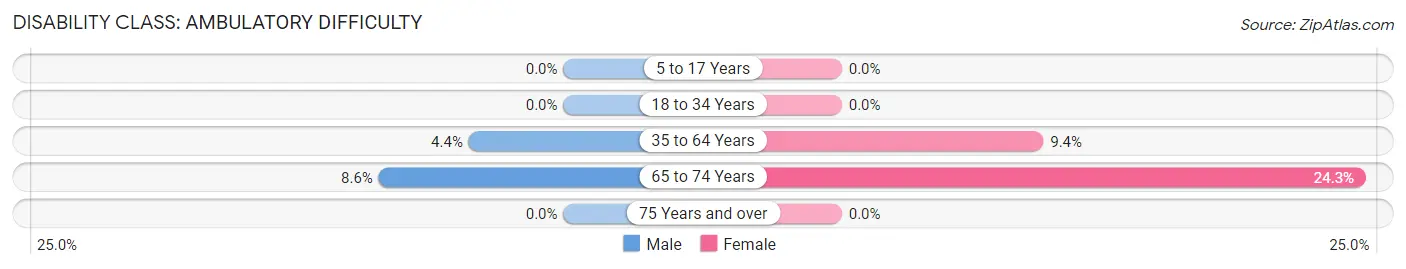
| Age Bracket | Male | Female |
| 5 to 17 Years | 0 (0.0%) | 0 (0.0%) |
| 18 to 34 Years | 0 (0.0%) | 0 (0.0%) |
| 35 to 64 Years | 5 (4.4%) | 10 (9.3%) |
| 65 to 74 Years | 6 (8.6%) | 9 (24.3%) |
| 75 Years and over | 0 (0.0%) | 0 (0.0%) |
Disability Class: Self-Care Difficulty
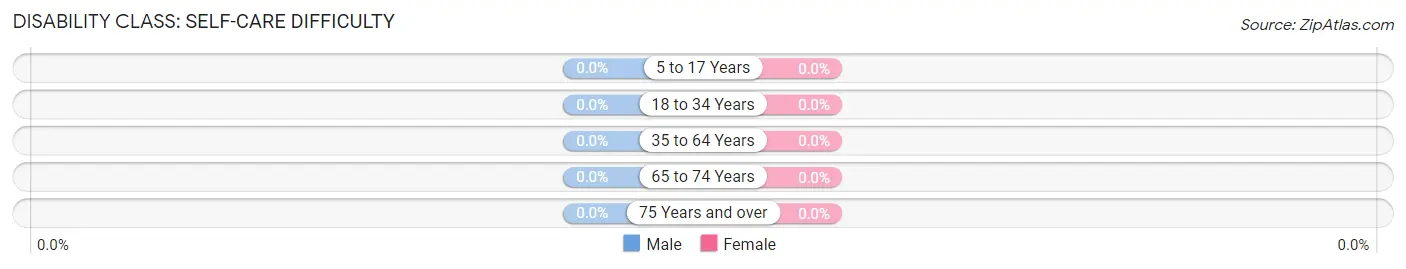
| Age Bracket | Male | Female |
| 5 to 17 Years | 0 (0.0%) | 0 (0.0%) |
| 18 to 34 Years | 0 (0.0%) | 0 (0.0%) |
| 35 to 64 Years | 0 (0.0%) | 0 (0.0%) |
| 65 to 74 Years | 0 (0.0%) | 0 (0.0%) |
| 75 Years and over | 0 (0.0%) | 0 (0.0%) |
Technology Access in Snook
Computing Device Access in Snook
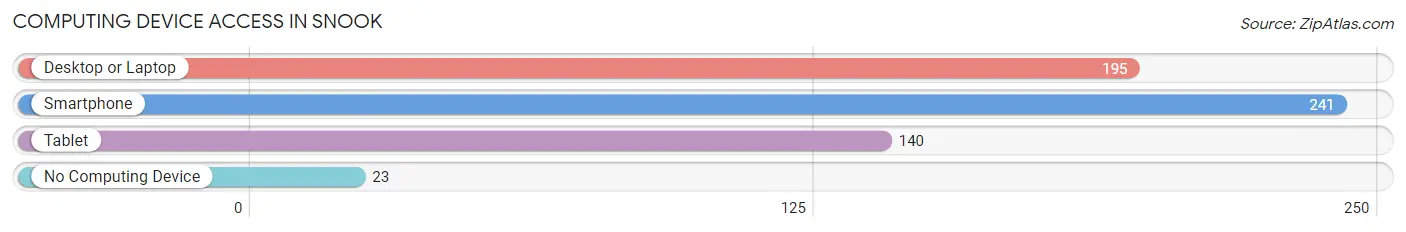
| Device Type | # Households | % Households |
| Desktop or Laptop | 195 | 71.4% |
| Smartphone | 241 | 88.3% |
| Tablet | 140 | 51.3% |
| No Computing Device | 23 | 8.4% |
| Total | 273 | 100.0% |
Internet Access in Snook
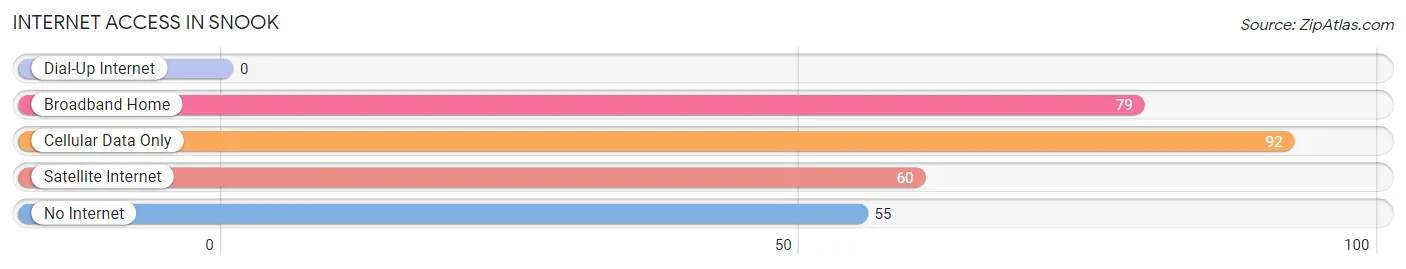
| Internet Type | # Households | % Households |
| Dial-Up Internet | 0 | 0.0% |
| Broadband Home | 79 | 28.9% |
| Cellular Data Only | 92 | 33.7% |
| Satellite Internet | 60 | 22.0% |
| No Internet | 55 | 20.2% |
| Total | 273 | 100.0% |
Snook Summary
Snook, Texas is a small town located in Burleson County, Texas. It is situated about halfway between Bryan and College Station, and is part of the Bryan-College Station metropolitan area. The population of Snook was 1,093 as of the 2010 census.
History
Snook was founded in 1881 by a group of settlers from Germany. The town was named after a local rancher, John Snook, who owned a large amount of land in the area. The town was incorporated in 1891 and was a thriving agricultural community for many years.
In the early 1900s, the town began to experience a decline in population due to the Great Depression and the Dust Bowl. However, the town was able to survive and eventually began to experience a resurgence in the 1950s and 1960s.
Geography
Snook is located in Burleson County, Texas, about halfway between Bryan and College Station. The town is situated on the Brazos River, and is surrounded by rolling hills and farmland. The climate in Snook is generally mild, with temperatures ranging from the mid-50s in the winter to the mid-90s in the summer.
Economy
Snook is a small, rural town with a primarily agricultural economy. The town is home to several farms and ranches, as well as a few small businesses. The town also has a few restaurants and convenience stores.
Demographics
As of the 2010 census, the population of Snook was 1,093. The racial makeup of the town was 94.3% White, 0.7% African American, 0.3% Native American, 0.2% Asian, 0.1% Pacific Islander, 2.7% from other races, and 1.9% from two or more races. Hispanic or Latino of any race were 5.2% of the population.
The median income for a household in Snook was $37,500, and the median income for a family was $41,250. The per capita income for the town was $17,845. About 11.2% of families and 13.2% of the population were below the poverty line, including 16.7% of those under age 18 and 10.3% of those age 65 or over.
Conclusion
Snook, Texas is a small town located in Burleson County, Texas. It is situated about halfway between Bryan and College Station, and is part of the Bryan-College Station metropolitan area. The population of Snook was 1,093 as of the 2010 census. The town was founded in 1881 by a group of settlers from Germany and has a primarily agricultural economy. The racial makeup of the town was 94.3% White, 0.7% African American, 0.3% Native American, 0.2% Asian, 0.1% Pacific Islander, 2.7% from other races, and 1.9% from two or more races. The median income for a household in Snook was $37,500, and the median income for a family was $41,250. The per capita income for the town was $17,845. Snook is a small, rural town with a rich history and a bright future.
Common Questions
What is Per Capita Income in Snook?
Per Capita income in Snook is $59,214.
What is the Median Family Income in Snook?
Median Family Income in Snook is $118,750.
What is the Median Household income in Snook?
Median Household Income in Snook is $76,576.
What is Income or Wage Gap in Snook?
Income or Wage Gap in Snook is 41.4%.
Women in Snook earn 58.6 cents for every dollar earned by a man.
What is Inequality or Gini Index in Snook?
Inequality or Gini Index in Snook is 0.38.
What is the Total Population of Snook?
Total Population of Snook is 514.
What is the Total Male Population of Snook?
Total Male Population of Snook is 246.
What is the Total Female Population of Snook?
Total Female Population of Snook is 268.
What is the Ratio of Males per 100 Females in Snook?
There are 91.79 Males per 100 Females in Snook.
What is the Ratio of Females per 100 Males in Snook?
There are 108.94 Females per 100 Males in Snook.
What is the Median Population Age in Snook?
Median Population Age in Snook is 49.5 Years.
What is the Average Family Size in Snook
Average Family Size in Snook is 2.4 People.
What is the Average Household Size in Snook
Average Household Size in Snook is 1.9 People.
How Large is the Labor Force in Snook?
There are 340 People in the Labor Forcein in Snook.
What is the Percentage of People in the Labor Force in Snook?
69.7% of People are in the Labor Force in Snook.