Zip Codes with the Highest Percentage of Population Employed in Administrative & Support Services in Montgomery, TX
RELATED REPORTS & OPTIONS
Administrative & Support Services
Montgomery
Compare Zip Codes
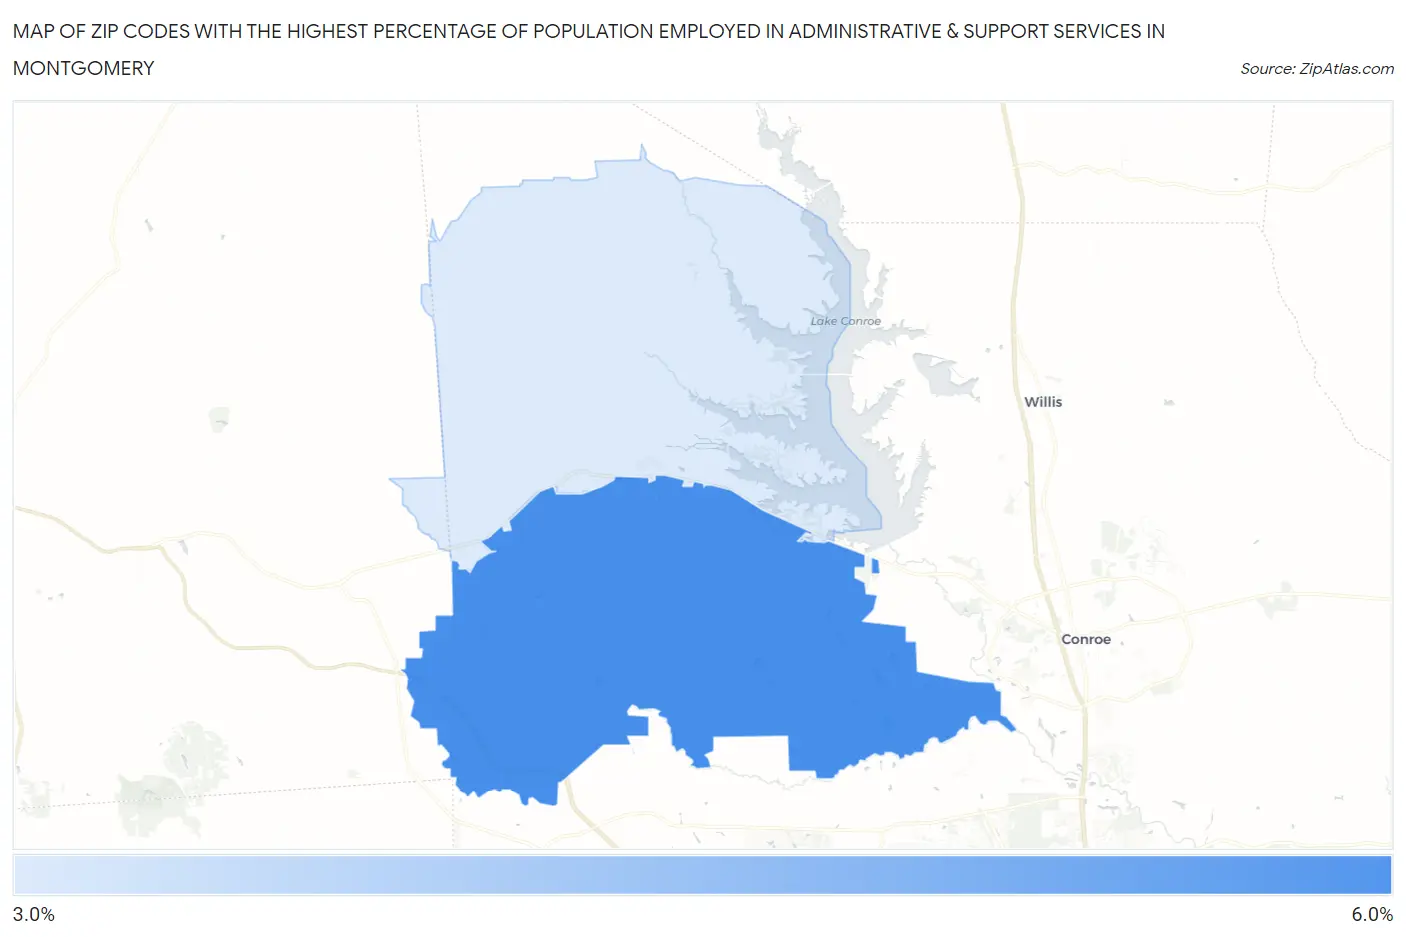
Map of Zip Codes with the Highest Percentage of Population Employed in Administrative & Support Services in Montgomery
3.8%
5.2%
Zip Codes with the Highest Percentage of Population Employed in Administrative & Support Services in Montgomery, TX
| Zip Code | % Employed | vs State | vs National | |
| 1. | 77316 | 5.2% | 4.4%(+0.828)#475 | 4.1%(+1.09)#6,489 |
| 2. | 77356 | 3.8% | 4.4%(-0.626)#796 | 4.1%(-0.359)#11,578 |
1
Common Questions
What are the Top Zip Codes with the Highest Percentage of Population Employed in Administrative & Support Services in Montgomery, TX?
Top Zip Codes with the Highest Percentage of Population Employed in Administrative & Support Services in Montgomery, TX are:
What zip code has the Highest Percentage of Population Employed in Administrative & Support Services in Montgomery, TX?
77316 has the Highest Percentage of Population Employed in Administrative & Support Services in Montgomery, TX with 5.2%.
What is the Percentage of Population Employed in Administrative & Support Services in Montgomery, TX?
Percentage of Population Employed in Administrative & Support Services in Montgomery is 0.94%.
What is the Percentage of Population Employed in Administrative & Support Services in Texas?
Percentage of Population Employed in Administrative & Support Services in Texas is 4.4%.
What is the Percentage of Population Employed in Administrative & Support Services in the United States?
Percentage of Population Employed in Administrative & Support Services in the United States is 4.1%.