Scissors, TX Map & Demographics
Scissors Map
Scissors Overview
$13,332
PER CAPITA INCOME
$28,616
AVG FAMILY INCOME
$28,522
AVG HOUSEHOLD INCOME
12.2%
WAGE / INCOME GAP [ % ]
87.8¢/ $1
WAGE / INCOME GAP [ $ ]
0.56
INEQUALITY / GINI INDEX
3,667
TOTAL POPULATION
1,990
MALE POPULATION
1,677
FEMALE POPULATION
118.66
MALES / 100 FEMALES
84.27
FEMALES / 100 MALES
27.4
MEDIAN AGE
5.1
AVG FAMILY SIZE
4.8
AVG HOUSEHOLD SIZE
1,504
LABOR FORCE [ PEOPLE ]
59.1%
PERCENT IN LABOR FORCE
3.4%
UNEMPLOYMENT RATE
Income in Scissors
Income Overview in Scissors
Per Capita Income in Scissors is $13,332, while median incomes of families and households are $28,616 and $28,522 respectively.
| Characteristic | Number | Measure |
| Per Capita Income | 3,667 | $13,332 |
| Median Family Income | 699 | $28,616 |
| Mean Family Income | 699 | $49,067 |
| Median Household Income | 760 | $28,522 |
| Mean Household Income | 760 | $57,031 |
| Income Deficit | 699 | $0 |
| Wage / Income Gap (%) | 3,667 | 12.17% |
| Wage / Income Gap ($) | 3,667 | 87.83¢ per $1 |
| Gini / Inequality Index | 3,667 | 0.56 |
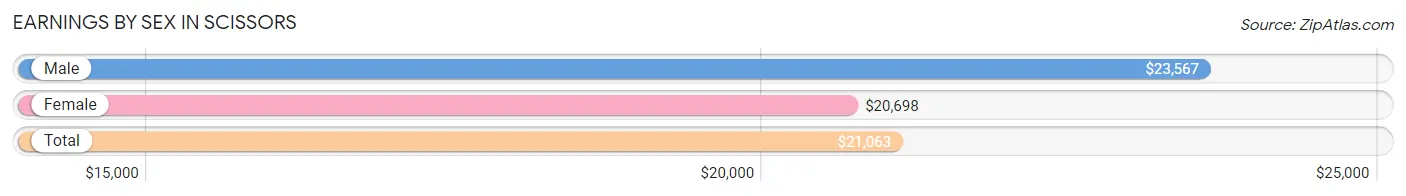
Earnings by Sex in Scissors
Average Earnings in Scissors are $21,063, $23,567 for men and $20,698 for women, a difference of 12.2%.
| Sex | Number | Average Earnings |
| Male | 905 (61.3%) | $23,567 |
| Female | 571 (38.7%) | $20,698 |
| Total | 1,476 (100.0%) | $21,063 |
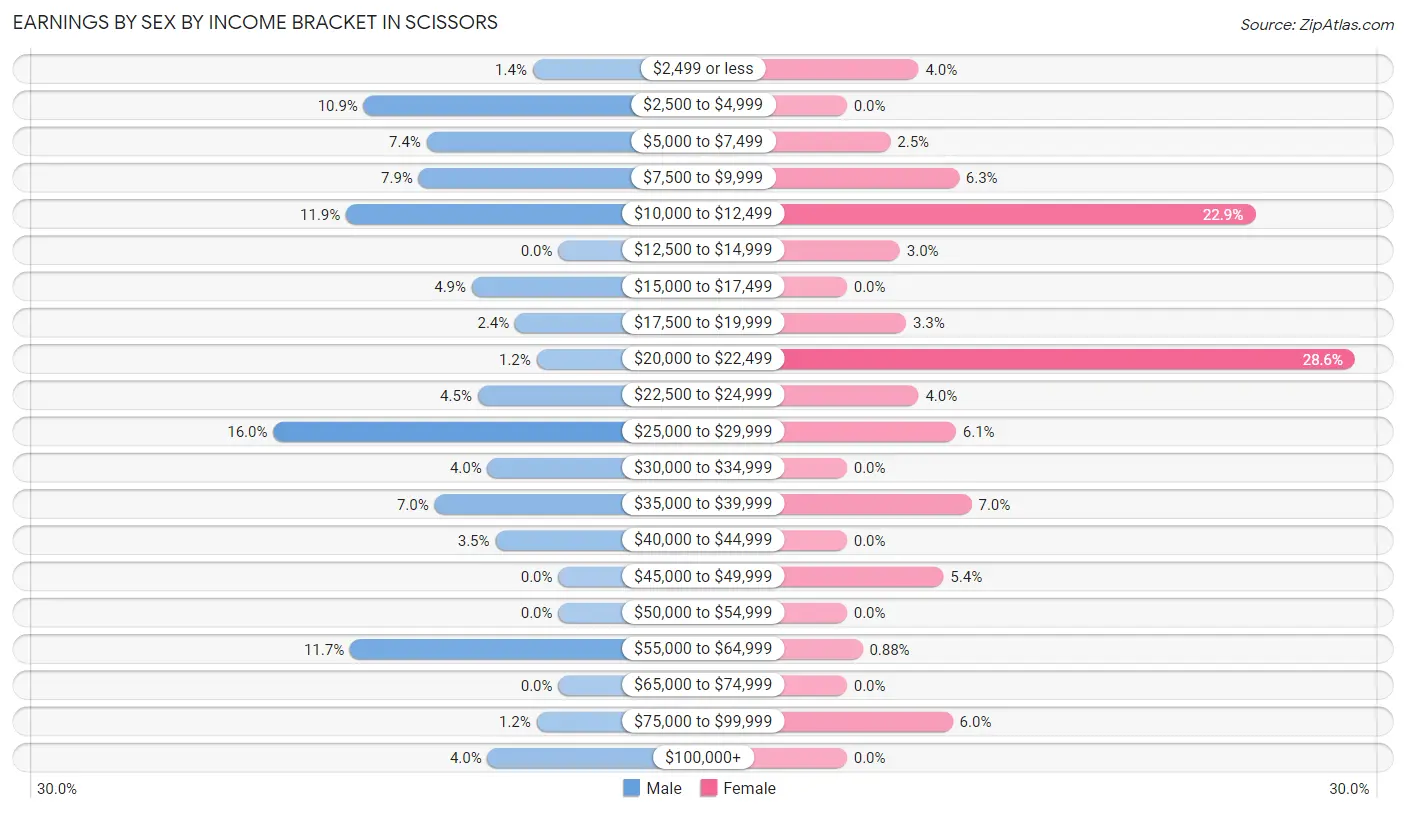
Earnings by Sex by Income Bracket in Scissors
The most common earnings brackets in Scissors are $25,000 to $29,999 for men (145 | 16.0%) and $20,000 to $22,499 for women (163 | 28.5%).
| Income | Male | Female |
| $2,499 or less | 13 (1.4%) | 23 (4.0%) |
| $2,500 to $4,999 | 99 (10.9%) | 0 (0.0%) |
| $5,000 to $7,499 | 67 (7.4%) | 14 (2.5%) |
| $7,500 to $9,999 | 71 (7.9%) | 36 (6.3%) |
| $10,000 to $12,499 | 108 (11.9%) | 131 (22.9%) |
| $12,500 to $14,999 | 0 (0.0%) | 17 (3.0%) |
| $15,000 to $17,499 | 44 (4.9%) | 0 (0.0%) |
| $17,500 to $19,999 | 22 (2.4%) | 19 (3.3%) |
| $20,000 to $22,499 | 11 (1.2%) | 163 (28.5%) |
| $22,500 to $24,999 | 41 (4.5%) | 23 (4.0%) |
| $25,000 to $29,999 | 145 (16.0%) | 35 (6.1%) |
| $30,000 to $34,999 | 36 (4.0%) | 0 (0.0%) |
| $35,000 to $39,999 | 63 (7.0%) | 40 (7.0%) |
| $40,000 to $44,999 | 32 (3.5%) | 0 (0.0%) |
| $45,000 to $49,999 | 0 (0.0%) | 31 (5.4%) |
| $50,000 to $54,999 | 0 (0.0%) | 0 (0.0%) |
| $55,000 to $64,999 | 106 (11.7%) | 5 (0.9%) |
| $65,000 to $74,999 | 0 (0.0%) | 0 (0.0%) |
| $75,000 to $99,999 | 11 (1.2%) | 34 (5.9%) |
| $100,000+ | 36 (4.0%) | 0 (0.0%) |
| Total | 905 (100.0%) | 571 (100.0%) |
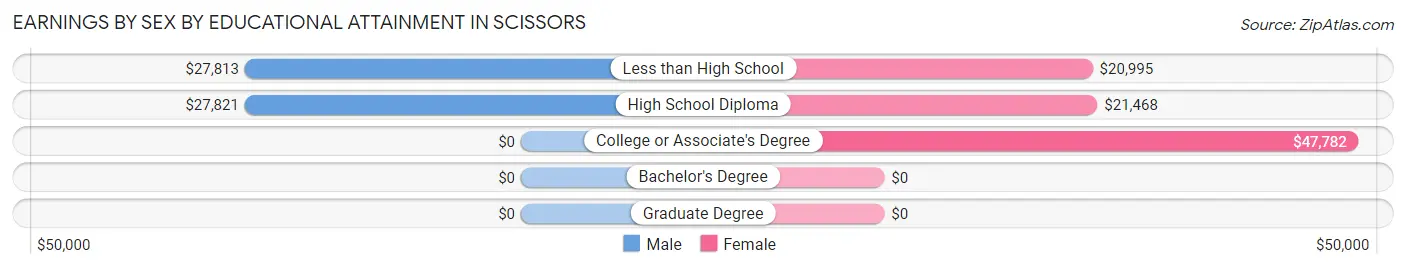
Earnings by Sex by Educational Attainment in Scissors
Average earnings in Scissors are $28,284 for men and $21,771 for women, a difference of 23.0%. Men with an educational attainment of high school diploma enjoy the highest average annual earnings of $27,821, while those with less than high school education earn the least with $27,813. Women with an educational attainment of college or associate's degree earn the most with the average annual earnings of $47,782, while those with less than high school education have the smallest earnings of $20,995.
| Educational Attainment | Male Income | Female Income |
| Less than High School | $27,813 | $20,995 |
| High School Diploma | $27,821 | $21,468 |
| College or Associate's Degree | - | - |
| Bachelor's Degree | - | - |
| Graduate Degree | - | - |
| Total | $28,284 | $21,771 |
Family Income in Scissors
Family Income Brackets in Scissors
According to the Scissors family income data, there are 169 families falling into the $25,000 to $34,999 income range, which is the most common income bracket and makes up 24.2% of all families.
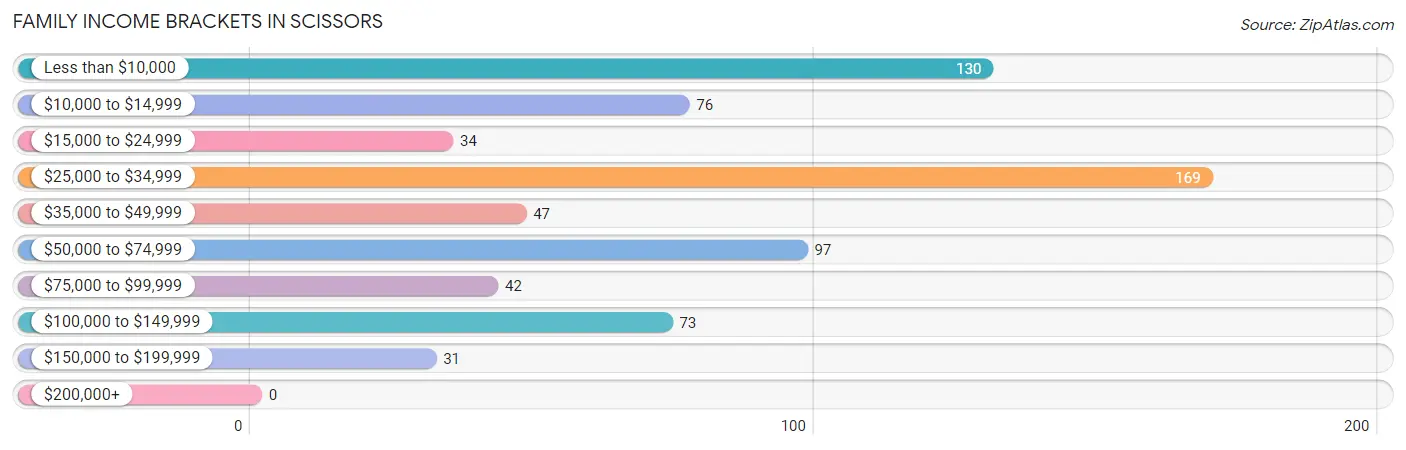
| Income Bracket | # Families | % Families |
| Less than $10,000 | 130 | 18.6% |
| $10,000 to $14,999 | 76 | 10.9% |
| $15,000 to $24,999 | 34 | 4.9% |
| $25,000 to $34,999 | 169 | 24.2% |
| $35,000 to $49,999 | 47 | 6.7% |
| $50,000 to $74,999 | 97 | 13.9% |
| $75,000 to $99,999 | 42 | 6.0% |
| $100,000 to $149,999 | 73 | 10.4% |
| $150,000 to $199,999 | 31 | 4.4% |
| $200,000+ | 0 | 0.0% |
Family Income by Famaliy Size in Scissors
5-person families (41 | 5.9%) account for the highest median family income in Scissors with $185,847 per family, while 5-person families (41 | 5.9%) have the highest median income of $37,169 per family member.
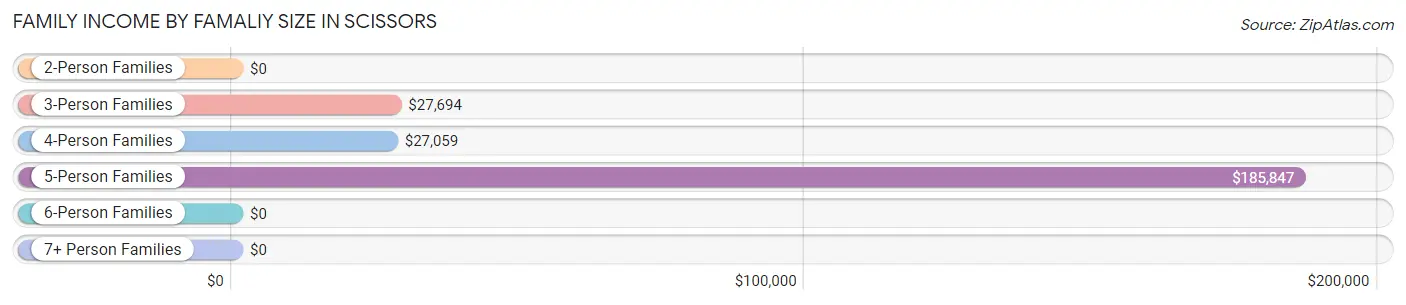
| Income Bracket | # Families | Median Income |
| 2-Person Families | 96 (13.7%) | $0 |
| 3-Person Families | 243 (34.8%) | $27,694 |
| 4-Person Families | 202 (28.9%) | $27,059 |
| 5-Person Families | 41 (5.9%) | $185,847 |
| 6-Person Families | 19 (2.7%) | $0 |
| 7+ Person Families | 98 (14.0%) | $0 |
| Total | 699 (100.0%) | $28,616 |
Family Income by Number of Earners in Scissors
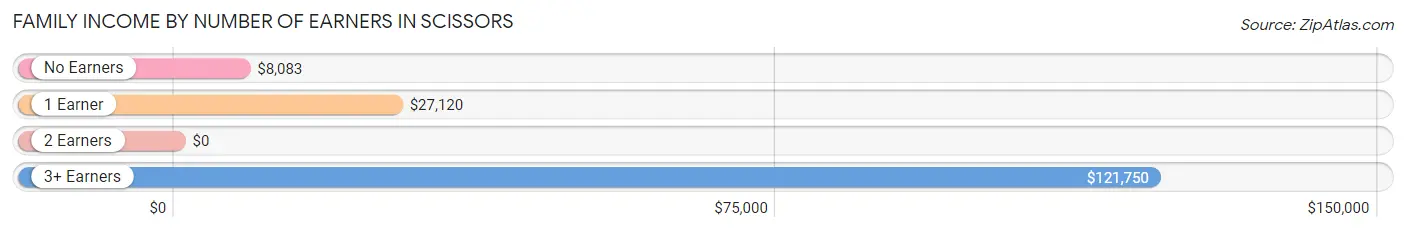
| Number of Earners | # Families | Median Income |
| No Earners | 153 (21.9%) | $8,083 |
| 1 Earner | 199 (28.5%) | $27,120 |
| 2 Earners | 179 (25.6%) | $0 |
| 3+ Earners | 168 (24.0%) | $121,750 |
| Total | 699 (100.0%) | $28,616 |
Household Income in Scissors
Household Income Brackets in Scissors
With 169 households falling in the category, the $25,000 to $34,999 income range is the most frequent in Scissors, accounting for 22.2% of all households. In contrast, only 27 households (3.5%) fall into the $200,000+ income bracket, making it the least populous group.
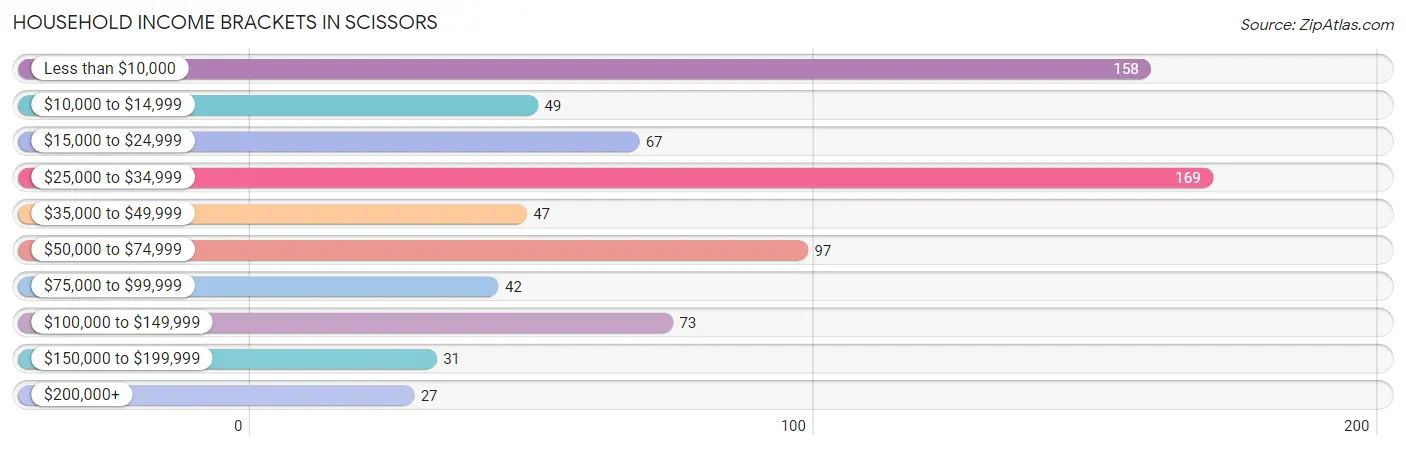
| Income Bracket | # Households | % Households |
| Less than $10,000 | 158 | 20.8% |
| $10,000 to $14,999 | 49 | 6.4% |
| $15,000 to $24,999 | 67 | 8.8% |
| $25,000 to $34,999 | 169 | 22.2% |
| $35,000 to $49,999 | 47 | 6.2% |
| $50,000 to $74,999 | 97 | 12.8% |
| $75,000 to $99,999 | 42 | 5.5% |
| $100,000 to $149,999 | 73 | 9.6% |
| $150,000 to $199,999 | 31 | 4.1% |
| $200,000+ | 27 | 3.6% |
Household Income by Householder Age in Scissors
The median household income in Scissors is $28,522, with the highest median household income of $28,443 found in the 25 to 44 years age bracket for the primary householder. A total of 187 households (24.6%) fall into this category. Meanwhile, the 15 to 24 years age bracket for the primary householder has the lowest median household income of $0, with 34 households (4.5%) in this group.
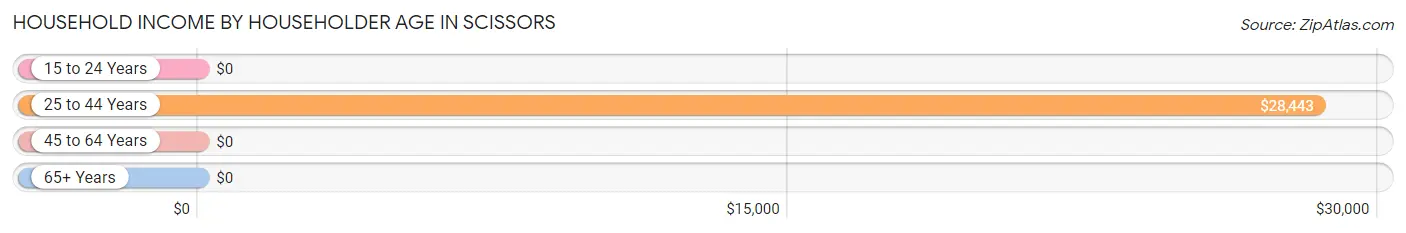
| Income Bracket | # Households | Median Income |
| 15 to 24 Years | 34 (4.5%) | $0 |
| 25 to 44 Years | 187 (24.6%) | $28,443 |
| 45 to 64 Years | 333 (43.8%) | $0 |
| 65+ Years | 206 (27.1%) | $0 |
| Total | 760 (100.0%) | $28,522 |
Poverty in Scissors
Income Below Poverty by Sex and Age in Scissors
With 37.8% poverty level for males and 36.1% for females among the residents of Scissors, 35 to 44 year old males and 15 year old females are the most vulnerable to poverty, with 92 males (69.2%) and 38 females (82.6%) in their respective age groups living below the poverty level.
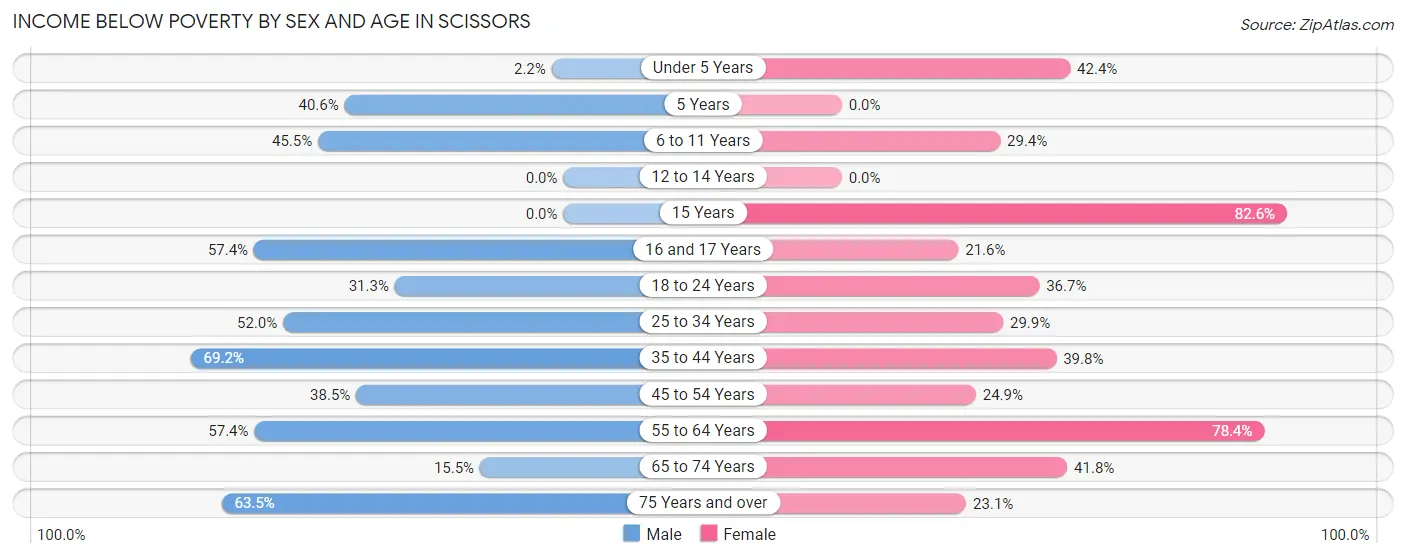
| Age Bracket | Male | Female |
| Under 5 Years | 6 (2.2%) | 103 (42.4%) |
| 5 Years | 13 (40.6%) | 0 (0.0%) |
| 6 to 11 Years | 102 (45.5%) | 52 (29.4%) |
| 12 to 14 Years | 0 (0.0%) | 0 (0.0%) |
| 15 Years | 0 (0.0%) | 38 (82.6%) |
| 16 and 17 Years | 85 (57.4%) | 8 (21.6%) |
| 18 to 24 Years | 77 (31.3%) | 70 (36.6%) |
| 25 to 34 Years | 90 (52.0%) | 85 (29.9%) |
| 35 to 44 Years | 92 (69.2%) | 80 (39.8%) |
| 45 to 54 Years | 130 (38.5%) | 53 (24.9%) |
| 55 to 64 Years | 78 (57.4%) | 40 (78.4%) |
| 65 to 74 Years | 13 (15.5%) | 64 (41.8%) |
| 75 Years and over | 66 (63.5%) | 12 (23.1%) |
| Total | 752 (37.8%) | 605 (36.1%) |
Income Above Poverty by Sex and Age in Scissors
According to the poverty statistics in Scissors, males aged 12 to 14 years and females aged 5 years are the age groups that are most secure financially, with 100.0% of males and 100.0% of females in these age groups living above the poverty line.
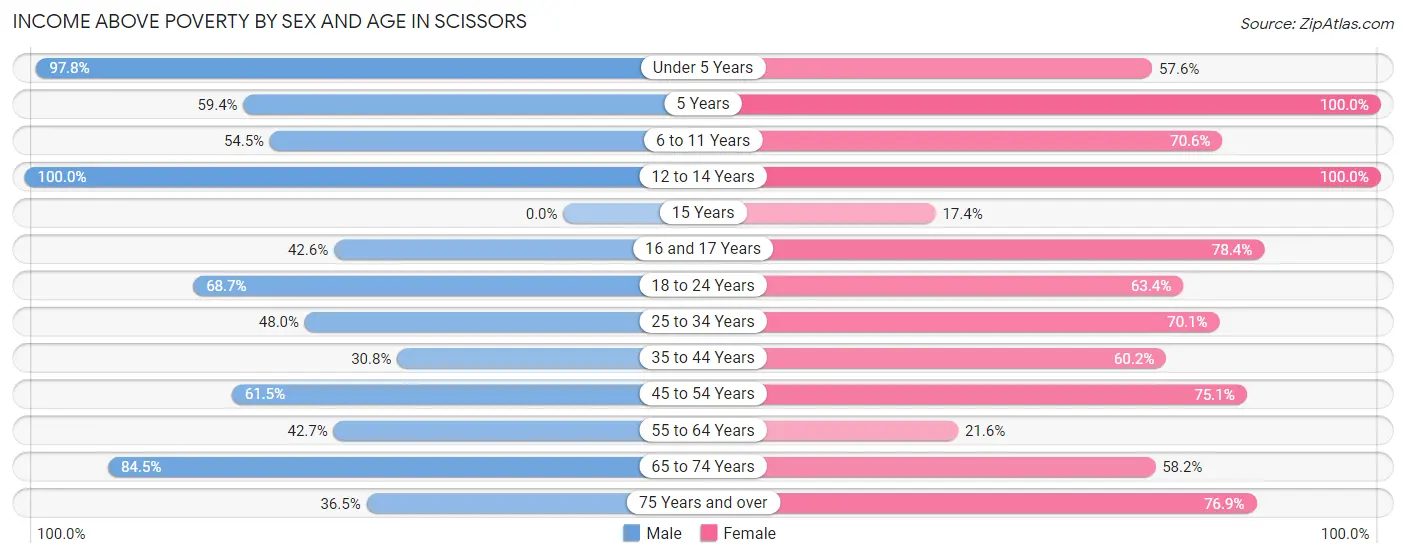
| Age Bracket | Male | Female |
| Under 5 Years | 269 (97.8%) | 140 (57.6%) |
| 5 Years | 19 (59.4%) | 20 (100.0%) |
| 6 to 11 Years | 122 (54.5%) | 125 (70.6%) |
| 12 to 14 Years | 97 (100.0%) | 9 (100.0%) |
| 15 Years | 0 (0.0%) | 8 (17.4%) |
| 16 and 17 Years | 63 (42.6%) | 29 (78.4%) |
| 18 to 24 Years | 169 (68.7%) | 121 (63.3%) |
| 25 to 34 Years | 83 (48.0%) | 199 (70.1%) |
| 35 to 44 Years | 41 (30.8%) | 121 (60.2%) |
| 45 to 54 Years | 208 (61.5%) | 160 (75.1%) |
| 55 to 64 Years | 58 (42.6%) | 11 (21.6%) |
| 65 to 74 Years | 71 (84.5%) | 89 (58.2%) |
| 75 Years and over | 38 (36.5%) | 40 (76.9%) |
| Total | 1,238 (62.2%) | 1,072 (63.9%) |
Income Below Poverty Among Married-Couple Families in Scissors
The poverty statistics for married-couple families in Scissors show that 57.6% or 238 of the total 413 families live below the poverty line. Families with 1 or 2 children have the highest poverty rate of 83.7%, comprising of 159 families. On the other hand, families with 5 or more children have the lowest poverty rate of 0.0%, which includes 0 families.
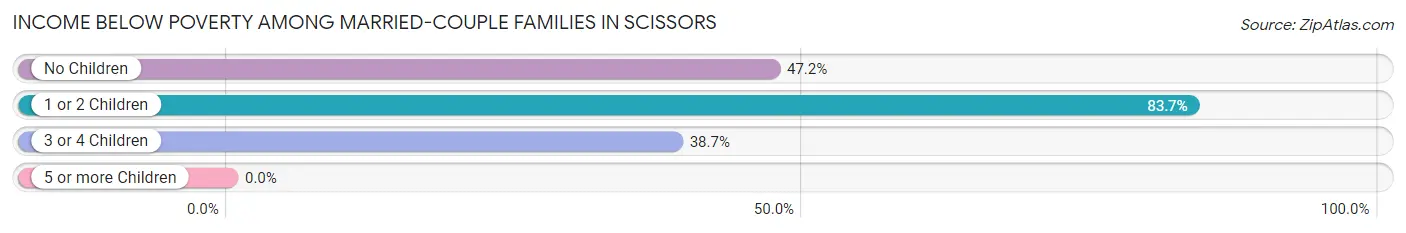
| Children | Above Poverty | Below Poverty |
| No Children | 75 (52.8%) | 67 (47.2%) |
| 1 or 2 Children | 31 (16.3%) | 159 (83.7%) |
| 3 or 4 Children | 19 (61.3%) | 12 (38.7%) |
| 5 or more Children | 50 (100.0%) | 0 (0.0%) |
| Total | 175 (42.4%) | 238 (57.6%) |
Income Below Poverty Among Single-Parent Households in Scissors
According to the poverty data in Scissors, 32.9% or 47 single-father households and 48.9% or 70 single-mother households are living below the poverty line. Among single-father households, those with no children have the highest poverty rate, with 47 households (55.3%) experiencing poverty. Likewise, among single-mother households, those with no children have the highest poverty rate, with 30 households (50.8%) falling below the poverty line.
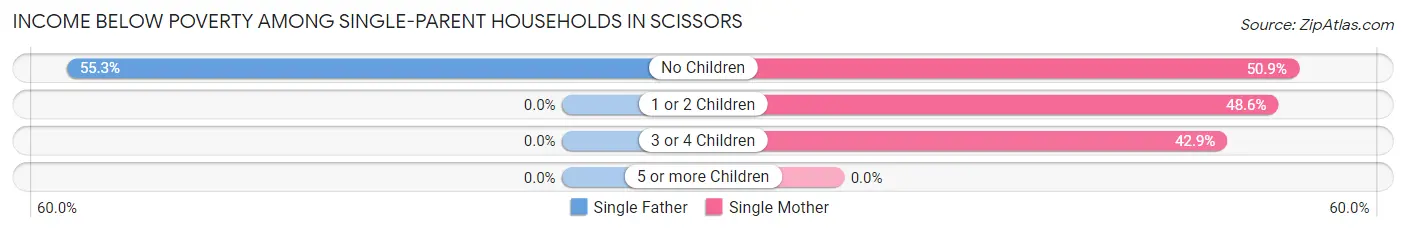
| Children | Single Father | Single Mother |
| No Children | 47 (55.3%) | 30 (50.8%) |
| 1 or 2 Children | 0 (0.0%) | 34 (48.6%) |
| 3 or 4 Children | 0 (0.0%) | 6 (42.9%) |
| 5 or more Children | 0 (0.0%) | 0 (0.0%) |
| Total | 47 (32.9%) | 70 (48.9%) |
Income Below Poverty Among Married-Couple vs Single-Parent Households in Scissors
The poverty data for Scissors shows that 238 of the married-couple family households (57.6%) and 117 of the single-parent households (40.9%) are living below the poverty level. Within the married-couple family households, those with 1 or 2 children have the highest poverty rate, with 159 households (83.7%) falling below the poverty line. Among the single-parent households, those with no children have the highest poverty rate, with 77 household (53.5%) living below poverty.
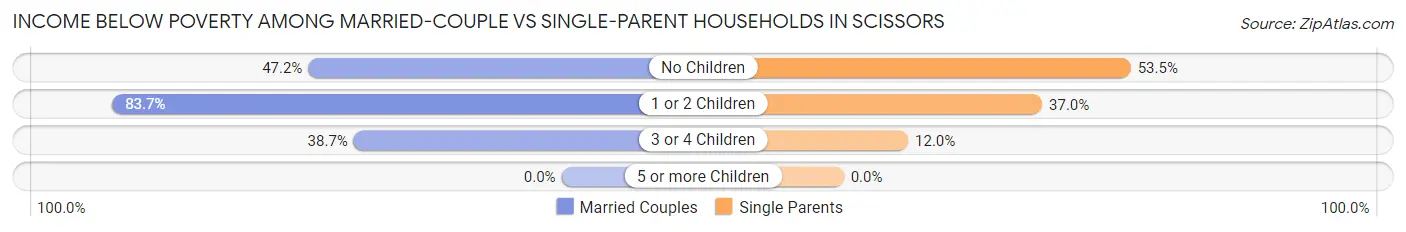
| Children | Married-Couple Families | Single-Parent Households |
| No Children | 67 (47.2%) | 77 (53.5%) |
| 1 or 2 Children | 159 (83.7%) | 34 (37.0%) |
| 3 or 4 Children | 12 (38.7%) | 6 (12.0%) |
| 5 or more Children | 0 (0.0%) | 0 (0.0%) |
| Total | 238 (57.6%) | 117 (40.9%) |
Race in Scissors
The most populous races in Scissors are Hispanic or Latino (3,661 | 99.8%), Two or more Races (1,864 | 50.8%), and White / Caucasian (1,149 | 31.3%).
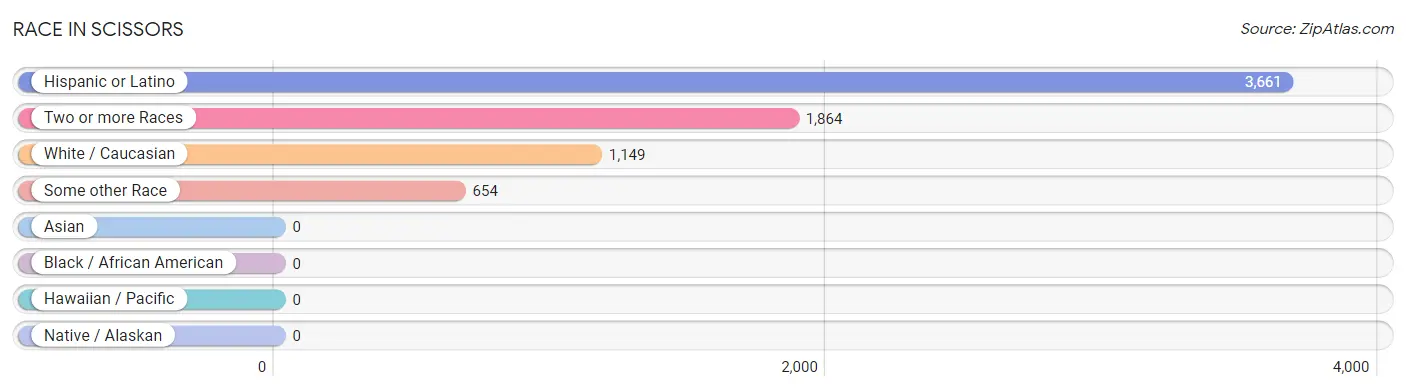
| Race | # Population | % Population |
| Asian | 0 | 0.0% |
| Black / African American | 0 | 0.0% |
| Hawaiian / Pacific | 0 | 0.0% |
| Hispanic or Latino | 3,661 | 99.8% |
| Native / Alaskan | 0 | 0.0% |
| White / Caucasian | 1,149 | 31.3% |
| Two or more Races | 1,864 | 50.8% |
| Some other Race | 654 | 17.8% |
| Total | 3,667 | 100.0% |
Ancestry in Scissors
The most populous ancestries reported in Scissors are Mexican (3,561 | 97.1%), American (88 | 2.4%), and Cuban (24 | 0.6%), together accounting for 100.2% of all Scissors residents.
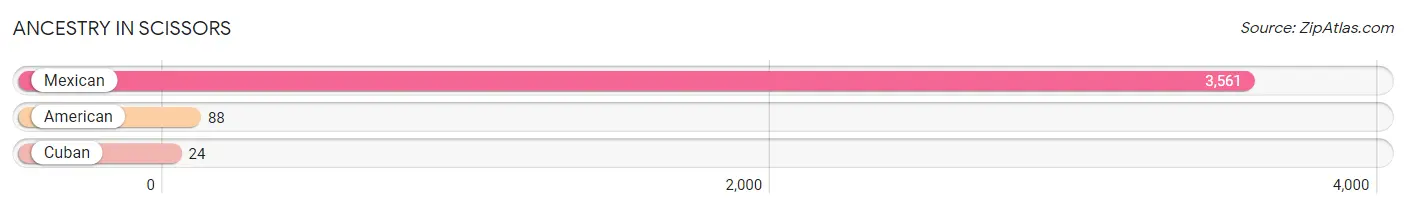
| Ancestry | # Population | % Population |
| American | 88 | 2.4% |
| Cuban | 24 | 0.6% |
| Mexican | 3,561 | 97.1% | View All 3 Rows |
Immigrants in Scissors
The most numerous immigrant groups reported in Scissors came from Latin America (1,156 | 31.5%), Central America (1,132 | 30.9%), Mexico (1,132 | 30.9%), Caribbean (24 | 0.6%), and Cuba (24 | 0.6%), together accounting for 94.6% of all Scissors residents.
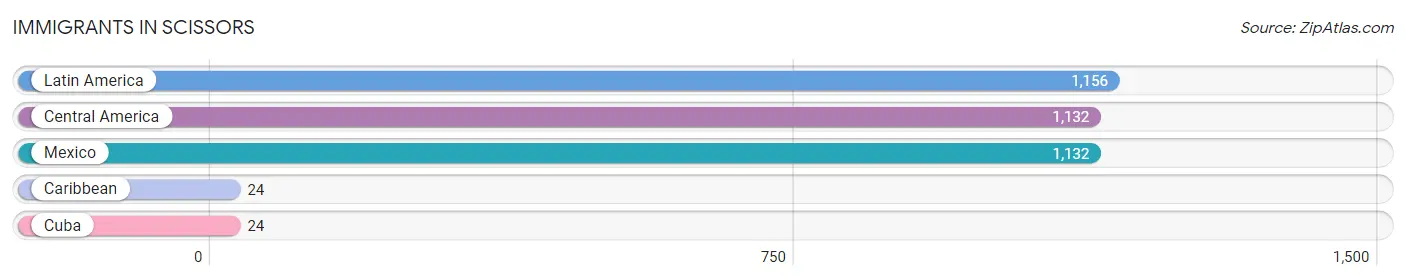
| Immigration Origin | # Population | % Population |
| Caribbean | 24 | 0.6% |
| Central America | 1,132 | 30.9% |
| Cuba | 24 | 0.6% |
| Latin America | 1,156 | 31.5% |
| Mexico | 1,132 | 30.9% | View All 5 Rows |
Sex and Age in Scissors
Sex and Age in Scissors
The most populous age groups in Scissors are Under 5 Years (275 | 13.8%) for men and Under 5 Years (243 | 14.5%) for women.
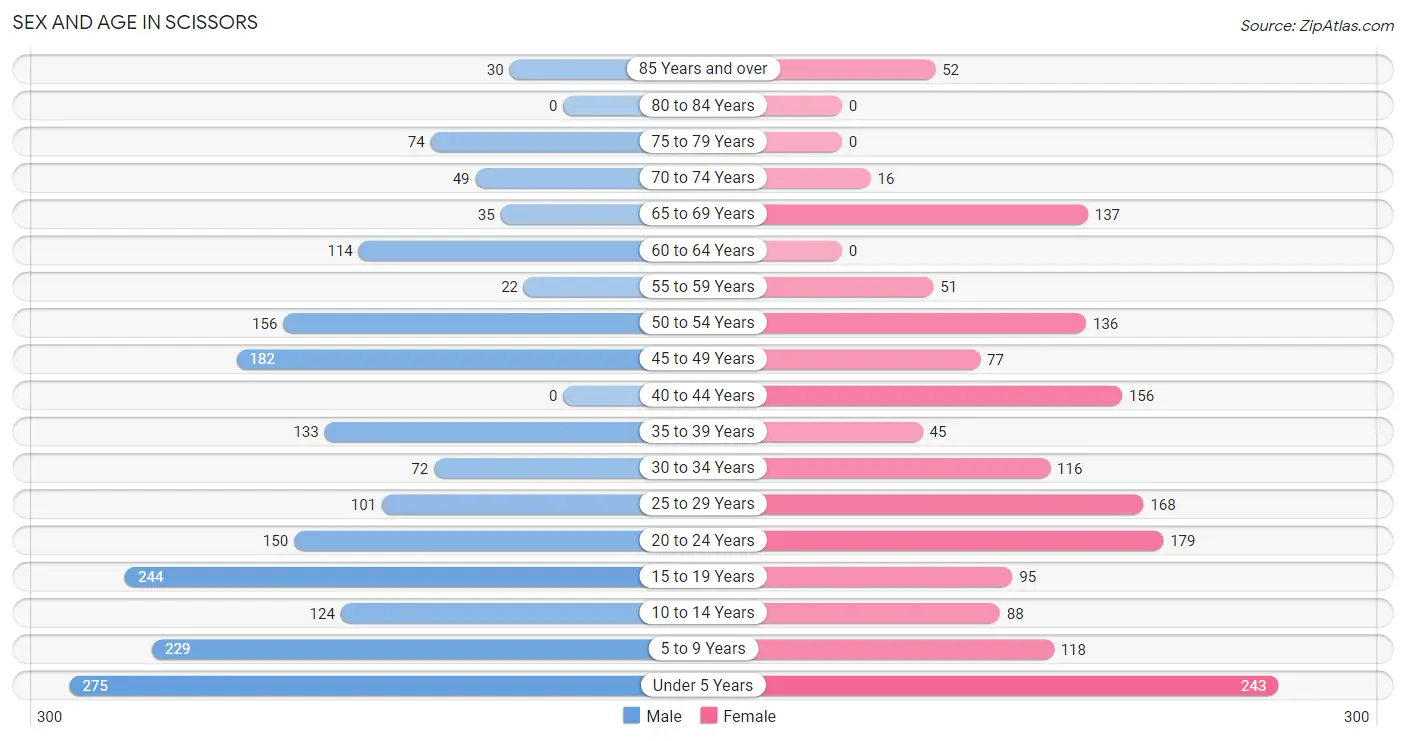
| Age Bracket | Male | Female |
| Under 5 Years | 275 (13.8%) | 243 (14.5%) |
| 5 to 9 Years | 229 (11.5%) | 118 (7.0%) |
| 10 to 14 Years | 124 (6.2%) | 88 (5.2%) |
| 15 to 19 Years | 244 (12.3%) | 95 (5.7%) |
| 20 to 24 Years | 150 (7.5%) | 179 (10.7%) |
| 25 to 29 Years | 101 (5.1%) | 168 (10.0%) |
| 30 to 34 Years | 72 (3.6%) | 116 (6.9%) |
| 35 to 39 Years | 133 (6.7%) | 45 (2.7%) |
| 40 to 44 Years | 0 (0.0%) | 156 (9.3%) |
| 45 to 49 Years | 182 (9.1%) | 77 (4.6%) |
| 50 to 54 Years | 156 (7.8%) | 136 (8.1%) |
| 55 to 59 Years | 22 (1.1%) | 51 (3.0%) |
| 60 to 64 Years | 114 (5.7%) | 0 (0.0%) |
| 65 to 69 Years | 35 (1.8%) | 137 (8.2%) |
| 70 to 74 Years | 49 (2.5%) | 16 (0.9%) |
| 75 to 79 Years | 74 (3.7%) | 0 (0.0%) |
| 80 to 84 Years | 0 (0.0%) | 0 (0.0%) |
| 85 Years and over | 30 (1.5%) | 52 (3.1%) |
| Total | 1,990 (100.0%) | 1,677 (100.0%) |
Families and Households in Scissors
Median Family Size in Scissors
The median family size in Scissors is 5.11 persons per family, with single male/father families (143 | 20.5%) accounting for the largest median family size of 5.77 persons per family. On the other hand, single female/mother families (143 | 20.5%) represent the smallest median family size with 3.40 persons per family.
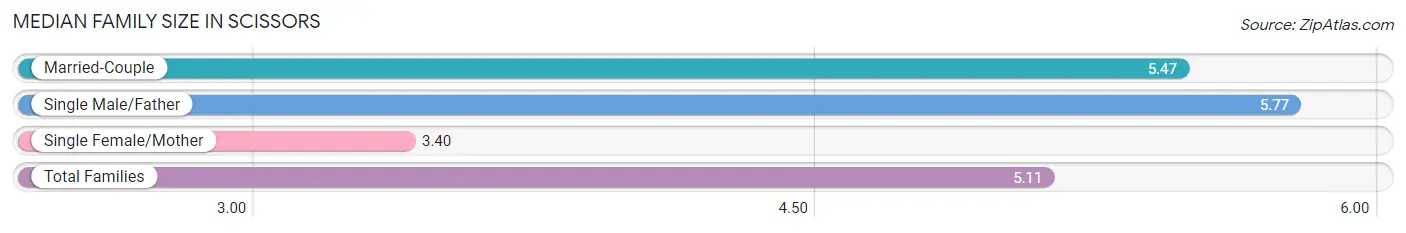
| Family Type | # Families | Family Size |
| Married-Couple | 413 (59.1%) | 5.47 |
| Single Male/Father | 143 (20.5%) | 5.77 |
| Single Female/Mother | 143 (20.5%) | 3.40 |
| Total Families | 699 (100.0%) | 5.11 |
Median Household Size in Scissors
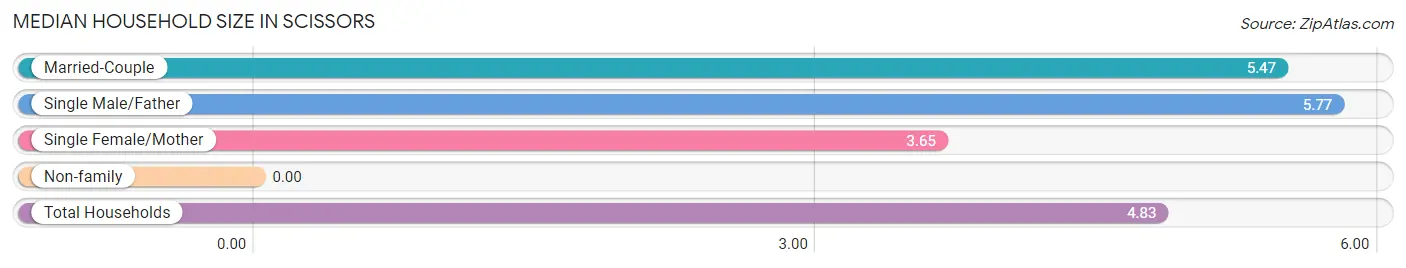
| Household Type | # Households | Household Size |
| Married-Couple | 413 (54.3%) | 5.47 |
| Single Male/Father | 143 (18.8%) | 5.77 |
| Single Female/Mother | 143 (18.8%) | 3.65 |
| Non-family | 61 (8.0%) | - |
| Total Households | 760 (100.0%) | 4.83 |
Household Size by Marriage Status in Scissors
Out of a total of 760 households in Scissors, 699 (92.0%) are family households, while 61 (8.0%) are nonfamily households. The most numerous type of family households are 4-person households, comprising 229, and the most common type of nonfamily households are 1-person households, comprising 61.
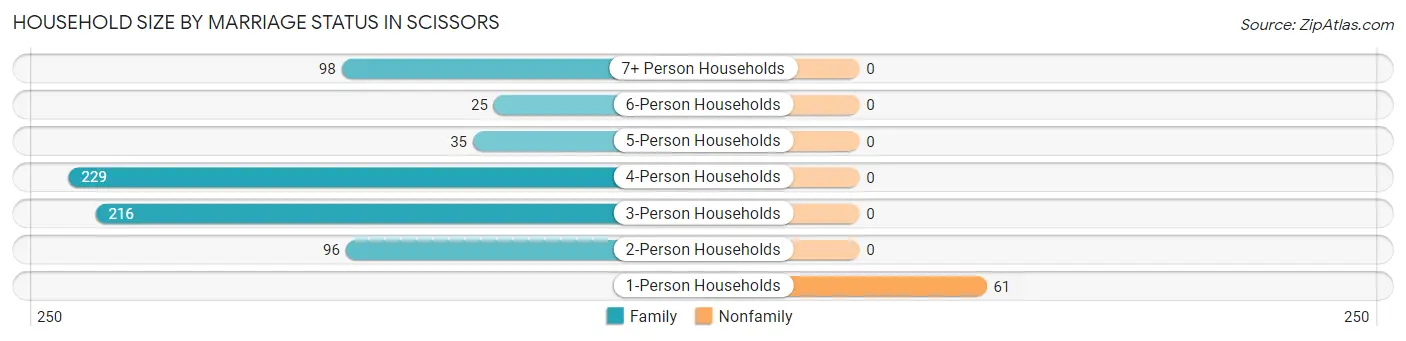
| Household Size | Family Households | Nonfamily Households |
| 1-Person Households | - | 61 (8.0%) |
| 2-Person Households | 96 (12.6%) | 0 (0.0%) |
| 3-Person Households | 216 (28.4%) | 0 (0.0%) |
| 4-Person Households | 229 (30.1%) | 0 (0.0%) |
| 5-Person Households | 35 (4.6%) | 0 (0.0%) |
| 6-Person Households | 25 (3.3%) | 0 (0.0%) |
| 7+ Person Households | 98 (12.9%) | 0 (0.0%) |
| Total | 699 (92.0%) | 61 (8.0%) |
Female Fertility in Scissors
Fertility by Age in Scissors
Average fertility rate in Scissors is 256.0 births per 1,000 women. Women in the age bracket of 20 to 34 years have the highest fertility rate with 484.0 births per 1,000 women. Women in the age bracket of 20 to 34 years acount for 100.0% of all women with births.
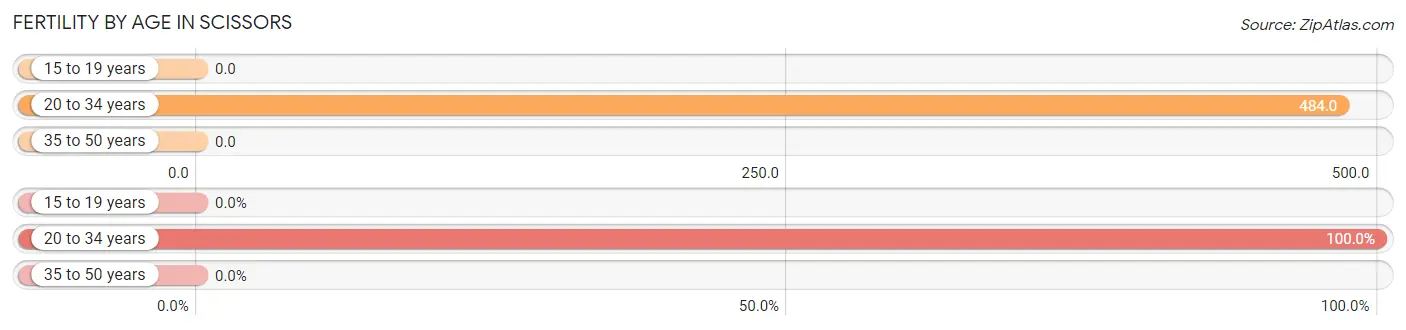
| Age Bracket | Women with Births | Births / 1,000 Women |
| 15 to 19 years | 0 (0.0%) | 0.0 |
| 20 to 34 years | 224 (100.0%) | 484.0 |
| 35 to 50 years | 0 (0.0%) | 0.0 |
| Total | 224 (100.0%) | 256.0 |
Fertility by Age by Marriage Status in Scissors
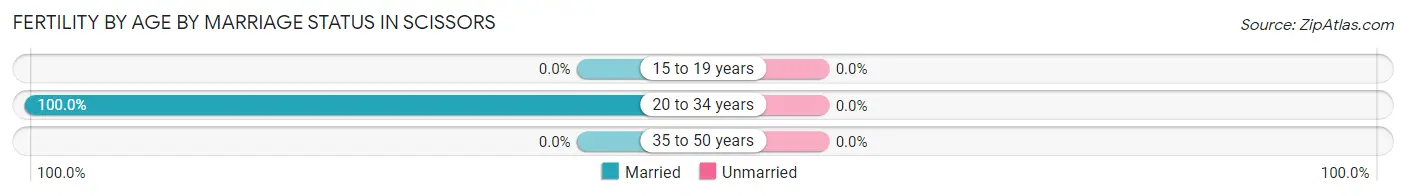
| Age Bracket | Married | Unmarried |
| 15 to 19 years | 0 (0.0%) | 0 (0.0%) |
| 20 to 34 years | 224 (100.0%) | 0 (0.0%) |
| 35 to 50 years | 0 (0.0%) | 0 (0.0%) |
| Total | 224 (100.0%) | 0 (0.0%) |
Fertility by Education in Scissors
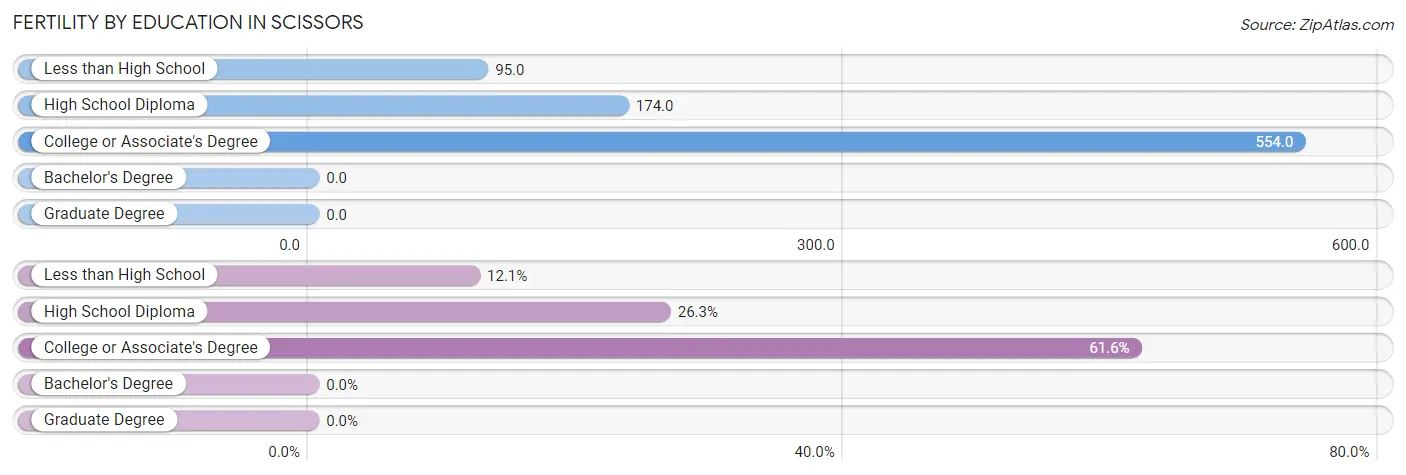
| Educational Attainment | Women with Births | Births / 1,000 Women |
| Less than High School | 27 (12.0%) | 95.0 |
| High School Diploma | 59 (26.3%) | 174.0 |
| College or Associate's Degree | 138 (61.6%) | 554.0 |
| Bachelor's Degree | 0 (0.0%) | 0.0 |
| Graduate Degree | 0 (0.0%) | 0.0 |
| Total | 224 (100.0%) | 256.0 |
Fertility by Education by Marriage Status in Scissors
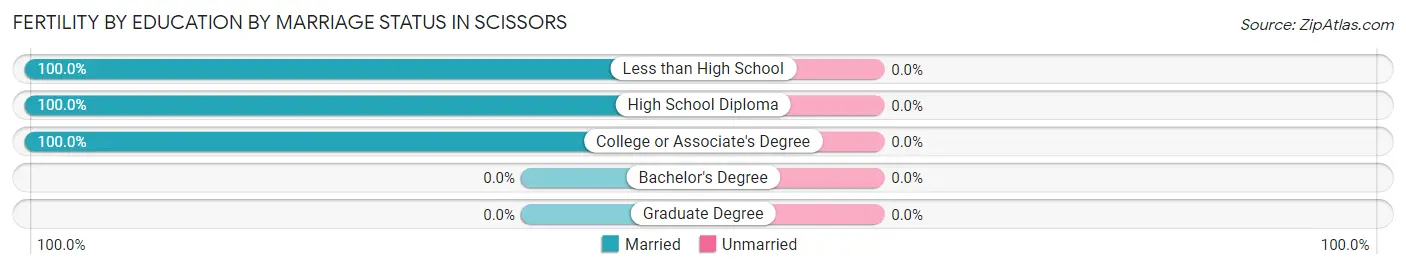
| Educational Attainment | Married | Unmarried |
| Less than High School | 27 (100.0%) | 0 (0.0%) |
| High School Diploma | 59 (100.0%) | 0 (0.0%) |
| College or Associate's Degree | 138 (100.0%) | 0 (0.0%) |
| Bachelor's Degree | 0 (0.0%) | 0 (0.0%) |
| Graduate Degree | 0 (0.0%) | 0 (0.0%) |
| Total | 224 (100.0%) | 0 (0.0%) |
Employment Characteristics in Scissors
Employment by Class of Employer in Scissors
Among the 1,416 employed individuals in Scissors, private company employees (855 | 60.4%), self-employed (not incorporated) (376 | 26.6%), and not-for-profit organizations (134 | 9.5%) make up the most common classes of employment.
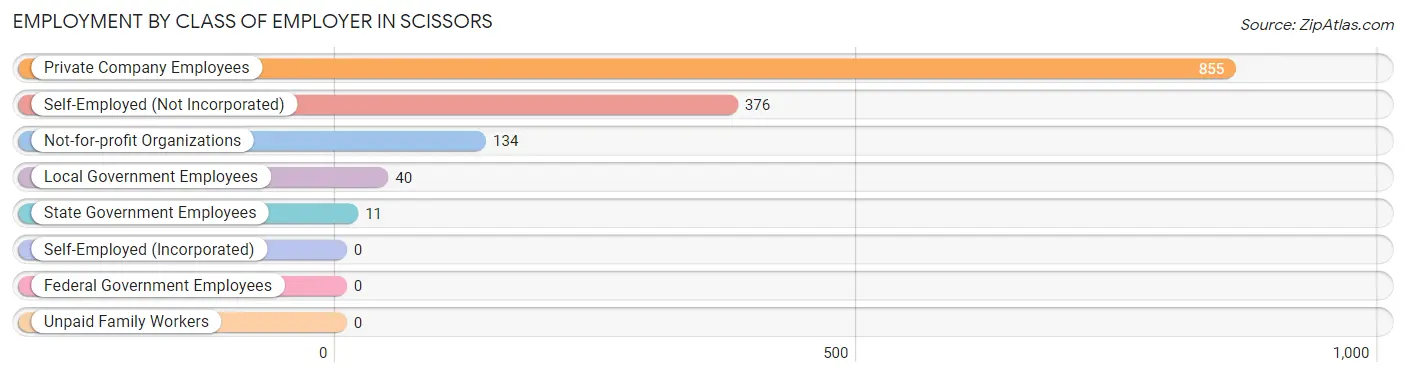
| Employer Class | # Employees | % Employees |
| Private Company Employees | 855 | 60.4% |
| Self-Employed (Incorporated) | 0 | 0.0% |
| Self-Employed (Not Incorporated) | 376 | 26.6% |
| Not-for-profit Organizations | 134 | 9.5% |
| Local Government Employees | 40 | 2.8% |
| State Government Employees | 11 | 0.8% |
| Federal Government Employees | 0 | 0.0% |
| Unpaid Family Workers | 0 | 0.0% |
| Total | 1,416 | 100.0% |
Employment Status by Age in Scissors
According to the labor force statistics for Scissors, out of the total population over 16 years of age (2,544), 59.1% or 1,504 individuals are in the labor force, with 3.4% or 51 of them unemployed. The age group with the highest labor force participation rate is 20 to 24 years, with 83.0% or 273 individuals in the labor force. Within the labor force, the 35 to 44 years age range has the highest percentage of unemployed individuals, with 18.4% or 40 of them being unemployed.
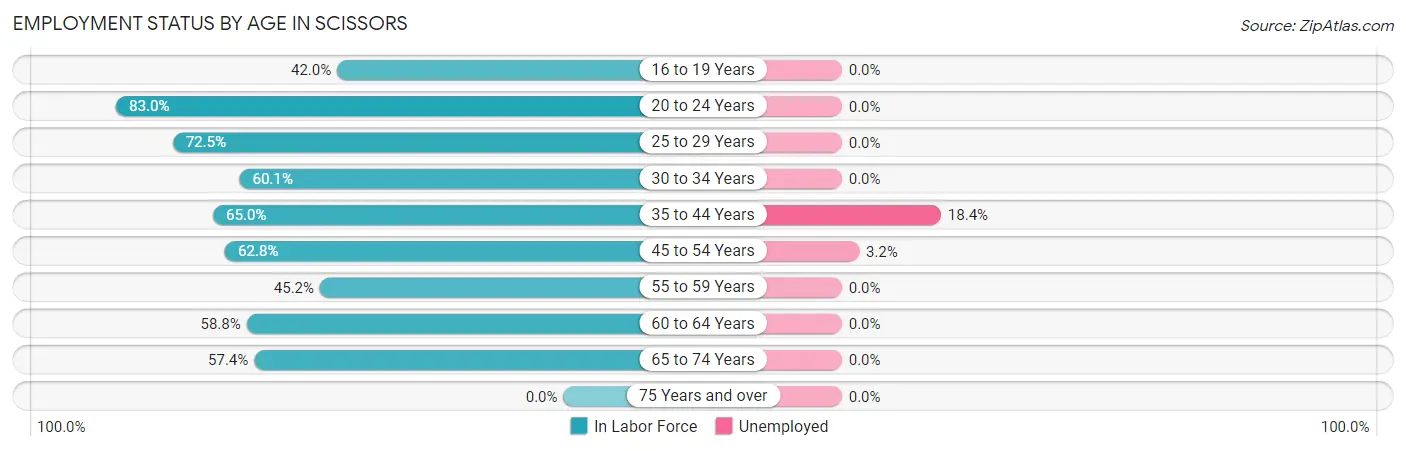
| Age Bracket | In Labor Force | Unemployed |
| 16 to 19 Years | 123 (42.0%) | 0 (0.0%) |
| 20 to 24 Years | 273 (83.0%) | 0 (0.0%) |
| 25 to 29 Years | 195 (72.5%) | 0 (0.0%) |
| 30 to 34 Years | 113 (60.1%) | 0 (0.0%) |
| 35 to 44 Years | 217 (65.0%) | 40 (18.4%) |
| 45 to 54 Years | 346 (62.8%) | 11 (3.2%) |
| 55 to 59 Years | 33 (45.2%) | 0 (0.0%) |
| 60 to 64 Years | 67 (58.8%) | 0 (0.0%) |
| 65 to 74 Years | 136 (57.4%) | 0 (0.0%) |
| 75 Years and over | 0 (0.0%) | 0 (0.0%) |
| Total | 1,504 (59.1%) | 51 (3.4%) |
Employment Status by Educational Attainment in Scissors
According to labor force statistics for Scissors, 63.5% of individuals (971) out of the total population between 25 and 64 years of age (1,529) are in the labor force, with 5.3% or 51 of them being unemployed. The group with the highest labor force participation rate are those with the educational attainment of bachelor's degree or higher, with 100.0% or 47 individuals in the labor force. Within the labor force, individuals with college / associate degree education have the highest percentage of unemployment, with 12.5% or 11 of them being unemployed.
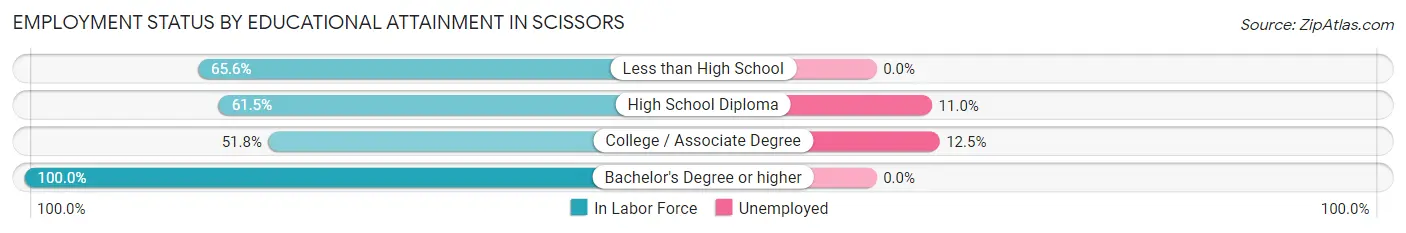
| Educational Attainment | In Labor Force | Unemployed |
| Less than High School | 472 (65.6%) | 0 (0.0%) |
| High School Diploma | 364 (61.5%) | 65 (11.0%) |
| College / Associate Degree | 88 (51.8%) | 21 (12.5%) |
| Bachelor's Degree or higher | 47 (100.0%) | 0 (0.0%) |
| Total | 971 (63.5%) | 81 (5.3%) |
Employment Occupations by Sex in Scissors
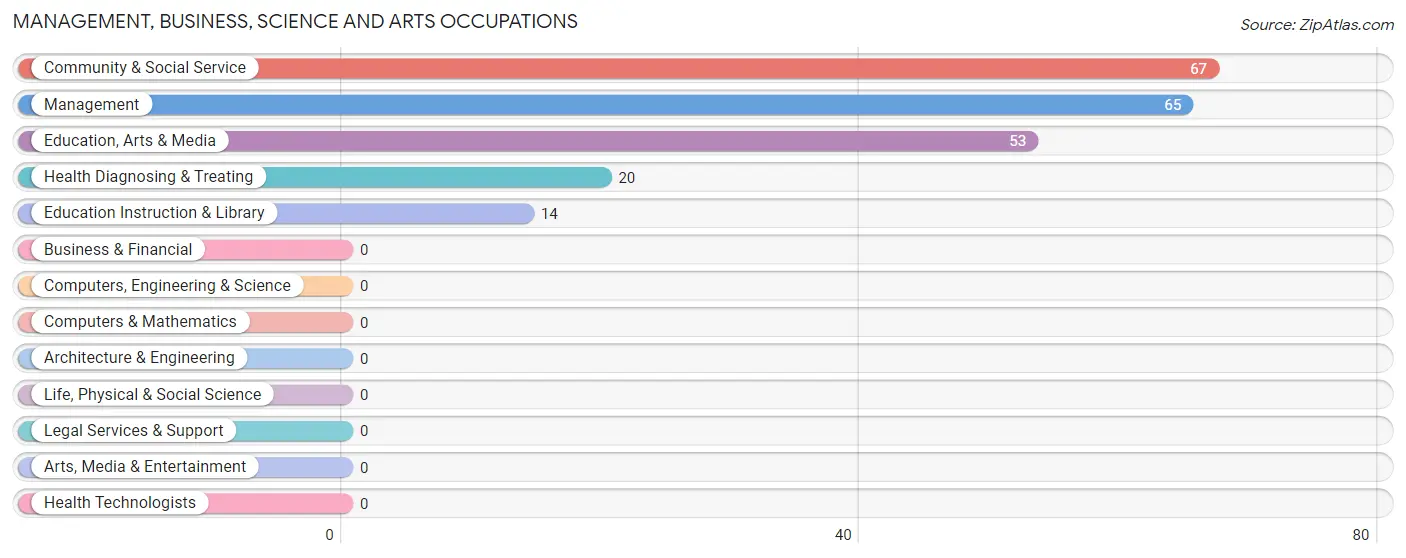
Management, Business, Science and Arts Occupations
The most common Management, Business, Science and Arts occupations in Scissors are Community & Social Service (67 | 4.6%), Management (65 | 4.5%), Education, Arts & Media (53 | 3.6%), Health Diagnosing & Treating (20 | 1.4%), and Education Instruction & Library (14 | 1.0%).
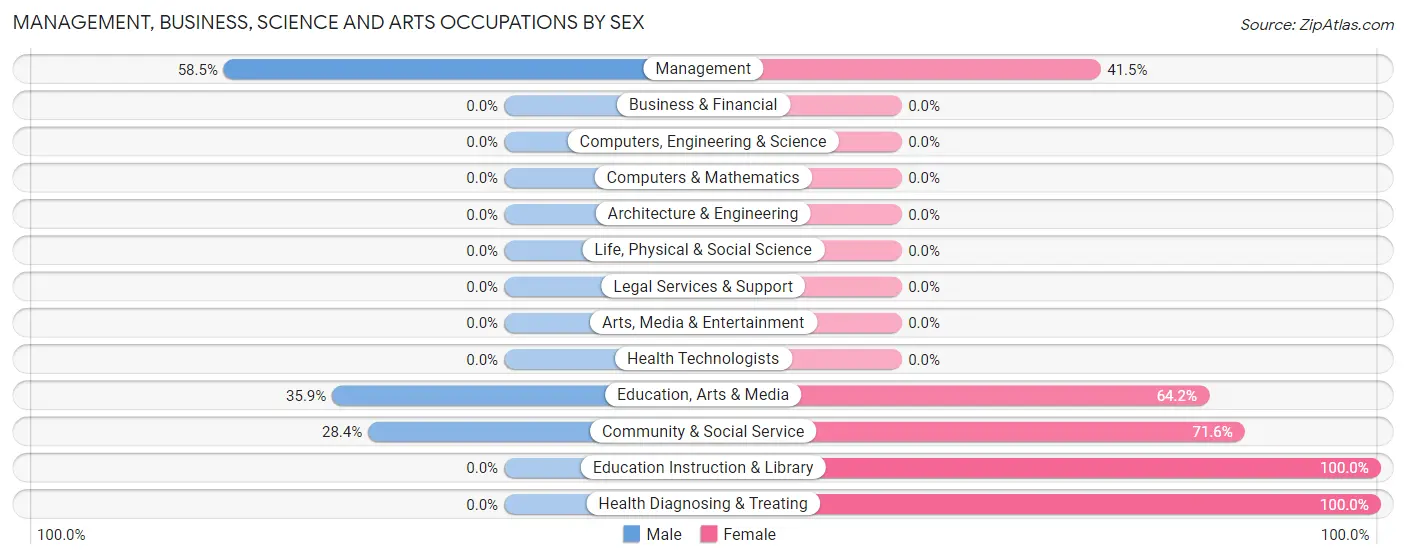
Management, Business, Science and Arts Occupations by Sex
Within the Management, Business, Science and Arts occupations in Scissors, the most male-oriented occupations are Management (58.5%), Education, Arts & Media (35.8%), and Community & Social Service (28.4%), while the most female-oriented occupations are Education Instruction & Library (100.0%), Health Diagnosing & Treating (100.0%), and Community & Social Service (71.6%).
| Occupation | Male | Female |
| Management | 38 (58.5%) | 27 (41.5%) |
| Business & Financial | 0 (0.0%) | 0 (0.0%) |
| Computers, Engineering & Science | 0 (0.0%) | 0 (0.0%) |
| Computers & Mathematics | 0 (0.0%) | 0 (0.0%) |
| Architecture & Engineering | 0 (0.0%) | 0 (0.0%) |
| Life, Physical & Social Science | 0 (0.0%) | 0 (0.0%) |
| Community & Social Service | 19 (28.4%) | 48 (71.6%) |
| Education, Arts & Media | 19 (35.8%) | 34 (64.1%) |
| Legal Services & Support | 0 (0.0%) | 0 (0.0%) |
| Education Instruction & Library | 0 (0.0%) | 14 (100.0%) |
| Arts, Media & Entertainment | 0 (0.0%) | 0 (0.0%) |
| Health Diagnosing & Treating | 0 (0.0%) | 20 (100.0%) |
| Health Technologists | 0 (0.0%) | 0 (0.0%) |
| Total (Category) | 57 (37.5%) | 95 (62.5%) |
| Total (Overall) | 905 (62.3%) | 547 (37.7%) |
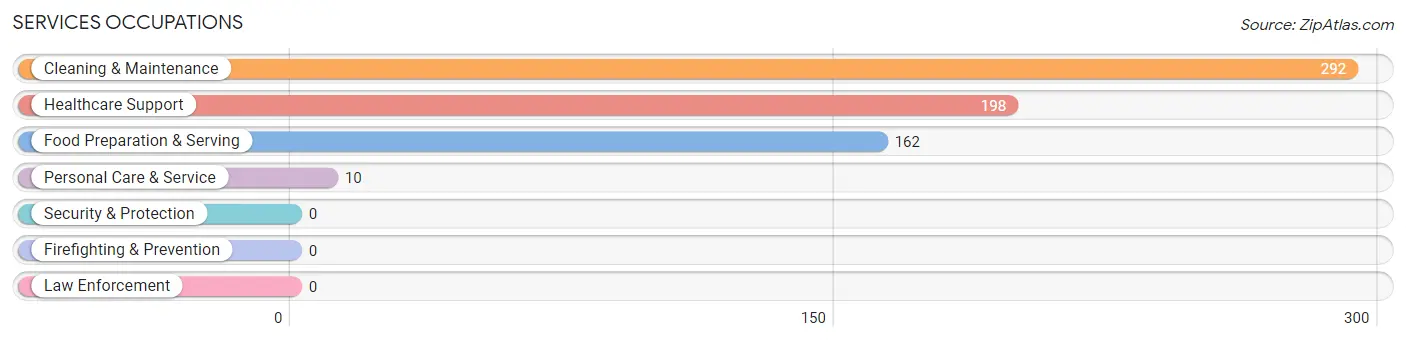
Services Occupations
The most common Services occupations in Scissors are Cleaning & Maintenance (292 | 20.1%), Healthcare Support (198 | 13.6%), Food Preparation & Serving (162 | 11.2%), and Personal Care & Service (10 | 0.7%).
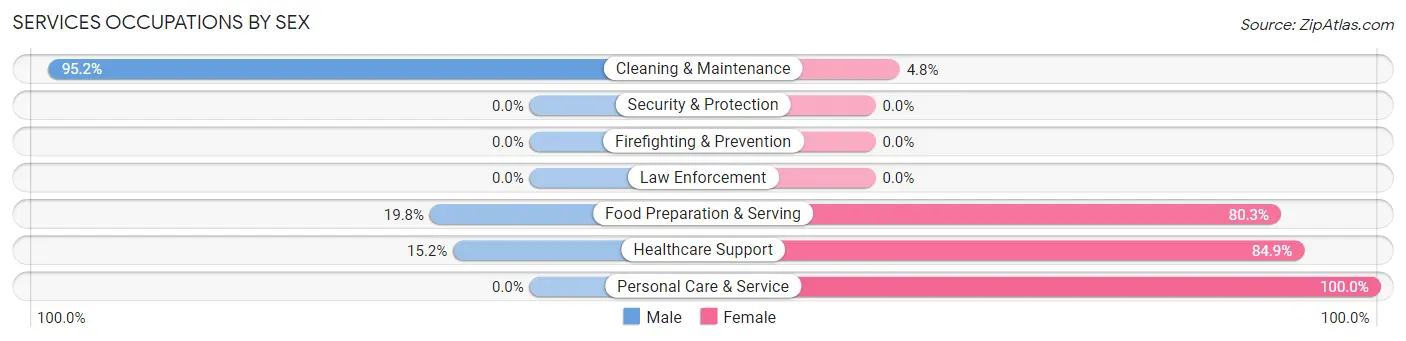
Services Occupations by Sex
Within the Services occupations in Scissors, the most male-oriented occupations are Cleaning & Maintenance (95.2%), Food Preparation & Serving (19.8%), and Healthcare Support (15.1%), while the most female-oriented occupations are Personal Care & Service (100.0%), Healthcare Support (84.9%), and Food Preparation & Serving (80.2%).
| Occupation | Male | Female |
| Healthcare Support | 30 (15.1%) | 168 (84.9%) |
| Security & Protection | 0 (0.0%) | 0 (0.0%) |
| Firefighting & Prevention | 0 (0.0%) | 0 (0.0%) |
| Law Enforcement | 0 (0.0%) | 0 (0.0%) |
| Food Preparation & Serving | 32 (19.8%) | 130 (80.2%) |
| Cleaning & Maintenance | 278 (95.2%) | 14 (4.8%) |
| Personal Care & Service | 0 (0.0%) | 10 (100.0%) |
| Total (Category) | 340 (51.4%) | 322 (48.6%) |
| Total (Overall) | 905 (62.3%) | 547 (37.7%) |
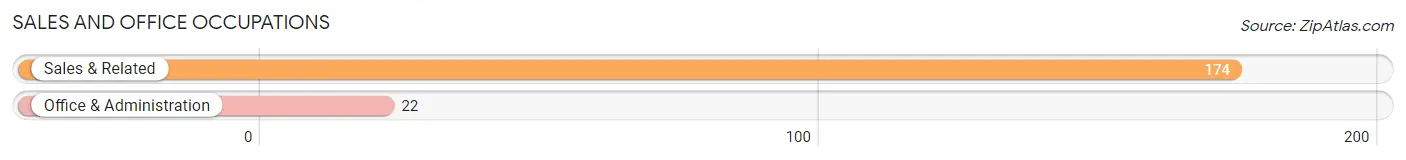
Sales and Office Occupations
The most common Sales and Office occupations in Scissors are Sales & Related (174 | 12.0%), and Office & Administration (22 | 1.5%).
Sales and Office Occupations by Sex
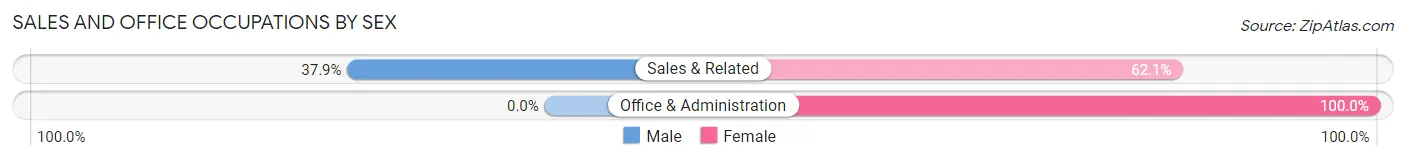
| Occupation | Male | Female |
| Sales & Related | 66 (37.9%) | 108 (62.1%) |
| Office & Administration | 0 (0.0%) | 22 (100.0%) |
| Total (Category) | 66 (33.7%) | 130 (66.3%) |
| Total (Overall) | 905 (62.3%) | 547 (37.7%) |
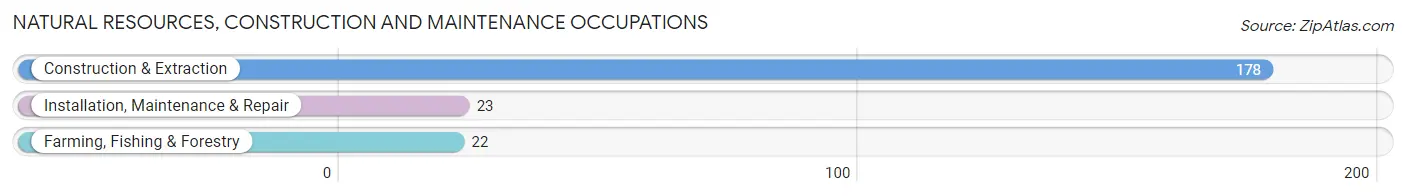
Natural Resources, Construction and Maintenance Occupations
The most common Natural Resources, Construction and Maintenance occupations in Scissors are Construction & Extraction (178 | 12.3%), Installation, Maintenance & Repair (23 | 1.6%), and Farming, Fishing & Forestry (22 | 1.5%).
Natural Resources, Construction and Maintenance Occupations by Sex
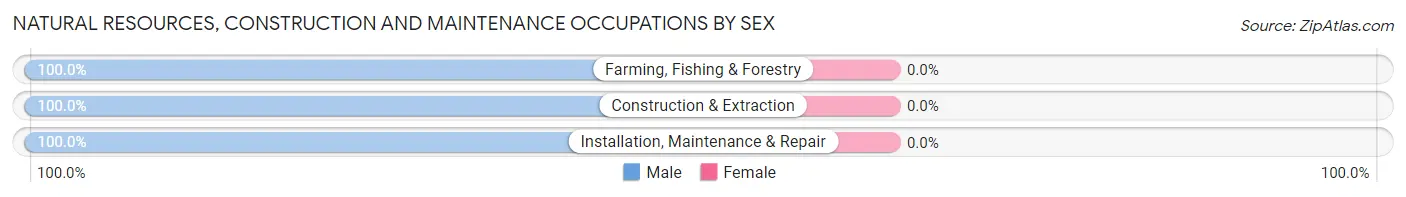
| Occupation | Male | Female |
| Farming, Fishing & Forestry | 22 (100.0%) | 0 (0.0%) |
| Construction & Extraction | 178 (100.0%) | 0 (0.0%) |
| Installation, Maintenance & Repair | 23 (100.0%) | 0 (0.0%) |
| Total (Category) | 223 (100.0%) | 0 (0.0%) |
| Total (Overall) | 905 (62.3%) | 547 (37.7%) |
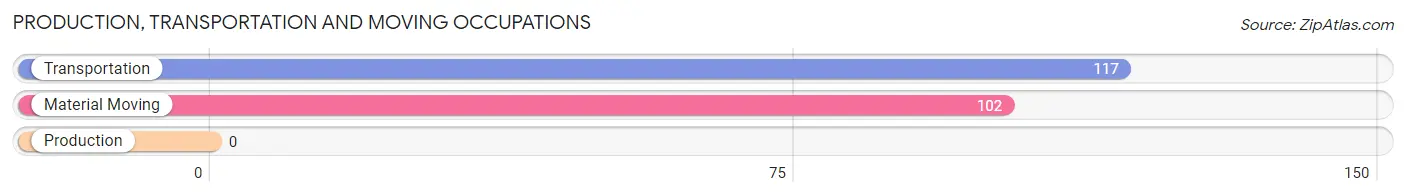
Production, Transportation and Moving Occupations
The most common Production, Transportation and Moving occupations in Scissors are Transportation (117 | 8.1%), and Material Moving (102 | 7.0%).
Production, Transportation and Moving Occupations by Sex
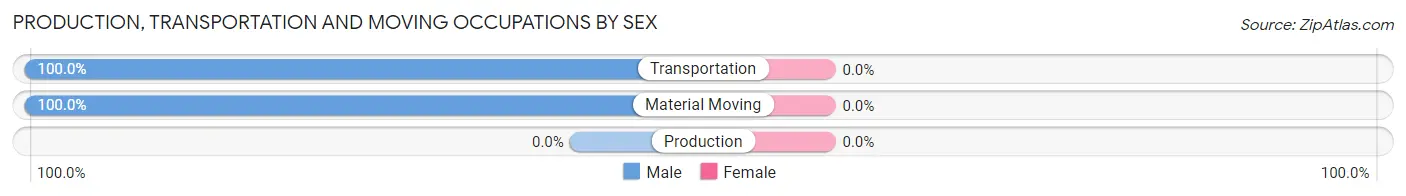
| Occupation | Male | Female |
| Production | 0 (0.0%) | 0 (0.0%) |
| Transportation | 117 (100.0%) | 0 (0.0%) |
| Material Moving | 102 (100.0%) | 0 (0.0%) |
| Total (Category) | 219 (100.0%) | 0 (0.0%) |
| Total (Overall) | 905 (62.3%) | 547 (37.7%) |
Employment Industries by Sex in Scissors
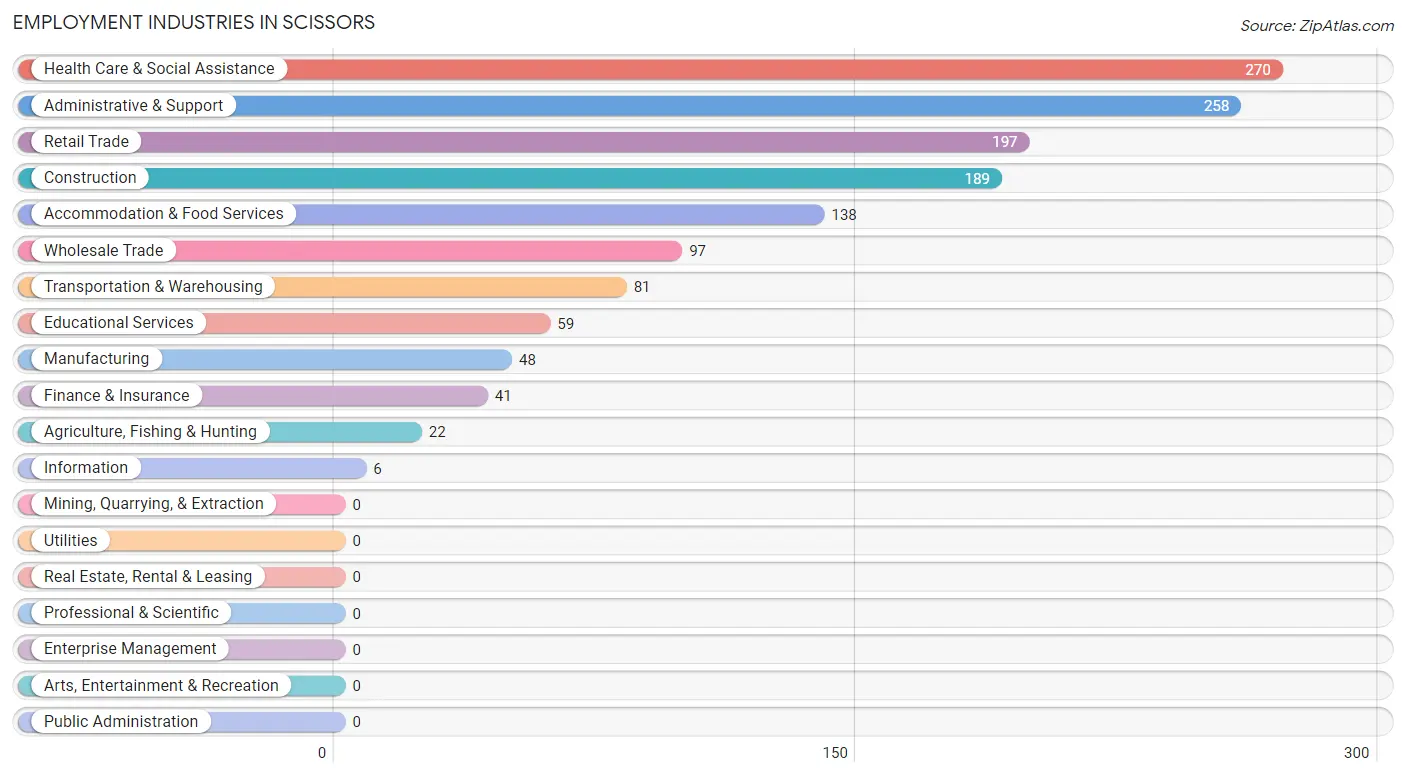
Employment Industries in Scissors
The major employment industries in Scissors include Health Care & Social Assistance (270 | 18.6%), Administrative & Support (258 | 17.8%), Retail Trade (197 | 13.6%), Construction (189 | 13.0%), and Accommodation & Food Services (138 | 9.5%).
Employment Industries by Sex in Scissors
The Scissors industries that see more men than women are Agriculture, Fishing & Hunting (100.0%), Construction (100.0%), and Manufacturing (100.0%), whereas the industries that tend to have a higher number of women are Information (100.0%), Finance & Insurance (100.0%), and Educational Services (81.4%).
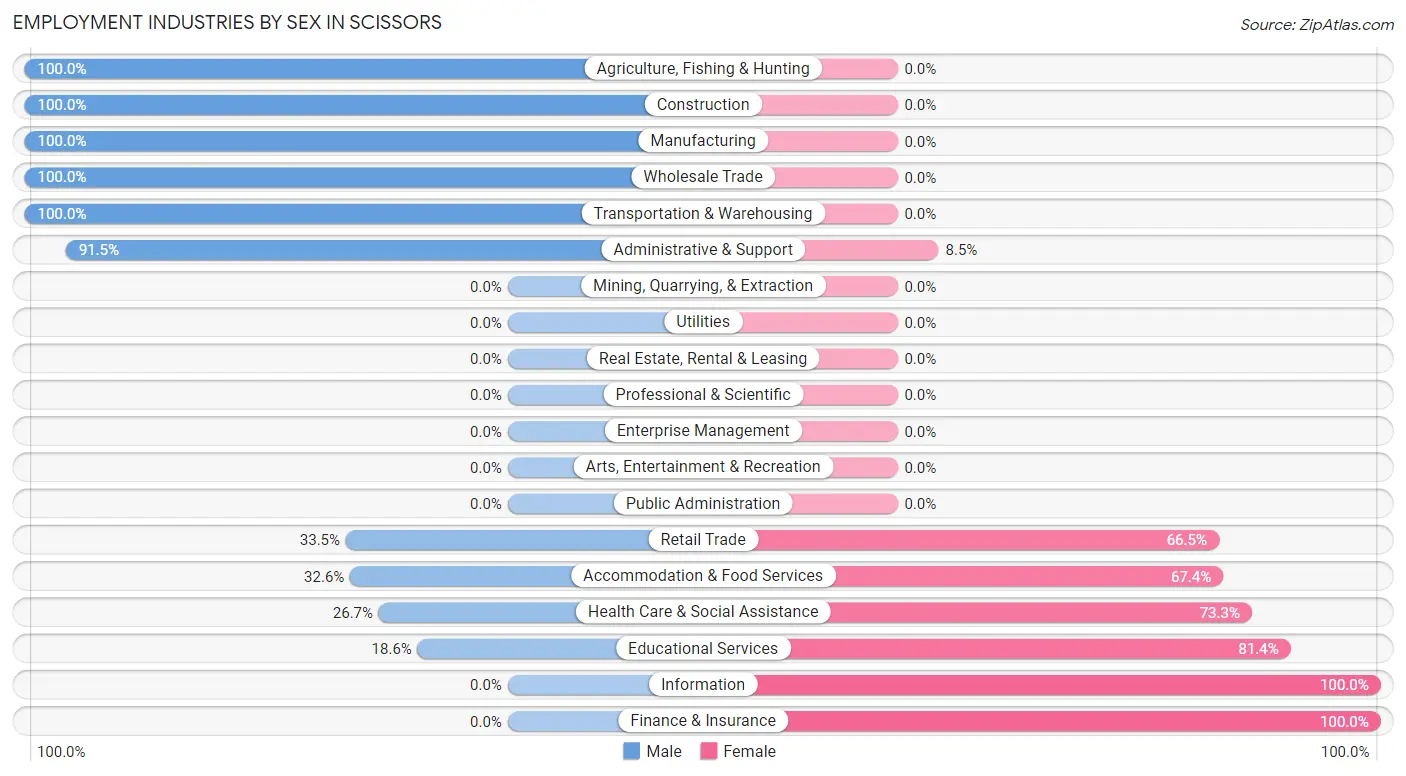
| Industry | Male | Female |
| Agriculture, Fishing & Hunting | 22 (100.0%) | 0 (0.0%) |
| Mining, Quarrying, & Extraction | 0 (0.0%) | 0 (0.0%) |
| Construction | 189 (100.0%) | 0 (0.0%) |
| Manufacturing | 48 (100.0%) | 0 (0.0%) |
| Wholesale Trade | 97 (100.0%) | 0 (0.0%) |
| Retail Trade | 66 (33.5%) | 131 (66.5%) |
| Transportation & Warehousing | 81 (100.0%) | 0 (0.0%) |
| Utilities | 0 (0.0%) | 0 (0.0%) |
| Information | 0 (0.0%) | 6 (100.0%) |
| Finance & Insurance | 0 (0.0%) | 41 (100.0%) |
| Real Estate, Rental & Leasing | 0 (0.0%) | 0 (0.0%) |
| Professional & Scientific | 0 (0.0%) | 0 (0.0%) |
| Enterprise Management | 0 (0.0%) | 0 (0.0%) |
| Administrative & Support | 236 (91.5%) | 22 (8.5%) |
| Educational Services | 11 (18.6%) | 48 (81.4%) |
| Health Care & Social Assistance | 72 (26.7%) | 198 (73.3%) |
| Arts, Entertainment & Recreation | 0 (0.0%) | 0 (0.0%) |
| Accommodation & Food Services | 45 (32.6%) | 93 (67.4%) |
| Public Administration | 0 (0.0%) | 0 (0.0%) |
| Total | 905 (62.3%) | 547 (37.7%) |
Education in Scissors
School Enrollment in Scissors
The most common levels of schooling among the 933 students in Scissors are elementary school (295 | 31.6%), high school (291 | 31.2%), and middle school (169 | 18.1%).
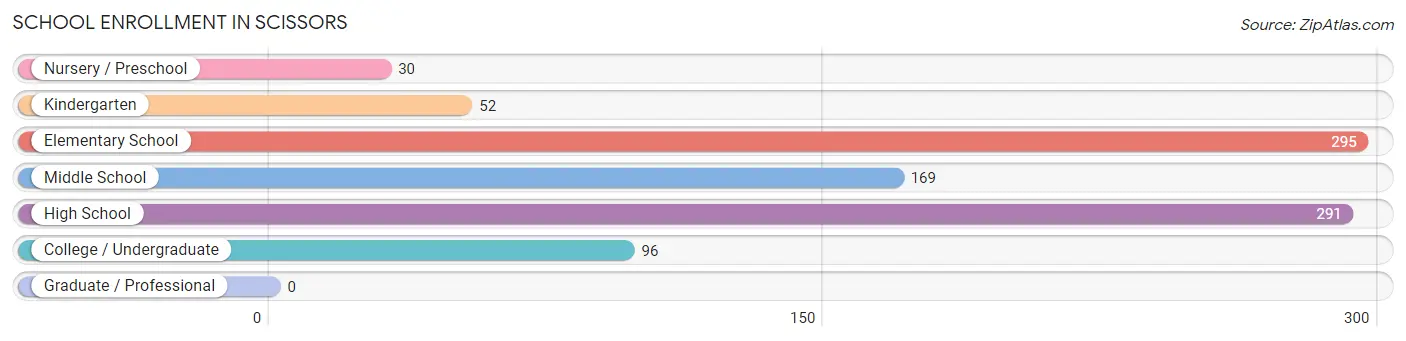
| School Level | # Students | % Students |
| Nursery / Preschool | 30 | 3.2% |
| Kindergarten | 52 | 5.6% |
| Elementary School | 295 | 31.6% |
| Middle School | 169 | 18.1% |
| High School | 291 | 31.2% |
| College / Undergraduate | 96 | 10.3% |
| Graduate / Professional | 0 | 0.0% |
| Total | 933 | 100.0% |
School Enrollment by Age by Funding Source in Scissors
Out of a total of 933 students who are enrolled in schools in Scissors, 47 (5.0%) attend a private institution, while the remaining 886 (95.0%) are enrolled in public schools. The age group of 20 to 24 year olds has the highest likelihood of being enrolled in private schools, with 35 (87.5% in the age bracket) enrolled. Conversely, the age group of 3 to 4 year olds has the lowest likelihood of being enrolled in a private school, with 30 (100.0% in the age bracket) attending a public institution.
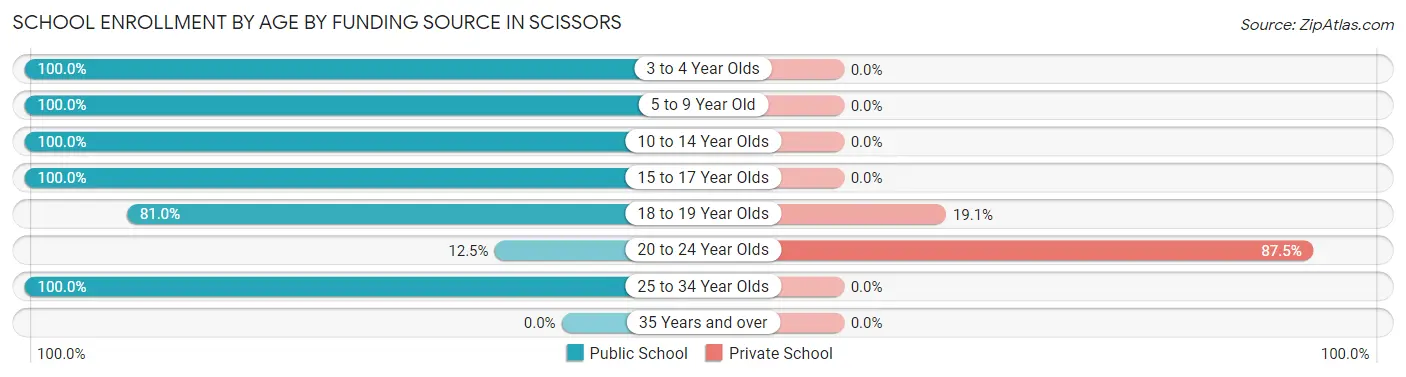
| Age Bracket | Public School | Private School |
| 3 to 4 Year Olds | 30 (100.0%) | 0 (0.0%) |
| 5 to 9 Year Old | 347 (100.0%) | 0 (0.0%) |
| 10 to 14 Year Olds | 178 (100.0%) | 0 (0.0%) |
| 15 to 17 Year Olds | 231 (100.0%) | 0 (0.0%) |
| 18 to 19 Year Olds | 51 (80.9%) | 12 (19.1%) |
| 20 to 24 Year Olds | 5 (12.5%) | 35 (87.5%) |
| 25 to 34 Year Olds | 44 (100.0%) | 0 (0.0%) |
| 35 Years and over | 0 (0.0%) | 0 (0.0%) |
| Total | 886 (95.0%) | 47 (5.0%) |
Educational Attainment by Field of Study in Scissors
Education (31 | 66.0%), business (11 | 23.4%), and visual & performing arts (5 | 10.6%) are the most common fields of study among 47 individuals in Scissors who have obtained a bachelor's degree or higher.
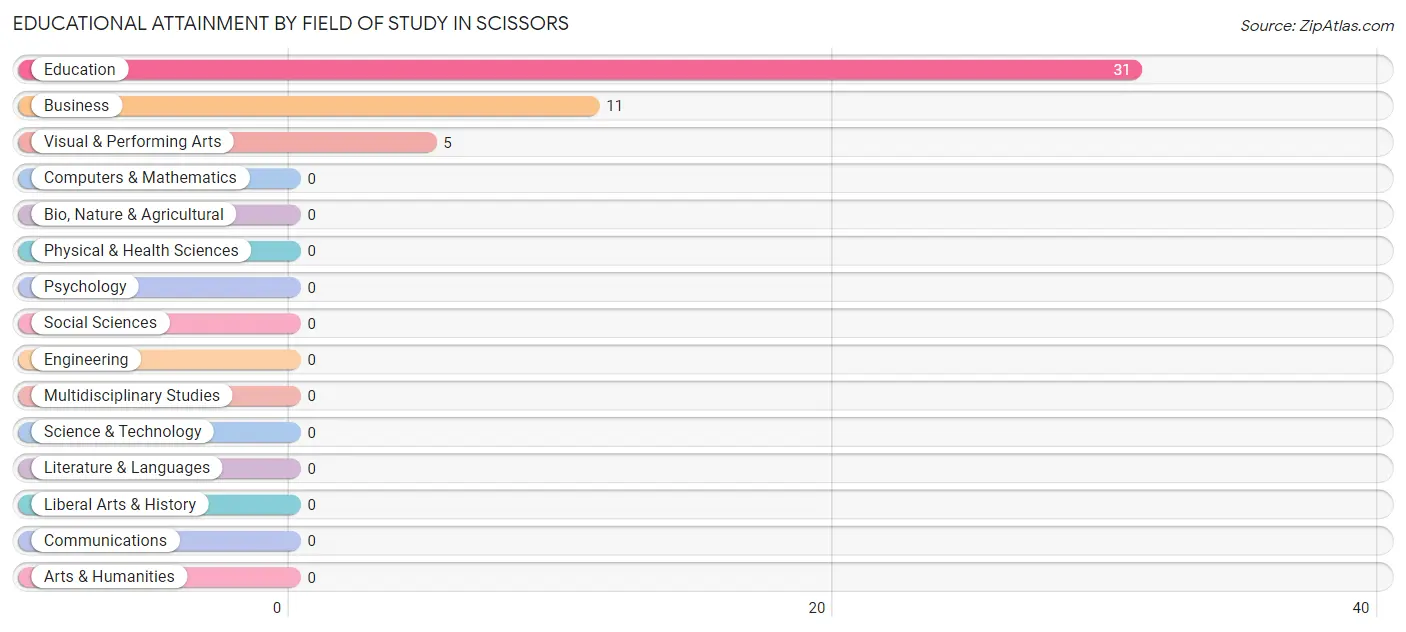
| Field of Study | # Graduates | % Graduates |
| Computers & Mathematics | 0 | 0.0% |
| Bio, Nature & Agricultural | 0 | 0.0% |
| Physical & Health Sciences | 0 | 0.0% |
| Psychology | 0 | 0.0% |
| Social Sciences | 0 | 0.0% |
| Engineering | 0 | 0.0% |
| Multidisciplinary Studies | 0 | 0.0% |
| Science & Technology | 0 | 0.0% |
| Business | 11 | 23.4% |
| Education | 31 | 66.0% |
| Literature & Languages | 0 | 0.0% |
| Liberal Arts & History | 0 | 0.0% |
| Visual & Performing Arts | 5 | 10.6% |
| Communications | 0 | 0.0% |
| Arts & Humanities | 0 | 0.0% |
| Total | 47 | 100.0% |
Transportation & Commute in Scissors
Vehicle Availability by Sex in Scissors
The most prevalent vehicle ownership categories in Scissors are males with 5 or more vehicles (286, accounting for 32.9%) and females with 5 or more vehicles (64, making up 52.3%).
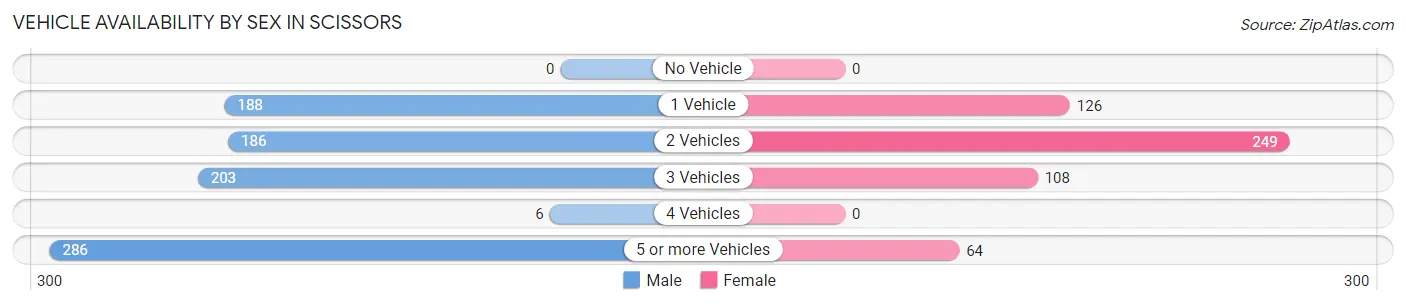
| Vehicles Available | Male | Female |
| No Vehicle | 0 (0.0%) | 0 (0.0%) |
| 1 Vehicle | 188 (21.6%) | 126 (23.0%) |
| 2 Vehicles | 186 (21.4%) | 249 (45.5%) |
| 3 Vehicles | 203 (23.4%) | 108 (19.7%) |
| 4 Vehicles | 6 (0.7%) | 0 (0.0%) |
| 5 or more Vehicles | 286 (32.9%) | 64 (11.7%) |
| Total | 869 (100.0%) | 547 (100.0%) |
Commute Time in Scissors
The most frequently occuring commute durations in Scissors are 20 to 24 minutes (561 commuters, 43.0%), 30 to 34 minutes (271 commuters, 20.8%), and 15 to 19 minutes (185 commuters, 14.2%).
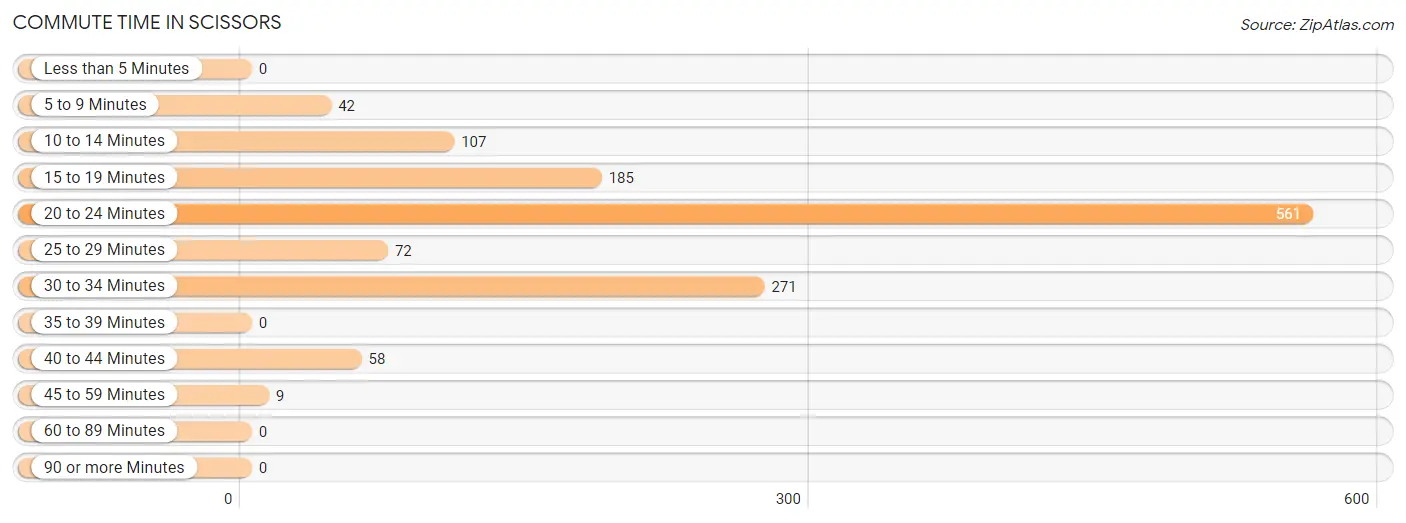
| Commute Time | # Commuters | % Commuters |
| Less than 5 Minutes | 0 | 0.0% |
| 5 to 9 Minutes | 42 | 3.2% |
| 10 to 14 Minutes | 107 | 8.2% |
| 15 to 19 Minutes | 185 | 14.2% |
| 20 to 24 Minutes | 561 | 43.0% |
| 25 to 29 Minutes | 72 | 5.5% |
| 30 to 34 Minutes | 271 | 20.8% |
| 35 to 39 Minutes | 0 | 0.0% |
| 40 to 44 Minutes | 58 | 4.4% |
| 45 to 59 Minutes | 9 | 0.7% |
| 60 to 89 Minutes | 0 | 0.0% |
| 90 or more Minutes | 0 | 0.0% |
Commute Time by Sex in Scissors
The most common commute times in Scissors are 20 to 24 minutes (322 commuters, 40.2%) for males and 20 to 24 minutes (239 commuters, 47.4%) for females.
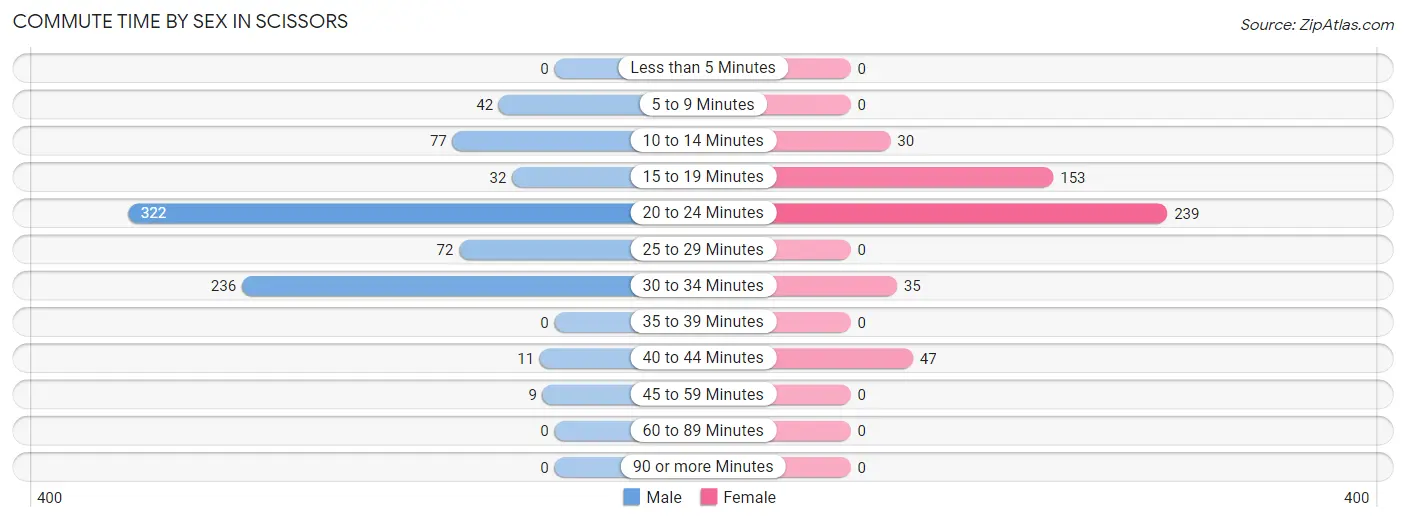
| Commute Time | Male | Female |
| Less than 5 Minutes | 0 (0.0%) | 0 (0.0%) |
| 5 to 9 Minutes | 42 (5.2%) | 0 (0.0%) |
| 10 to 14 Minutes | 77 (9.6%) | 30 (5.9%) |
| 15 to 19 Minutes | 32 (4.0%) | 153 (30.4%) |
| 20 to 24 Minutes | 322 (40.2%) | 239 (47.4%) |
| 25 to 29 Minutes | 72 (9.0%) | 0 (0.0%) |
| 30 to 34 Minutes | 236 (29.5%) | 35 (6.9%) |
| 35 to 39 Minutes | 0 (0.0%) | 0 (0.0%) |
| 40 to 44 Minutes | 11 (1.4%) | 47 (9.3%) |
| 45 to 59 Minutes | 9 (1.1%) | 0 (0.0%) |
| 60 to 89 Minutes | 0 (0.0%) | 0 (0.0%) |
| 90 or more Minutes | 0 (0.0%) | 0 (0.0%) |
Time of Departure to Work by Sex in Scissors
The most frequent times of departure to work in Scissors are 7:00 AM to 7:29 AM (279, 34.8%) for males and 7:00 AM to 7:29 AM (212, 42.1%) for females.
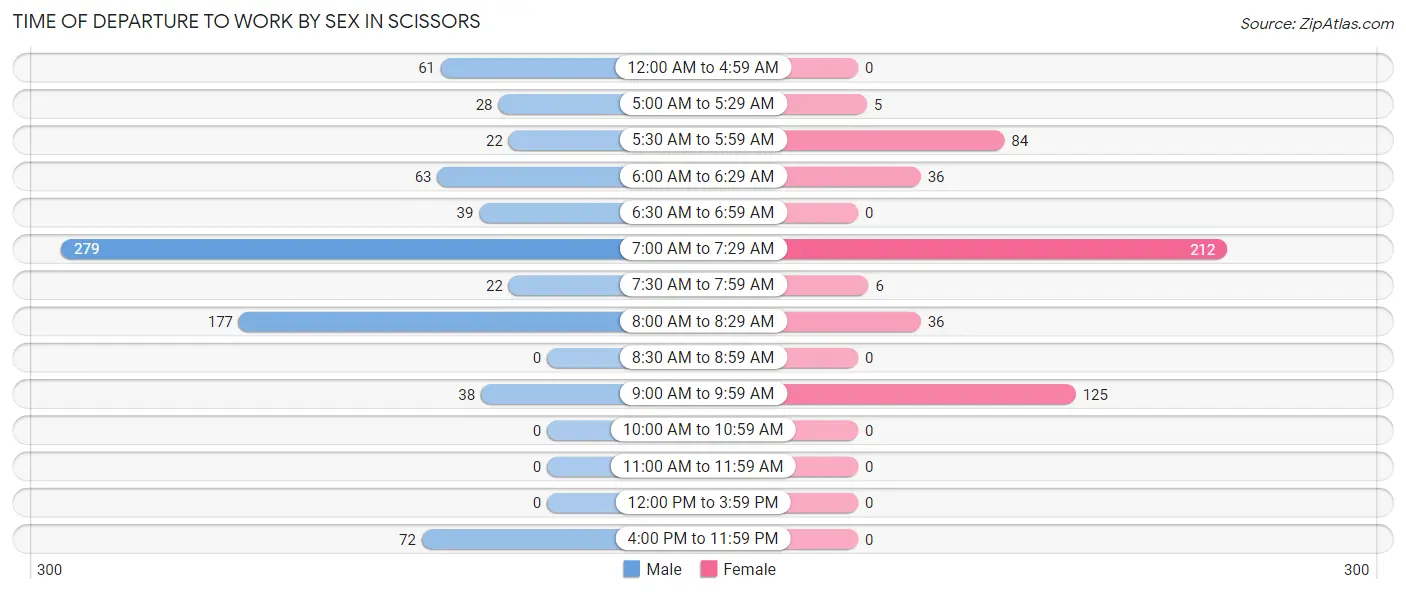
| Time of Departure | Male | Female |
| 12:00 AM to 4:59 AM | 61 (7.6%) | 0 (0.0%) |
| 5:00 AM to 5:29 AM | 28 (3.5%) | 5 (1.0%) |
| 5:30 AM to 5:59 AM | 22 (2.8%) | 84 (16.7%) |
| 6:00 AM to 6:29 AM | 63 (7.9%) | 36 (7.1%) |
| 6:30 AM to 6:59 AM | 39 (4.9%) | 0 (0.0%) |
| 7:00 AM to 7:29 AM | 279 (34.8%) | 212 (42.1%) |
| 7:30 AM to 7:59 AM | 22 (2.8%) | 6 (1.2%) |
| 8:00 AM to 8:29 AM | 177 (22.1%) | 36 (7.1%) |
| 8:30 AM to 8:59 AM | 0 (0.0%) | 0 (0.0%) |
| 9:00 AM to 9:59 AM | 38 (4.7%) | 125 (24.8%) |
| 10:00 AM to 10:59 AM | 0 (0.0%) | 0 (0.0%) |
| 11:00 AM to 11:59 AM | 0 (0.0%) | 0 (0.0%) |
| 12:00 PM to 3:59 PM | 0 (0.0%) | 0 (0.0%) |
| 4:00 PM to 11:59 PM | 72 (9.0%) | 0 (0.0%) |
| Total | 801 (100.0%) | 504 (100.0%) |
Housing Occupancy in Scissors
Occupancy by Ownership in Scissors
Of the total 760 dwellings in Scissors, owner-occupied units account for 608 (80.0%), while renter-occupied units make up 152 (20.0%).
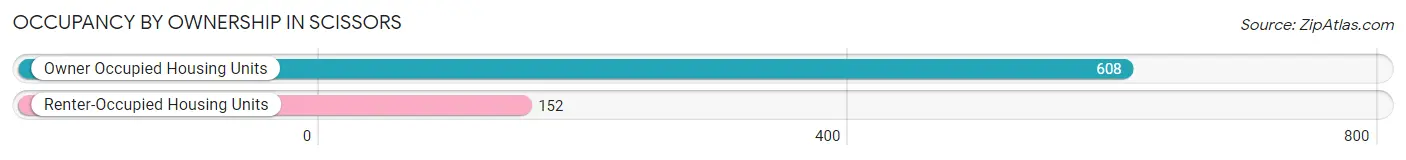
| Occupancy | # Housing Units | % Housing Units |
| Owner Occupied Housing Units | 608 | 80.0% |
| Renter-Occupied Housing Units | 152 | 20.0% |
| Total Occupied Housing Units | 760 | 100.0% |
Occupancy by Household Size in Scissors
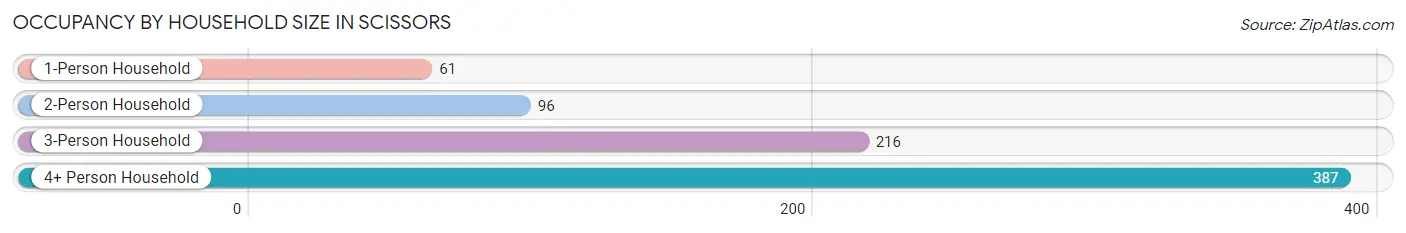
| Household Size | # Housing Units | % Housing Units |
| 1-Person Household | 61 | 8.0% |
| 2-Person Household | 96 | 12.6% |
| 3-Person Household | 216 | 28.4% |
| 4+ Person Household | 387 | 50.9% |
| Total Housing Units | 760 | 100.0% |
Occupancy by Ownership by Household Size in Scissors
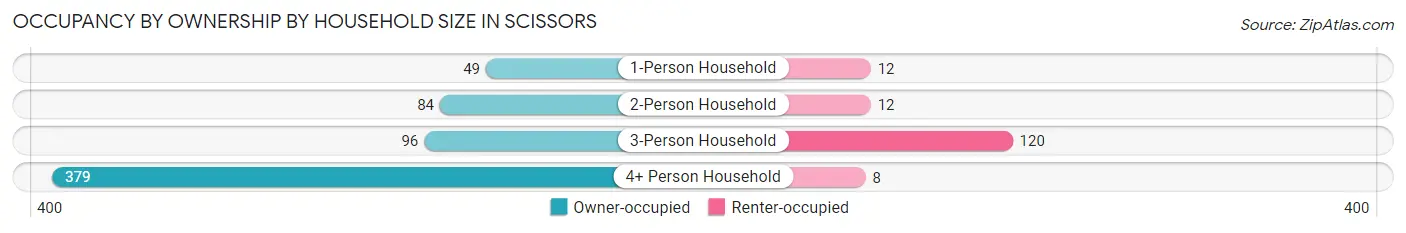
| Household Size | Owner-occupied | Renter-occupied |
| 1-Person Household | 49 (80.3%) | 12 (19.7%) |
| 2-Person Household | 84 (87.5%) | 12 (12.5%) |
| 3-Person Household | 96 (44.4%) | 120 (55.6%) |
| 4+ Person Household | 379 (97.9%) | 8 (2.1%) |
| Total Housing Units | 608 (80.0%) | 152 (20.0%) |
Occupancy by Educational Attainment in Scissors
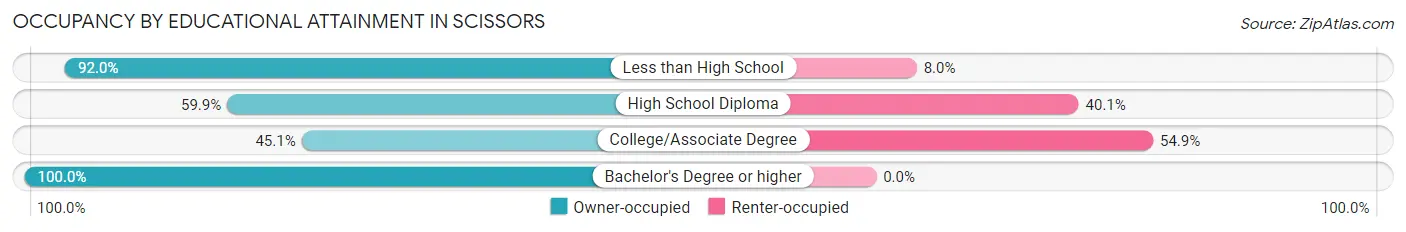
| Household Size | Owner-occupied | Renter-occupied |
| Less than High School | 446 (92.0%) | 39 (8.0%) |
| High School Diploma | 85 (59.9%) | 57 (40.1%) |
| College/Associate Degree | 46 (45.1%) | 56 (54.9%) |
| Bachelor's Degree or higher | 31 (100.0%) | 0 (0.0%) |
Occupancy by Age of Householder in Scissors
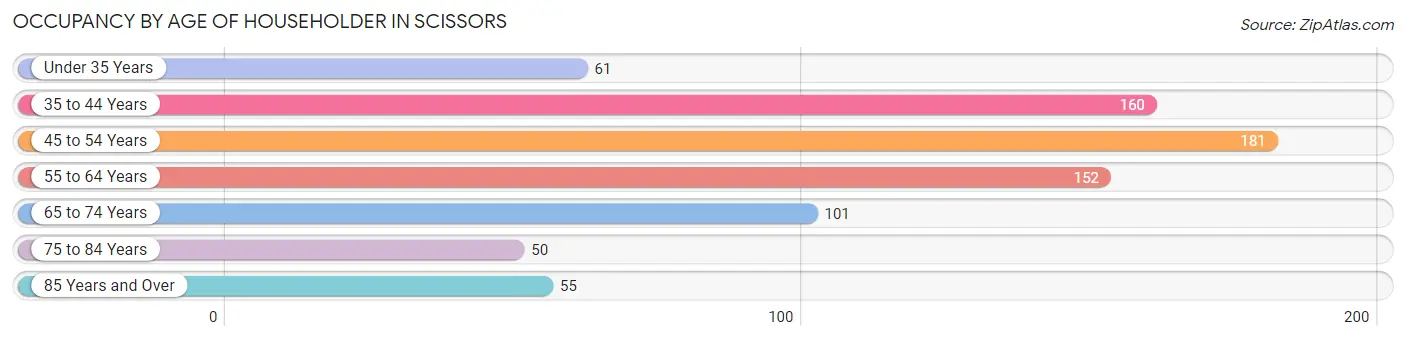
| Age Bracket | # Households | % Households |
| Under 35 Years | 61 | 8.0% |
| 35 to 44 Years | 160 | 21.0% |
| 45 to 54 Years | 181 | 23.8% |
| 55 to 64 Years | 152 | 20.0% |
| 65 to 74 Years | 101 | 13.3% |
| 75 to 84 Years | 50 | 6.6% |
| 85 Years and Over | 55 | 7.2% |
| Total | 760 | 100.0% |
Housing Finances in Scissors
Median Income by Occupancy in Scissors
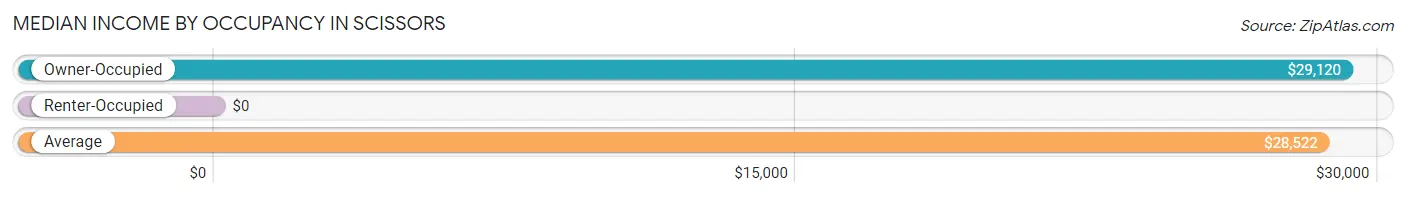
| Occupancy Type | # Households | Median Income |
| Owner-Occupied | 608 (80.0%) | $29,120 |
| Renter-Occupied | 152 (20.0%) | $0 |
| Average | 760 (100.0%) | $28,522 |
Occupancy by Householder Income Bracket in Scissors
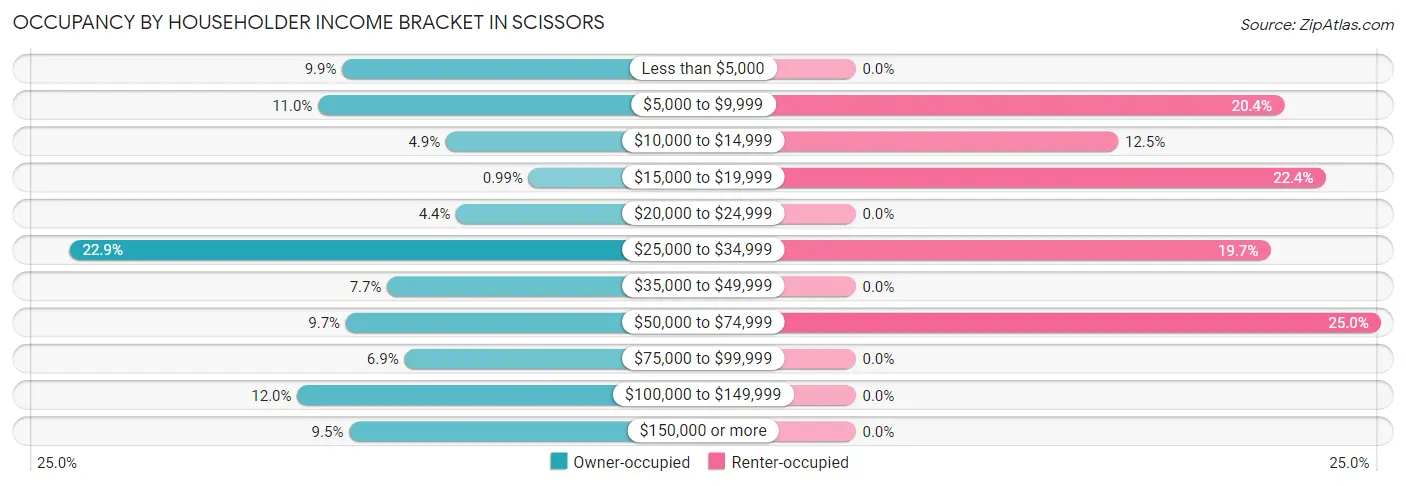
| Income Bracket | Owner-occupied | Renter-occupied |
| Less than $5,000 | 60 (9.9%) | 0 (0.0%) |
| $5,000 to $9,999 | 67 (11.0%) | 31 (20.4%) |
| $10,000 to $14,999 | 30 (4.9%) | 19 (12.5%) |
| $15,000 to $19,999 | 6 (1.0%) | 34 (22.4%) |
| $20,000 to $24,999 | 27 (4.4%) | 0 (0.0%) |
| $25,000 to $34,999 | 139 (22.9%) | 30 (19.7%) |
| $35,000 to $49,999 | 47 (7.7%) | 0 (0.0%) |
| $50,000 to $74,999 | 59 (9.7%) | 38 (25.0%) |
| $75,000 to $99,999 | 42 (6.9%) | 0 (0.0%) |
| $100,000 to $149,999 | 73 (12.0%) | 0 (0.0%) |
| $150,000 or more | 58 (9.5%) | 0 (0.0%) |
| Total | 608 (100.0%) | 152 (100.0%) |
Monthly Housing Cost Tiers in Scissors
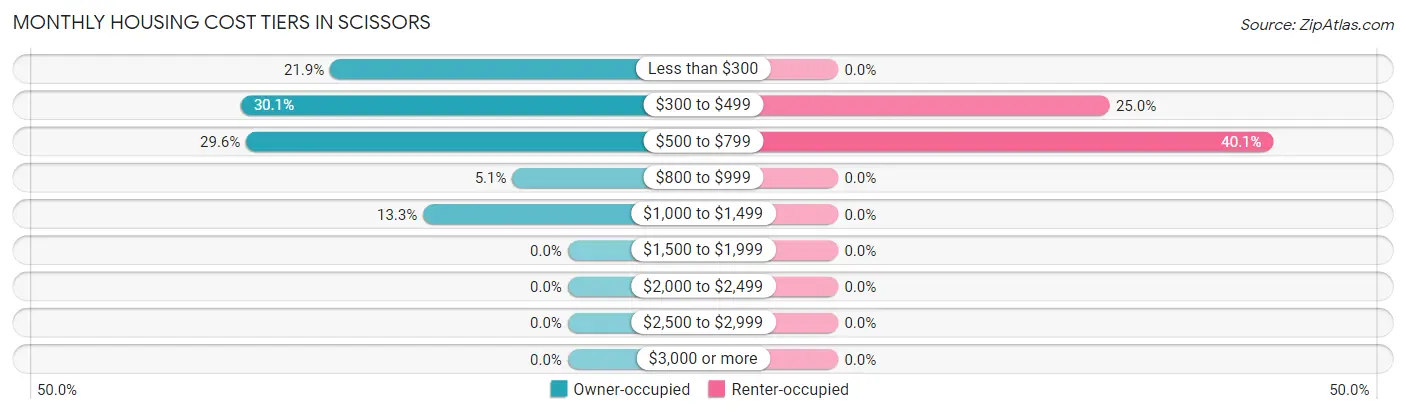
| Monthly Cost | Owner-occupied | Renter-occupied |
| Less than $300 | 133 (21.9%) | 0 (0.0%) |
| $300 to $499 | 183 (30.1%) | 38 (25.0%) |
| $500 to $799 | 180 (29.6%) | 61 (40.1%) |
| $800 to $999 | 31 (5.1%) | 0 (0.0%) |
| $1,000 to $1,499 | 81 (13.3%) | 0 (0.0%) |
| $1,500 to $1,999 | 0 (0.0%) | 0 (0.0%) |
| $2,000 to $2,499 | 0 (0.0%) | 0 (0.0%) |
| $2,500 to $2,999 | 0 (0.0%) | 0 (0.0%) |
| $3,000 or more | 0 (0.0%) | 0 (0.0%) |
| Total | 608 (100.0%) | 152 (100.0%) |
Physical Housing Characteristics in Scissors
Housing Structures in Scissors
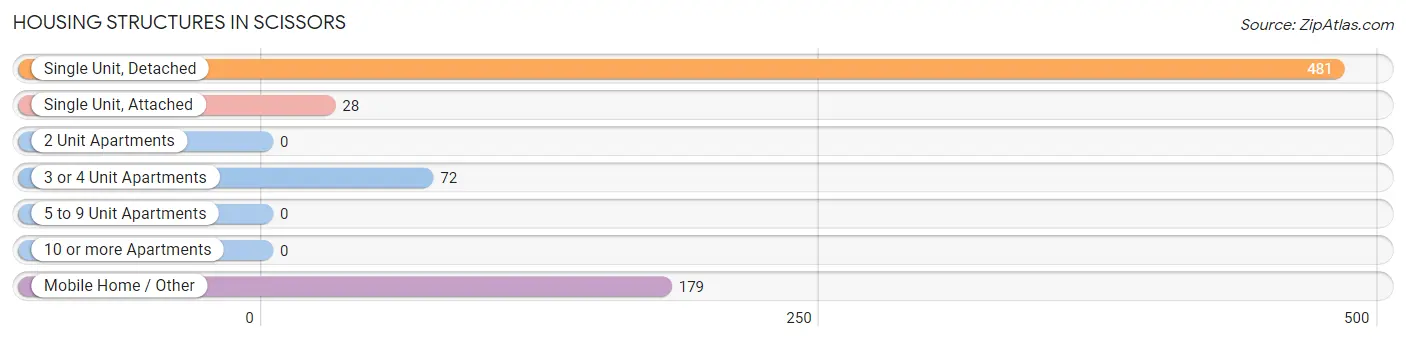
| Structure Type | # Housing Units | % Housing Units |
| Single Unit, Detached | 481 | 63.3% |
| Single Unit, Attached | 28 | 3.7% |
| 2 Unit Apartments | 0 | 0.0% |
| 3 or 4 Unit Apartments | 72 | 9.5% |
| 5 to 9 Unit Apartments | 0 | 0.0% |
| 10 or more Apartments | 0 | 0.0% |
| Mobile Home / Other | 179 | 23.5% |
| Total | 760 | 100.0% |
Housing Structures by Occupancy in Scissors
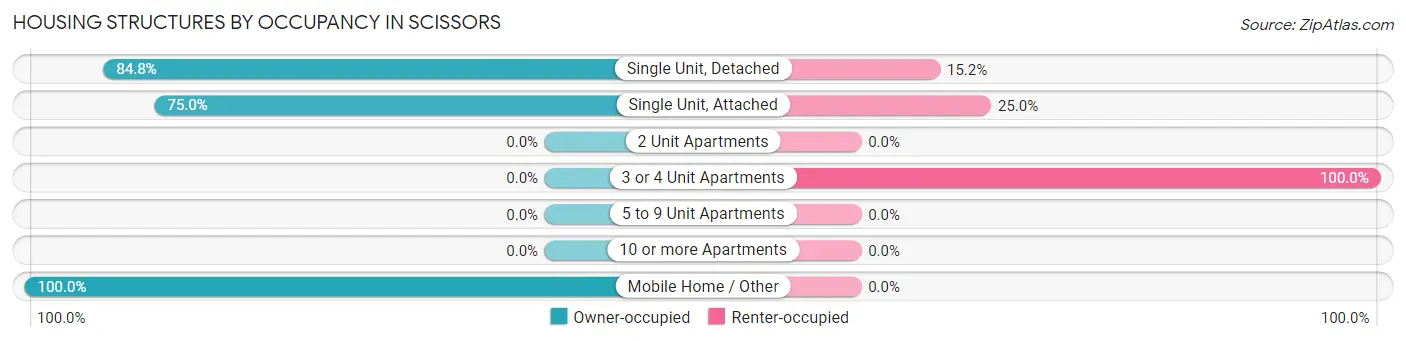
| Structure Type | Owner-occupied | Renter-occupied |
| Single Unit, Detached | 408 (84.8%) | 73 (15.2%) |
| Single Unit, Attached | 21 (75.0%) | 7 (25.0%) |
| 2 Unit Apartments | 0 (0.0%) | 0 (0.0%) |
| 3 or 4 Unit Apartments | 0 (0.0%) | 72 (100.0%) |
| 5 to 9 Unit Apartments | 0 (0.0%) | 0 (0.0%) |
| 10 or more Apartments | 0 (0.0%) | 0 (0.0%) |
| Mobile Home / Other | 179 (100.0%) | 0 (0.0%) |
| Total | 608 (80.0%) | 152 (20.0%) |
Housing Structures by Number of Rooms in Scissors
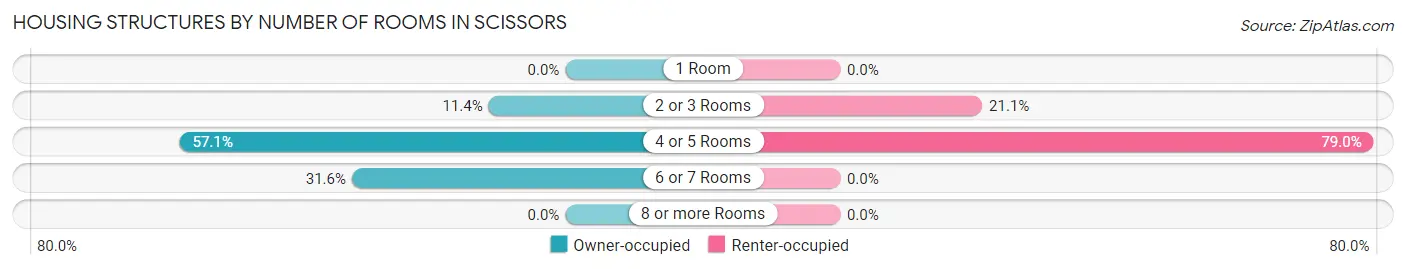
| Number of Rooms | Owner-occupied | Renter-occupied |
| 1 Room | 0 (0.0%) | 0 (0.0%) |
| 2 or 3 Rooms | 69 (11.4%) | 32 (21.0%) |
| 4 or 5 Rooms | 347 (57.1%) | 120 (78.9%) |
| 6 or 7 Rooms | 192 (31.6%) | 0 (0.0%) |
| 8 or more Rooms | 0 (0.0%) | 0 (0.0%) |
| Total | 608 (100.0%) | 152 (100.0%) |
Housing Structure by Heating Type in Scissors
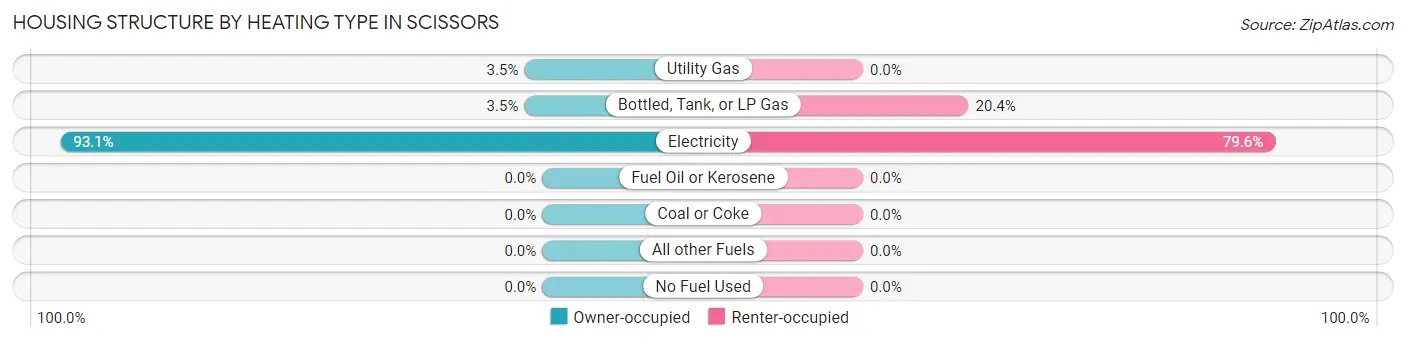
| Heating Type | Owner-occupied | Renter-occupied |
| Utility Gas | 21 (3.5%) | 0 (0.0%) |
| Bottled, Tank, or LP Gas | 21 (3.5%) | 31 (20.4%) |
| Electricity | 566 (93.1%) | 121 (79.6%) |
| Fuel Oil or Kerosene | 0 (0.0%) | 0 (0.0%) |
| Coal or Coke | 0 (0.0%) | 0 (0.0%) |
| All other Fuels | 0 (0.0%) | 0 (0.0%) |
| No Fuel Used | 0 (0.0%) | 0 (0.0%) |
| Total | 608 (100.0%) | 152 (100.0%) |
Household Vehicle Usage in Scissors
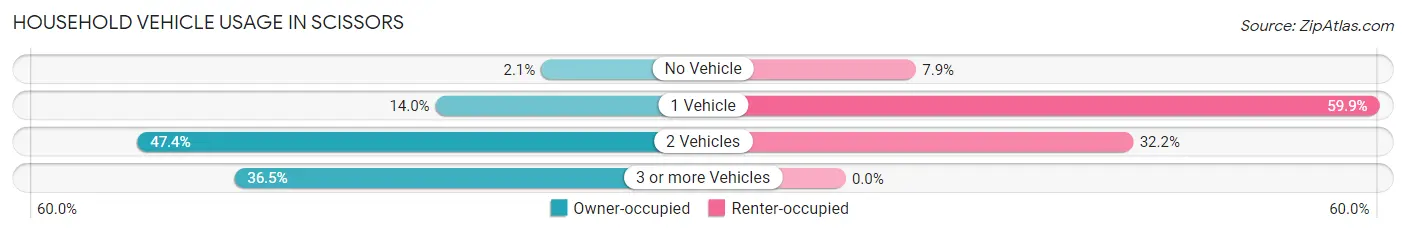
| Vehicles per Household | Owner-occupied | Renter-occupied |
| No Vehicle | 13 (2.1%) | 12 (7.9%) |
| 1 Vehicle | 85 (14.0%) | 91 (59.9%) |
| 2 Vehicles | 288 (47.4%) | 49 (32.2%) |
| 3 or more Vehicles | 222 (36.5%) | 0 (0.0%) |
| Total | 608 (100.0%) | 152 (100.0%) |
Real Estate & Mortgages in Scissors
Real Estate and Mortgage Overview in Scissors
| Characteristic | Without Mortgage | With Mortgage |
| Housing Units | 366 | 242 |
| Median Property Value | $44,600 | $77,100 |
| Median Household Income | $29,754 | $58 |
| Monthly Housing Costs | $356 | $0 |
| Real Estate Taxes | $696 | $0 |
Property Value by Mortgage Status in Scissors
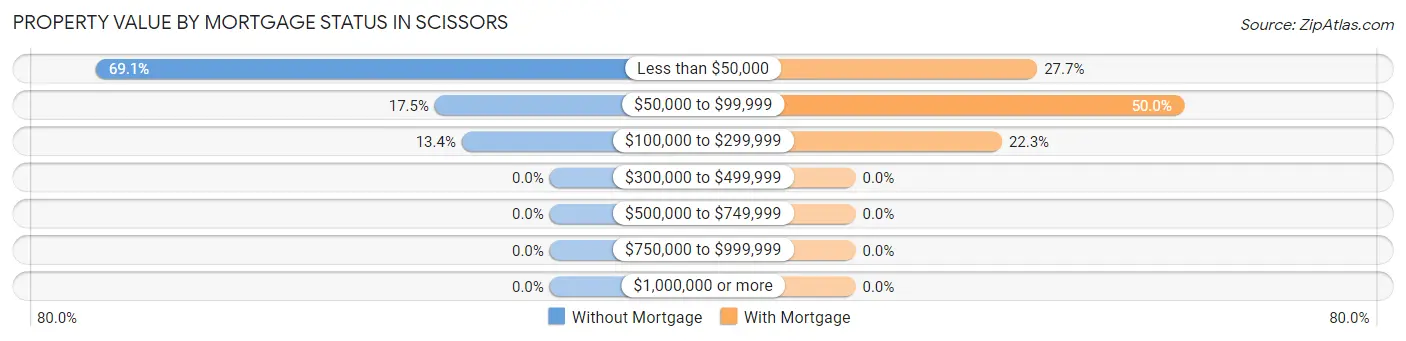
| Property Value | Without Mortgage | With Mortgage |
| Less than $50,000 | 253 (69.1%) | 67 (27.7%) |
| $50,000 to $99,999 | 64 (17.5%) | 121 (50.0%) |
| $100,000 to $299,999 | 49 (13.4%) | 54 (22.3%) |
| $300,000 to $499,999 | 0 (0.0%) | 0 (0.0%) |
| $500,000 to $749,999 | 0 (0.0%) | 0 (0.0%) |
| $750,000 to $999,999 | 0 (0.0%) | 0 (0.0%) |
| $1,000,000 or more | 0 (0.0%) | 0 (0.0%) |
| Total | 366 (100.0%) | 242 (100.0%) |
Household Income by Mortgage Status in Scissors
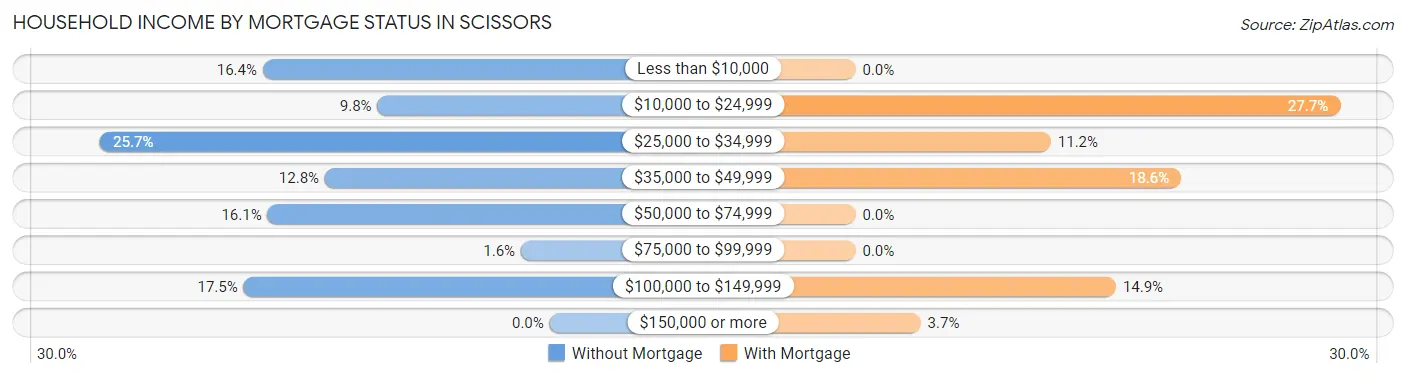
| Household Income | Without Mortgage | With Mortgage |
| Less than $10,000 | 60 (16.4%) | 0 (0.0%) |
| $10,000 to $24,999 | 36 (9.8%) | 67 (27.7%) |
| $25,000 to $34,999 | 94 (25.7%) | 27 (11.2%) |
| $35,000 to $49,999 | 47 (12.8%) | 45 (18.6%) |
| $50,000 to $74,999 | 59 (16.1%) | 0 (0.0%) |
| $75,000 to $99,999 | 6 (1.6%) | 0 (0.0%) |
| $100,000 to $149,999 | 64 (17.5%) | 36 (14.9%) |
| $150,000 or more | 0 (0.0%) | 9 (3.7%) |
| Total | 366 (100.0%) | 242 (100.0%) |
Property Value to Household Income Ratio in Scissors
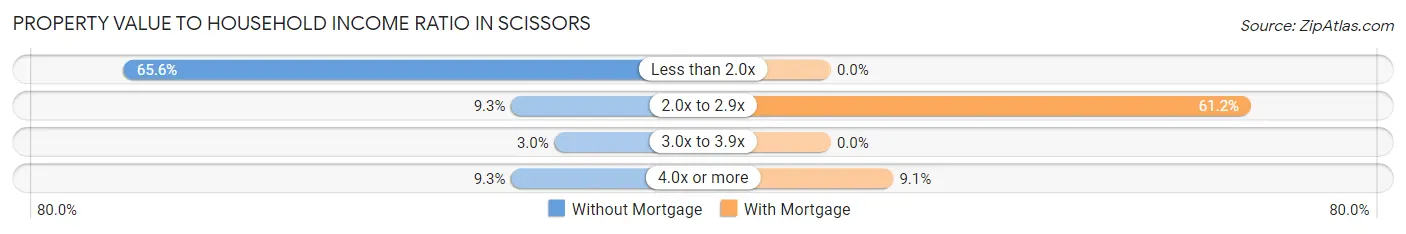
| Value-to-Income Ratio | Without Mortgage | With Mortgage |
| Less than 2.0x | 240 (65.6%) | 0 (0.0%) |
| 2.0x to 2.9x | 34 (9.3%) | 148 (61.2%) |
| 3.0x to 3.9x | 11 (3.0%) | 0 (0.0%) |
| 4.0x or more | 34 (9.3%) | 22 (9.1%) |
| Total | 366 (100.0%) | 242 (100.0%) |
Real Estate Taxes by Mortgage Status in Scissors
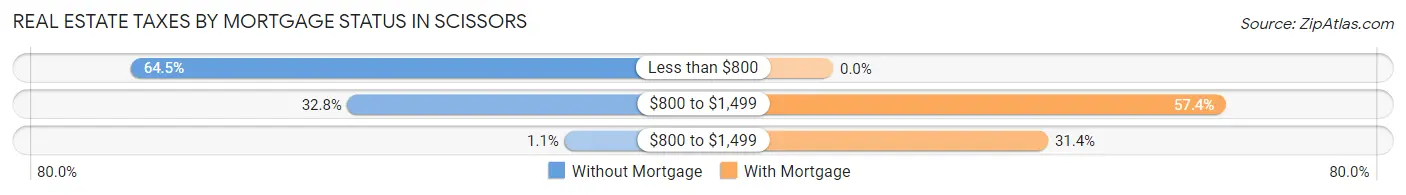
| Property Taxes | Without Mortgage | With Mortgage |
| Less than $800 | 236 (64.5%) | 0 (0.0%) |
| $800 to $1,499 | 120 (32.8%) | 139 (57.4%) |
| $800 to $1,499 | 4 (1.1%) | 76 (31.4%) |
| Total | 366 (100.0%) | 242 (100.0%) |
Health & Disability in Scissors
Health Insurance Coverage by Age in Scissors
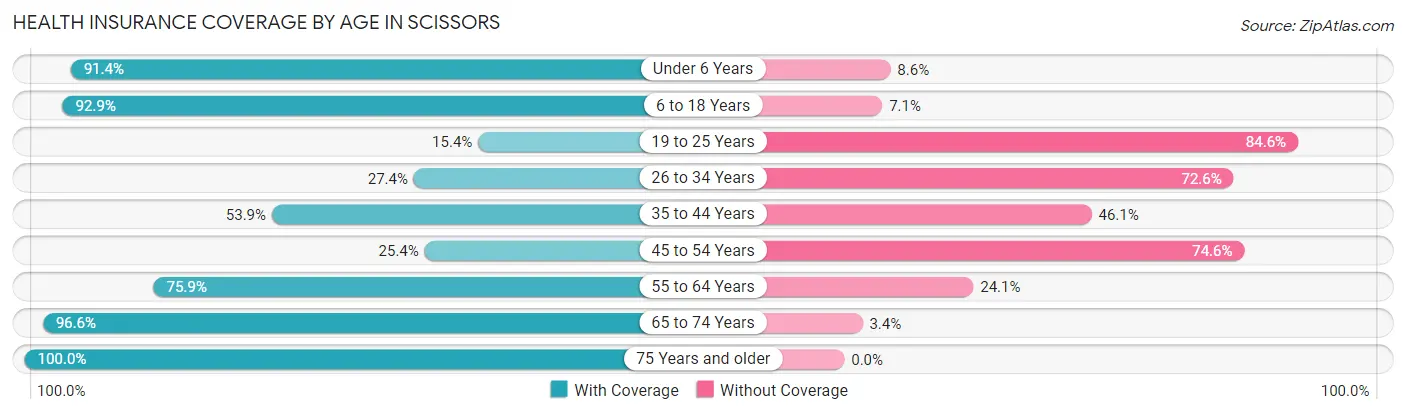
| Age Bracket | With Coverage | Without Coverage |
| Under 6 Years | 521 (91.4%) | 49 (8.6%) |
| 6 to 18 Years | 775 (92.9%) | 59 (7.1%) |
| 19 to 25 Years | 64 (15.4%) | 351 (84.6%) |
| 26 to 34 Years | 105 (27.4%) | 278 (72.6%) |
| 35 to 44 Years | 180 (53.9%) | 154 (46.1%) |
| 45 to 54 Years | 140 (25.4%) | 411 (74.6%) |
| 55 to 64 Years | 142 (75.9%) | 45 (24.1%) |
| 65 to 74 Years | 229 (96.6%) | 8 (3.4%) |
| 75 Years and older | 156 (100.0%) | 0 (0.0%) |
| Total | 2,312 (63.0%) | 1,355 (36.9%) |
Health Insurance Coverage by Citizenship Status in Scissors
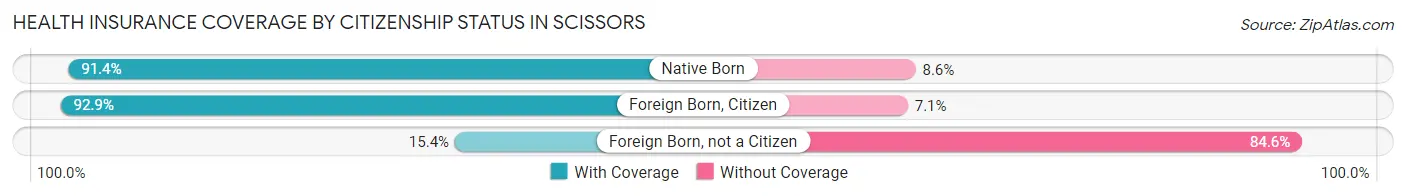
| Citizenship Status | With Coverage | Without Coverage |
| Native Born | 521 (91.4%) | 49 (8.6%) |
| Foreign Born, Citizen | 775 (92.9%) | 59 (7.1%) |
| Foreign Born, not a Citizen | 64 (15.4%) | 351 (84.6%) |
Health Insurance Coverage by Household Income in Scissors
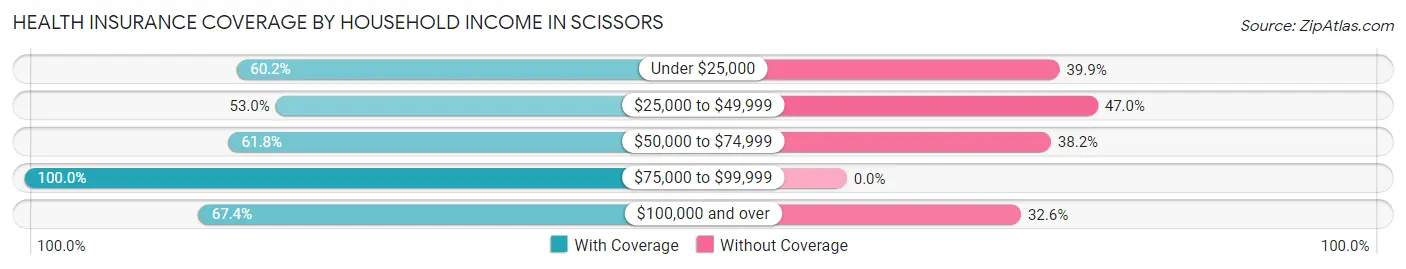
| Household Income | With Coverage | Without Coverage |
| Under $25,000 | 483 (60.2%) | 320 (39.9%) |
| $25,000 to $49,999 | 453 (53.0%) | 402 (47.0%) |
| $50,000 to $74,999 | 491 (61.8%) | 304 (38.2%) |
| $75,000 to $99,999 | 206 (100.0%) | 0 (0.0%) |
| $100,000 and over | 679 (67.4%) | 329 (32.6%) |
Public vs Private Health Insurance Coverage by Age in Scissors
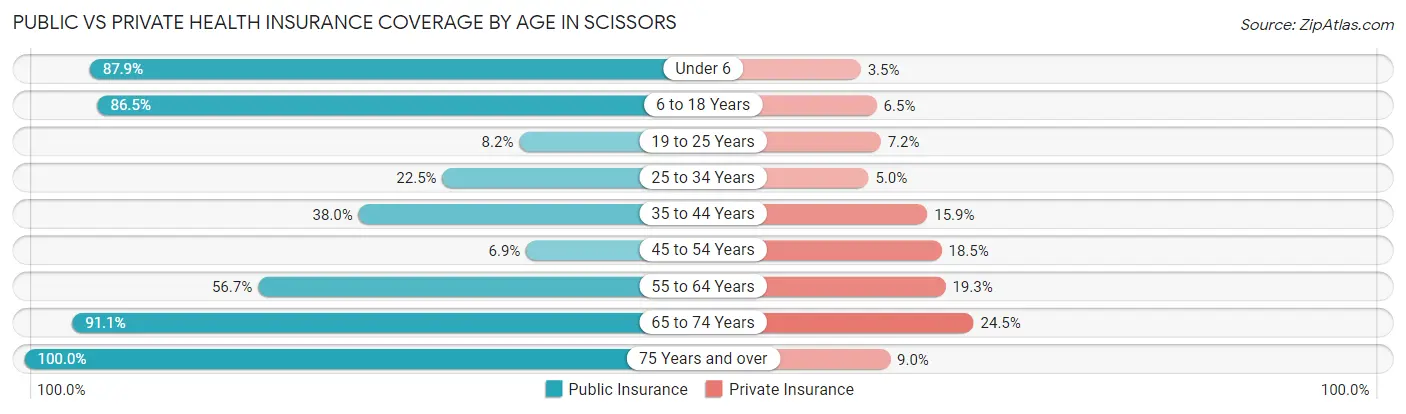
| Age Bracket | Public Insurance | Private Insurance |
| Under 6 | 501 (87.9%) | 20 (3.5%) |
| 6 to 18 Years | 721 (86.5%) | 54 (6.5%) |
| 19 to 25 Years | 34 (8.2%) | 30 (7.2%) |
| 25 to 34 Years | 86 (22.5%) | 19 (5.0%) |
| 35 to 44 Years | 127 (38.0%) | 53 (15.9%) |
| 45 to 54 Years | 38 (6.9%) | 102 (18.5%) |
| 55 to 64 Years | 106 (56.7%) | 36 (19.3%) |
| 65 to 74 Years | 216 (91.1%) | 58 (24.5%) |
| 75 Years and over | 156 (100.0%) | 14 (9.0%) |
| Total | 1,985 (54.1%) | 386 (10.5%) |
Disability Status by Sex by Age in Scissors
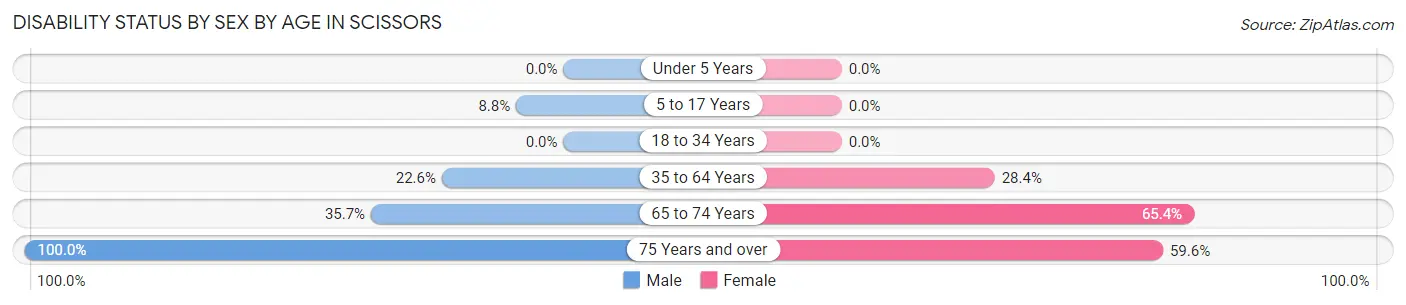
| Age Bracket | Male | Female |
| Under 5 Years | 0 (0.0%) | 0 (0.0%) |
| 5 to 17 Years | 44 (8.8%) | 0 (0.0%) |
| 18 to 34 Years | 0 (0.0%) | 0 (0.0%) |
| 35 to 64 Years | 137 (22.6%) | 132 (28.4%) |
| 65 to 74 Years | 30 (35.7%) | 100 (65.4%) |
| 75 Years and over | 104 (100.0%) | 31 (59.6%) |
Disability Class by Sex by Age in Scissors
Disability Class: Hearing Difficulty
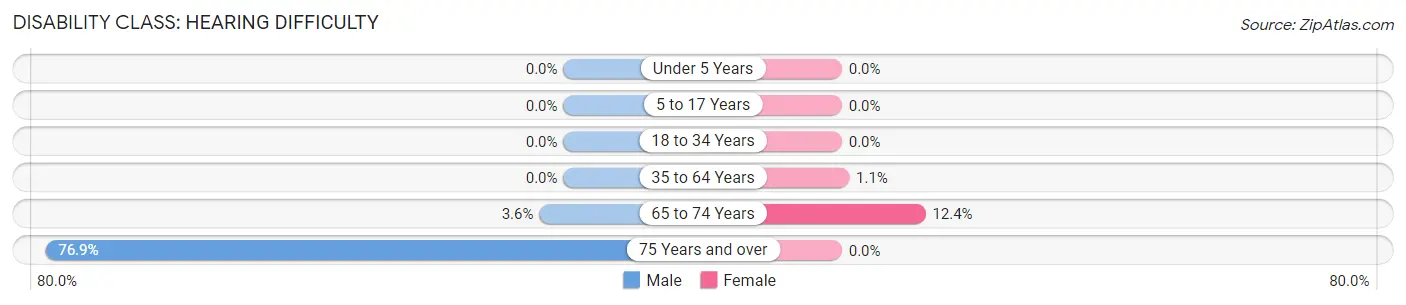
| Age Bracket | Male | Female |
| Under 5 Years | 0 (0.0%) | 0 (0.0%) |
| 5 to 17 Years | 0 (0.0%) | 0 (0.0%) |
| 18 to 34 Years | 0 (0.0%) | 0 (0.0%) |
| 35 to 64 Years | 0 (0.0%) | 5 (1.1%) |
| 65 to 74 Years | 3 (3.6%) | 19 (12.4%) |
| 75 Years and over | 80 (76.9%) | 0 (0.0%) |
Disability Class: Vision Difficulty
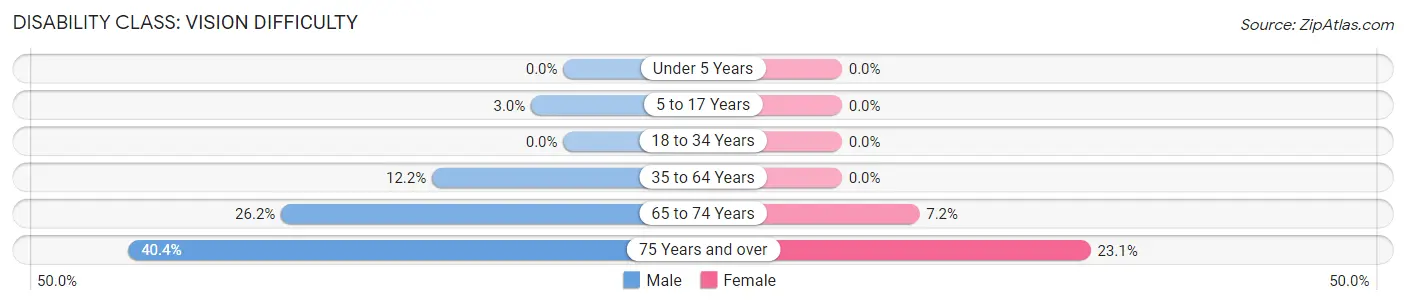
| Age Bracket | Male | Female |
| Under 5 Years | 0 (0.0%) | 0 (0.0%) |
| 5 to 17 Years | 15 (3.0%) | 0 (0.0%) |
| 18 to 34 Years | 0 (0.0%) | 0 (0.0%) |
| 35 to 64 Years | 74 (12.2%) | 0 (0.0%) |
| 65 to 74 Years | 22 (26.2%) | 11 (7.2%) |
| 75 Years and over | 42 (40.4%) | 12 (23.1%) |
Disability Class: Cognitive Difficulty
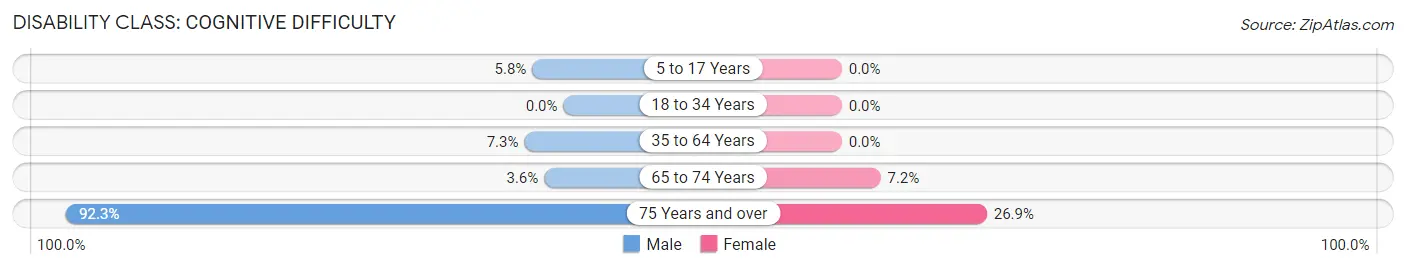
| Age Bracket | Male | Female |
| 5 to 17 Years | 29 (5.8%) | 0 (0.0%) |
| 18 to 34 Years | 0 (0.0%) | 0 (0.0%) |
| 35 to 64 Years | 44 (7.2%) | 0 (0.0%) |
| 65 to 74 Years | 3 (3.6%) | 11 (7.2%) |
| 75 Years and over | 96 (92.3%) | 14 (26.9%) |
Disability Class: Ambulatory Difficulty
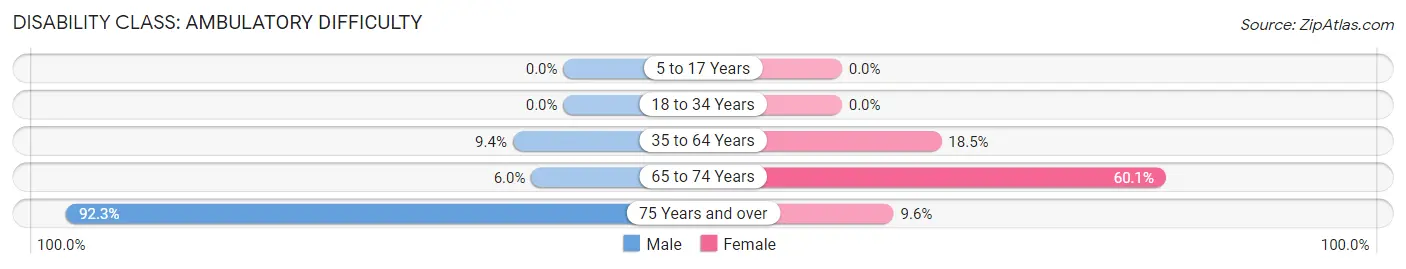
| Age Bracket | Male | Female |
| 5 to 17 Years | 0 (0.0%) | 0 (0.0%) |
| 18 to 34 Years | 0 (0.0%) | 0 (0.0%) |
| 35 to 64 Years | 57 (9.4%) | 86 (18.5%) |
| 65 to 74 Years | 5 (5.9%) | 92 (60.1%) |
| 75 Years and over | 96 (92.3%) | 5 (9.6%) |
Disability Class: Self-Care Difficulty
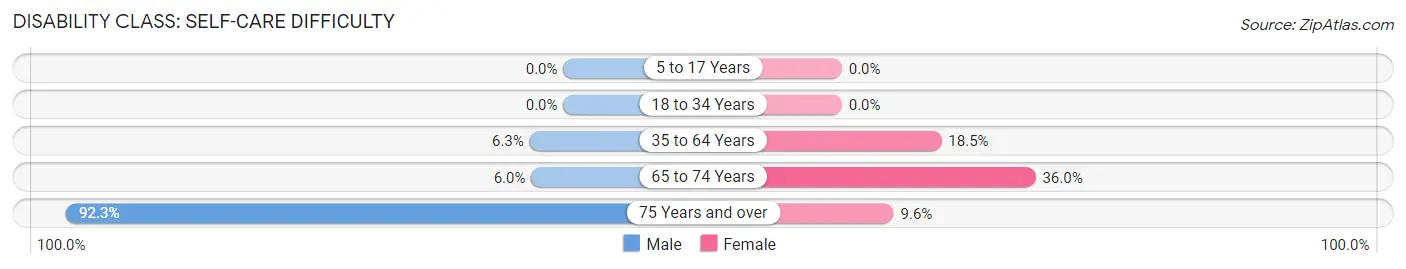
| Age Bracket | Male | Female |
| 5 to 17 Years | 0 (0.0%) | 0 (0.0%) |
| 18 to 34 Years | 0 (0.0%) | 0 (0.0%) |
| 35 to 64 Years | 38 (6.3%) | 86 (18.5%) |
| 65 to 74 Years | 5 (5.9%) | 55 (35.9%) |
| 75 Years and over | 96 (92.3%) | 5 (9.6%) |
Technology Access in Scissors
Computing Device Access in Scissors
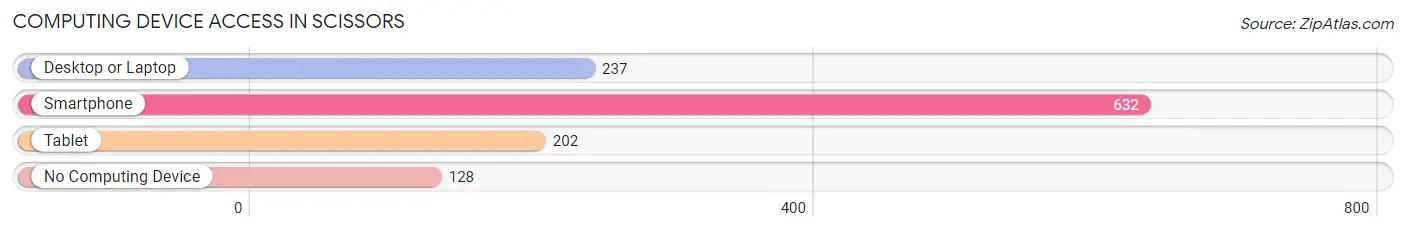
| Device Type | # Households | % Households |
| Desktop or Laptop | 237 | 31.2% |
| Smartphone | 632 | 83.2% |
| Tablet | 202 | 26.6% |
| No Computing Device | 128 | 16.8% |
| Total | 760 | 100.0% |
Internet Access in Scissors
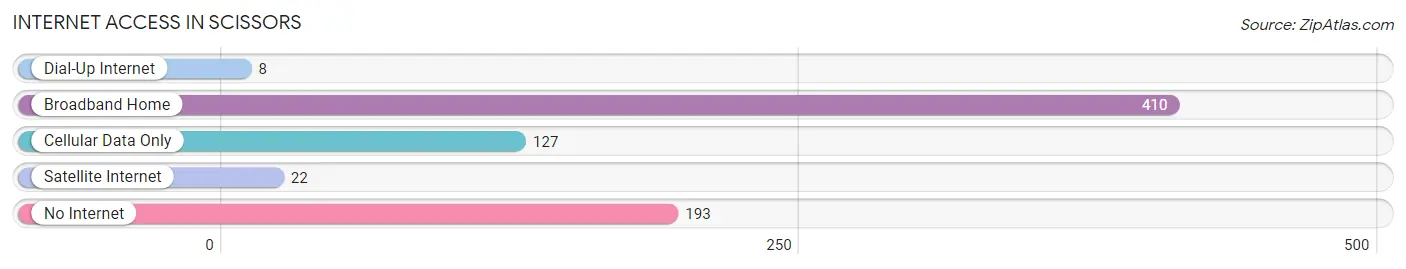
| Internet Type | # Households | % Households |
| Dial-Up Internet | 8 | 1.1% |
| Broadband Home | 410 | 53.9% |
| Cellular Data Only | 127 | 16.7% |
| Satellite Internet | 22 | 2.9% |
| No Internet | 193 | 25.4% |
| Total | 760 | 100.0% |
Scissors Summary
Scissors, Texas is a small unincorporated community located in the southeastern corner of Jim Wells County, Texas. It is situated about 10 miles south of Alice, the county seat, and about 20 miles north of Kingsville. The population of Scissors was estimated to be around 200 people in 2000.
History
The area around Scissors was first settled in the late 1800s by ranchers and farmers. The town was originally known as “Cottonwood”, but the name was changed to Scissors in the early 1900s. The name was chosen because of the abundance of scissors-shaped cacti in the area.
The first post office in Scissors was established in 1910. The town was officially incorporated in 1912, and the first mayor was elected in 1913.
Geography
Scissors is located in the Coastal Plains region of Texas. The terrain is mostly flat, with some rolling hills. The climate is semi-arid, with hot summers and mild winters. The average annual precipitation is around 22 inches.
The town is situated on the banks of the Nueces River, which provides a source of irrigation for the local farms and ranches. The area is also home to a variety of wildlife, including deer, wild hogs, and various species of birds.
Economy
The economy of Scissors is largely based on agriculture. The main crops grown in the area are cotton, corn, and sorghum. The town also has a few small businesses, including a grocery store, a gas station, and a few restaurants.
Demographics
As of the 2000 census, the population of Scissors was estimated to be around 200 people. The racial makeup of the town was 94.5% White, 0.5% African American, 0.5% Native American, 0.5% Asian, and 4% from other races. The median household income was $25,000, and the median family income was $30,000.
Conclusion
Scissors, Texas is a small unincorporated community located in the southeastern corner of Jim Wells County. It has a long history, and its economy is largely based on agriculture. The population of Scissors was estimated to be around 200 people in 2000, and the racial makeup of the town was 94.5% White, 0.5% African American, 0.5% Native American, 0.5% Asian, and 4% from other races.
Common Questions
What is Per Capita Income in Scissors?
Per Capita income in Scissors is $13,332.
What is the Median Family Income in Scissors?
Median Family Income in Scissors is $28,616.
What is the Median Household income in Scissors?
Median Household Income in Scissors is $28,522.
What is Income or Wage Gap in Scissors?
Income or Wage Gap in Scissors is 12.2%.
Women in Scissors earn 87.8 cents for every dollar earned by a man.
What is Inequality or Gini Index in Scissors?
Inequality or Gini Index in Scissors is 0.56.
What is the Total Population of Scissors?
Total Population of Scissors is 3,667.
What is the Total Male Population of Scissors?
Total Male Population of Scissors is 1,990.
What is the Total Female Population of Scissors?
Total Female Population of Scissors is 1,677.
What is the Ratio of Males per 100 Females in Scissors?
There are 118.66 Males per 100 Females in Scissors.
What is the Ratio of Females per 100 Males in Scissors?
There are 84.27 Females per 100 Males in Scissors.
What is the Median Population Age in Scissors?
Median Population Age in Scissors is 27.4 Years.
What is the Average Family Size in Scissors
Average Family Size in Scissors is 5.1 People.
What is the Average Household Size in Scissors
Average Household Size in Scissors is 4.8 People.
How Large is the Labor Force in Scissors?
There are 1,504 People in the Labor Forcein in Scissors.
What is the Percentage of People in the Labor Force in Scissors?
59.1% of People are in the Labor Force in Scissors.
What is the Unemployment Rate in Scissors?
Unemployment Rate in Scissors is 3.4%.