Butterfield, TX Map & Demographics
Butterfield Map
Butterfield Overview
$6,568
PER CAPITA INCOME
0.60
INEQUALITY / GINI INDEX
226
TOTAL POPULATION
159
MALE POPULATION
67
FEMALE POPULATION
237.31
MALES / 100 FEMALES
42.14
FEMALES / 100 MALES
23.8
MEDIAN AGE
3.3
AVG FAMILY SIZE
3.1
AVG HOUSEHOLD SIZE
87
LABOR FORCE [ PEOPLE ]
46.5%
PERCENT IN LABOR FORCE
14.9%
UNEMPLOYMENT RATE
Income in Butterfield
Income Overview in Butterfield
| Characteristic | Number | Measure |
| Per Capita Income | 226 | $6,568 |
| Median Family Income | 61 | $0 |
| Mean Family Income | 61 | $17,518 |
| Median Household Income | 73 | $0 |
| Mean Household Income | 73 | $19,310 |
| Income Deficit | 61 | $0 |
| Wage / Income Gap (%) | 226 | 0.00% |
| Wage / Income Gap ($) | 226 | 100.00¢ per $1 |
| Gini / Inequality Index | 226 | 0.60 |
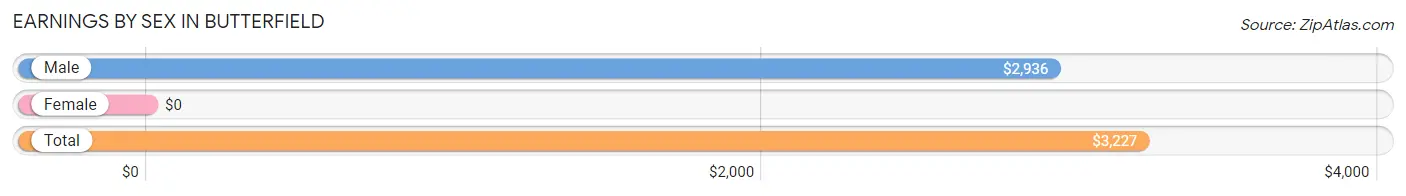
Earnings by Sex in Butterfield
| Sex | Number | Average Earnings |
| Male | 77 (88.5%) | $2,936 |
| Female | 10 (11.5%) | $0 |
| Total | 87 (100.0%) | $3,227 |
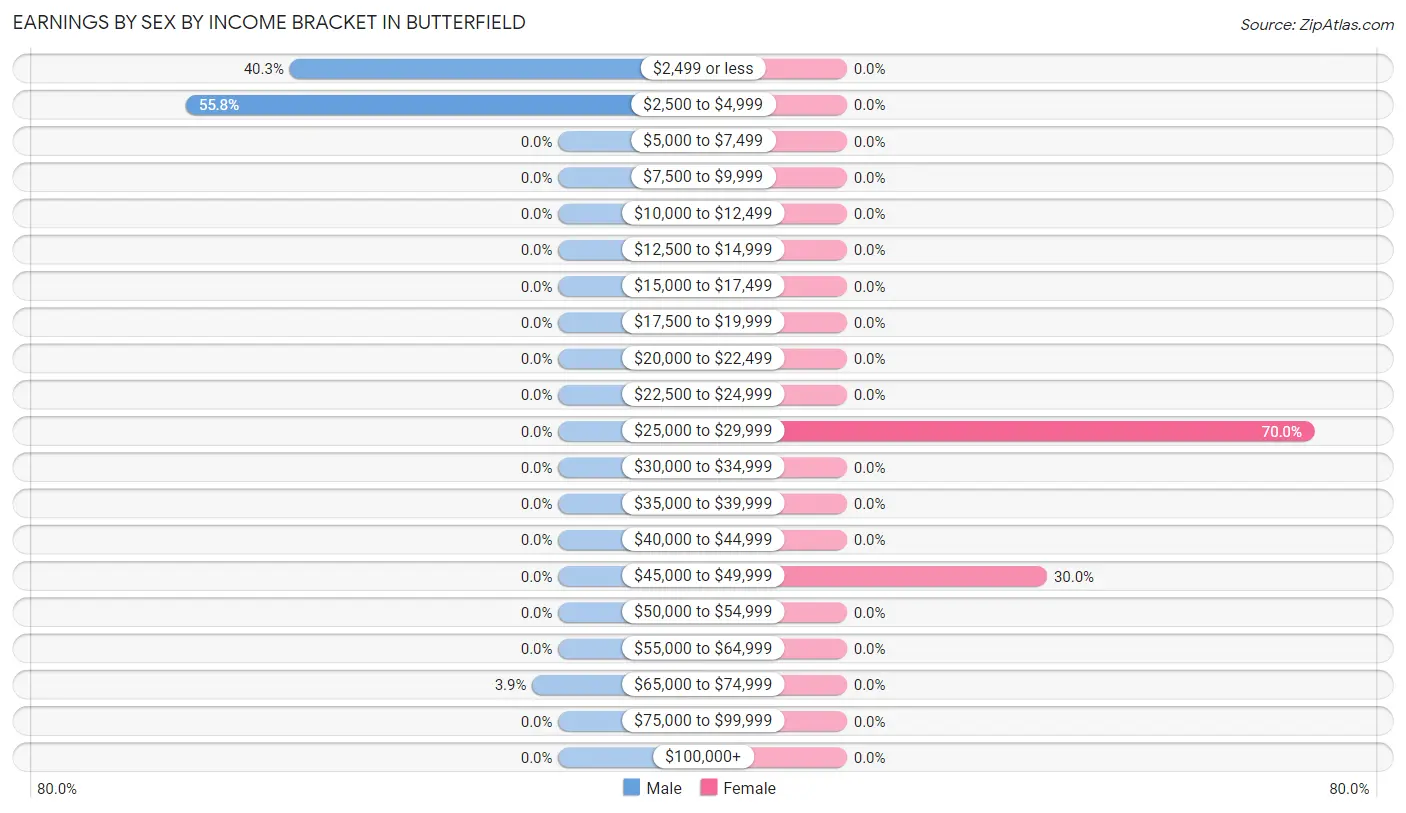
Earnings by Sex by Income Bracket in Butterfield
The most common earnings brackets in Butterfield are $2,500 to $4,999 for men (43 | 55.8%) and $25,000 to $29,999 for women (7 | 70.0%).
| Income | Male | Female |
| $2,499 or less | 31 (40.3%) | 0 (0.0%) |
| $2,500 to $4,999 | 43 (55.8%) | 0 (0.0%) |
| $5,000 to $7,499 | 0 (0.0%) | 0 (0.0%) |
| $7,500 to $9,999 | 0 (0.0%) | 0 (0.0%) |
| $10,000 to $12,499 | 0 (0.0%) | 0 (0.0%) |
| $12,500 to $14,999 | 0 (0.0%) | 0 (0.0%) |
| $15,000 to $17,499 | 0 (0.0%) | 0 (0.0%) |
| $17,500 to $19,999 | 0 (0.0%) | 0 (0.0%) |
| $20,000 to $22,499 | 0 (0.0%) | 0 (0.0%) |
| $22,500 to $24,999 | 0 (0.0%) | 0 (0.0%) |
| $25,000 to $29,999 | 0 (0.0%) | 7 (70.0%) |
| $30,000 to $34,999 | 0 (0.0%) | 0 (0.0%) |
| $35,000 to $39,999 | 0 (0.0%) | 0 (0.0%) |
| $40,000 to $44,999 | 0 (0.0%) | 0 (0.0%) |
| $45,000 to $49,999 | 0 (0.0%) | 3 (30.0%) |
| $50,000 to $54,999 | 0 (0.0%) | 0 (0.0%) |
| $55,000 to $64,999 | 0 (0.0%) | 0 (0.0%) |
| $65,000 to $74,999 | 3 (3.9%) | 0 (0.0%) |
| $75,000 to $99,999 | 0 (0.0%) | 0 (0.0%) |
| $100,000+ | 0 (0.0%) | 0 (0.0%) |
| Total | 77 (100.0%) | 10 (100.0%) |
Earnings by Sex by Educational Attainment in Butterfield
| Educational Attainment | Male Income | Female Income |
| Less than High School | - | - |
| High School Diploma | - | - |
| College or Associate's Degree | - | - |
| Bachelor's Degree | - | - |
| Graduate Degree | - | - |
| Total | - | - |
Family Income in Butterfield
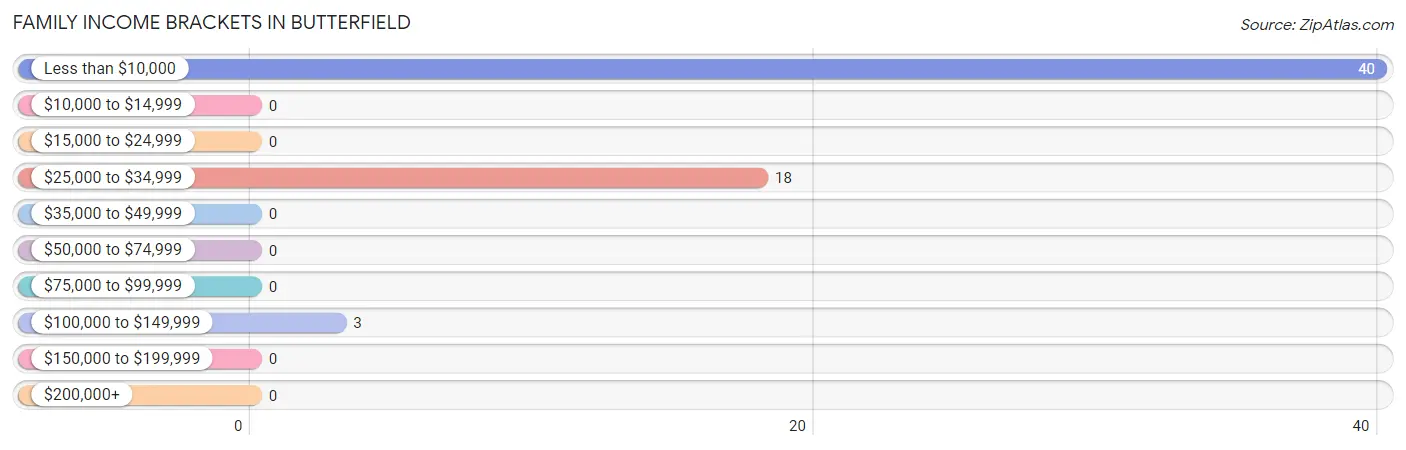
Family Income Brackets in Butterfield
According to the Butterfield family income data, there are 40 families falling into the less than $10,000 income range, which is the most common income bracket and makes up 65.6% of all families.
| Income Bracket | # Families | % Families |
| Less than $10,000 | 40 | 65.6% |
| $10,000 to $14,999 | 0 | 0.0% |
| $15,000 to $24,999 | 0 | 0.0% |
| $25,000 to $34,999 | 18 | 29.5% |
| $35,000 to $49,999 | 0 | 0.0% |
| $50,000 to $74,999 | 0 | 0.0% |
| $75,000 to $99,999 | 0 | 0.0% |
| $100,000 to $149,999 | 3 | 4.9% |
| $150,000 to $199,999 | 0 | 0.0% |
| $200,000+ | 0 | 0.0% |
Family Income by Famaliy Size in Butterfield
| Income Bracket | # Families | Median Income |
| 2-Person Families | 42 (68.9%) | $0 |
| 3-Person Families | 0 (0.0%) | $0 |
| 4-Person Families | 0 (0.0%) | $0 |
| 5-Person Families | 0 (0.0%) | $0 |
| 6-Person Families | 19 (31.1%) | $0 |
| 7+ Person Families | 0 (0.0%) | $0 |
| Total | 61 (100.0%) | $0 |
Family Income by Number of Earners in Butterfield
| Number of Earners | # Families | Median Income |
| No Earners | 0 (0.0%) | $0 |
| 1 Earner | 39 (63.9%) | $0 |
| 2 Earners | 22 (36.1%) | $0 |
| 3+ Earners | 0 (0.0%) | $0 |
| Total | 61 (100.0%) | $0 |
Household Income in Butterfield
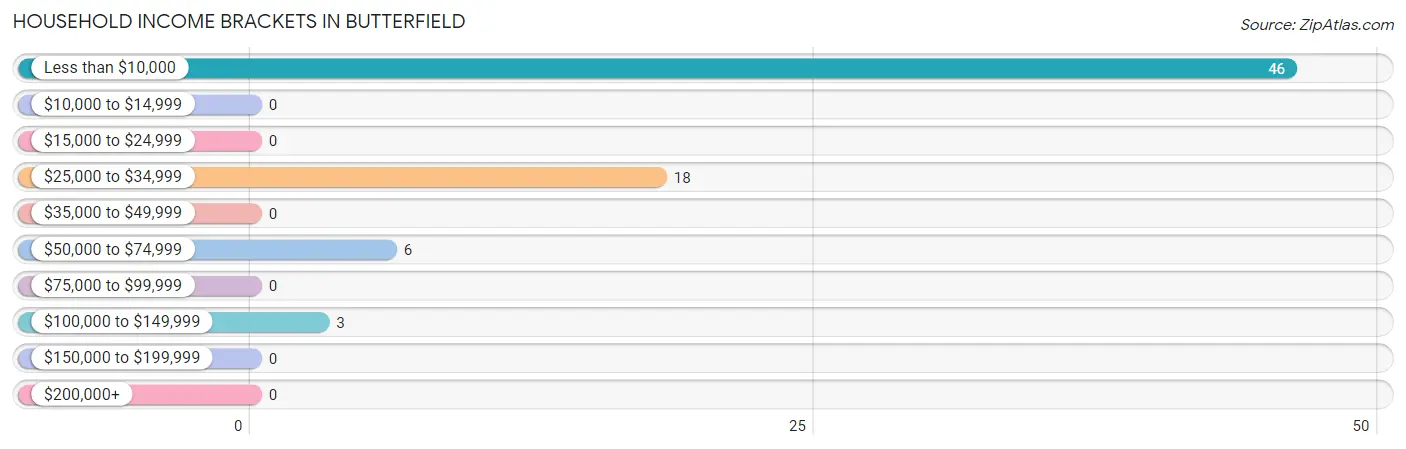
Household Income Brackets in Butterfield
With 46 households falling in the category, the less than $10,000 income range is the most frequent in Butterfield, accounting for 63.0% of all households.
| Income Bracket | # Households | % Households |
| Less than $10,000 | 46 | 63.0% |
| $10,000 to $14,999 | 0 | 0.0% |
| $15,000 to $24,999 | 0 | 0.0% |
| $25,000 to $34,999 | 18 | 24.7% |
| $35,000 to $49,999 | 0 | 0.0% |
| $50,000 to $74,999 | 6 | 8.2% |
| $75,000 to $99,999 | 0 | 0.0% |
| $100,000 to $149,999 | 3 | 4.1% |
| $150,000 to $199,999 | 0 | 0.0% |
| $200,000+ | 0 | 0.0% |
Household Income by Householder Age in Butterfield
| Income Bracket | # Households | Median Income |
| 15 to 24 Years | 0 (0.0%) | $0 |
| 25 to 44 Years | 19 (26.0%) | $0 |
| 45 to 64 Years | 15 (20.5%) | $0 |
| 65+ Years | 39 (53.4%) | $0 |
| Total | 73 (100.0%) | $0 |
Poverty in Butterfield
Income Below Poverty by Sex and Age in Butterfield
With 83.0% poverty level for males and 56.7% for females among the residents of Butterfield, 15 year old males and 15 year old females are the most vulnerable to poverty, with 20 males (100.0%) and 19 females (100.0%) in their respective age groups living below the poverty level.
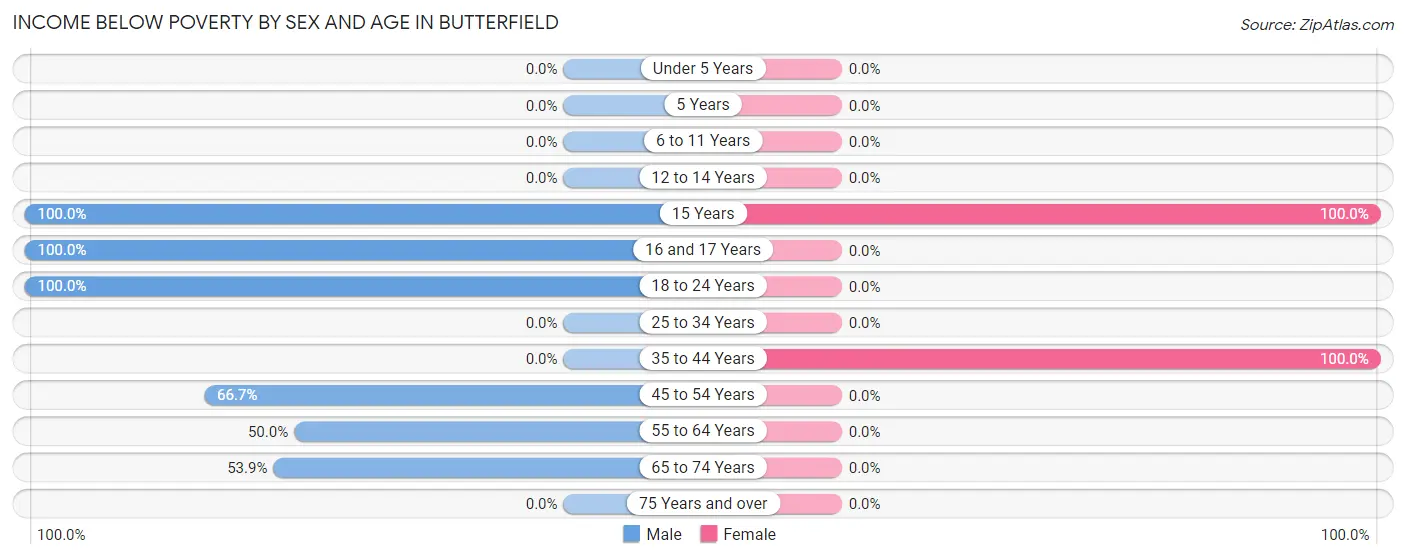
| Age Bracket | Male | Female |
| Under 5 Years | 0 (0.0%) | 0 (0.0%) |
| 5 Years | 0 (0.0%) | 0 (0.0%) |
| 6 to 11 Years | 0 (0.0%) | 0 (0.0%) |
| 12 to 14 Years | 0 (0.0%) | 0 (0.0%) |
| 15 Years | 20 (100.0%) | 19 (100.0%) |
| 16 and 17 Years | 19 (100.0%) | 0 (0.0%) |
| 18 to 24 Years | 60 (100.0%) | 0 (0.0%) |
| 25 to 34 Years | 0 (0.0%) | 0 (0.0%) |
| 35 to 44 Years | 0 (0.0%) | 19 (100.0%) |
| 45 to 54 Years | 6 (66.7%) | 0 (0.0%) |
| 55 to 64 Years | 6 (50.0%) | 0 (0.0%) |
| 65 to 74 Years | 21 (53.8%) | 0 (0.0%) |
| 75 Years and over | 0 (0.0%) | 0 (0.0%) |
| Total | 132 (83.0%) | 38 (56.7%) |
Income Above Poverty by Sex and Age in Butterfield
According to the poverty statistics in Butterfield, males aged 55 to 64 years and females aged 25 to 34 years are the age groups that are most secure financially, with 50.0% of males and 100.0% of females in these age groups living above the poverty line.
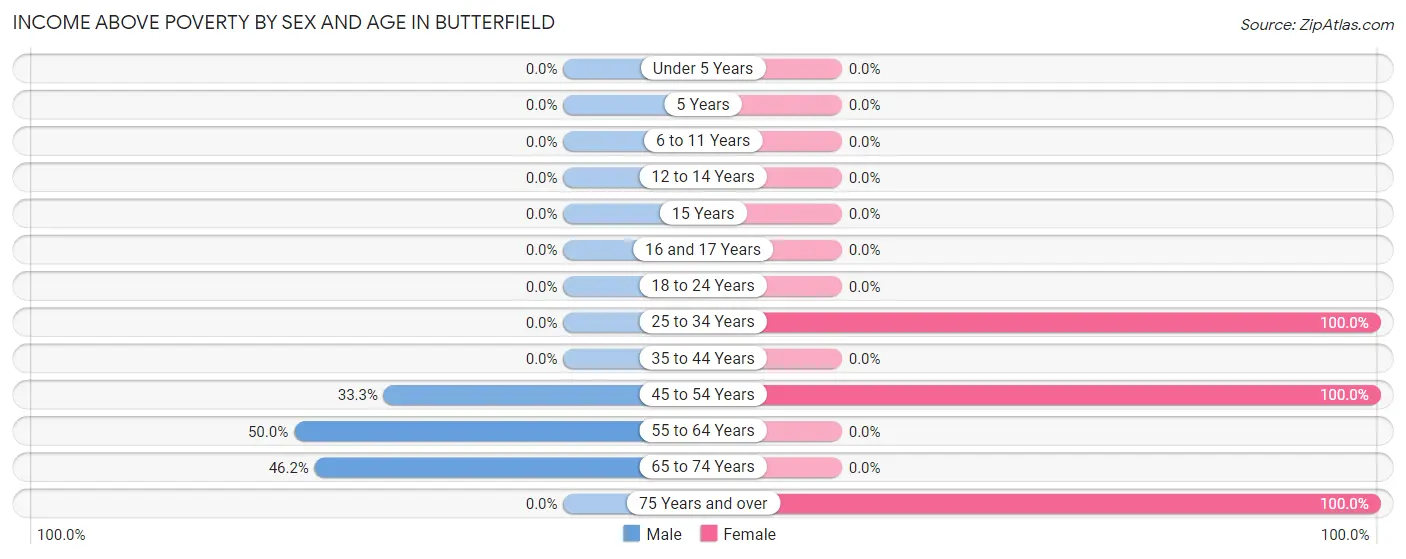
| Age Bracket | Male | Female |
| Under 5 Years | 0 (0.0%) | 0 (0.0%) |
| 5 Years | 0 (0.0%) | 0 (0.0%) |
| 6 to 11 Years | 0 (0.0%) | 0 (0.0%) |
| 12 to 14 Years | 0 (0.0%) | 0 (0.0%) |
| 15 Years | 0 (0.0%) | 0 (0.0%) |
| 16 and 17 Years | 0 (0.0%) | 0 (0.0%) |
| 18 to 24 Years | 0 (0.0%) | 0 (0.0%) |
| 25 to 34 Years | 0 (0.0%) | 7 (100.0%) |
| 35 to 44 Years | 0 (0.0%) | 0 (0.0%) |
| 45 to 54 Years | 3 (33.3%) | 3 (100.0%) |
| 55 to 64 Years | 6 (50.0%) | 0 (0.0%) |
| 65 to 74 Years | 18 (46.2%) | 0 (0.0%) |
| 75 Years and over | 0 (0.0%) | 19 (100.0%) |
| Total | 27 (17.0%) | 29 (43.3%) |
Income Below Poverty Among Married-Couple Families in Butterfield
| Children | Above Poverty | Below Poverty |
| No Children | 21 (100.0%) | 0 (0.0%) |
| 1 or 2 Children | 0 (0.0%) | 0 (0.0%) |
| 3 or 4 Children | 0 (0.0%) | 0 (0.0%) |
| 5 or more Children | 0 (0.0%) | 0 (0.0%) |
| Total | 21 (100.0%) | 0 (0.0%) |
Income Below Poverty Among Single-Parent Households in Butterfield
According to the poverty data in Butterfield, 100.0% or 21 single-father households and 100.0% or 19 single-mother households are living below the poverty line. Among single-father households, those with no children have the highest poverty rate, with 21 households (100.0%) experiencing poverty. Likewise, among single-mother households, those with 3 or 4 children have the highest poverty rate, with 19 households (100.0%) falling below the poverty line.
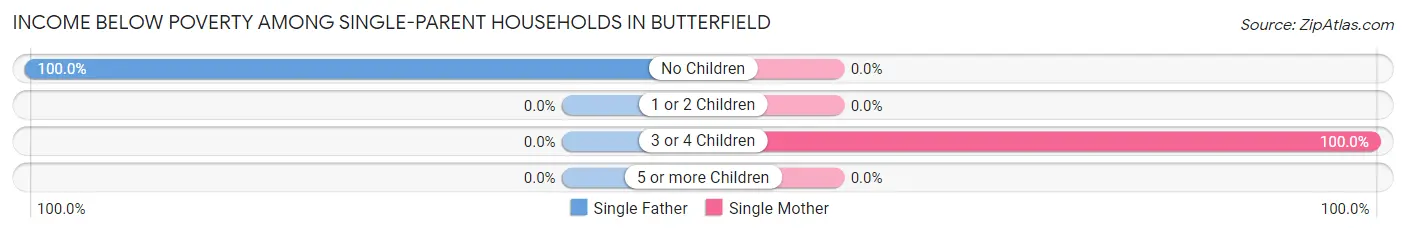
| Children | Single Father | Single Mother |
| No Children | 21 (100.0%) | 0 (0.0%) |
| 1 or 2 Children | 0 (0.0%) | 0 (0.0%) |
| 3 or 4 Children | 0 (0.0%) | 19 (100.0%) |
| 5 or more Children | 0 (0.0%) | 0 (0.0%) |
| Total | 21 (100.0%) | 19 (100.0%) |
Income Below Poverty Among Married-Couple vs Single-Parent Households in Butterfield
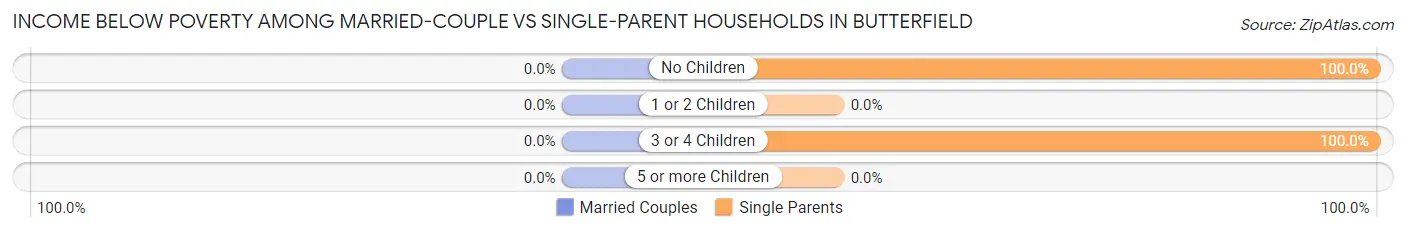
| Children | Married-Couple Families | Single-Parent Households |
| No Children | 0 (0.0%) | 21 (100.0%) |
| 1 or 2 Children | 0 (0.0%) | 0 (0.0%) |
| 3 or 4 Children | 0 (0.0%) | 19 (100.0%) |
| 5 or more Children | 0 (0.0%) | 0 (0.0%) |
| Total | 0 (0.0%) | 40 (100.0%) |
Race in Butterfield
The most populous races in Butterfield are Hispanic or Latino (214 | 94.7%), White / Caucasian (142 | 62.8%), and Some other Race (47 | 20.8%).
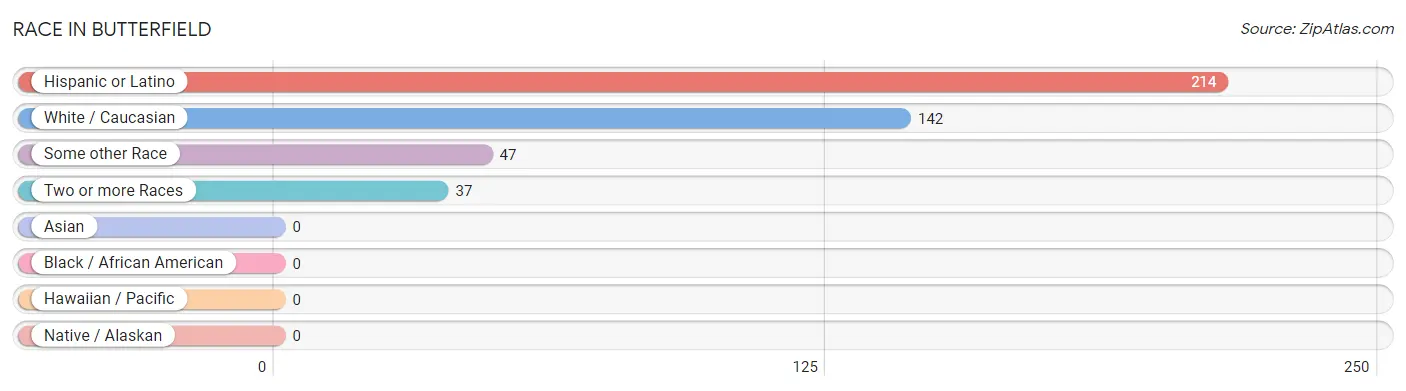
| Race | # Population | % Population |
| Asian | 0 | 0.0% |
| Black / African American | 0 | 0.0% |
| Hawaiian / Pacific | 0 | 0.0% |
| Hispanic or Latino | 214 | 94.7% |
| Native / Alaskan | 0 | 0.0% |
| White / Caucasian | 142 | 62.8% |
| Two or more Races | 37 | 16.4% |
| Some other Race | 47 | 20.8% |
| Total | 226 | 100.0% |
Ancestry in Butterfield
The most populous ancestries reported in Butterfield are Mexican (214 | 94.7%), German (6 | 2.6%), and Irish (3 | 1.3%), together accounting for 98.7% of all Butterfield residents.
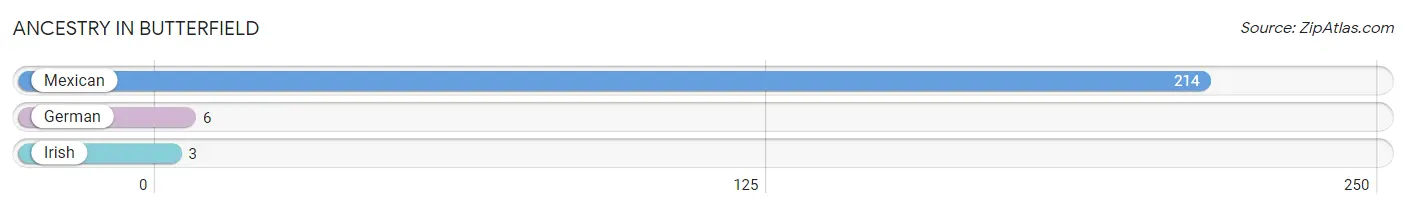
| Ancestry | # Population | % Population |
| German | 6 | 2.6% |
| Irish | 3 | 1.3% |
| Mexican | 214 | 94.7% | View All 3 Rows |
Immigrants in Butterfield
The most numerous immigrant groups reported in Butterfield came from Central America (89 | 39.4%), Latin America (89 | 39.4%), and Mexico (89 | 39.4%), together accounting for 118.1% of all Butterfield residents.
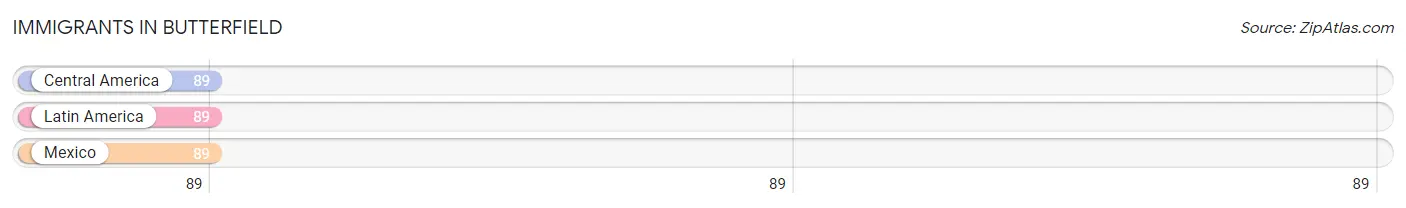
| Immigration Origin | # Population | % Population |
| Central America | 89 | 39.4% |
| Latin America | 89 | 39.4% |
| Mexico | 89 | 39.4% | View All 3 Rows |
Sex and Age in Butterfield
Sex and Age in Butterfield
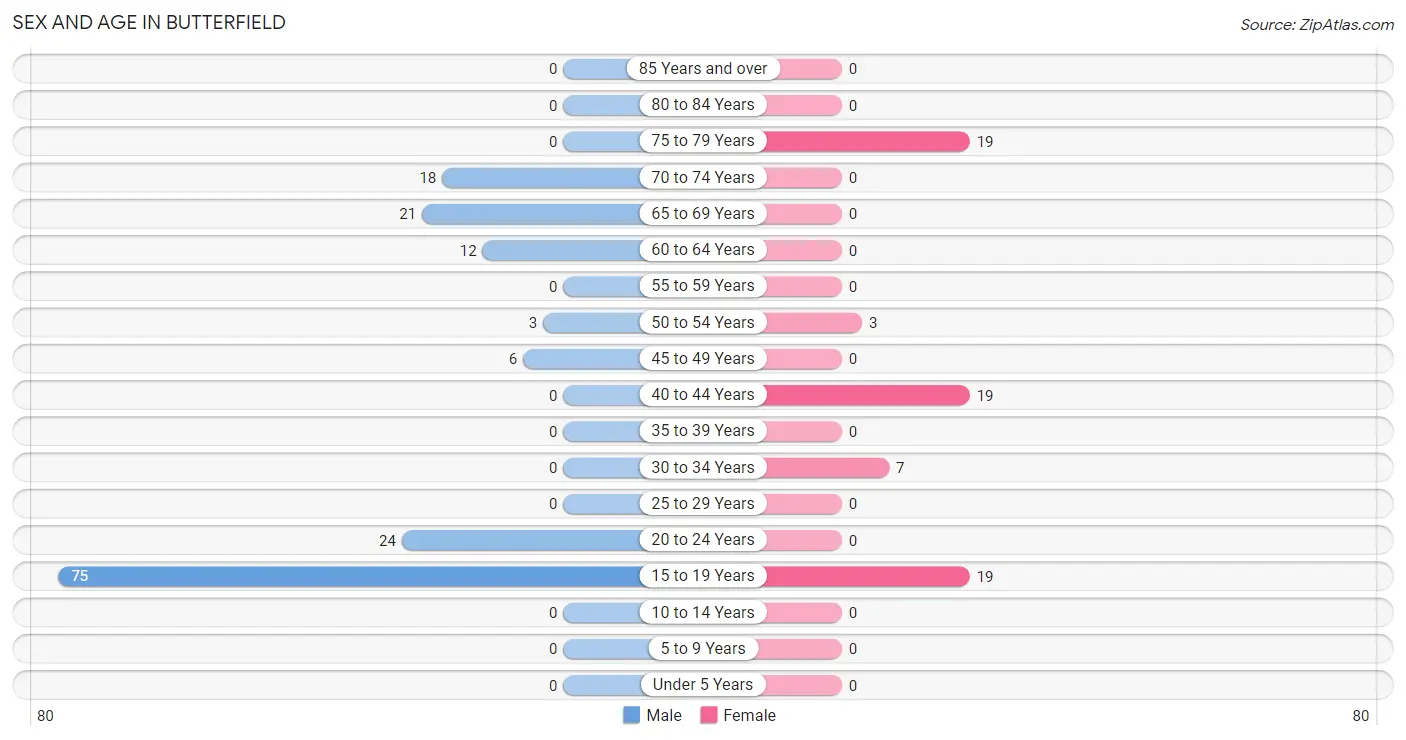
The most populous age groups in Butterfield are 15 to 19 Years (75 | 47.2%) for men and 15 to 19 Years (19 | 28.4%) for women.
| Age Bracket | Male | Female |
| Under 5 Years | 0 (0.0%) | 0 (0.0%) |
| 5 to 9 Years | 0 (0.0%) | 0 (0.0%) |
| 10 to 14 Years | 0 (0.0%) | 0 (0.0%) |
| 15 to 19 Years | 75 (47.2%) | 19 (28.4%) |
| 20 to 24 Years | 24 (15.1%) | 0 (0.0%) |
| 25 to 29 Years | 0 (0.0%) | 0 (0.0%) |
| 30 to 34 Years | 0 (0.0%) | 7 (10.4%) |
| 35 to 39 Years | 0 (0.0%) | 0 (0.0%) |
| 40 to 44 Years | 0 (0.0%) | 19 (28.4%) |
| 45 to 49 Years | 6 (3.8%) | 0 (0.0%) |
| 50 to 54 Years | 3 (1.9%) | 3 (4.5%) |
| 55 to 59 Years | 0 (0.0%) | 0 (0.0%) |
| 60 to 64 Years | 12 (7.5%) | 0 (0.0%) |
| 65 to 69 Years | 21 (13.2%) | 0 (0.0%) |
| 70 to 74 Years | 18 (11.3%) | 0 (0.0%) |
| 75 to 79 Years | 0 (0.0%) | 19 (28.4%) |
| 80 to 84 Years | 0 (0.0%) | 0 (0.0%) |
| 85 Years and over | 0 (0.0%) | 0 (0.0%) |
| Total | 159 (100.0%) | 67 (100.0%) |
Families and Households in Butterfield
Median Family Size in Butterfield
The median family size in Butterfield is 3.30 persons per family, with single female/mother families (19 | 31.1%) accounting for the largest median family size of 6.53 persons per family. On the other hand, single male/father families (21 | 34.4%) represent the smallest median family size with 1.62 persons per family.
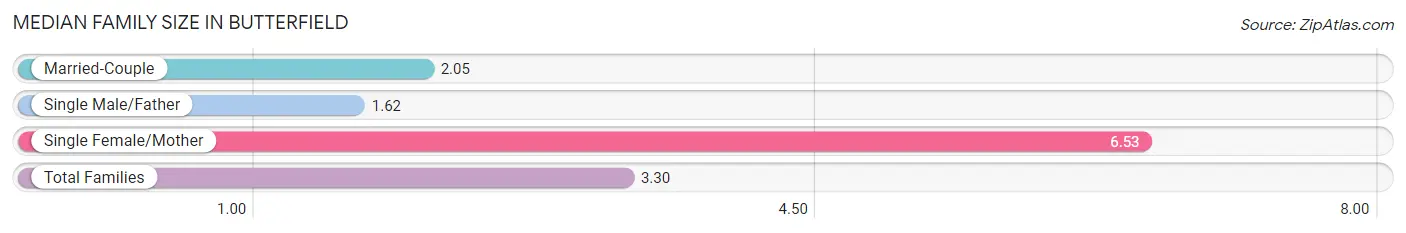
| Family Type | # Families | Family Size |
| Married-Couple | 21 (34.4%) | 2.05 |
| Single Male/Father | 21 (34.4%) | 1.62 |
| Single Female/Mother | 19 (31.1%) | 6.53 |
| Total Families | 61 (100.0%) | 3.30 |
Median Household Size in Butterfield
The median household size in Butterfield is 3.10 persons per household, with single female/mother households (19 | 26.0%) accounting for the largest median household size of 6.53 persons per household. single male/father households (21 | 28.8%) represent the smallest median household size with 1.62 persons per household.
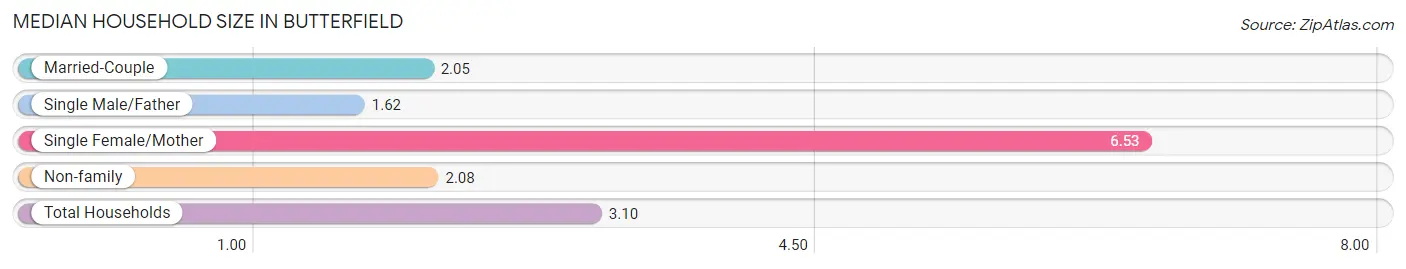
| Household Type | # Households | Household Size |
| Married-Couple | 21 (28.8%) | 2.05 |
| Single Male/Father | 21 (28.8%) | 1.62 |
| Single Female/Mother | 19 (26.0%) | 6.53 |
| Non-family | 12 (16.4%) | 2.08 |
| Total Households | 73 (100.0%) | 3.10 |
Household Size by Marriage Status in Butterfield
Out of a total of 73 households in Butterfield, 61 (83.6%) are family households, while 12 (16.4%) are nonfamily households. The most numerous type of family households are 2-person households, comprising 42, and the most common type of nonfamily households are 1-person households, comprising 6.
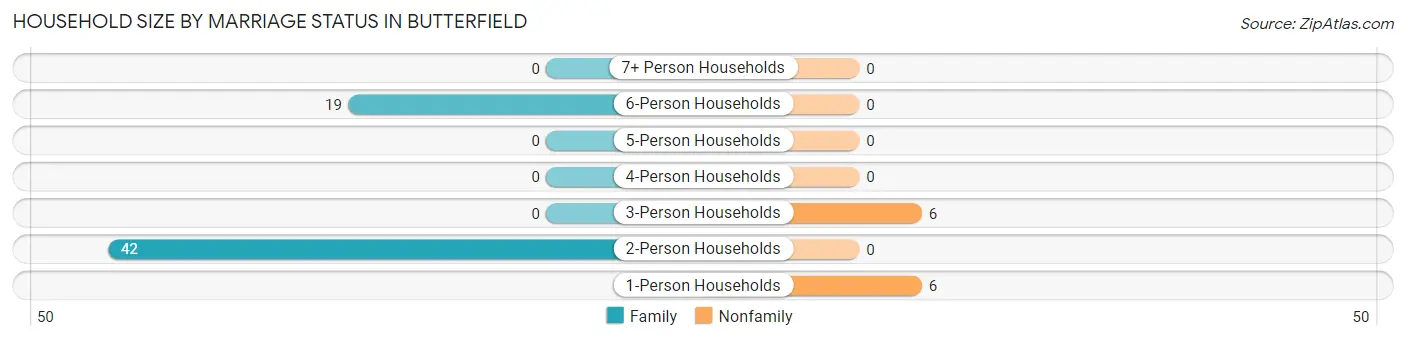
| Household Size | Family Households | Nonfamily Households |
| 1-Person Households | - | 6 (8.2%) |
| 2-Person Households | 42 (57.5%) | 0 (0.0%) |
| 3-Person Households | 0 (0.0%) | 6 (8.2%) |
| 4-Person Households | 0 (0.0%) | 0 (0.0%) |
| 5-Person Households | 0 (0.0%) | 0 (0.0%) |
| 6-Person Households | 19 (26.0%) | 0 (0.0%) |
| 7+ Person Households | 0 (0.0%) | 0 (0.0%) |
| Total | 61 (83.6%) | 12 (16.4%) |
Female Fertility in Butterfield
Fertility by Age in Butterfield

| Age Bracket | Women with Births | Births / 1,000 Women |
| 15 to 19 years | 0 (0.0%) | 0.0 |
| 20 to 34 years | 0 (0.0%) | 0.0 |
| 35 to 50 years | 0 (0.0%) | 0.0 |
| Total | 0 (0.0%) | 0.0 |
Fertility by Age by Marriage Status in Butterfield
| Age Bracket | Married | Unmarried |
| 15 to 19 years | 0 (0.0%) | 0 (0.0%) |
| 20 to 34 years | 0 (0.0%) | 0 (0.0%) |
| 35 to 50 years | 0 (0.0%) | 0 (0.0%) |
| Total | 0 (0.0%) | 0 (0.0%) |
Fertility by Education in Butterfield
| Educational Attainment | Women with Births | Births / 1,000 Women |
| Less than High School | 0 (0.0%) | 0.0 |
| High School Diploma | 0 (0.0%) | 0.0 |
| College or Associate's Degree | 0 (0.0%) | 0.0 |
| Bachelor's Degree | 0 (0.0%) | 0.0 |
| Graduate Degree | 0 (0.0%) | 0.0 |
| Total | 0 (0.0%) | 0.0 |
Fertility by Education by Marriage Status in Butterfield
| Educational Attainment | Married | Unmarried |
| Less than High School | 0 (0.0%) | 0 (0.0%) |
| High School Diploma | 0 (0.0%) | 0 (0.0%) |
| College or Associate's Degree | 0 (0.0%) | 0 (0.0%) |
| Bachelor's Degree | 0 (0.0%) | 0 (0.0%) |
| Graduate Degree | 0 (0.0%) | 0 (0.0%) |
| Total | 0 (0.0%) | 0 (0.0%) |
Employment Characteristics in Butterfield
Employment by Class of Employer in Butterfield
Among the 74 employed individuals in Butterfield, private company employees (29 | 39.2%), state government employees (24 | 32.4%), and self-employed (not incorporated) (18 | 24.3%) make up the most common classes of employment.
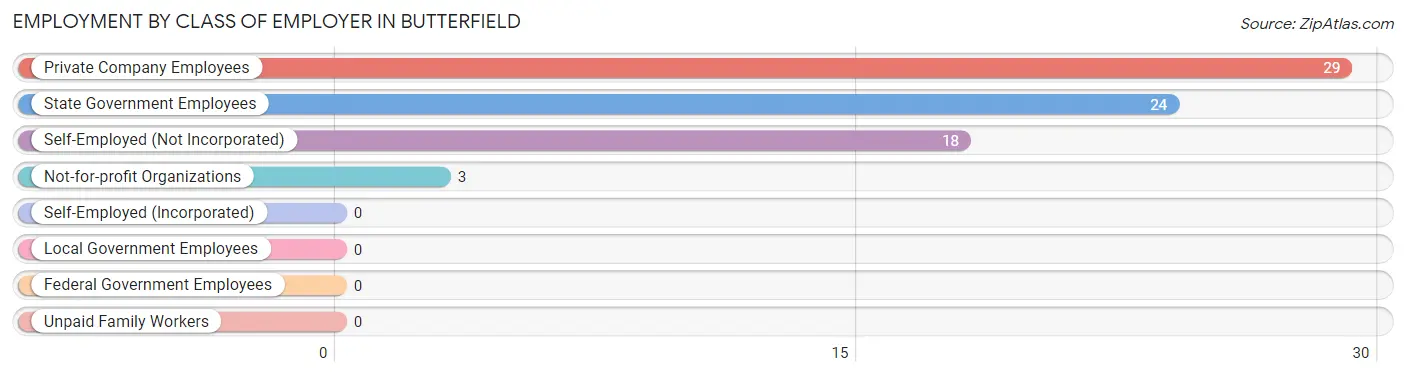
| Employer Class | # Employees | % Employees |
| Private Company Employees | 29 | 39.2% |
| Self-Employed (Incorporated) | 0 | 0.0% |
| Self-Employed (Not Incorporated) | 18 | 24.3% |
| Not-for-profit Organizations | 3 | 4.1% |
| Local Government Employees | 0 | 0.0% |
| State Government Employees | 24 | 32.4% |
| Federal Government Employees | 0 | 0.0% |
| Unpaid Family Workers | 0 | 0.0% |
| Total | 74 | 100.0% |
Employment Status by Age in Butterfield
According to the labor force statistics for Butterfield, out of the total population over 16 years of age (187), 46.5% or 87 individuals are in the labor force, with 14.9% or 13 of them unemployed. The age group with the highest labor force participation rate is 20 to 24 years, with 100.0% or 24 individuals in the labor force. Within the labor force, the 16 to 19 years age range has the highest percentage of unemployed individuals, with 40.6% or 13 of them being unemployed.
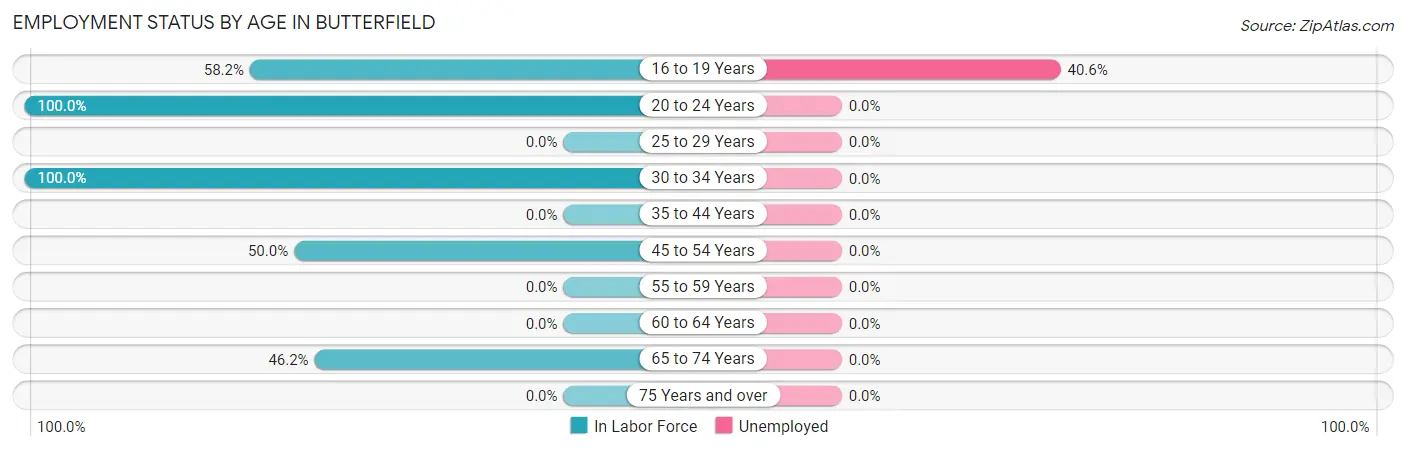
| Age Bracket | In Labor Force | Unemployed |
| 16 to 19 Years | 32 (58.2%) | 13 (40.6%) |
| 20 to 24 Years | 24 (100.0%) | 0 (0.0%) |
| 25 to 29 Years | 0 (0.0%) | 0 (0.0%) |
| 30 to 34 Years | 7 (100.0%) | 0 (0.0%) |
| 35 to 44 Years | 0 (0.0%) | 0 (0.0%) |
| 45 to 54 Years | 6 (50.0%) | 0 (0.0%) |
| 55 to 59 Years | 0 (0.0%) | 0 (0.0%) |
| 60 to 64 Years | 0 (0.0%) | 0 (0.0%) |
| 65 to 74 Years | 18 (46.2%) | 0 (0.0%) |
| 75 Years and over | 0 (0.0%) | 0 (0.0%) |
| Total | 87 (46.5%) | 13 (14.9%) |
Employment Status by Educational Attainment in Butterfield
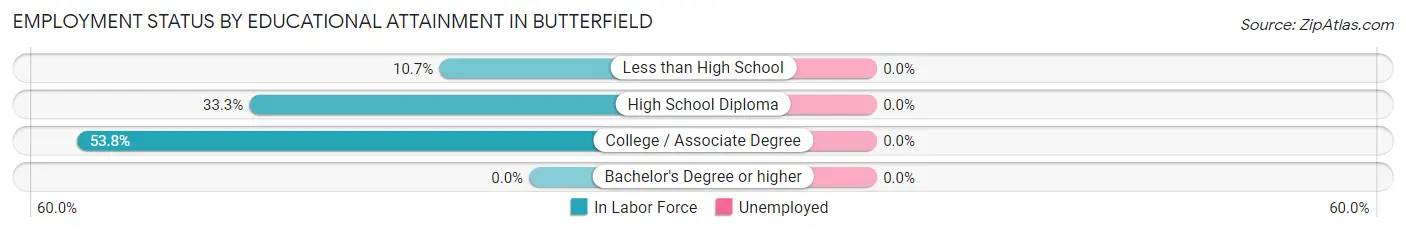
| Educational Attainment | In Labor Force | Unemployed |
| Less than High School | 3 (10.7%) | 0 (0.0%) |
| High School Diploma | 3 (33.3%) | 0 (0.0%) |
| College / Associate Degree | 7 (53.8%) | 0 (0.0%) |
| Bachelor's Degree or higher | 0 (0.0%) | 0 (0.0%) |
| Total | 13 (26.0%) | 0 (0.0%) |
Employment Occupations by Sex in Butterfield
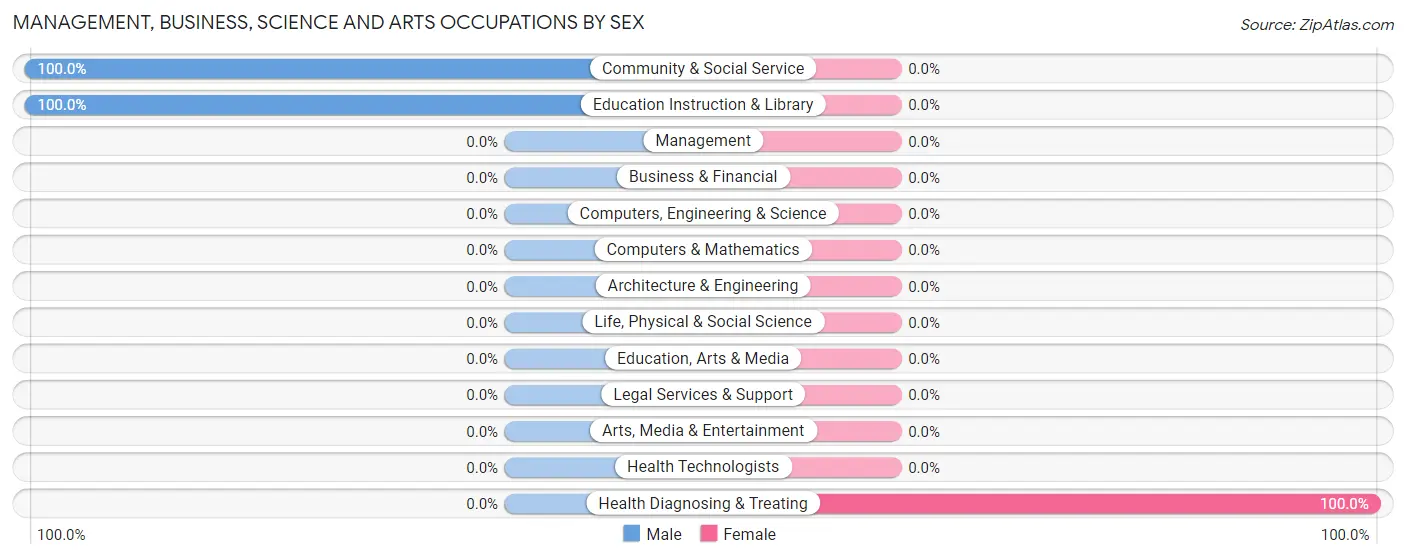
Management, Business, Science and Arts Occupations
The most common Management, Business, Science and Arts occupations in Butterfield are Community & Social Service (24 | 32.4%), Education Instruction & Library (24 | 32.4%), and Health Diagnosing & Treating (3 | 4.1%).
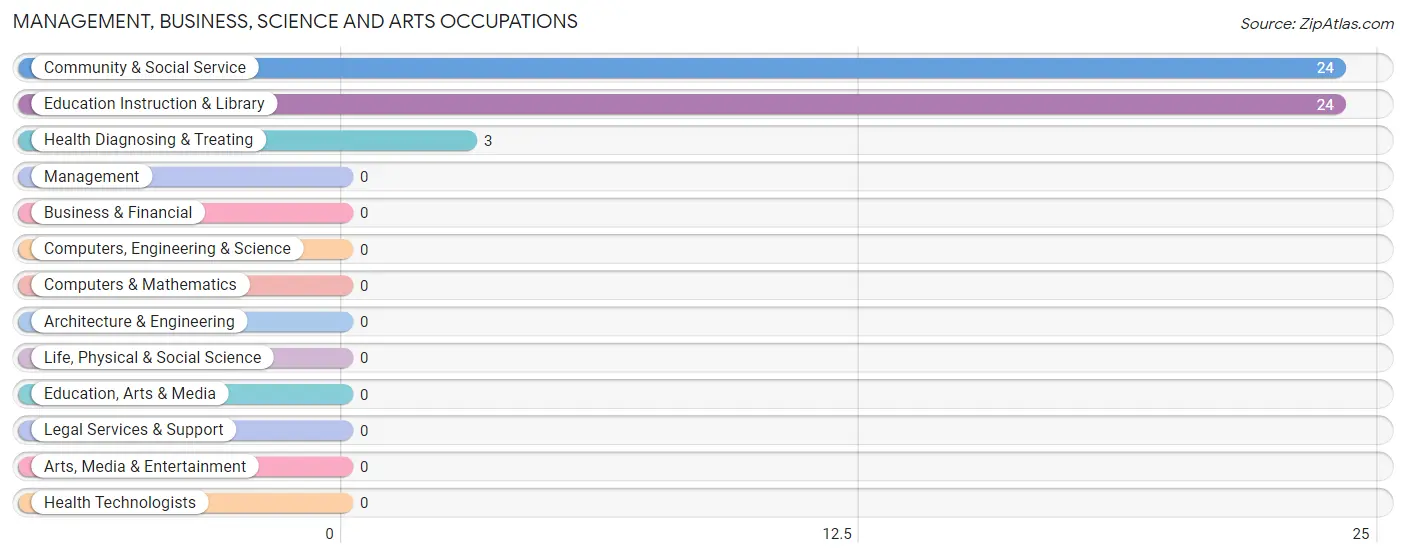
Management, Business, Science and Arts Occupations by Sex
| Occupation | Male | Female |
| Management | 0 (0.0%) | 0 (0.0%) |
| Business & Financial | 0 (0.0%) | 0 (0.0%) |
| Computers, Engineering & Science | 0 (0.0%) | 0 (0.0%) |
| Computers & Mathematics | 0 (0.0%) | 0 (0.0%) |
| Architecture & Engineering | 0 (0.0%) | 0 (0.0%) |
| Life, Physical & Social Science | 0 (0.0%) | 0 (0.0%) |
| Community & Social Service | 24 (100.0%) | 0 (0.0%) |
| Education, Arts & Media | 0 (0.0%) | 0 (0.0%) |
| Legal Services & Support | 0 (0.0%) | 0 (0.0%) |
| Education Instruction & Library | 24 (100.0%) | 0 (0.0%) |
| Arts, Media & Entertainment | 0 (0.0%) | 0 (0.0%) |
| Health Diagnosing & Treating | 0 (0.0%) | 3 (100.0%) |
| Health Technologists | 0 (0.0%) | 0 (0.0%) |
| Total (Category) | 24 (88.9%) | 3 (11.1%) |
| Total (Overall) | 64 (86.5%) | 10 (13.5%) |
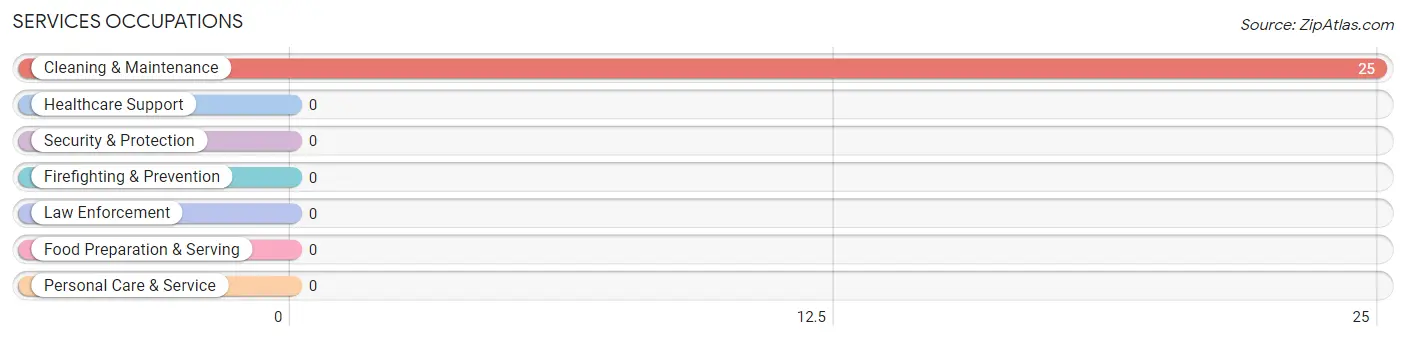
Services Occupations
The most common Services occupations in Butterfield are , and Cleaning & Maintenance (25 | 33.8%).
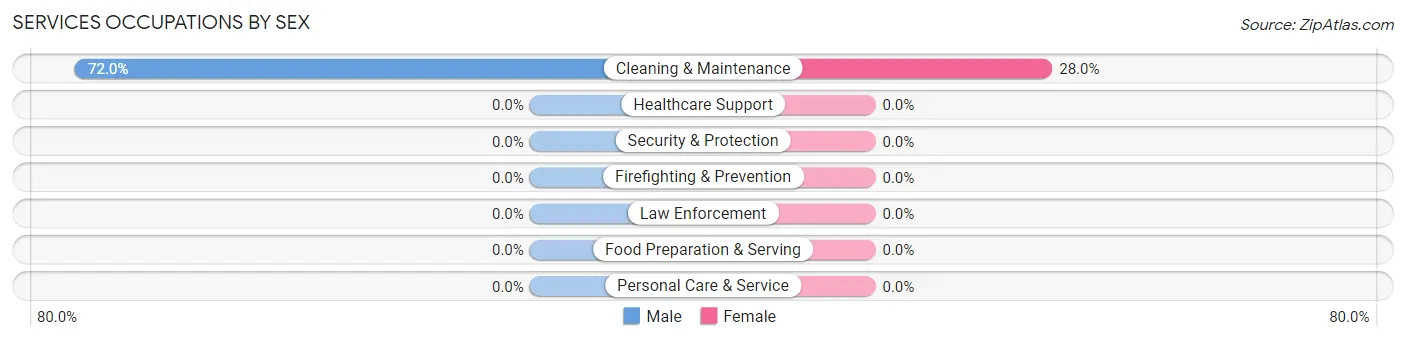
Services Occupations by Sex
| Occupation | Male | Female |
| Healthcare Support | 0 (0.0%) | 0 (0.0%) |
| Security & Protection | 0 (0.0%) | 0 (0.0%) |
| Firefighting & Prevention | 0 (0.0%) | 0 (0.0%) |
| Law Enforcement | 0 (0.0%) | 0 (0.0%) |
| Food Preparation & Serving | 0 (0.0%) | 0 (0.0%) |
| Cleaning & Maintenance | 18 (72.0%) | 7 (28.0%) |
| Personal Care & Service | 0 (0.0%) | 0 (0.0%) |
| Total (Category) | 18 (72.0%) | 7 (28.0%) |
| Total (Overall) | 64 (86.5%) | 10 (13.5%) |
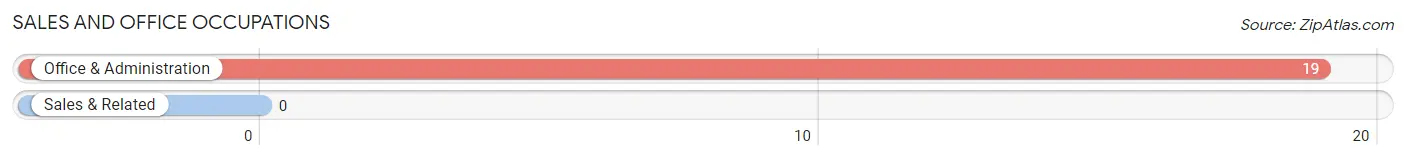
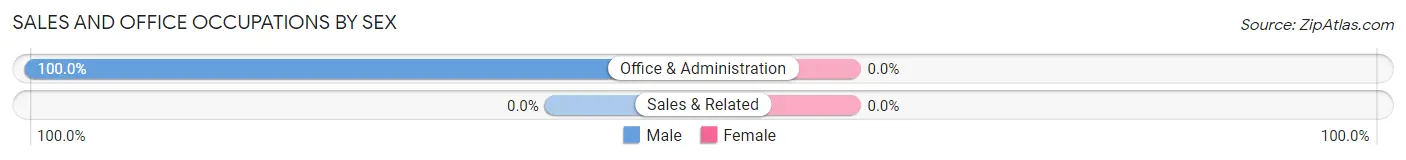
Sales and Office Occupations
The most common Sales and Office occupations in Butterfield are , and Office & Administration (19 | 25.7%).
Sales and Office Occupations by Sex
| Occupation | Male | Female |
| Sales & Related | 0 (0.0%) | 0 (0.0%) |
| Office & Administration | 19 (100.0%) | 0 (0.0%) |
| Total (Category) | 19 (100.0%) | 0 (0.0%) |
| Total (Overall) | 64 (86.5%) | 10 (13.5%) |
Natural Resources, Construction and Maintenance Occupations
The most common Natural Resources, Construction and Maintenance occupations in Butterfield are , and Installation, Maintenance & Repair (3 | 4.1%).
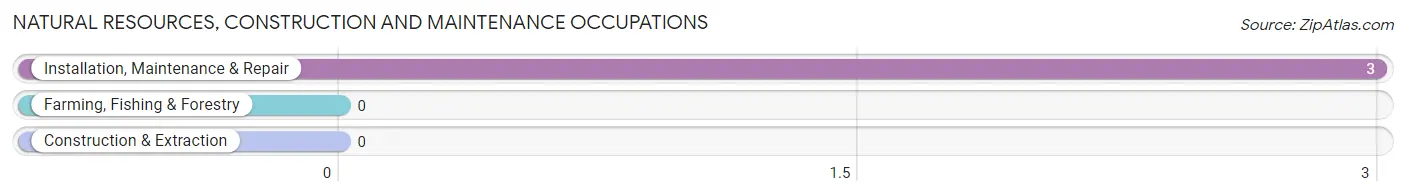
Natural Resources, Construction and Maintenance Occupations by Sex
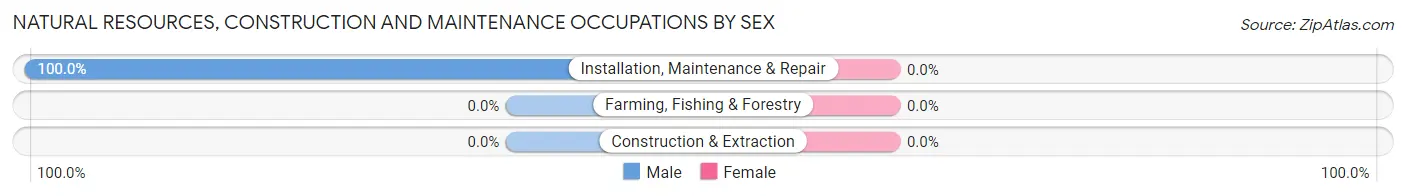
| Occupation | Male | Female |
| Farming, Fishing & Forestry | 0 (0.0%) | 0 (0.0%) |
| Construction & Extraction | 0 (0.0%) | 0 (0.0%) |
| Installation, Maintenance & Repair | 3 (100.0%) | 0 (0.0%) |
| Total (Category) | 3 (100.0%) | 0 (0.0%) |
| Total (Overall) | 64 (86.5%) | 10 (13.5%) |
Production, Transportation and Moving Occupations
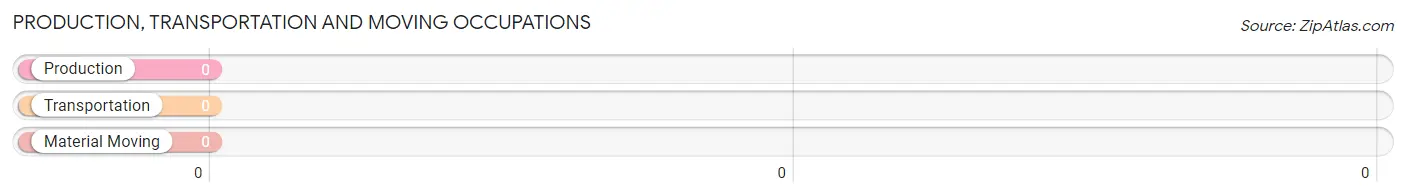
Production, Transportation and Moving Occupations by Sex
| Occupation | Male | Female |
| Production | 0 (0.0%) | 0 (0.0%) |
| Transportation | 0 (0.0%) | 0 (0.0%) |
| Material Moving | 0 (0.0%) | 0 (0.0%) |
| Total (Category) | 0 (0.0%) | 0 (0.0%) |
| Total (Overall) | 64 (86.5%) | 10 (13.5%) |
Employment Industries by Sex in Butterfield
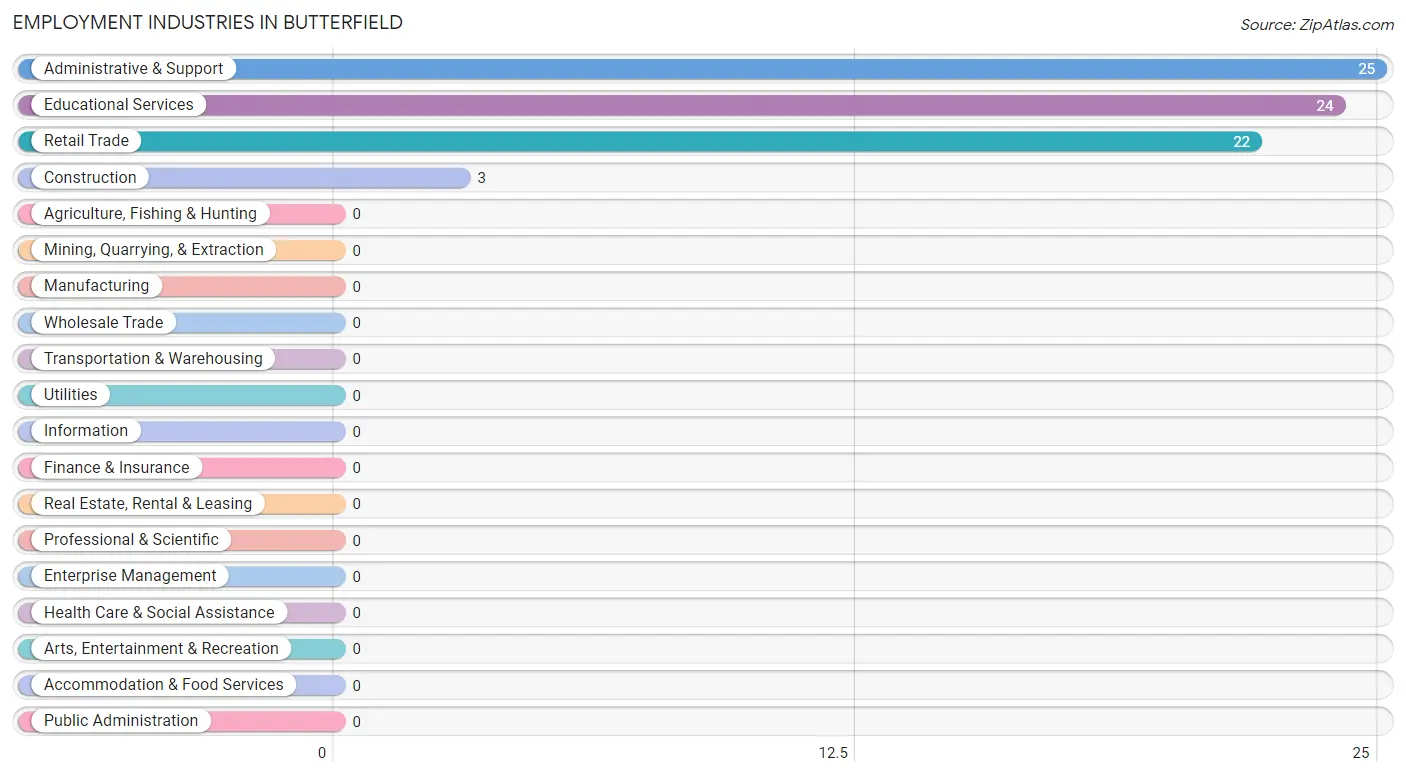
Employment Industries in Butterfield
The major employment industries in Butterfield include Administrative & Support (25 | 33.8%), Educational Services (24 | 32.4%), Retail Trade (22 | 29.7%), and Construction (3 | 4.1%).
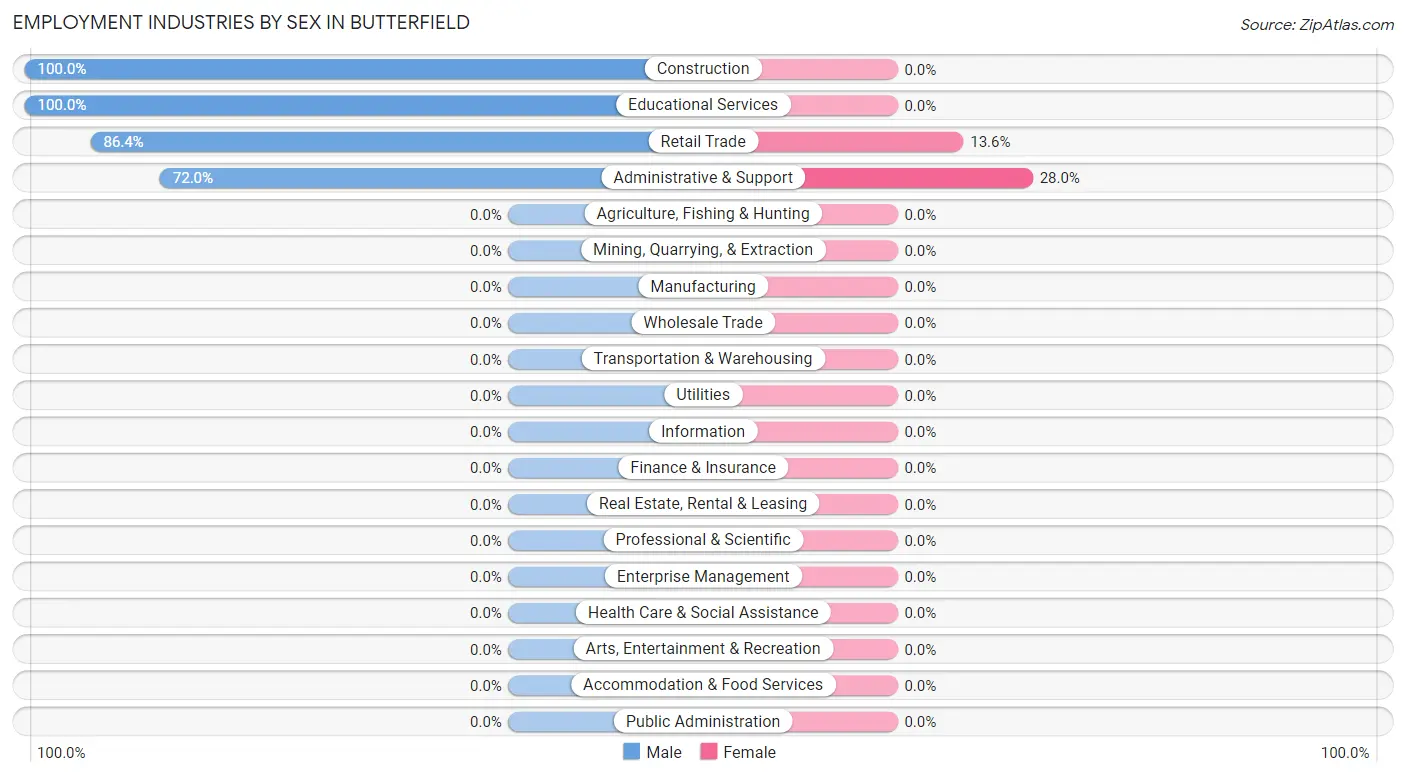
Employment Industries by Sex in Butterfield
The Butterfield industries that see more men than women are Construction (100.0%), Educational Services (100.0%), and Retail Trade (86.4%), whereas the industries that tend to have a higher number of women are Administrative & Support (28.0%), and Retail Trade (13.6%).
| Industry | Male | Female |
| Agriculture, Fishing & Hunting | 0 (0.0%) | 0 (0.0%) |
| Mining, Quarrying, & Extraction | 0 (0.0%) | 0 (0.0%) |
| Construction | 3 (100.0%) | 0 (0.0%) |
| Manufacturing | 0 (0.0%) | 0 (0.0%) |
| Wholesale Trade | 0 (0.0%) | 0 (0.0%) |
| Retail Trade | 19 (86.4%) | 3 (13.6%) |
| Transportation & Warehousing | 0 (0.0%) | 0 (0.0%) |
| Utilities | 0 (0.0%) | 0 (0.0%) |
| Information | 0 (0.0%) | 0 (0.0%) |
| Finance & Insurance | 0 (0.0%) | 0 (0.0%) |
| Real Estate, Rental & Leasing | 0 (0.0%) | 0 (0.0%) |
| Professional & Scientific | 0 (0.0%) | 0 (0.0%) |
| Enterprise Management | 0 (0.0%) | 0 (0.0%) |
| Administrative & Support | 18 (72.0%) | 7 (28.0%) |
| Educational Services | 24 (100.0%) | 0 (0.0%) |
| Health Care & Social Assistance | 0 (0.0%) | 0 (0.0%) |
| Arts, Entertainment & Recreation | 0 (0.0%) | 0 (0.0%) |
| Accommodation & Food Services | 0 (0.0%) | 0 (0.0%) |
| Public Administration | 0 (0.0%) | 0 (0.0%) |
| Total | 64 (86.5%) | 10 (13.5%) |
Education in Butterfield
School Enrollment in Butterfield
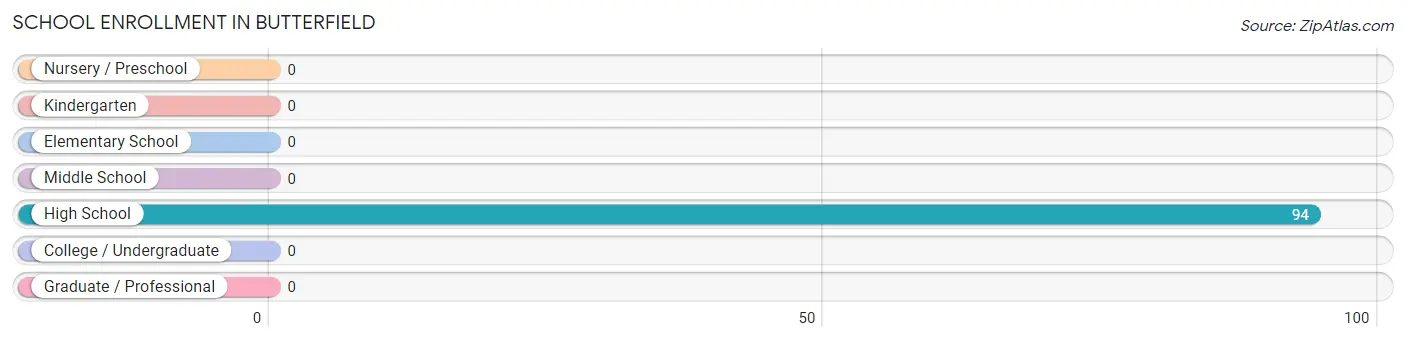
| School Level | # Students | % Students |
| Nursery / Preschool | 0 | 0.0% |
| Kindergarten | 0 | 0.0% |
| Elementary School | 0 | 0.0% |
| Middle School | 0 | 0.0% |
| High School | 94 | 100.0% |
| College / Undergraduate | 0 | 0.0% |
| Graduate / Professional | 0 | 0.0% |
| Total | 94 | 100.0% |
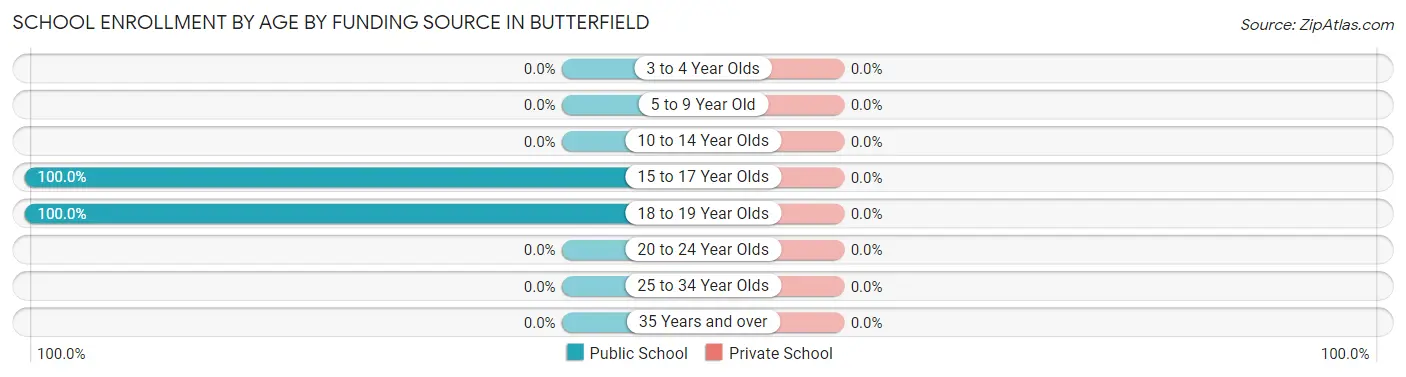
School Enrollment by Age by Funding Source in Butterfield
| Age Bracket | Public School | Private School |
| 3 to 4 Year Olds | 0 (0.0%) | 0 (0.0%) |
| 5 to 9 Year Old | 0 (0.0%) | 0 (0.0%) |
| 10 to 14 Year Olds | 0 (0.0%) | 0 (0.0%) |
| 15 to 17 Year Olds | 58 (100.0%) | 0 (0.0%) |
| 18 to 19 Year Olds | 36 (100.0%) | 0 (0.0%) |
| 20 to 24 Year Olds | 0 (0.0%) | 0 (0.0%) |
| 25 to 34 Year Olds | 0 (0.0%) | 0 (0.0%) |
| 35 Years and over | 0 (0.0%) | 0 (0.0%) |
| Total | 94 (100.0%) | 0 (0.0%) |
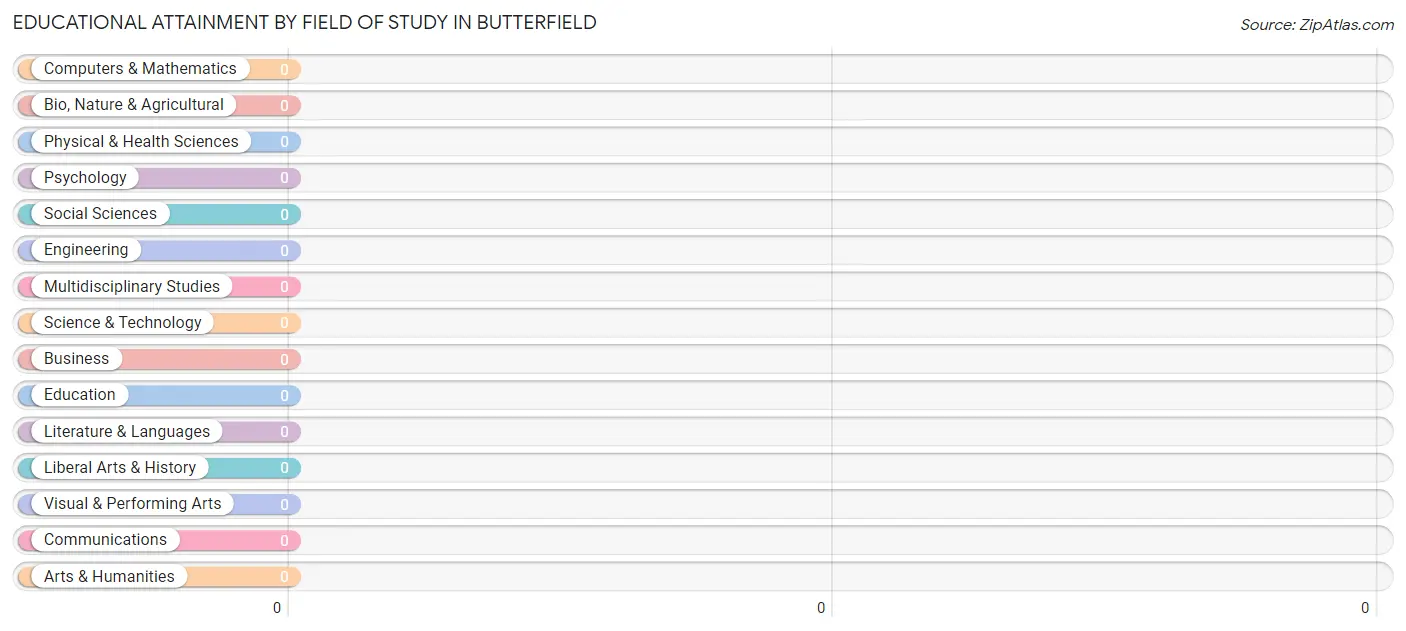
Educational Attainment by Field of Study in Butterfield
| Field of Study | # Graduates | % Graduates |
| Computers & Mathematics | 0 | 0.0% |
| Bio, Nature & Agricultural | 0 | 0.0% |
| Physical & Health Sciences | 0 | 0.0% |
| Psychology | 0 | 0.0% |
| Social Sciences | 0 | 0.0% |
| Engineering | 0 | 0.0% |
| Multidisciplinary Studies | 0 | 0.0% |
| Science & Technology | 0 | 0.0% |
| Business | 0 | 0.0% |
| Education | 0 | 0.0% |
| Literature & Languages | 0 | 0.0% |
| Liberal Arts & History | 0 | 0.0% |
| Visual & Performing Arts | 0 | 0.0% |
| Communications | 0 | 0.0% |
| Arts & Humanities | 0 | 0.0% |
| Total | 0 | 0.0% |
Transportation & Commute in Butterfield
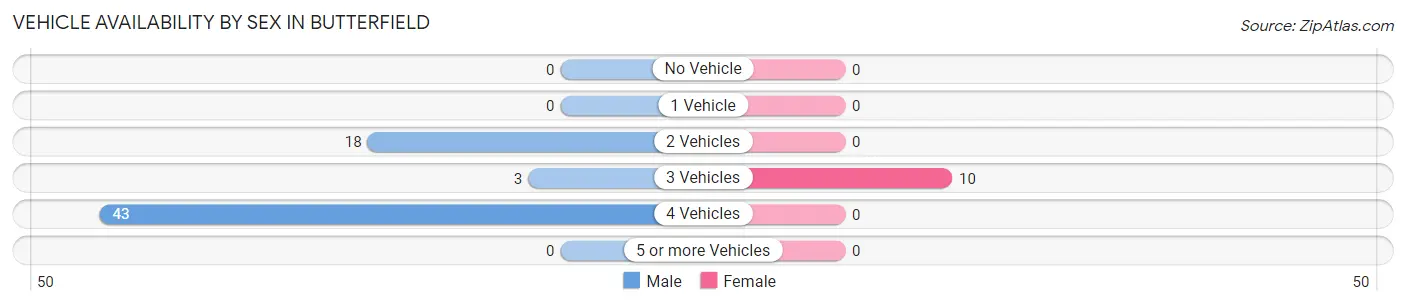
Vehicle Availability by Sex in Butterfield
The most prevalent vehicle ownership categories in Butterfield are males with 4 vehicles (43, accounting for 67.2%) and females with 4 vehicles (0, making up 430.0%).
| Vehicles Available | Male | Female |
| No Vehicle | 0 (0.0%) | 0 (0.0%) |
| 1 Vehicle | 0 (0.0%) | 0 (0.0%) |
| 2 Vehicles | 18 (28.1%) | 0 (0.0%) |
| 3 Vehicles | 3 (4.7%) | 10 (100.0%) |
| 4 Vehicles | 43 (67.2%) | 0 (0.0%) |
| 5 or more Vehicles | 0 (0.0%) | 0 (0.0%) |
| Total | 64 (100.0%) | 10 (100.0%) |
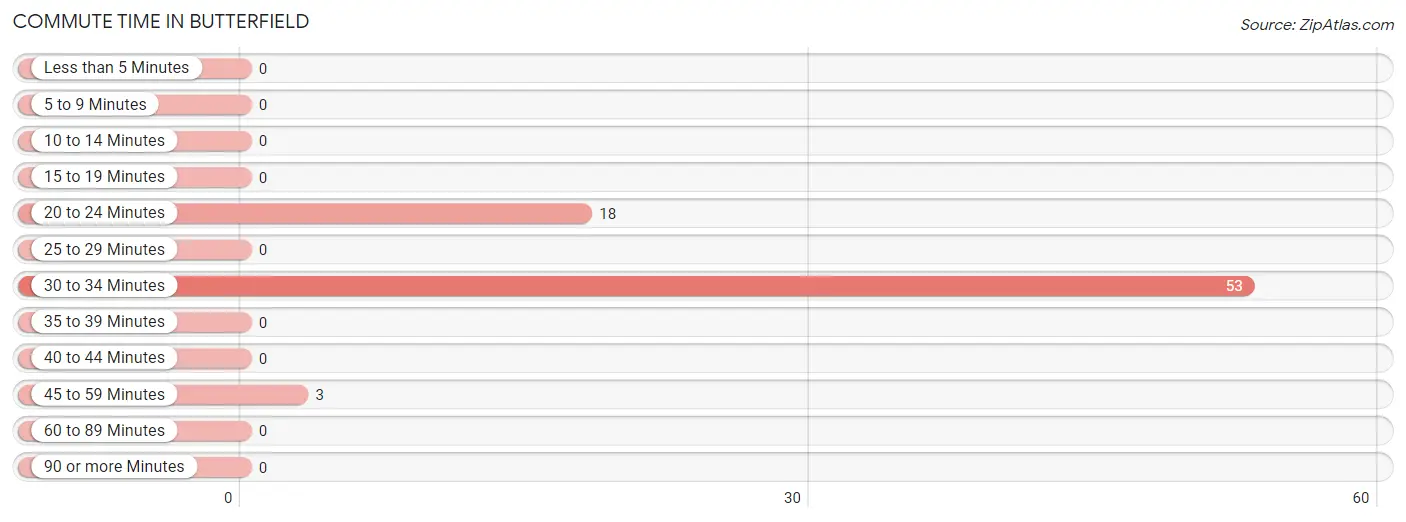
Commute Time in Butterfield
The most frequently occuring commute durations in Butterfield are 30 to 34 minutes (53 commuters, 71.6%), 20 to 24 minutes (18 commuters, 24.3%), and 45 to 59 minutes (3 commuters, 4.1%).
| Commute Time | # Commuters | % Commuters |
| Less than 5 Minutes | 0 | 0.0% |
| 5 to 9 Minutes | 0 | 0.0% |
| 10 to 14 Minutes | 0 | 0.0% |
| 15 to 19 Minutes | 0 | 0.0% |
| 20 to 24 Minutes | 18 | 24.3% |
| 25 to 29 Minutes | 0 | 0.0% |
| 30 to 34 Minutes | 53 | 71.6% |
| 35 to 39 Minutes | 0 | 0.0% |
| 40 to 44 Minutes | 0 | 0.0% |
| 45 to 59 Minutes | 3 | 4.1% |
| 60 to 89 Minutes | 0 | 0.0% |
| 90 or more Minutes | 0 | 0.0% |
Commute Time by Sex in Butterfield
The most common commute times in Butterfield are 30 to 34 minutes (46 commuters, 71.9%) for males and 30 to 34 minutes (7 commuters, 70.0%) for females.
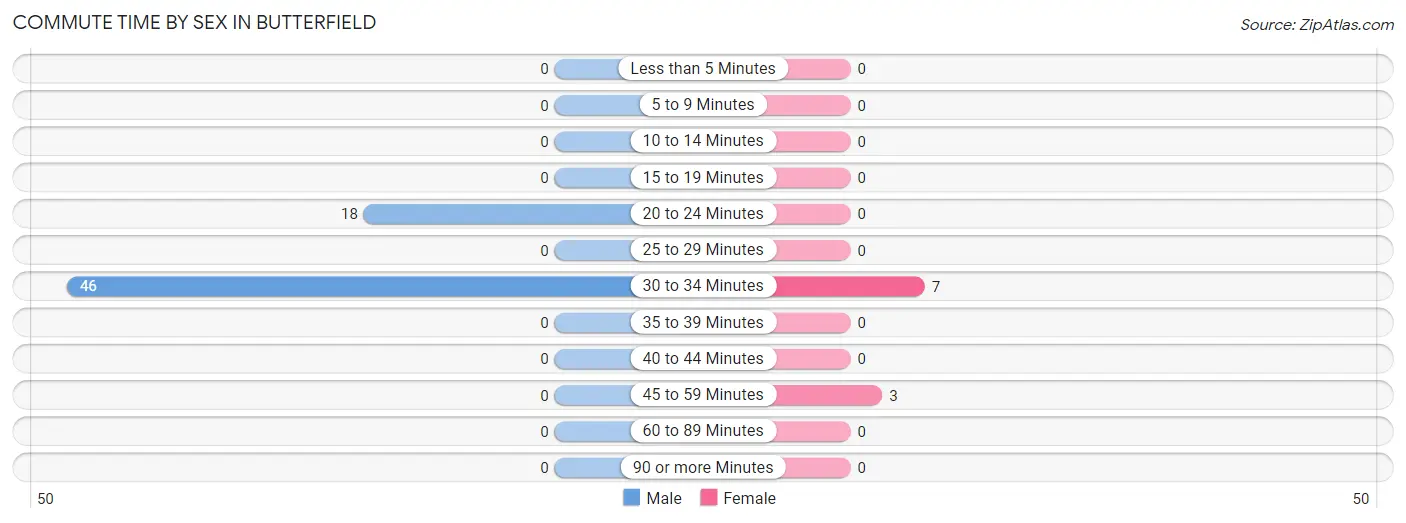
| Commute Time | Male | Female |
| Less than 5 Minutes | 0 (0.0%) | 0 (0.0%) |
| 5 to 9 Minutes | 0 (0.0%) | 0 (0.0%) |
| 10 to 14 Minutes | 0 (0.0%) | 0 (0.0%) |
| 15 to 19 Minutes | 0 (0.0%) | 0 (0.0%) |
| 20 to 24 Minutes | 18 (28.1%) | 0 (0.0%) |
| 25 to 29 Minutes | 0 (0.0%) | 0 (0.0%) |
| 30 to 34 Minutes | 46 (71.9%) | 7 (70.0%) |
| 35 to 39 Minutes | 0 (0.0%) | 0 (0.0%) |
| 40 to 44 Minutes | 0 (0.0%) | 0 (0.0%) |
| 45 to 59 Minutes | 0 (0.0%) | 3 (30.0%) |
| 60 to 89 Minutes | 0 (0.0%) | 0 (0.0%) |
| 90 or more Minutes | 0 (0.0%) | 0 (0.0%) |
Time of Departure to Work by Sex in Butterfield
The most frequent times of departure to work in Butterfield are 11:00 AM to 11:59 AM (24, 37.5%) for males and 7:00 AM to 7:29 AM (10, 100.0%) for females.
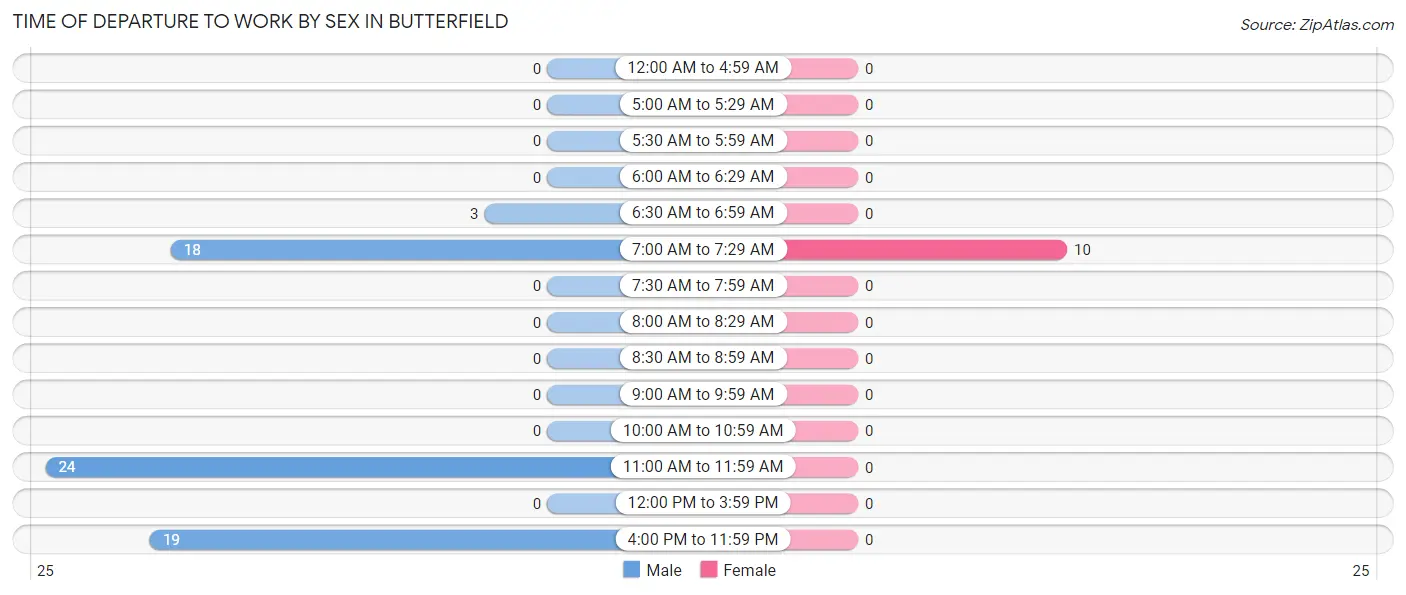
| Time of Departure | Male | Female |
| 12:00 AM to 4:59 AM | 0 (0.0%) | 0 (0.0%) |
| 5:00 AM to 5:29 AM | 0 (0.0%) | 0 (0.0%) |
| 5:30 AM to 5:59 AM | 0 (0.0%) | 0 (0.0%) |
| 6:00 AM to 6:29 AM | 0 (0.0%) | 0 (0.0%) |
| 6:30 AM to 6:59 AM | 3 (4.7%) | 0 (0.0%) |
| 7:00 AM to 7:29 AM | 18 (28.1%) | 10 (100.0%) |
| 7:30 AM to 7:59 AM | 0 (0.0%) | 0 (0.0%) |
| 8:00 AM to 8:29 AM | 0 (0.0%) | 0 (0.0%) |
| 8:30 AM to 8:59 AM | 0 (0.0%) | 0 (0.0%) |
| 9:00 AM to 9:59 AM | 0 (0.0%) | 0 (0.0%) |
| 10:00 AM to 10:59 AM | 0 (0.0%) | 0 (0.0%) |
| 11:00 AM to 11:59 AM | 24 (37.5%) | 0 (0.0%) |
| 12:00 PM to 3:59 PM | 0 (0.0%) | 0 (0.0%) |
| 4:00 PM to 11:59 PM | 19 (29.7%) | 0 (0.0%) |
| Total | 64 (100.0%) | 10 (100.0%) |
Housing Occupancy in Butterfield
Occupancy by Ownership in Butterfield
Of the total 73 dwellings in Butterfield, owner-occupied units account for 67 (91.8%), while renter-occupied units make up 6 (8.2%).
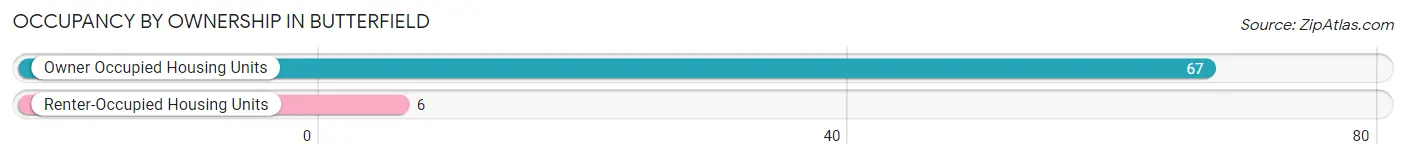
| Occupancy | # Housing Units | % Housing Units |
| Owner Occupied Housing Units | 67 | 91.8% |
| Renter-Occupied Housing Units | 6 | 8.2% |
| Total Occupied Housing Units | 73 | 100.0% |
Occupancy by Household Size in Butterfield
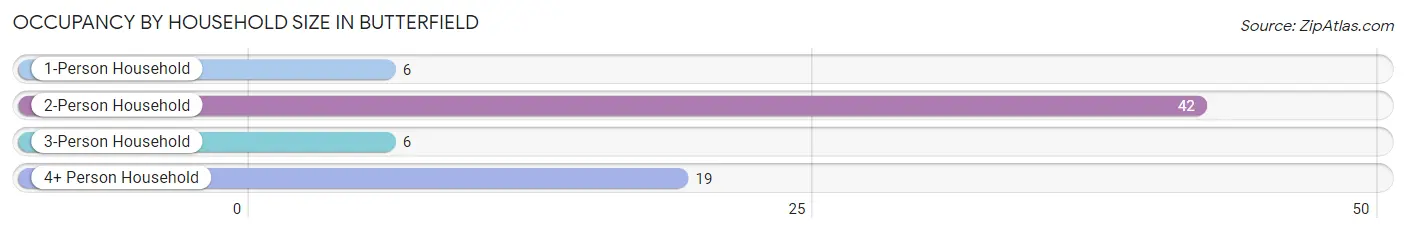
| Household Size | # Housing Units | % Housing Units |
| 1-Person Household | 6 | 8.2% |
| 2-Person Household | 42 | 57.5% |
| 3-Person Household | 6 | 8.2% |
| 4+ Person Household | 19 | 26.0% |
| Total Housing Units | 73 | 100.0% |
Occupancy by Ownership by Household Size in Butterfield
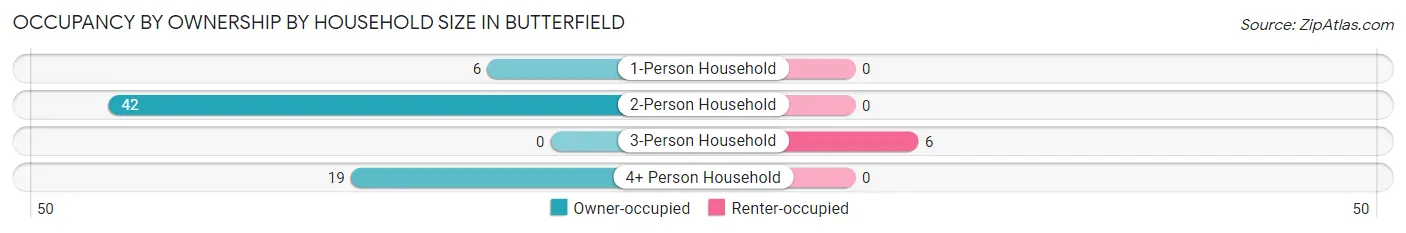
| Household Size | Owner-occupied | Renter-occupied |
| 1-Person Household | 6 (100.0%) | 0 (0.0%) |
| 2-Person Household | 42 (100.0%) | 0 (0.0%) |
| 3-Person Household | 0 (0.0%) | 6 (100.0%) |
| 4+ Person Household | 19 (100.0%) | 0 (0.0%) |
| Total Housing Units | 67 (91.8%) | 6 (8.2%) |
Occupancy by Educational Attainment in Butterfield
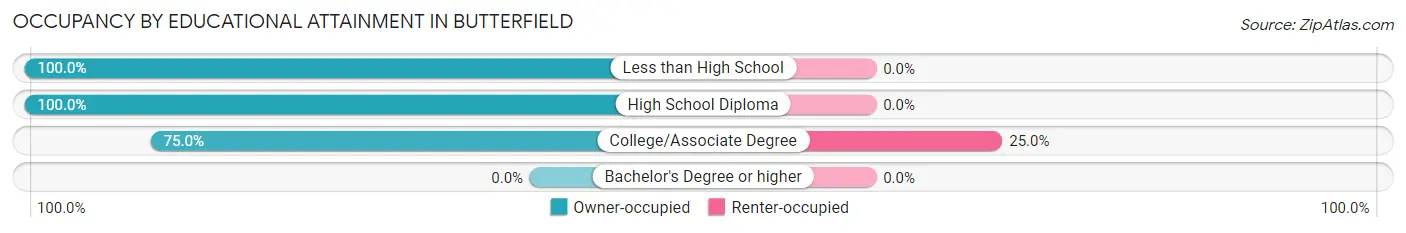
| Household Size | Owner-occupied | Renter-occupied |
| Less than High School | 28 (100.0%) | 0 (0.0%) |
| High School Diploma | 21 (100.0%) | 0 (0.0%) |
| College/Associate Degree | 18 (75.0%) | 6 (25.0%) |
| Bachelor's Degree or higher | 0 (0.0%) | 0 (0.0%) |
Occupancy by Age of Householder in Butterfield
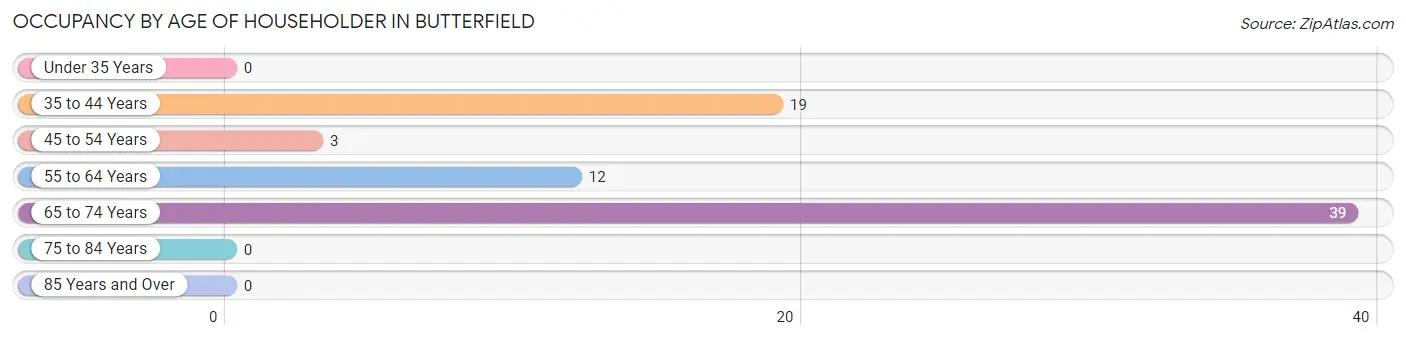
| Age Bracket | # Households | % Households |
| Under 35 Years | 0 | 0.0% |
| 35 to 44 Years | 19 | 26.0% |
| 45 to 54 Years | 3 | 4.1% |
| 55 to 64 Years | 12 | 16.4% |
| 65 to 74 Years | 39 | 53.4% |
| 75 to 84 Years | 0 | 0.0% |
| 85 Years and Over | 0 | 0.0% |
| Total | 73 | 100.0% |
Housing Finances in Butterfield
Median Income by Occupancy in Butterfield
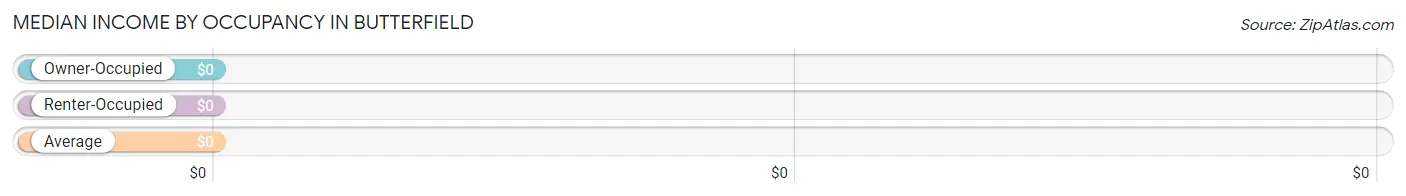
| Occupancy Type | # Households | Median Income |
| Owner-Occupied | 67 (91.8%) | $0 |
| Renter-Occupied | 6 (8.2%) | $0 |
| Average | 73 (100.0%) | $0 |
Occupancy by Householder Income Bracket in Butterfield
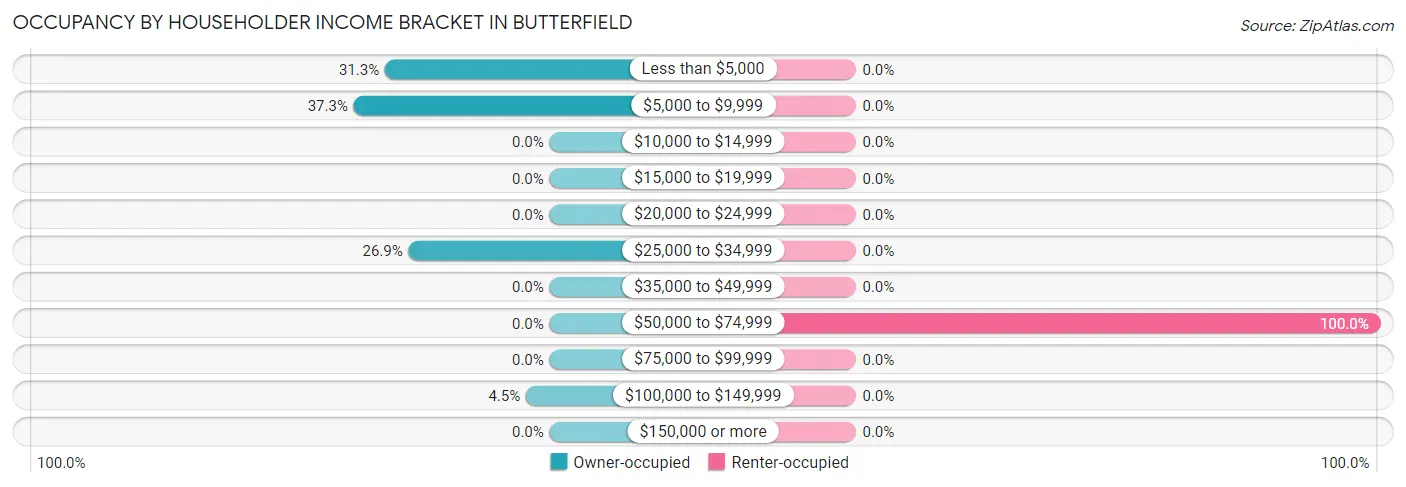
| Income Bracket | Owner-occupied | Renter-occupied |
| Less than $5,000 | 21 (31.3%) | 0 (0.0%) |
| $5,000 to $9,999 | 25 (37.3%) | 0 (0.0%) |
| $10,000 to $14,999 | 0 (0.0%) | 0 (0.0%) |
| $15,000 to $19,999 | 0 (0.0%) | 0 (0.0%) |
| $20,000 to $24,999 | 0 (0.0%) | 0 (0.0%) |
| $25,000 to $34,999 | 18 (26.9%) | 0 (0.0%) |
| $35,000 to $49,999 | 0 (0.0%) | 0 (0.0%) |
| $50,000 to $74,999 | 0 (0.0%) | 6 (100.0%) |
| $75,000 to $99,999 | 0 (0.0%) | 0 (0.0%) |
| $100,000 to $149,999 | 3 (4.5%) | 0 (0.0%) |
| $150,000 or more | 0 (0.0%) | 0 (0.0%) |
| Total | 67 (100.0%) | 6 (100.0%) |
Monthly Housing Cost Tiers in Butterfield
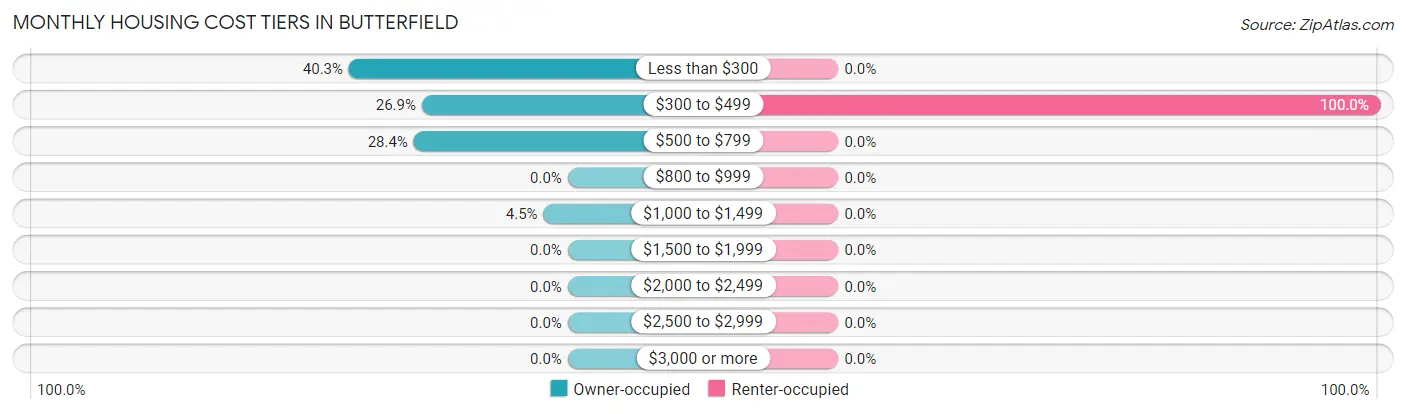
| Monthly Cost | Owner-occupied | Renter-occupied |
| Less than $300 | 27 (40.3%) | 0 (0.0%) |
| $300 to $499 | 18 (26.9%) | 6 (100.0%) |
| $500 to $799 | 19 (28.4%) | 0 (0.0%) |
| $800 to $999 | 0 (0.0%) | 0 (0.0%) |
| $1,000 to $1,499 | 3 (4.5%) | 0 (0.0%) |
| $1,500 to $1,999 | 0 (0.0%) | 0 (0.0%) |
| $2,000 to $2,499 | 0 (0.0%) | 0 (0.0%) |
| $2,500 to $2,999 | 0 (0.0%) | 0 (0.0%) |
| $3,000 or more | 0 (0.0%) | 0 (0.0%) |
| Total | 67 (100.0%) | 6 (100.0%) |
Physical Housing Characteristics in Butterfield
Housing Structures in Butterfield
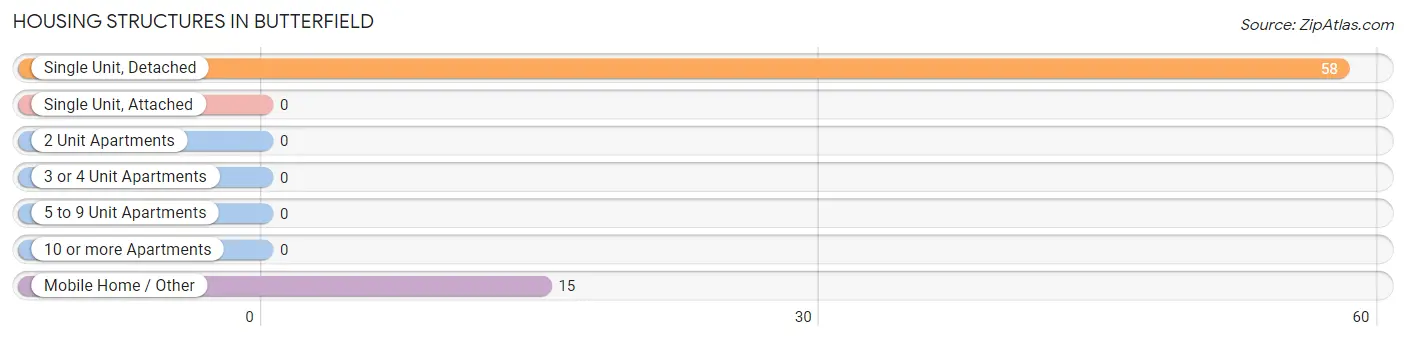
| Structure Type | # Housing Units | % Housing Units |
| Single Unit, Detached | 58 | 79.4% |
| Single Unit, Attached | 0 | 0.0% |
| 2 Unit Apartments | 0 | 0.0% |
| 3 or 4 Unit Apartments | 0 | 0.0% |
| 5 to 9 Unit Apartments | 0 | 0.0% |
| 10 or more Apartments | 0 | 0.0% |
| Mobile Home / Other | 15 | 20.5% |
| Total | 73 | 100.0% |
Housing Structures by Occupancy in Butterfield
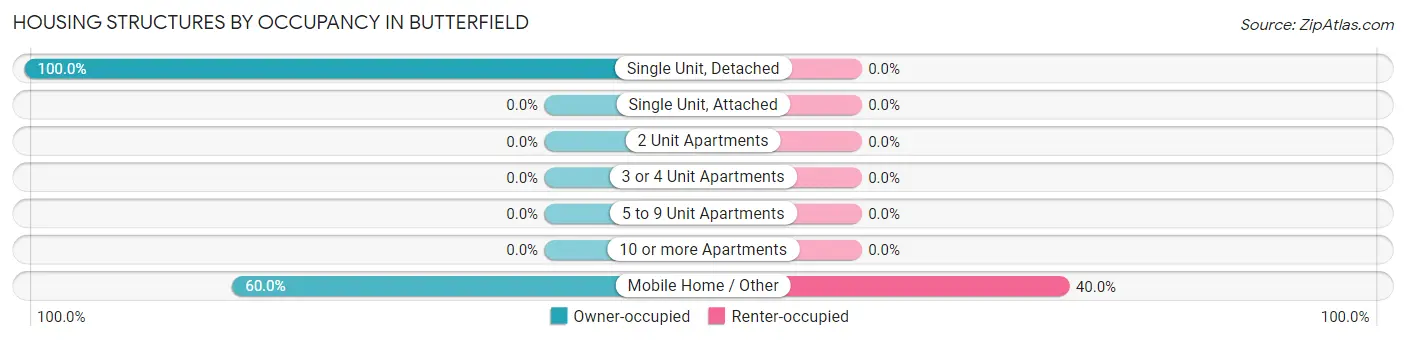
| Structure Type | Owner-occupied | Renter-occupied |
| Single Unit, Detached | 58 (100.0%) | 0 (0.0%) |
| Single Unit, Attached | 0 (0.0%) | 0 (0.0%) |
| 2 Unit Apartments | 0 (0.0%) | 0 (0.0%) |
| 3 or 4 Unit Apartments | 0 (0.0%) | 0 (0.0%) |
| 5 to 9 Unit Apartments | 0 (0.0%) | 0 (0.0%) |
| 10 or more Apartments | 0 (0.0%) | 0 (0.0%) |
| Mobile Home / Other | 9 (60.0%) | 6 (40.0%) |
| Total | 67 (91.8%) | 6 (8.2%) |
Housing Structures by Number of Rooms in Butterfield
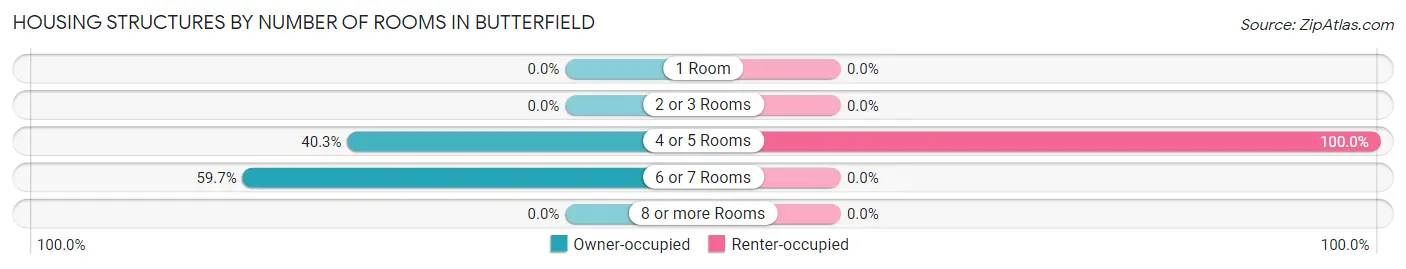
| Number of Rooms | Owner-occupied | Renter-occupied |
| 1 Room | 0 (0.0%) | 0 (0.0%) |
| 2 or 3 Rooms | 0 (0.0%) | 0 (0.0%) |
| 4 or 5 Rooms | 27 (40.3%) | 6 (100.0%) |
| 6 or 7 Rooms | 40 (59.7%) | 0 (0.0%) |
| 8 or more Rooms | 0 (0.0%) | 0 (0.0%) |
| Total | 67 (100.0%) | 6 (100.0%) |
Housing Structure by Heating Type in Butterfield
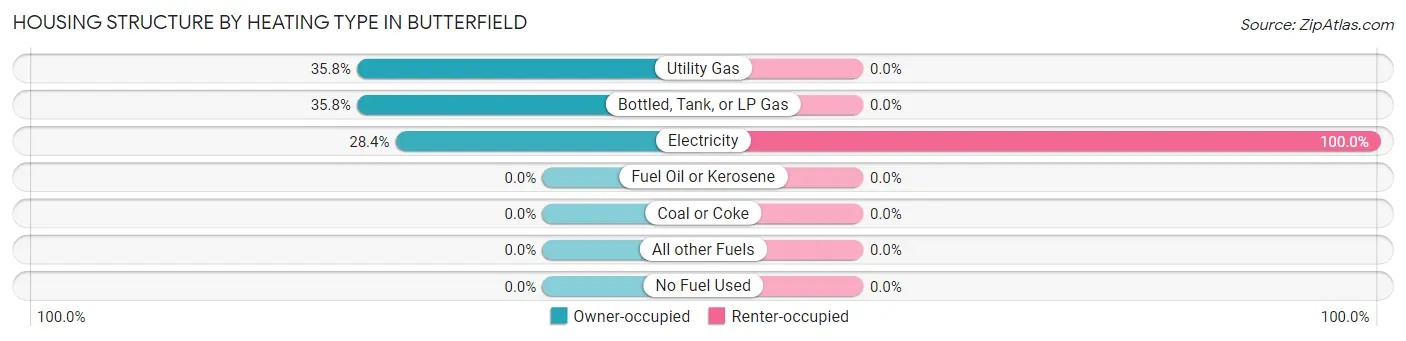
| Heating Type | Owner-occupied | Renter-occupied |
| Utility Gas | 24 (35.8%) | 0 (0.0%) |
| Bottled, Tank, or LP Gas | 24 (35.8%) | 0 (0.0%) |
| Electricity | 19 (28.4%) | 6 (100.0%) |
| Fuel Oil or Kerosene | 0 (0.0%) | 0 (0.0%) |
| Coal or Coke | 0 (0.0%) | 0 (0.0%) |
| All other Fuels | 0 (0.0%) | 0 (0.0%) |
| No Fuel Used | 0 (0.0%) | 0 (0.0%) |
| Total | 67 (100.0%) | 6 (100.0%) |
Household Vehicle Usage in Butterfield
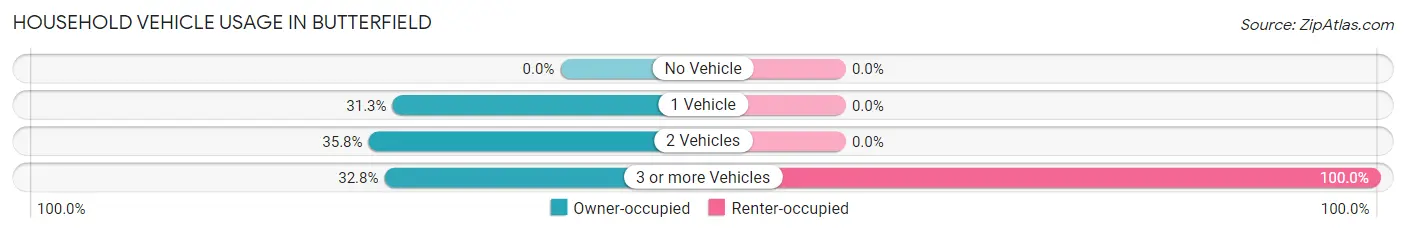
| Vehicles per Household | Owner-occupied | Renter-occupied |
| No Vehicle | 0 (0.0%) | 0 (0.0%) |
| 1 Vehicle | 21 (31.3%) | 0 (0.0%) |
| 2 Vehicles | 24 (35.8%) | 0 (0.0%) |
| 3 or more Vehicles | 22 (32.8%) | 6 (100.0%) |
| Total | 67 (100.0%) | 6 (100.0%) |
Real Estate & Mortgages in Butterfield
Real Estate and Mortgage Overview in Butterfield
| Characteristic | Without Mortgage | With Mortgage |
| Housing Units | 64 | 3 |
| Median Property Value | - | - |
| Median Household Income | - | - |
| Monthly Housing Costs | - | - |
| Real Estate Taxes | - | - |
Property Value by Mortgage Status in Butterfield
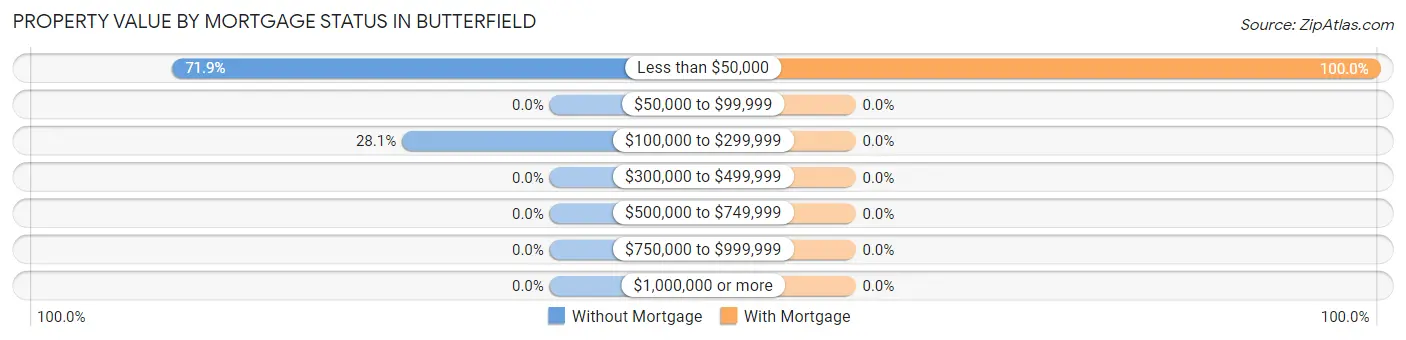
| Property Value | Without Mortgage | With Mortgage |
| Less than $50,000 | 46 (71.9%) | 3 (100.0%) |
| $50,000 to $99,999 | 0 (0.0%) | 0 (0.0%) |
| $100,000 to $299,999 | 18 (28.1%) | 0 (0.0%) |
| $300,000 to $499,999 | 0 (0.0%) | 0 (0.0%) |
| $500,000 to $749,999 | 0 (0.0%) | 0 (0.0%) |
| $750,000 to $999,999 | 0 (0.0%) | 0 (0.0%) |
| $1,000,000 or more | 0 (0.0%) | 0 (0.0%) |
| Total | 64 (100.0%) | 3 (100.0%) |
Household Income by Mortgage Status in Butterfield
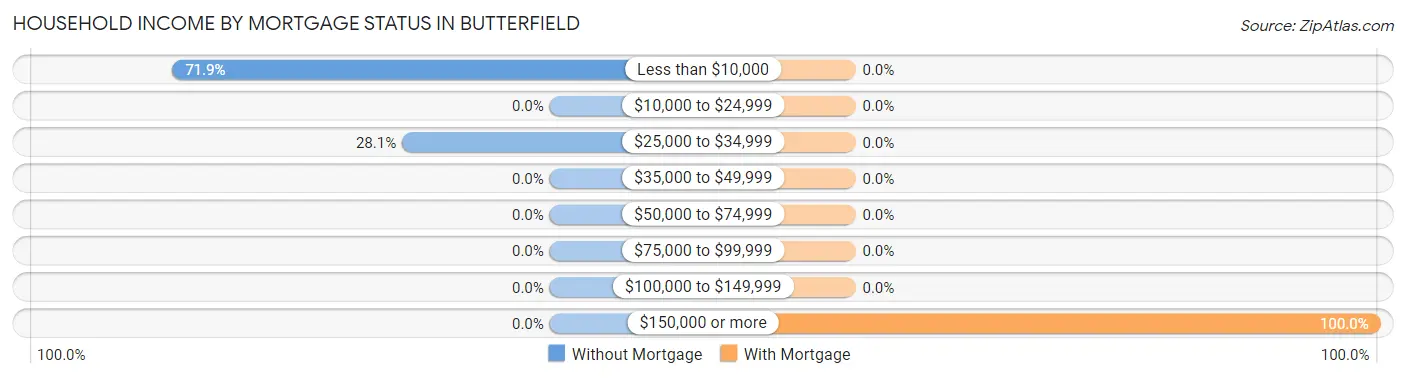
| Household Income | Without Mortgage | With Mortgage |
| Less than $10,000 | 46 (71.9%) | 0 (0.0%) |
| $10,000 to $24,999 | 0 (0.0%) | 0 (0.0%) |
| $25,000 to $34,999 | 18 (28.1%) | 0 (0.0%) |
| $35,000 to $49,999 | 0 (0.0%) | 0 (0.0%) |
| $50,000 to $74,999 | 0 (0.0%) | 0 (0.0%) |
| $75,000 to $99,999 | 0 (0.0%) | 0 (0.0%) |
| $100,000 to $149,999 | 0 (0.0%) | 0 (0.0%) |
| $150,000 or more | 0 (0.0%) | 3 (100.0%) |
| Total | 64 (100.0%) | 3 (100.0%) |
Property Value to Household Income Ratio in Butterfield
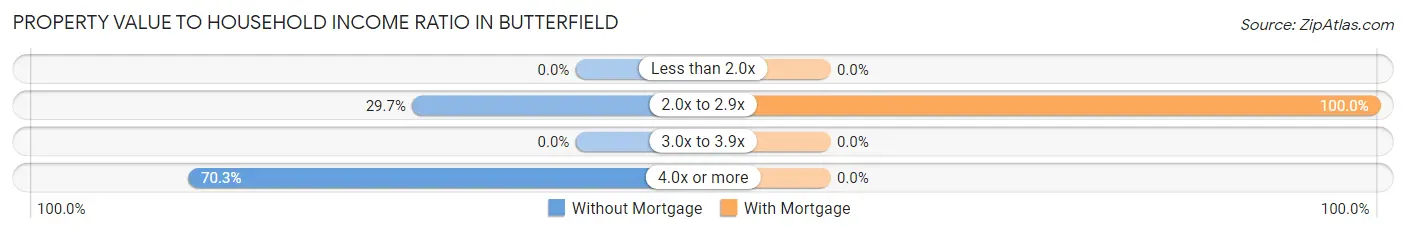
| Value-to-Income Ratio | Without Mortgage | With Mortgage |
| Less than 2.0x | 0 (0.0%) | 0 (0.0%) |
| 2.0x to 2.9x | 19 (29.7%) | 3 (100.0%) |
| 3.0x to 3.9x | 0 (0.0%) | 0 (0.0%) |
| 4.0x or more | 45 (70.3%) | 0 (0.0%) |
| Total | 64 (100.0%) | 3 (100.0%) |
Real Estate Taxes by Mortgage Status in Butterfield
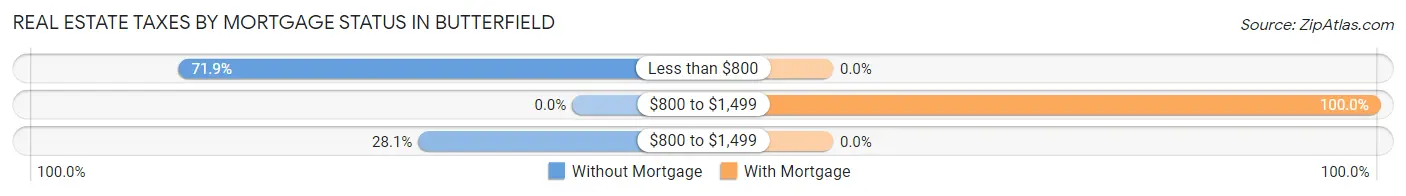
| Property Taxes | Without Mortgage | With Mortgage |
| Less than $800 | 46 (71.9%) | 0 (0.0%) |
| $800 to $1,499 | 0 (0.0%) | 3 (100.0%) |
| $800 to $1,499 | 18 (28.1%) | 0 (0.0%) |
| Total | 64 (100.0%) | 3 (100.0%) |
Health & Disability in Butterfield
Health Insurance Coverage by Age in Butterfield
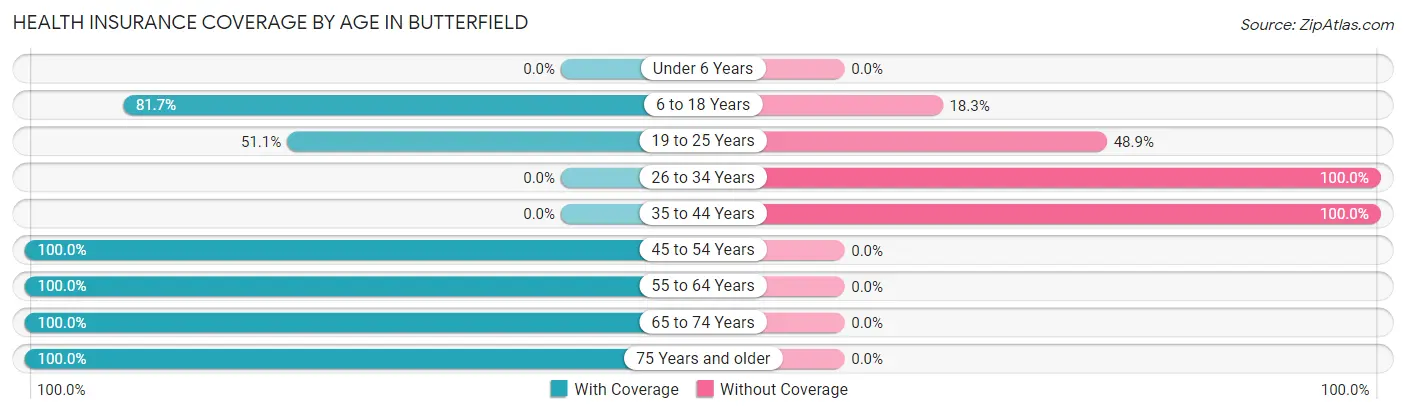
| Age Bracket | With Coverage | Without Coverage |
| Under 6 Years | 0 (0.0%) | 0 (0.0%) |
| 6 to 18 Years | 58 (81.7%) | 13 (18.3%) |
| 19 to 25 Years | 24 (51.1%) | 23 (48.9%) |
| 26 to 34 Years | 0 (0.0%) | 7 (100.0%) |
| 35 to 44 Years | 0 (0.0%) | 19 (100.0%) |
| 45 to 54 Years | 12 (100.0%) | 0 (0.0%) |
| 55 to 64 Years | 12 (100.0%) | 0 (0.0%) |
| 65 to 74 Years | 39 (100.0%) | 0 (0.0%) |
| 75 Years and older | 19 (100.0%) | 0 (0.0%) |
| Total | 164 (72.6%) | 62 (27.4%) |
Health Insurance Coverage by Citizenship Status in Butterfield
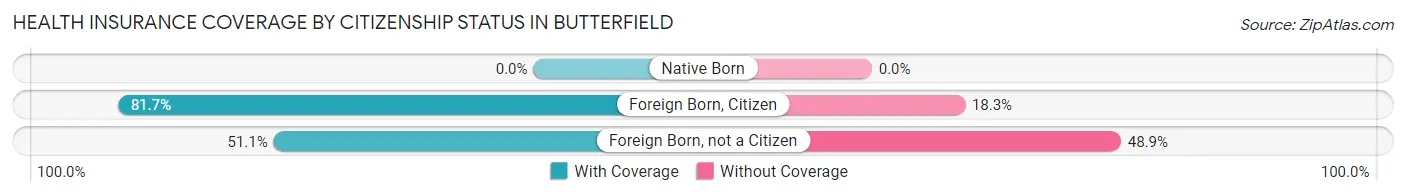
| Citizenship Status | With Coverage | Without Coverage |
| Native Born | 0 (0.0%) | 0 (0.0%) |
| Foreign Born, Citizen | 58 (81.7%) | 13 (18.3%) |
| Foreign Born, not a Citizen | 24 (51.1%) | 23 (48.9%) |
Health Insurance Coverage by Household Income in Butterfield
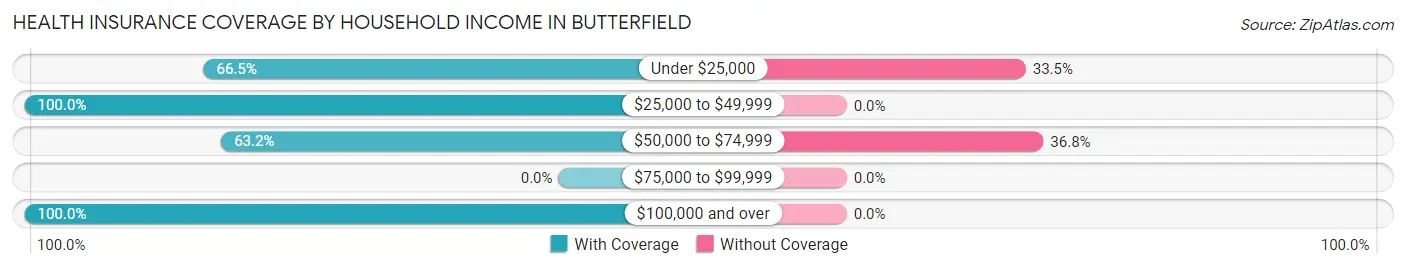
| Household Income | With Coverage | Without Coverage |
| Under $25,000 | 109 (66.5%) | 55 (33.5%) |
| $25,000 to $49,999 | 37 (100.0%) | 0 (0.0%) |
| $50,000 to $74,999 | 12 (63.2%) | 7 (36.8%) |
| $75,000 to $99,999 | 0 (0.0%) | 0 (0.0%) |
| $100,000 and over | 6 (100.0%) | 0 (0.0%) |
Public vs Private Health Insurance Coverage by Age in Butterfield
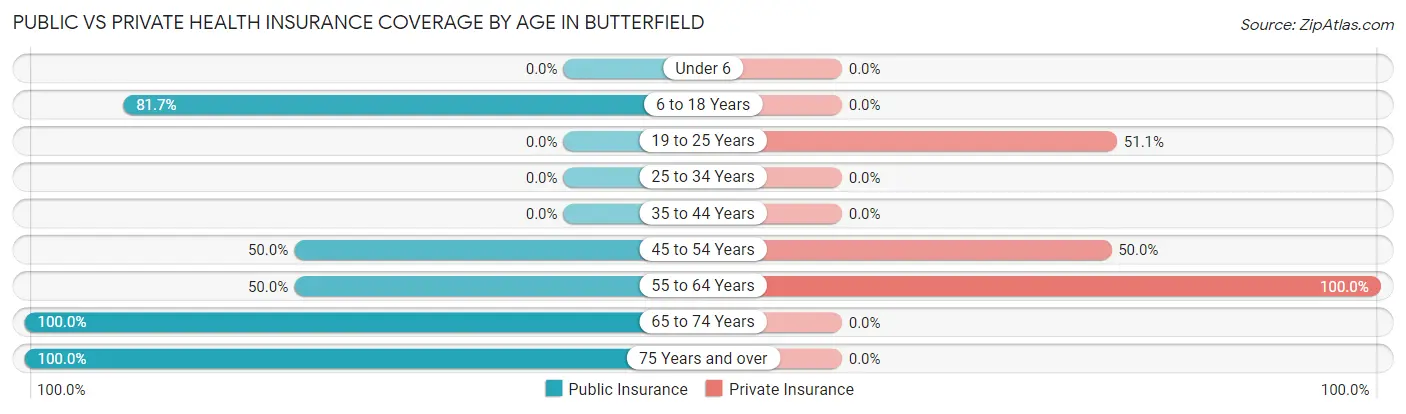
| Age Bracket | Public Insurance | Private Insurance |
| Under 6 | 0 (0.0%) | 0 (0.0%) |
| 6 to 18 Years | 58 (81.7%) | 0 (0.0%) |
| 19 to 25 Years | 0 (0.0%) | 24 (51.1%) |
| 25 to 34 Years | 0 (0.0%) | 0 (0.0%) |
| 35 to 44 Years | 0 (0.0%) | 0 (0.0%) |
| 45 to 54 Years | 6 (50.0%) | 6 (50.0%) |
| 55 to 64 Years | 6 (50.0%) | 12 (100.0%) |
| 65 to 74 Years | 39 (100.0%) | 0 (0.0%) |
| 75 Years and over | 19 (100.0%) | 0 (0.0%) |
| Total | 128 (56.6%) | 42 (18.6%) |
Disability Status by Sex by Age in Butterfield
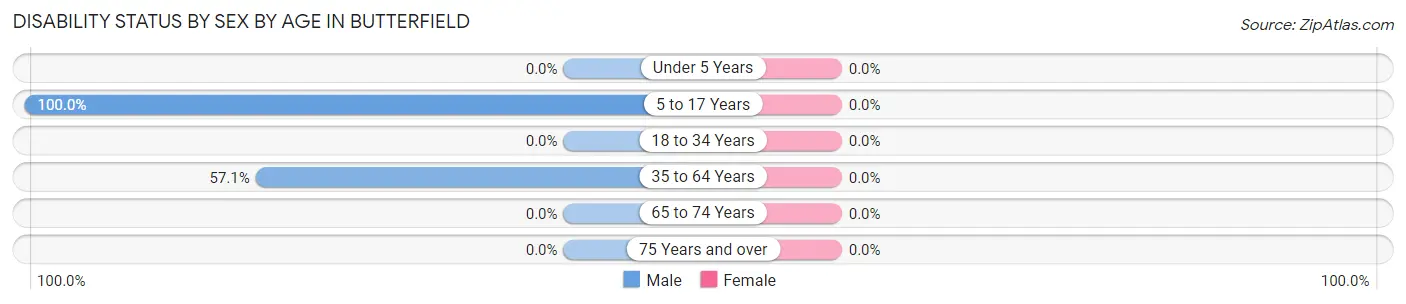
| Age Bracket | Male | Female |
| Under 5 Years | 0 (0.0%) | 0 (0.0%) |
| 5 to 17 Years | 39 (100.0%) | 0 (0.0%) |
| 18 to 34 Years | 0 (0.0%) | 0 (0.0%) |
| 35 to 64 Years | 12 (57.1%) | 0 (0.0%) |
| 65 to 74 Years | 0 (0.0%) | 0 (0.0%) |
| 75 Years and over | 0 (0.0%) | 0 (0.0%) |
Disability Class by Sex by Age in Butterfield
Disability Class: Hearing Difficulty
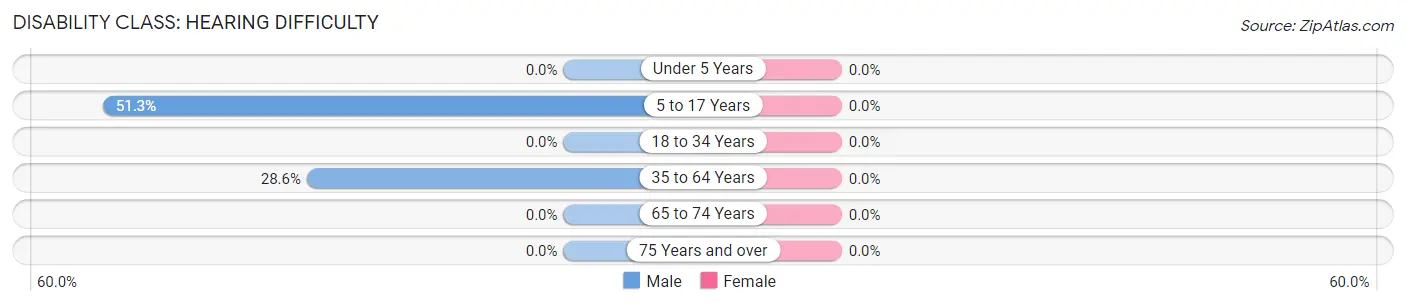
| Age Bracket | Male | Female |
| Under 5 Years | 0 (0.0%) | 0 (0.0%) |
| 5 to 17 Years | 20 (51.3%) | 0 (0.0%) |
| 18 to 34 Years | 0 (0.0%) | 0 (0.0%) |
| 35 to 64 Years | 6 (28.6%) | 0 (0.0%) |
| 65 to 74 Years | 0 (0.0%) | 0 (0.0%) |
| 75 Years and over | 0 (0.0%) | 0 (0.0%) |
Disability Class: Vision Difficulty
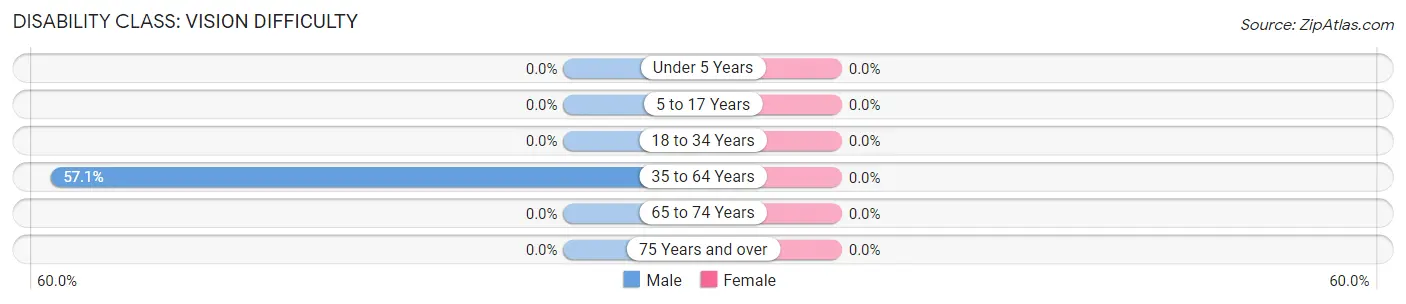
| Age Bracket | Male | Female |
| Under 5 Years | 0 (0.0%) | 0 (0.0%) |
| 5 to 17 Years | 0 (0.0%) | 0 (0.0%) |
| 18 to 34 Years | 0 (0.0%) | 0 (0.0%) |
| 35 to 64 Years | 12 (57.1%) | 0 (0.0%) |
| 65 to 74 Years | 0 (0.0%) | 0 (0.0%) |
| 75 Years and over | 0 (0.0%) | 0 (0.0%) |
Disability Class: Cognitive Difficulty
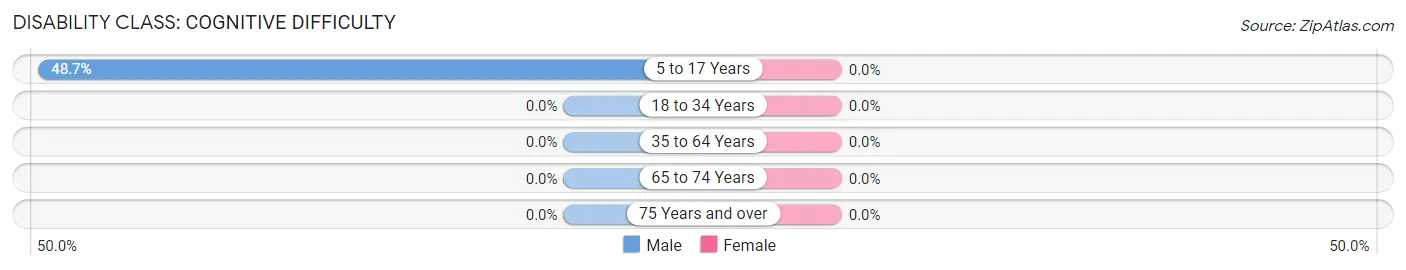
| Age Bracket | Male | Female |
| 5 to 17 Years | 19 (48.7%) | 0 (0.0%) |
| 18 to 34 Years | 0 (0.0%) | 0 (0.0%) |
| 35 to 64 Years | 0 (0.0%) | 0 (0.0%) |
| 65 to 74 Years | 0 (0.0%) | 0 (0.0%) |
| 75 Years and over | 0 (0.0%) | 0 (0.0%) |
Disability Class: Ambulatory Difficulty
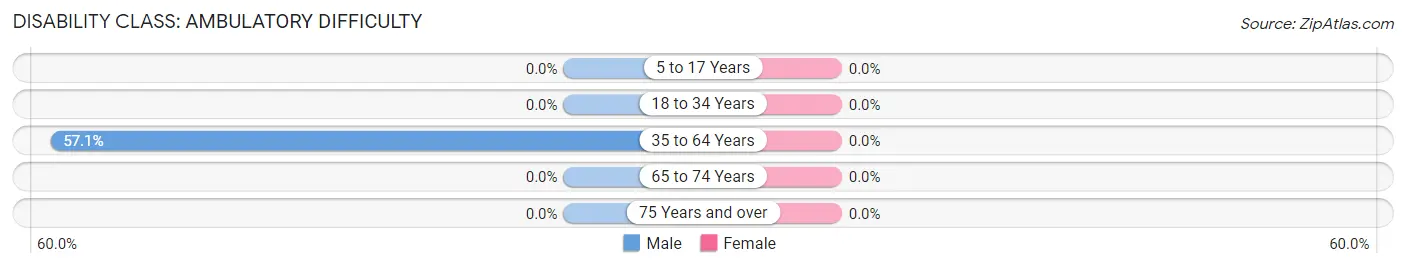
| Age Bracket | Male | Female |
| 5 to 17 Years | 0 (0.0%) | 0 (0.0%) |
| 18 to 34 Years | 0 (0.0%) | 0 (0.0%) |
| 35 to 64 Years | 12 (57.1%) | 0 (0.0%) |
| 65 to 74 Years | 0 (0.0%) | 0 (0.0%) |
| 75 Years and over | 0 (0.0%) | 0 (0.0%) |
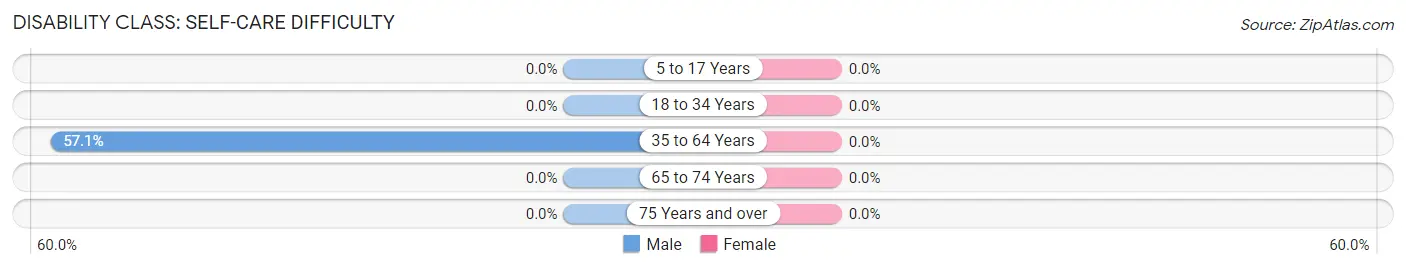
Disability Class: Self-Care Difficulty
| Age Bracket | Male | Female |
| 5 to 17 Years | 0 (0.0%) | 0 (0.0%) |
| 18 to 34 Years | 0 (0.0%) | 0 (0.0%) |
| 35 to 64 Years | 12 (57.1%) | 0 (0.0%) |
| 65 to 74 Years | 0 (0.0%) | 0 (0.0%) |
| 75 Years and over | 0 (0.0%) | 0 (0.0%) |
Technology Access in Butterfield
Computing Device Access in Butterfield
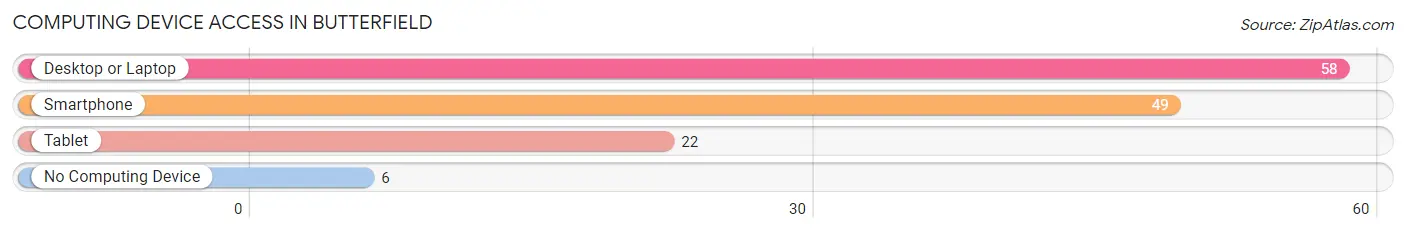
| Device Type | # Households | % Households |
| Desktop or Laptop | 58 | 79.4% |
| Smartphone | 49 | 67.1% |
| Tablet | 22 | 30.1% |
| No Computing Device | 6 | 8.2% |
| Total | 73 | 100.0% |
Internet Access in Butterfield
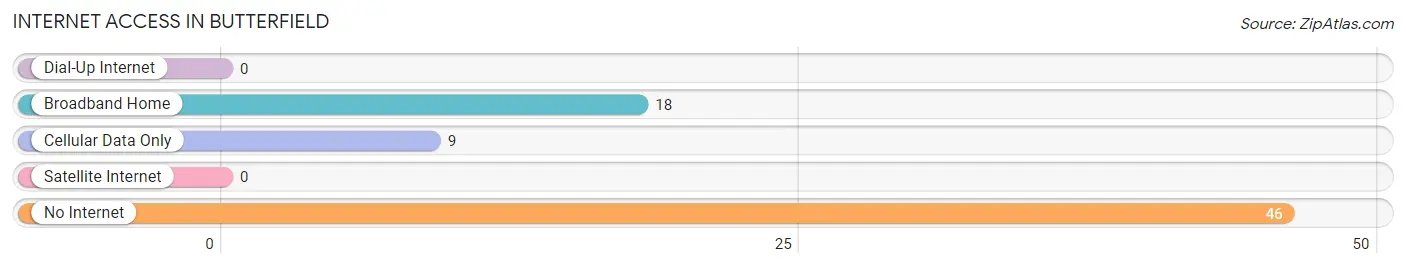
| Internet Type | # Households | % Households |
| Dial-Up Internet | 0 | 0.0% |
| Broadband Home | 18 | 24.7% |
| Cellular Data Only | 9 | 12.3% |
| Satellite Internet | 0 | 0.0% |
| No Internet | 46 | 63.0% |
| Total | 73 | 100.0% |
Butterfield Summary
Butterfield, Texas is a small unincorporated community located in the western part of the state, in the county of El Paso. It is situated on the banks of the Rio Grande, just south of the city of El Paso. The population of Butterfield was estimated to be around 1,000 people in 2020.
History
Butterfield was founded in 1881 by a group of settlers from the Butterfield Overland Mail Company. The Butterfield Overland Mail Company was a stagecoach service that operated from 1857 to 1861, and was the first successful transcontinental mail service in the United States. The settlers named the town after the company, and it quickly became a popular stop for travelers and traders.
In the early 1900s, Butterfield was a thriving agricultural community, with cotton, corn, and wheat being the main crops. The town also had a number of businesses, including a general store, a blacksmith, and a saloon.
In the 1920s, Butterfield began to decline as the railroad bypassed the town and the population began to dwindle. By the 1940s, the town was nearly abandoned. In the 1950s, the town was revitalized when the Butterfield-El Paso Highway was built, connecting Butterfield to El Paso.
Geography
Butterfield is located in the western part of Texas, in El Paso County. It is situated on the banks of the Rio Grande, just south of the city of El Paso. The town is surrounded by desert and mountains, and is located at an elevation of 3,845 feet.
The climate in Butterfield is arid and semi-arid, with hot summers and mild winters. The average annual temperature is around 70 degrees Fahrenheit, and the average annual precipitation is around 8 inches.
Economy
The economy of Butterfield is largely based on agriculture and tourism. The town is home to a number of farms, which produce cotton, corn, wheat, and other crops. The town also has a number of tourist attractions, including the Butterfield-El Paso Highway, the Butterfield Overland Mail Company Museum, and the Butterfield Stagecoach Stop.
Demographics
As of 2020, the population of Butterfield was estimated to be around 1,000 people. The racial makeup of the town is predominantly Hispanic, with around 90% of the population being of Hispanic or Latino origin. The median household income in Butterfield is around $30,000, and the median home value is around $90,000. The town has a high poverty rate, with around 30% of the population living below the poverty line.
Common Questions
What is Per Capita Income in Butterfield?
Per Capita income in Butterfield is $6,568.
What is Inequality or Gini Index in Butterfield?
Inequality or Gini Index in Butterfield is 0.60.
What is the Total Population of Butterfield?
Total Population of Butterfield is 226.
What is the Total Male Population of Butterfield?
Total Male Population of Butterfield is 159.
What is the Total Female Population of Butterfield?
Total Female Population of Butterfield is 67.
What is the Ratio of Males per 100 Females in Butterfield?
There are 237.31 Males per 100 Females in Butterfield.
What is the Ratio of Females per 100 Males in Butterfield?
There are 42.14 Females per 100 Males in Butterfield.
What is the Median Population Age in Butterfield?
Median Population Age in Butterfield is 23.8 Years.
What is the Average Family Size in Butterfield
Average Family Size in Butterfield is 3.3 People.
What is the Average Household Size in Butterfield
Average Household Size in Butterfield is 3.1 People.
How Large is the Labor Force in Butterfield?
There are 87 People in the Labor Forcein in Butterfield.
What is the Percentage of People in the Labor Force in Butterfield?
46.5% of People are in the Labor Force in Butterfield.
What is the Unemployment Rate in Butterfield?
Unemployment Rate in Butterfield is 14.9%.