Rio Bravo, TX Map & Demographics
Rio Bravo Map
Rio Bravo Overview
$12,467
PER CAPITA INCOME
$36,847
AVG FAMILY INCOME
$36,560
AVG HOUSEHOLD INCOME
45.9%
WAGE / INCOME GAP [ % ]
54.1¢/ $1
WAGE / INCOME GAP [ $ ]
$20,764
FAMILY INCOME DEFICIT
0.48
INEQUALITY / GINI INDEX
4,437
TOTAL POPULATION
2,066
MALE POPULATION
2,371
FEMALE POPULATION
87.14
MALES / 100 FEMALES
114.76
FEMALES / 100 MALES
23.3
MEDIAN AGE
5.2
AVG FAMILY SIZE
4.2
AVG HOUSEHOLD SIZE
1,603
LABOR FORCE [ PEOPLE ]
53.9%
PERCENT IN LABOR FORCE
3.3%
UNEMPLOYMENT RATE
Rio Bravo Area Codes
Income in Rio Bravo
Income Overview in Rio Bravo
Per Capita Income in Rio Bravo is $12,467, while median incomes of families and households are $36,847 and $36,560 respectively.
| Characteristic | Number | Measure |
| Per Capita Income | 4,437 | $12,467 |
| Median Family Income | 768 | $36,847 |
| Mean Family Income | 768 | $56,565 |
| Median Household Income | 1,043 | $36,560 |
| Mean Household Income | 1,043 | $50,661 |
| Income Deficit | 768 | $20,764 |
| Wage / Income Gap (%) | 4,437 | 45.88% |
| Wage / Income Gap ($) | 4,437 | 54.12¢ per $1 |
| Gini / Inequality Index | 4,437 | 0.48 |
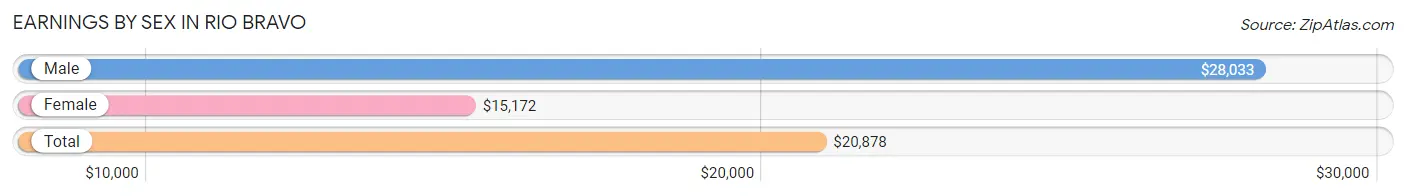
Earnings by Sex in Rio Bravo
Average Earnings in Rio Bravo are $20,878, $28,033 for men and $15,172 for women, a difference of 45.9%.
| Sex | Number | Average Earnings |
| Male | 986 (56.4%) | $28,033 |
| Female | 761 (43.6%) | $15,172 |
| Total | 1,747 (100.0%) | $20,878 |
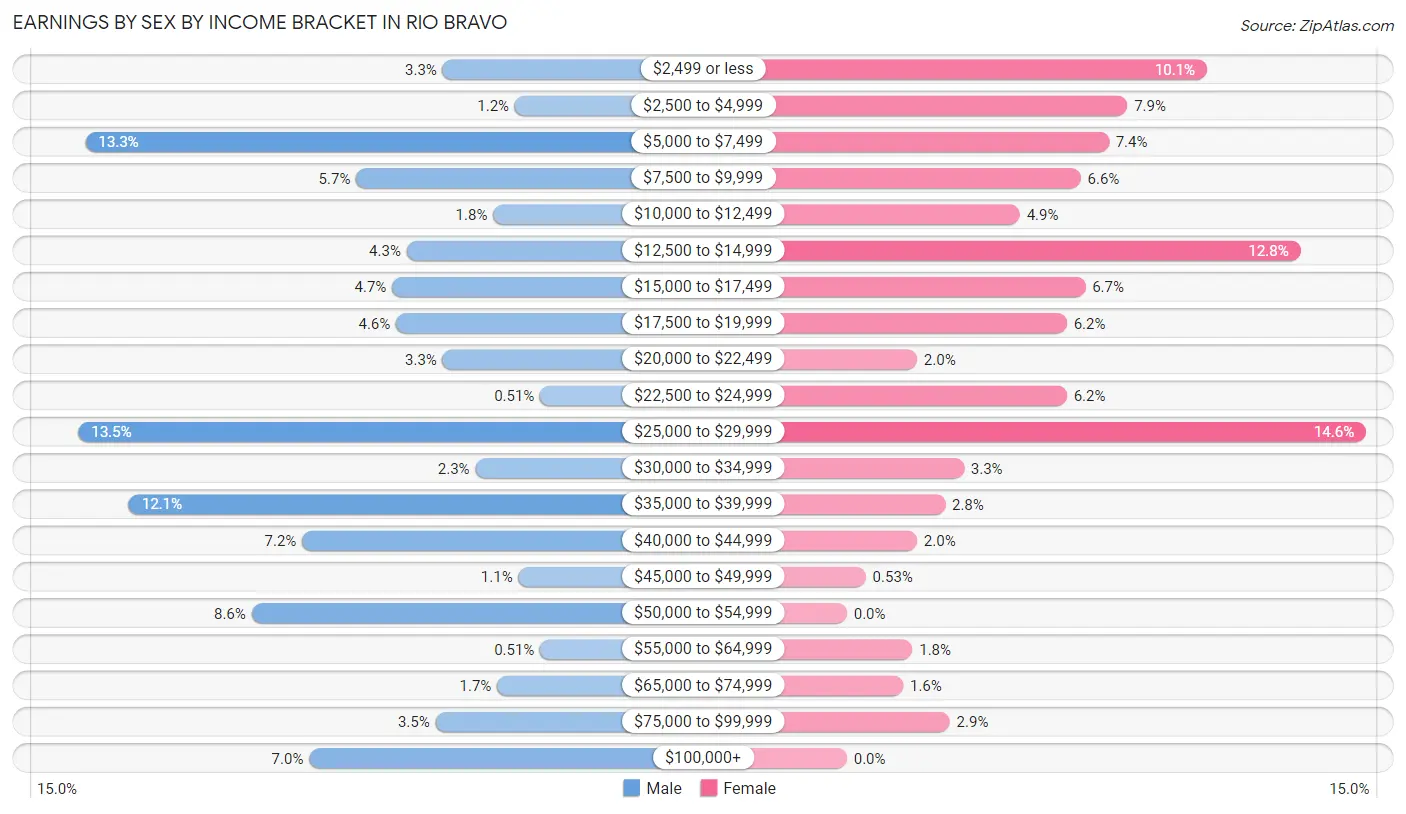
Earnings by Sex by Income Bracket in Rio Bravo
The most common earnings brackets in Rio Bravo are $25,000 to $29,999 for men (133 | 13.5%) and $25,000 to $29,999 for women (111 | 14.6%).
| Income | Male | Female |
| $2,499 or less | 32 (3.3%) | 77 (10.1%) |
| $2,500 to $4,999 | 12 (1.2%) | 60 (7.9%) |
| $5,000 to $7,499 | 131 (13.3%) | 56 (7.4%) |
| $7,500 to $9,999 | 56 (5.7%) | 50 (6.6%) |
| $10,000 to $12,499 | 18 (1.8%) | 37 (4.9%) |
| $12,500 to $14,999 | 42 (4.3%) | 97 (12.8%) |
| $15,000 to $17,499 | 46 (4.7%) | 51 (6.7%) |
| $17,500 to $19,999 | 45 (4.6%) | 47 (6.2%) |
| $20,000 to $22,499 | 32 (3.3%) | 15 (2.0%) |
| $22,500 to $24,999 | 5 (0.5%) | 47 (6.2%) |
| $25,000 to $29,999 | 133 (13.5%) | 111 (14.6%) |
| $30,000 to $34,999 | 23 (2.3%) | 25 (3.3%) |
| $35,000 to $39,999 | 119 (12.1%) | 21 (2.8%) |
| $40,000 to $44,999 | 71 (7.2%) | 15 (2.0%) |
| $45,000 to $49,999 | 11 (1.1%) | 4 (0.5%) |
| $50,000 to $54,999 | 85 (8.6%) | 0 (0.0%) |
| $55,000 to $64,999 | 5 (0.5%) | 14 (1.8%) |
| $65,000 to $74,999 | 17 (1.7%) | 12 (1.6%) |
| $75,000 to $99,999 | 34 (3.5%) | 22 (2.9%) |
| $100,000+ | 69 (7.0%) | 0 (0.0%) |
| Total | 986 (100.0%) | 761 (100.0%) |
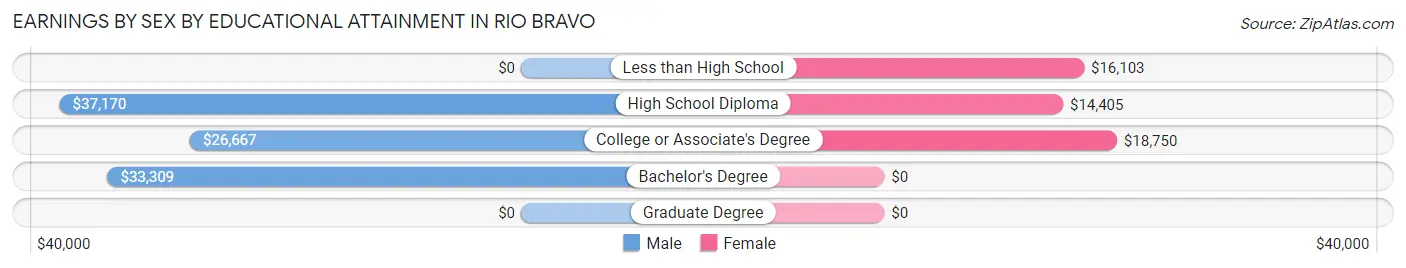
Earnings by Sex by Educational Attainment in Rio Bravo
Average earnings in Rio Bravo are $34,632 for men and $17,083 for women, a difference of 50.7%. Men with an educational attainment of high school diploma enjoy the highest average annual earnings of $37,170, while those with college or associate's degree education earn the least with $26,667. Women with an educational attainment of college or associate's degree earn the most with the average annual earnings of $18,750, while those with high school diploma education have the smallest earnings of $14,405.
| Educational Attainment | Male Income | Female Income |
| Less than High School | - | - |
| High School Diploma | $37,170 | $14,405 |
| College or Associate's Degree | $26,667 | $18,750 |
| Bachelor's Degree | $33,309 | $0 |
| Graduate Degree | - | - |
| Total | $34,632 | $17,083 |
Family Income in Rio Bravo
Family Income Brackets in Rio Bravo
According to the Rio Bravo family income data, there are 154 families falling into the $50,000 to $74,999 income range, which is the most common income bracket and makes up 20.1% of all families. Conversely, the $200,000+ income bracket is the least frequent group with only 11 families (1.4%) belonging to this category.
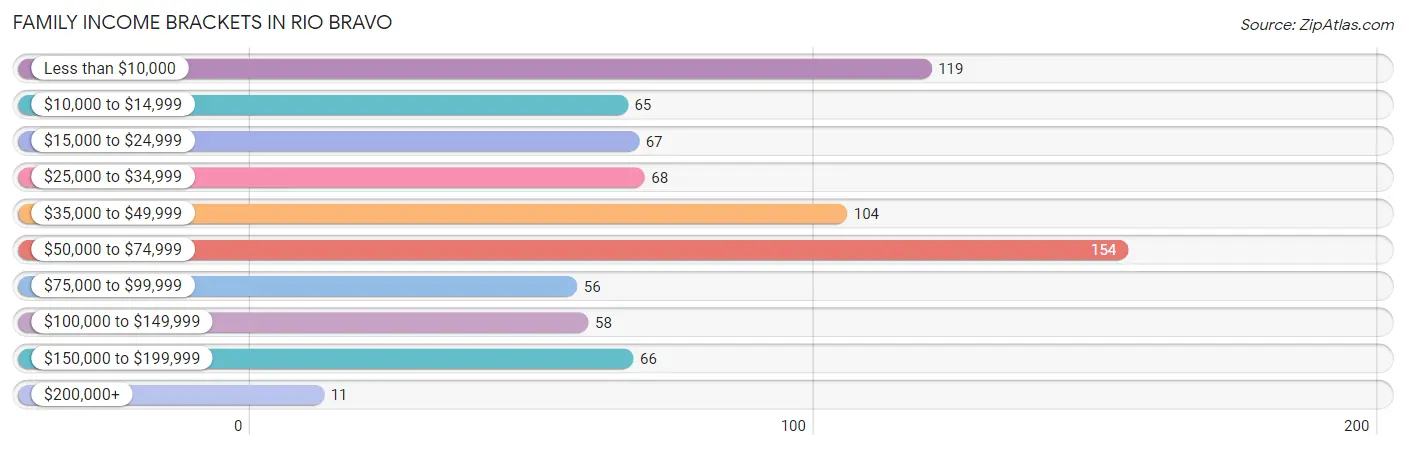
| Income Bracket | # Families | % Families |
| Less than $10,000 | 119 | 15.5% |
| $10,000 to $14,999 | 65 | 8.5% |
| $15,000 to $24,999 | 67 | 8.7% |
| $25,000 to $34,999 | 68 | 8.9% |
| $35,000 to $49,999 | 104 | 13.5% |
| $50,000 to $74,999 | 154 | 20.1% |
| $75,000 to $99,999 | 56 | 7.3% |
| $100,000 to $149,999 | 58 | 7.6% |
| $150,000 to $199,999 | 66 | 8.6% |
| $200,000+ | 11 | 1.4% |
Family Income by Famaliy Size in Rio Bravo
5-person families (138 | 18.0%) account for the highest median family income in Rio Bravo with $55,556 per family, while 3-person families (161 | 21.0%) have the highest median income of $17,110 per family member.
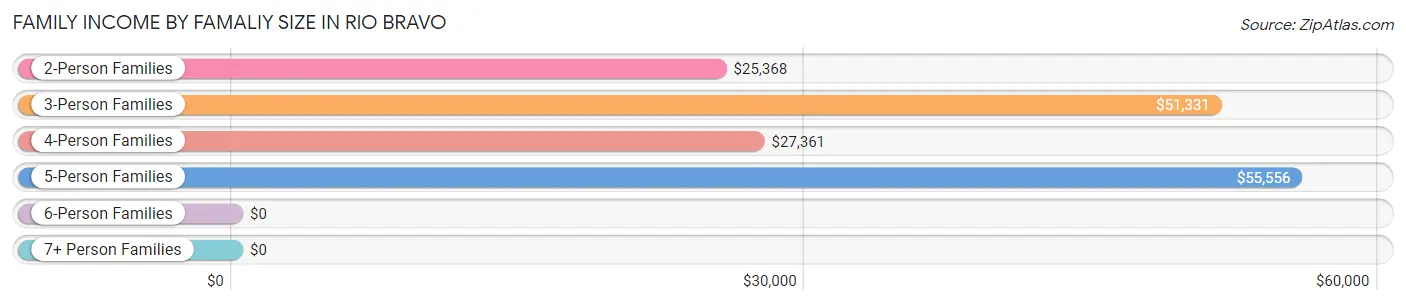
| Income Bracket | # Families | Median Income |
| 2-Person Families | 113 (14.7%) | $25,368 |
| 3-Person Families | 161 (21.0%) | $51,331 |
| 4-Person Families | 46 (6.0%) | $27,361 |
| 5-Person Families | 138 (18.0%) | $55,556 |
| 6-Person Families | 117 (15.2%) | $0 |
| 7+ Person Families | 193 (25.1%) | $0 |
| Total | 768 (100.0%) | $36,847 |
Family Income by Number of Earners in Rio Bravo
The median family income in Rio Bravo is $36,847, with families comprising 3+ earners (213) having the highest median family income of $82,171, while families with no earners (96) have the lowest median family income of $16,667, accounting for 27.7% and 12.5% of families, respectively.
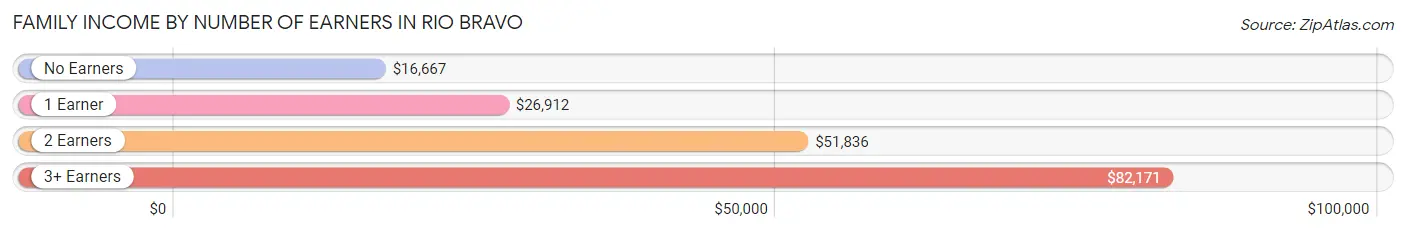
| Number of Earners | # Families | Median Income |
| No Earners | 96 (12.5%) | $16,667 |
| 1 Earner | 268 (34.9%) | $26,912 |
| 2 Earners | 191 (24.9%) | $51,836 |
| 3+ Earners | 213 (27.7%) | $82,171 |
| Total | 768 (100.0%) | $36,847 |
Household Income in Rio Bravo
Household Income Brackets in Rio Bravo
With 225 households falling in the category, the $35,000 to $49,999 income range is the most frequent in Rio Bravo, accounting for 21.6% of all households. In contrast, only 11 households (1.1%) fall into the $200,000+ income bracket, making it the least populous group.
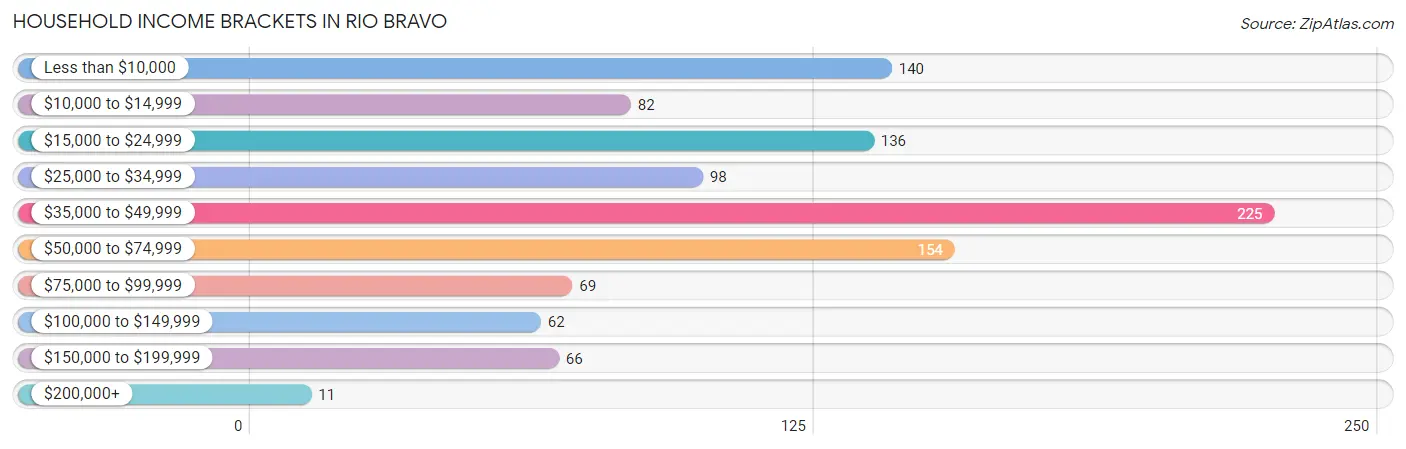
| Income Bracket | # Households | % Households |
| Less than $10,000 | 140 | 13.4% |
| $10,000 to $14,999 | 82 | 7.9% |
| $15,000 to $24,999 | 136 | 13.0% |
| $25,000 to $34,999 | 98 | 9.4% |
| $35,000 to $49,999 | 225 | 21.6% |
| $50,000 to $74,999 | 154 | 14.8% |
| $75,000 to $99,999 | 69 | 6.6% |
| $100,000 to $149,999 | 62 | 5.9% |
| $150,000 to $199,999 | 66 | 6.3% |
| $200,000+ | 11 | 1.1% |
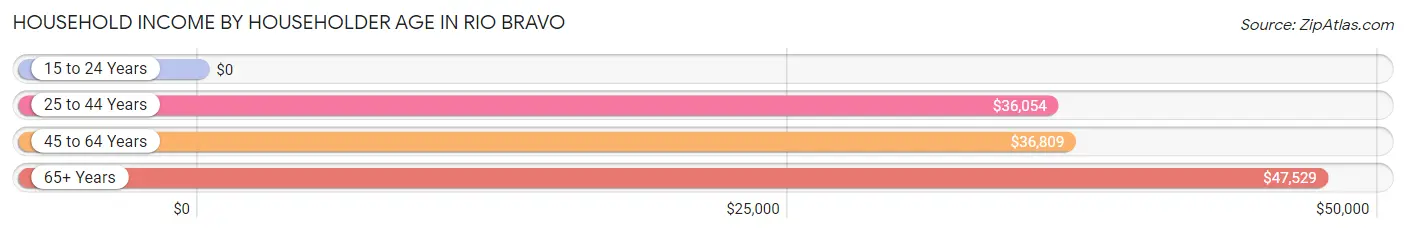
Household Income by Householder Age in Rio Bravo
The median household income in Rio Bravo is $36,560, with the highest median household income of $47,529 found in the 65+ years age bracket for the primary householder. A total of 198 households (19.0%) fall into this category. Meanwhile, the 15 to 24 years age bracket for the primary householder has the lowest median household income of $0, with 29 households (2.8%) in this group.
| Income Bracket | # Households | Median Income |
| 15 to 24 Years | 29 (2.8%) | $0 |
| 25 to 44 Years | 295 (28.3%) | $36,054 |
| 45 to 64 Years | 521 (49.9%) | $36,809 |
| 65+ Years | 198 (19.0%) | $47,529 |
| Total | 1,043 (100.0%) | $36,560 |
Poverty in Rio Bravo
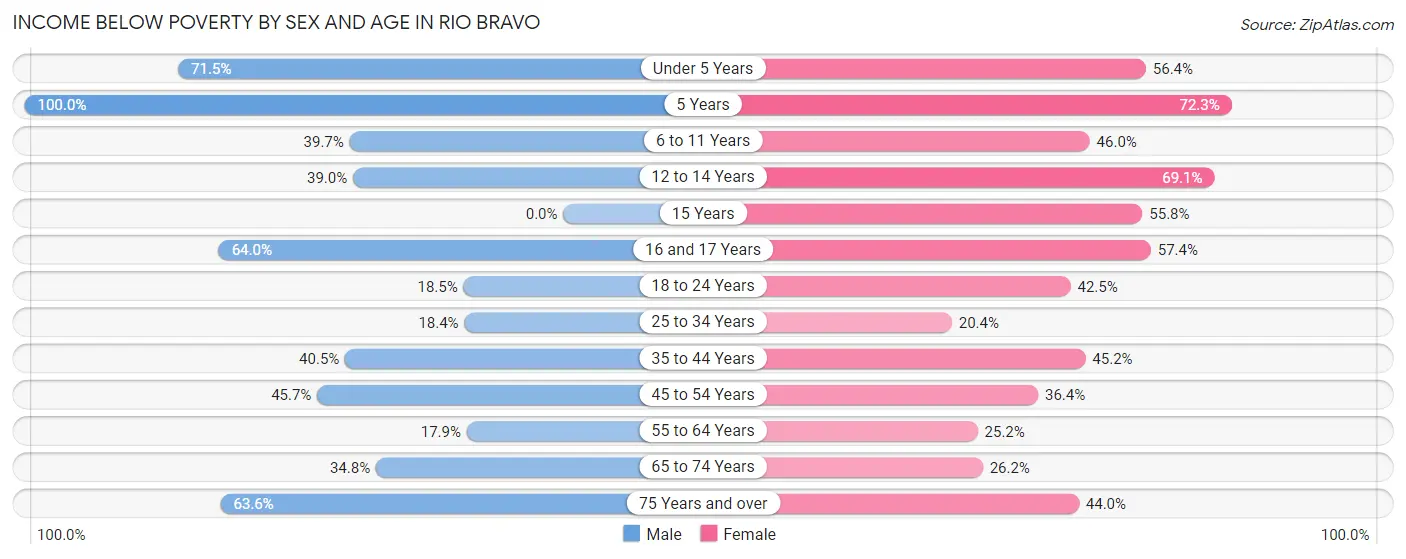
Income Below Poverty by Sex and Age in Rio Bravo
With 36.2% poverty level for males and 42.9% for females among the residents of Rio Bravo, 5 year old males and 5 year old females are the most vulnerable to poverty, with 13 males (100.0%) and 34 females (72.3%) in their respective age groups living below the poverty level.
| Age Bracket | Male | Female |
| Under 5 Years | 133 (71.5%) | 92 (56.4%) |
| 5 Years | 13 (100.0%) | 34 (72.3%) |
| 6 to 11 Years | 96 (39.7%) | 167 (46.0%) |
| 12 to 14 Years | 57 (39.0%) | 112 (69.1%) |
| 15 Years | 0 (0.0%) | 53 (55.8%) |
| 16 and 17 Years | 71 (64.0%) | 74 (57.4%) |
| 18 to 24 Years | 60 (18.5%) | 121 (42.5%) |
| 25 to 34 Years | 56 (18.4%) | 29 (20.4%) |
| 35 to 44 Years | 98 (40.5%) | 104 (45.2%) |
| 45 to 54 Years | 106 (45.7%) | 106 (36.4%) |
| 55 to 64 Years | 26 (17.9%) | 60 (25.2%) |
| 65 to 74 Years | 24 (34.8%) | 51 (26.2%) |
| 75 Years and over | 7 (63.6%) | 11 (44.0%) |
| Total | 747 (36.2%) | 1,014 (42.9%) |
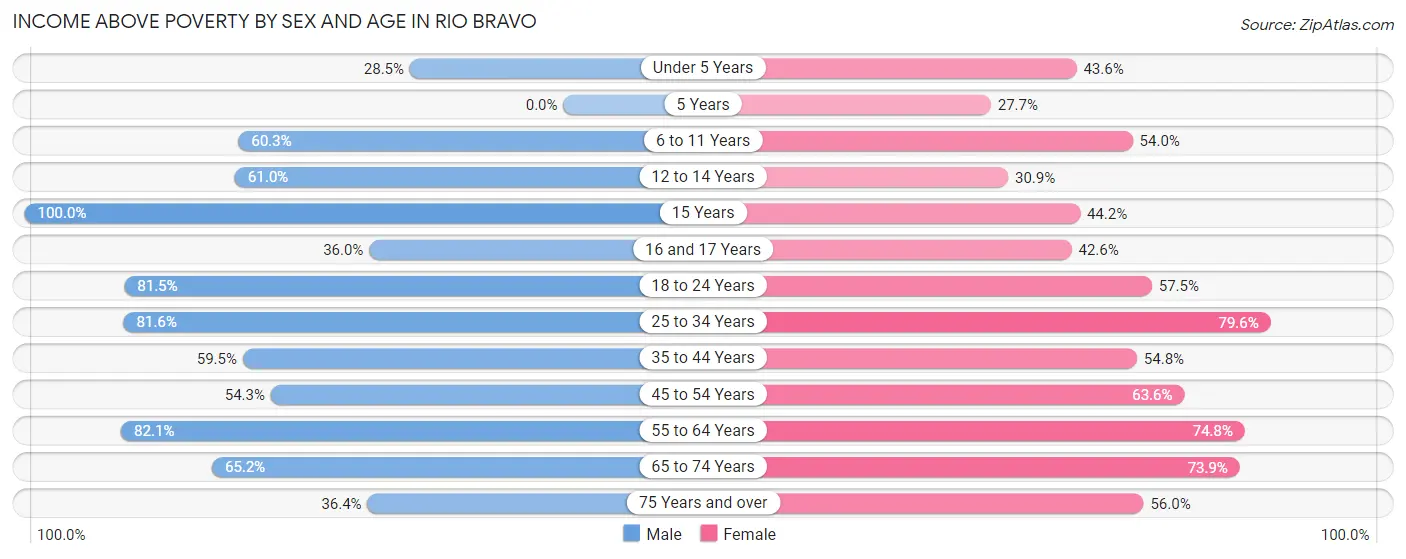
Income Above Poverty by Sex and Age in Rio Bravo
According to the poverty statistics in Rio Bravo, males aged 15 years and females aged 25 to 34 years are the age groups that are most secure financially, with 100.0% of males and 79.6% of females in these age groups living above the poverty line.
| Age Bracket | Male | Female |
| Under 5 Years | 53 (28.5%) | 71 (43.6%) |
| 5 Years | 0 (0.0%) | 13 (27.7%) |
| 6 to 11 Years | 146 (60.3%) | 196 (54.0%) |
| 12 to 14 Years | 89 (61.0%) | 50 (30.9%) |
| 15 Years | 35 (100.0%) | 42 (44.2%) |
| 16 and 17 Years | 40 (36.0%) | 55 (42.6%) |
| 18 to 24 Years | 264 (81.5%) | 164 (57.5%) |
| 25 to 34 Years | 249 (81.6%) | 113 (79.6%) |
| 35 to 44 Years | 144 (59.5%) | 126 (54.8%) |
| 45 to 54 Years | 126 (54.3%) | 185 (63.6%) |
| 55 to 64 Years | 119 (82.1%) | 178 (74.8%) |
| 65 to 74 Years | 45 (65.2%) | 144 (73.9%) |
| 75 Years and over | 4 (36.4%) | 14 (56.0%) |
| Total | 1,314 (63.8%) | 1,351 (57.1%) |
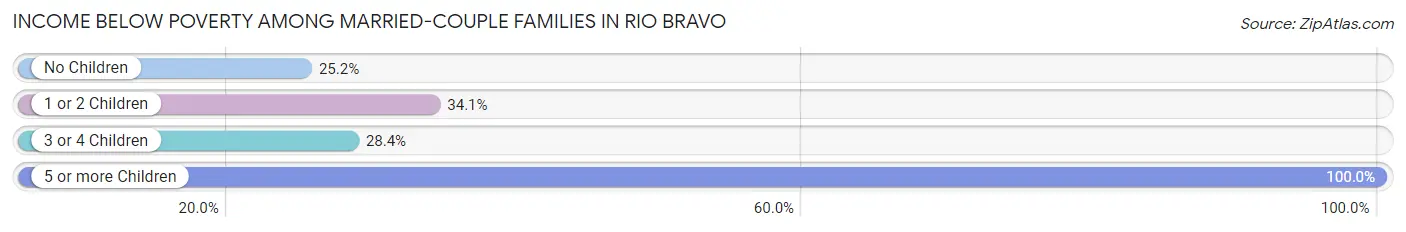
Income Below Poverty Among Married-Couple Families in Rio Bravo
The poverty statistics for married-couple families in Rio Bravo show that 36.6% or 200 of the total 546 families live below the poverty line. Families with 5 or more children have the highest poverty rate of 100.0%, comprising of 60 families. On the other hand, families with no children have the lowest poverty rate of 25.2%, which includes 43 families.
| Children | Above Poverty | Below Poverty |
| No Children | 128 (74.9%) | 43 (25.2%) |
| 1 or 2 Children | 87 (65.9%) | 45 (34.1%) |
| 3 or 4 Children | 131 (71.6%) | 52 (28.4%) |
| 5 or more Children | 0 (0.0%) | 60 (100.0%) |
| Total | 346 (63.4%) | 200 (36.6%) |
Income Below Poverty Among Single-Parent Households in Rio Bravo
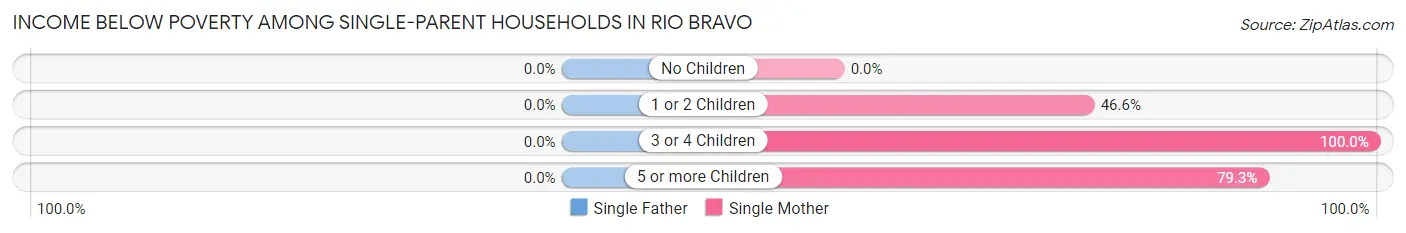
| Children | Single Father | Single Mother |
| No Children | 0 (0.0%) | 0 (0.0%) |
| 1 or 2 Children | 0 (0.0%) | 34 (46.6%) |
| 3 or 4 Children | 0 (0.0%) | 4 (100.0%) |
| 5 or more Children | 0 (0.0%) | 42 (79.2%) |
| Total | 0 (0.0%) | 80 (42.5%) |
Income Below Poverty Among Married-Couple vs Single-Parent Households in Rio Bravo
The poverty data for Rio Bravo shows that 200 of the married-couple family households (36.6%) and 80 of the single-parent households (36.0%) are living below the poverty level. Within the married-couple family households, those with 5 or more children have the highest poverty rate, with 60 households (100.0%) falling below the poverty line. Among the single-parent households, those with 3 or 4 children have the highest poverty rate, with 4 household (100.0%) living below poverty.
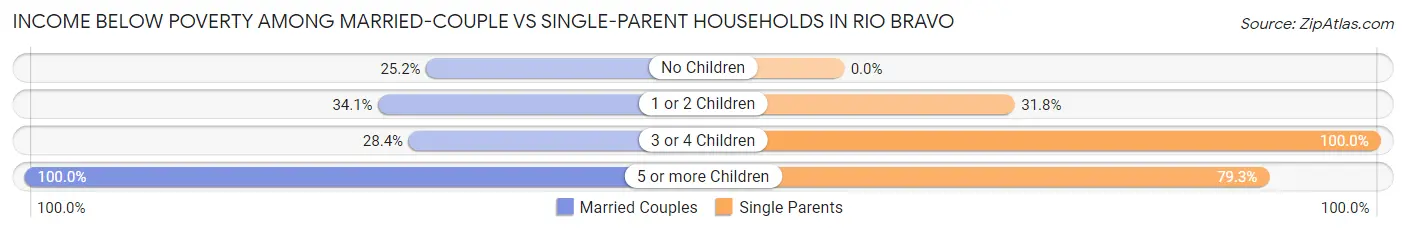
| Children | Married-Couple Families | Single-Parent Households |
| No Children | 43 (25.2%) | 0 (0.0%) |
| 1 or 2 Children | 45 (34.1%) | 34 (31.8%) |
| 3 or 4 Children | 52 (28.4%) | 4 (100.0%) |
| 5 or more Children | 60 (100.0%) | 42 (79.2%) |
| Total | 200 (36.6%) | 80 (36.0%) |
Race in Rio Bravo
The most populous races in Rio Bravo are Hispanic or Latino (4,280 | 96.5%), Two or more Races (2,255 | 50.8%), and White / Caucasian (2,018 | 45.5%).
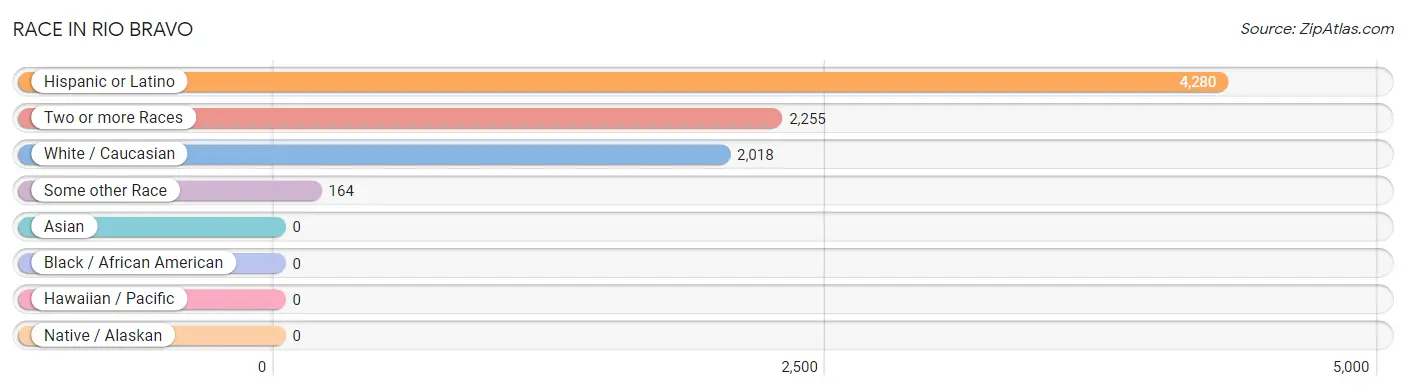
| Race | # Population | % Population |
| Asian | 0 | 0.0% |
| Black / African American | 0 | 0.0% |
| Hawaiian / Pacific | 0 | 0.0% |
| Hispanic or Latino | 4,280 | 96.5% |
| Native / Alaskan | 0 | 0.0% |
| White / Caucasian | 2,018 | 45.5% |
| Two or more Races | 2,255 | 50.8% |
| Some other Race | 164 | 3.7% |
| Total | 4,437 | 100.0% |
Ancestry in Rio Bravo
The most populous ancestries reported in Rio Bravo are , and Mexican (4,214 | 95.0%), together accounting for 95.0% of all Rio Bravo residents.

| Ancestry | # Population | % Population |
| Mexican | 4,214 | 95.0% | View All 1 Rows |
Immigrants in Rio Bravo
The most numerous immigrant groups reported in Rio Bravo came from Central America (1,161 | 26.2%), Latin America (1,161 | 26.2%), Mexico (1,144 | 25.8%), and Guatemala (17 | 0.4%), together accounting for 78.5% of all Rio Bravo residents.
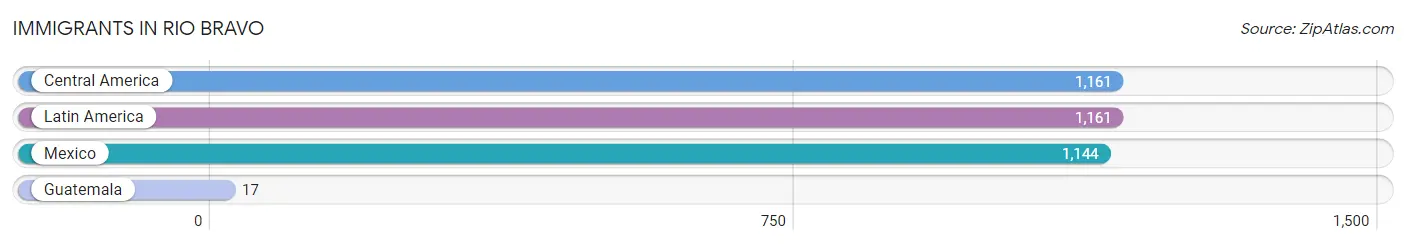
| Immigration Origin | # Population | % Population |
| Central America | 1,161 | 26.2% |
| Guatemala | 17 | 0.4% |
| Latin America | 1,161 | 26.2% |
| Mexico | 1,144 | 25.8% | View All 4 Rows |
Sex and Age in Rio Bravo
Sex and Age in Rio Bravo
The most populous age groups in Rio Bravo are 15 to 19 Years (252 | 12.2%) for men and 5 to 9 Years (327 | 13.8%) for women.
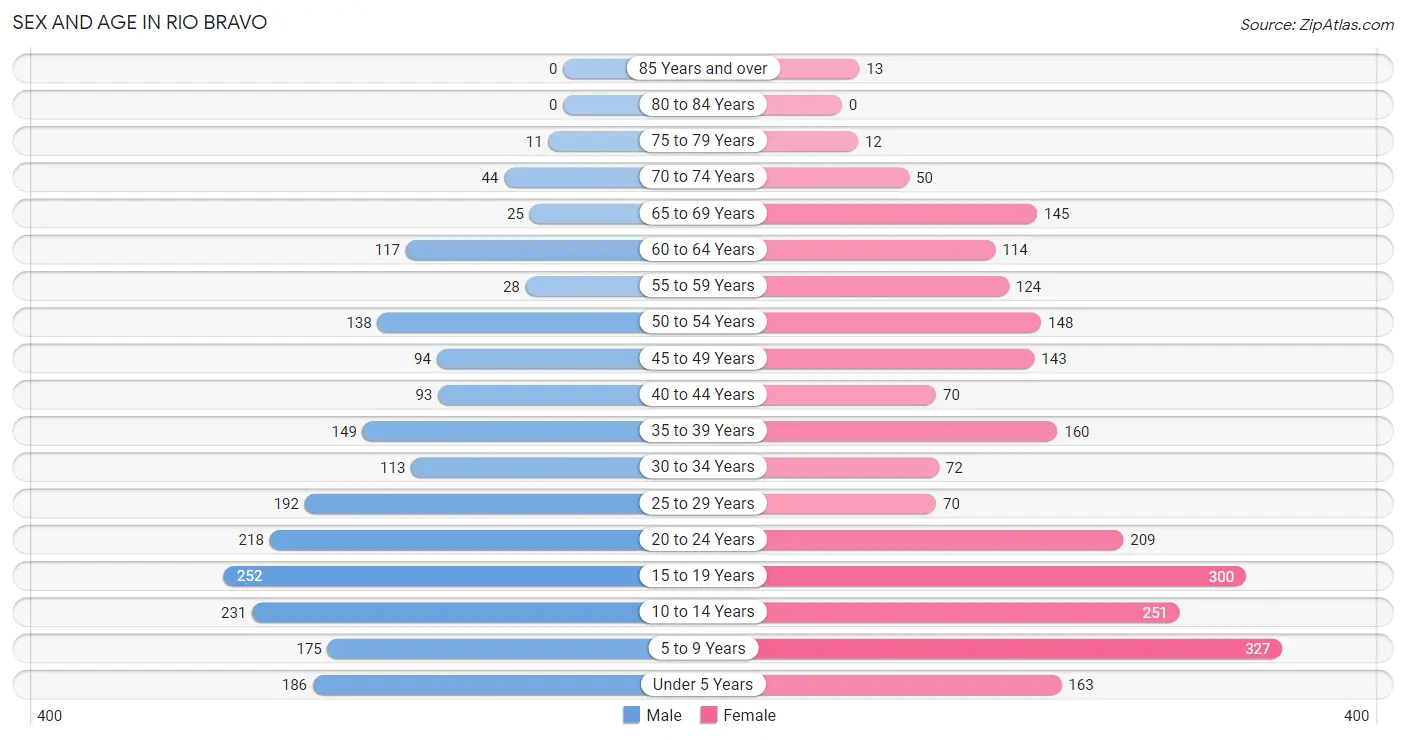
| Age Bracket | Male | Female |
| Under 5 Years | 186 (9.0%) | 163 (6.9%) |
| 5 to 9 Years | 175 (8.5%) | 327 (13.8%) |
| 10 to 14 Years | 231 (11.2%) | 251 (10.6%) |
| 15 to 19 Years | 252 (12.2%) | 300 (12.7%) |
| 20 to 24 Years | 218 (10.5%) | 209 (8.8%) |
| 25 to 29 Years | 192 (9.3%) | 70 (2.9%) |
| 30 to 34 Years | 113 (5.5%) | 72 (3.0%) |
| 35 to 39 Years | 149 (7.2%) | 160 (6.8%) |
| 40 to 44 Years | 93 (4.5%) | 70 (2.9%) |
| 45 to 49 Years | 94 (4.5%) | 143 (6.0%) |
| 50 to 54 Years | 138 (6.7%) | 148 (6.2%) |
| 55 to 59 Years | 28 (1.4%) | 124 (5.2%) |
| 60 to 64 Years | 117 (5.7%) | 114 (4.8%) |
| 65 to 69 Years | 25 (1.2%) | 145 (6.1%) |
| 70 to 74 Years | 44 (2.1%) | 50 (2.1%) |
| 75 to 79 Years | 11 (0.5%) | 12 (0.5%) |
| 80 to 84 Years | 0 (0.0%) | 0 (0.0%) |
| 85 Years and over | 0 (0.0%) | 13 (0.5%) |
| Total | 2,066 (100.0%) | 2,371 (100.0%) |
Families and Households in Rio Bravo
Median Family Size in Rio Bravo
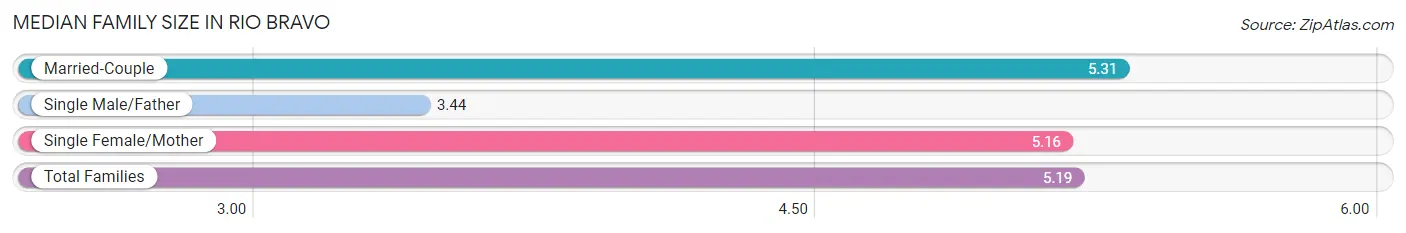
The median family size in Rio Bravo is 5.19 persons per family, with married-couple families (546 | 71.1%) accounting for the largest median family size of 5.31 persons per family. On the other hand, single male/father families (34 | 4.4%) represent the smallest median family size with 3.44 persons per family.
| Family Type | # Families | Family Size |
| Married-Couple | 546 (71.1%) | 5.31 |
| Single Male/Father | 34 (4.4%) | 3.44 |
| Single Female/Mother | 188 (24.5%) | 5.16 |
| Total Families | 768 (100.0%) | 5.19 |
Median Household Size in Rio Bravo
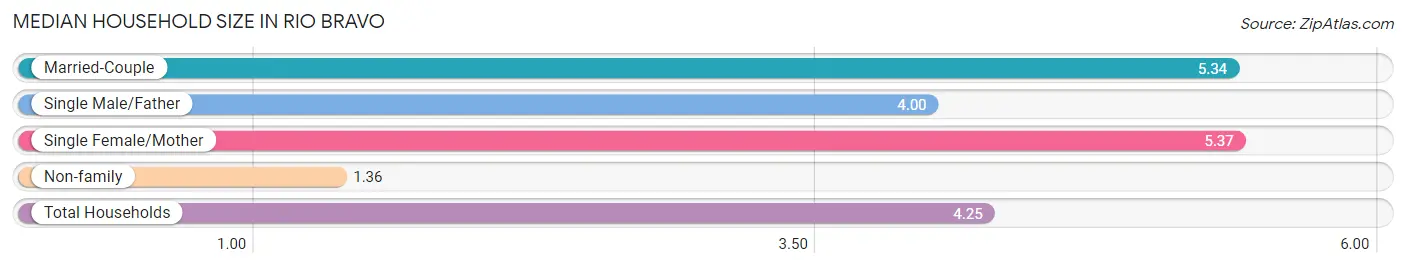
The median household size in Rio Bravo is 4.25 persons per household, with single female/mother households (188 | 18.0%) accounting for the largest median household size of 5.37 persons per household. non-family households (275 | 26.4%) represent the smallest median household size with 1.36 persons per household.
| Household Type | # Households | Household Size |
| Married-Couple | 546 (52.3%) | 5.34 |
| Single Male/Father | 34 (3.3%) | 4.00 |
| Single Female/Mother | 188 (18.0%) | 5.37 |
| Non-family | 275 (26.4%) | 1.36 |
| Total Households | 1,043 (100.0%) | 4.25 |
Household Size by Marriage Status in Rio Bravo
Out of a total of 1,043 households in Rio Bravo, 768 (73.6%) are family households, while 275 (26.4%) are nonfamily households. The most numerous type of family households are 7+ person households, comprising 197, and the most common type of nonfamily households are 1-person households, comprising 213.
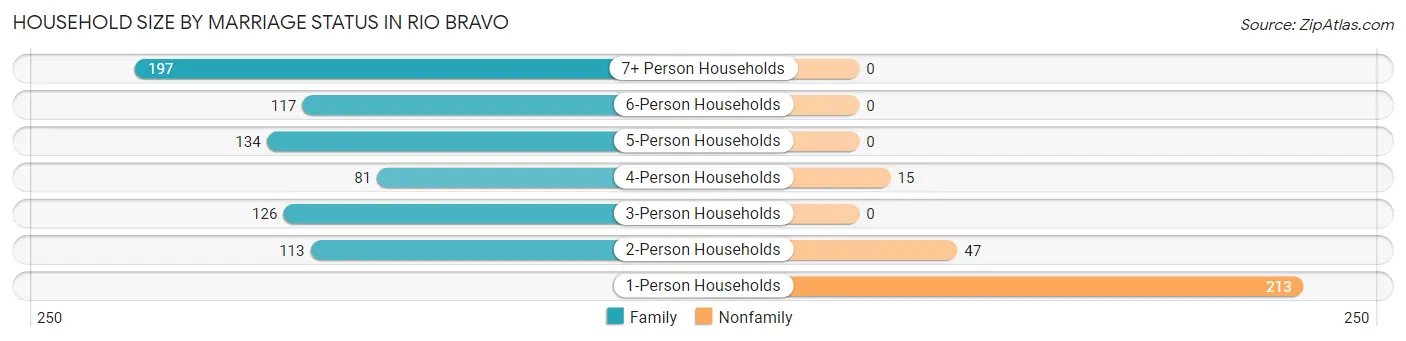
| Household Size | Family Households | Nonfamily Households |
| 1-Person Households | - | 213 (20.4%) |
| 2-Person Households | 113 (10.8%) | 47 (4.5%) |
| 3-Person Households | 126 (12.1%) | 0 (0.0%) |
| 4-Person Households | 81 (7.8%) | 15 (1.4%) |
| 5-Person Households | 134 (12.9%) | 0 (0.0%) |
| 6-Person Households | 117 (11.2%) | 0 (0.0%) |
| 7+ Person Households | 197 (18.9%) | 0 (0.0%) |
| Total | 768 (73.6%) | 275 (26.4%) |
Female Fertility in Rio Bravo
Fertility by Age in Rio Bravo
Average fertility rate in Rio Bravo is 87.0 births per 1,000 women. Women in the age bracket of 20 to 34 years have the highest fertility rate with 182.0 births per 1,000 women. Women in the age bracket of 20 to 34 years acount for 69.6% of all women with births.
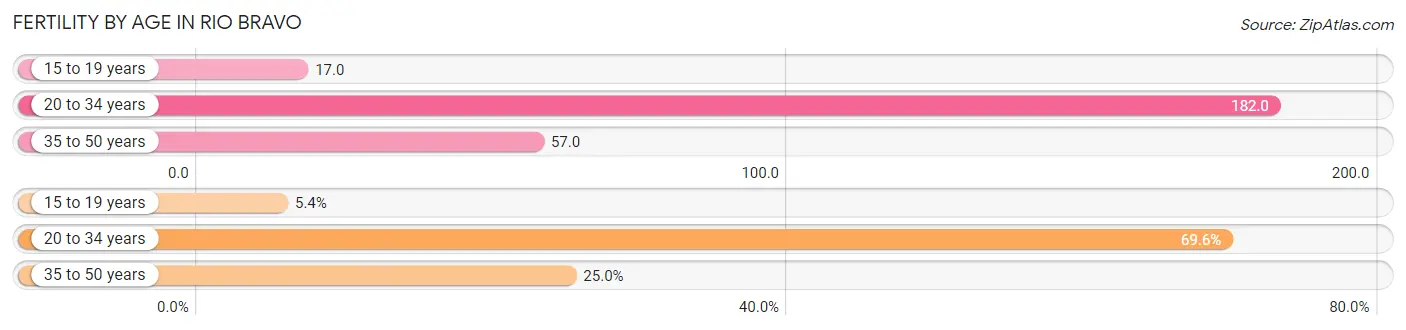
| Age Bracket | Women with Births | Births / 1,000 Women |
| 15 to 19 years | 5 (5.4%) | 17.0 |
| 20 to 34 years | 64 (69.6%) | 182.0 |
| 35 to 50 years | 23 (25.0%) | 57.0 |
| Total | 92 (100.0%) | 87.0 |
Fertility by Age by Marriage Status in Rio Bravo
34.8% of women with births (92) in Rio Bravo are married. The highest percentage of unmarried women with births falls into 15 to 19 years age bracket with 100.0% of them unmarried at the time of birth, while the lowest percentage of unmarried women with births belong to 20 to 34 years age bracket with 62.5% of them unmarried.
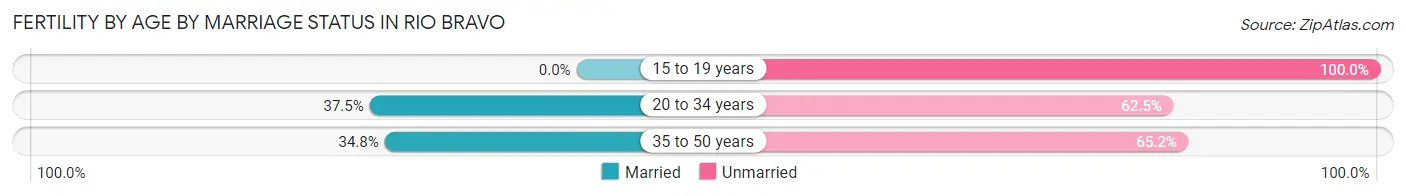
| Age Bracket | Married | Unmarried |
| 15 to 19 years | 0 (0.0%) | 5 (100.0%) |
| 20 to 34 years | 24 (37.5%) | 40 (62.5%) |
| 35 to 50 years | 8 (34.8%) | 15 (65.2%) |
| Total | 32 (34.8%) | 60 (65.2%) |
Fertility by Education in Rio Bravo
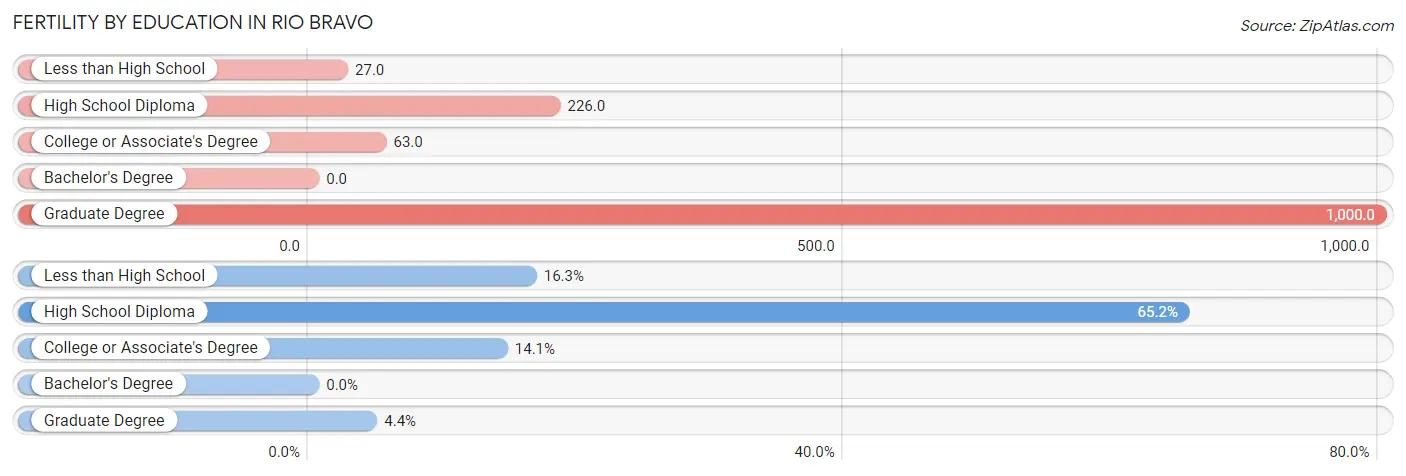
| Educational Attainment | Women with Births | Births / 1,000 Women |
| Less than High School | 15 (16.3%) | 27.0 |
| High School Diploma | 60 (65.2%) | 226.0 |
| College or Associate's Degree | 13 (14.1%) | 63.0 |
| Bachelor's Degree | 0 (0.0%) | 0.0 |
| Graduate Degree | 4 (4.3%) | 1,000.0 |
| Total | 92 (100.0%) | 87.0 |
Fertility by Education by Marriage Status in Rio Bravo
65.2% of women with births in Rio Bravo are unmarried. Women with the educational attainment of graduate degree are most likely to be married with 100.0% of them married at childbirth, while women with the educational attainment of less than high school are least likely to be married with 100.0% of them unmarried at childbirth.
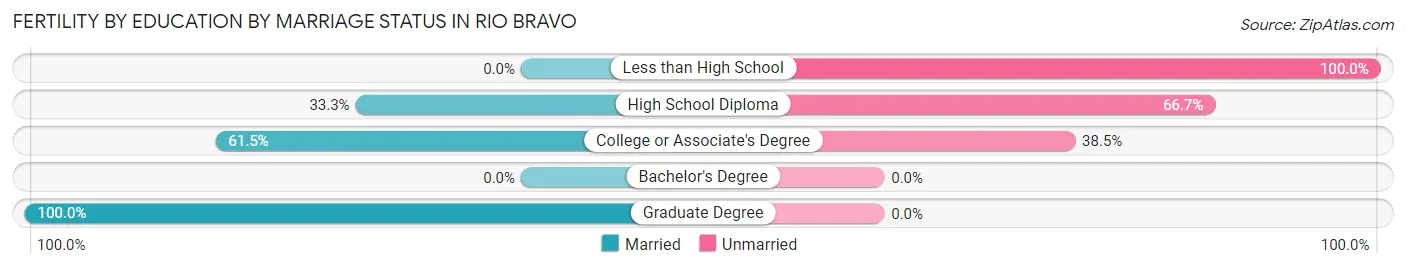
| Educational Attainment | Married | Unmarried |
| Less than High School | 0 (0.0%) | 15 (100.0%) |
| High School Diploma | 20 (33.3%) | 40 (66.7%) |
| College or Associate's Degree | 8 (61.5%) | 5 (38.5%) |
| Bachelor's Degree | 0 (0.0%) | 0 (0.0%) |
| Graduate Degree | 4 (100.0%) | 0 (0.0%) |
| Total | 32 (34.8%) | 60 (65.2%) |
Employment Characteristics in Rio Bravo
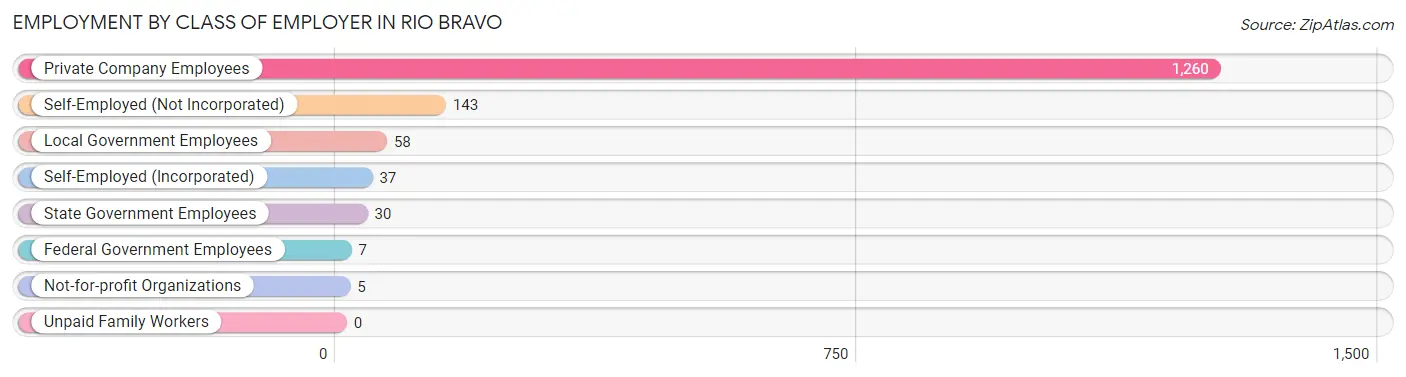
Employment by Class of Employer in Rio Bravo
Among the 1,540 employed individuals in Rio Bravo, private company employees (1,260 | 81.8%), self-employed (not incorporated) (143 | 9.3%), and local government employees (58 | 3.8%) make up the most common classes of employment.
| Employer Class | # Employees | % Employees |
| Private Company Employees | 1,260 | 81.8% |
| Self-Employed (Incorporated) | 37 | 2.4% |
| Self-Employed (Not Incorporated) | 143 | 9.3% |
| Not-for-profit Organizations | 5 | 0.3% |
| Local Government Employees | 58 | 3.8% |
| State Government Employees | 30 | 1.9% |
| Federal Government Employees | 7 | 0.4% |
| Unpaid Family Workers | 0 | 0.0% |
| Total | 1,540 | 100.0% |
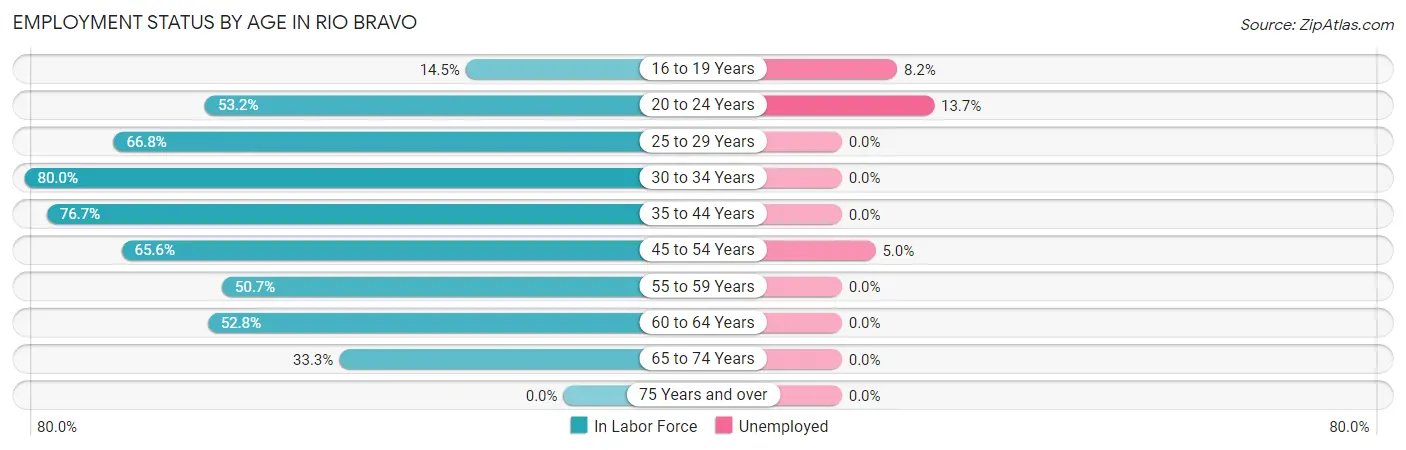
Employment Status by Age in Rio Bravo
According to the labor force statistics for Rio Bravo, out of the total population over 16 years of age (2,974), 53.9% or 1,603 individuals are in the labor force, with 3.3% or 53 of them unemployed. The age group with the highest labor force participation rate is 30 to 34 years, with 80.0% or 148 individuals in the labor force. Within the labor force, the 20 to 24 years age range has the highest percentage of unemployed individuals, with 13.7% or 31 of them being unemployed.
| Age Bracket | In Labor Force | Unemployed |
| 16 to 19 Years | 61 (14.5%) | 5 (8.2%) |
| 20 to 24 Years | 227 (53.2%) | 31 (13.7%) |
| 25 to 29 Years | 175 (66.8%) | 0 (0.0%) |
| 30 to 34 Years | 148 (80.0%) | 0 (0.0%) |
| 35 to 44 Years | 362 (76.7%) | 0 (0.0%) |
| 45 to 54 Years | 343 (65.6%) | 17 (5.0%) |
| 55 to 59 Years | 77 (50.7%) | 0 (0.0%) |
| 60 to 64 Years | 122 (52.8%) | 0 (0.0%) |
| 65 to 74 Years | 88 (33.3%) | 0 (0.0%) |
| 75 Years and over | 0 (0.0%) | 0 (0.0%) |
| Total | 1,603 (53.9%) | 53 (3.3%) |
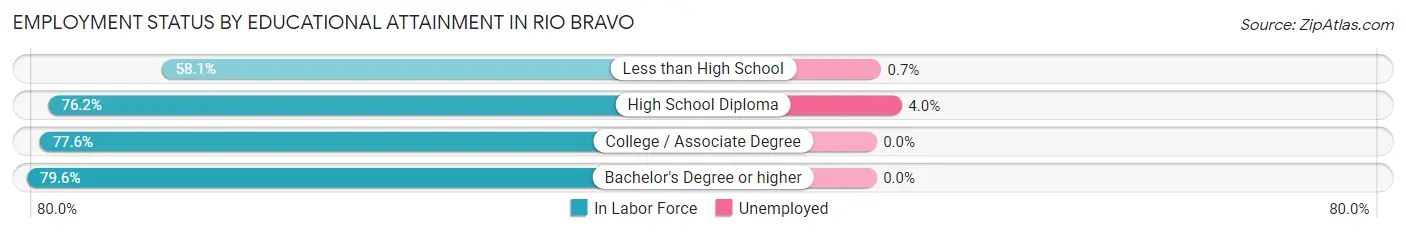
Employment Status by Educational Attainment in Rio Bravo
According to labor force statistics for Rio Bravo, 67.2% of individuals (1,226) out of the total population between 25 and 64 years of age (1,825) are in the labor force, with 1.4% or 17 of them being unemployed. The group with the highest labor force participation rate are those with the educational attainment of bachelor's degree or higher, with 79.6% or 74 individuals in the labor force. Within the labor force, individuals with high school diploma education have the highest percentage of unemployment, with 4.0% or 13 of them being unemployed.
| Educational Attainment | In Labor Force | Unemployed |
| Less than High School | 550 (58.1%) | 7 (0.7%) |
| High School Diploma | 326 (76.2%) | 17 (4.0%) |
| College / Associate Degree | 277 (77.6%) | 0 (0.0%) |
| Bachelor's Degree or higher | 74 (79.6%) | 0 (0.0%) |
| Total | 1,226 (67.2%) | 26 (1.4%) |
Employment Occupations by Sex in Rio Bravo
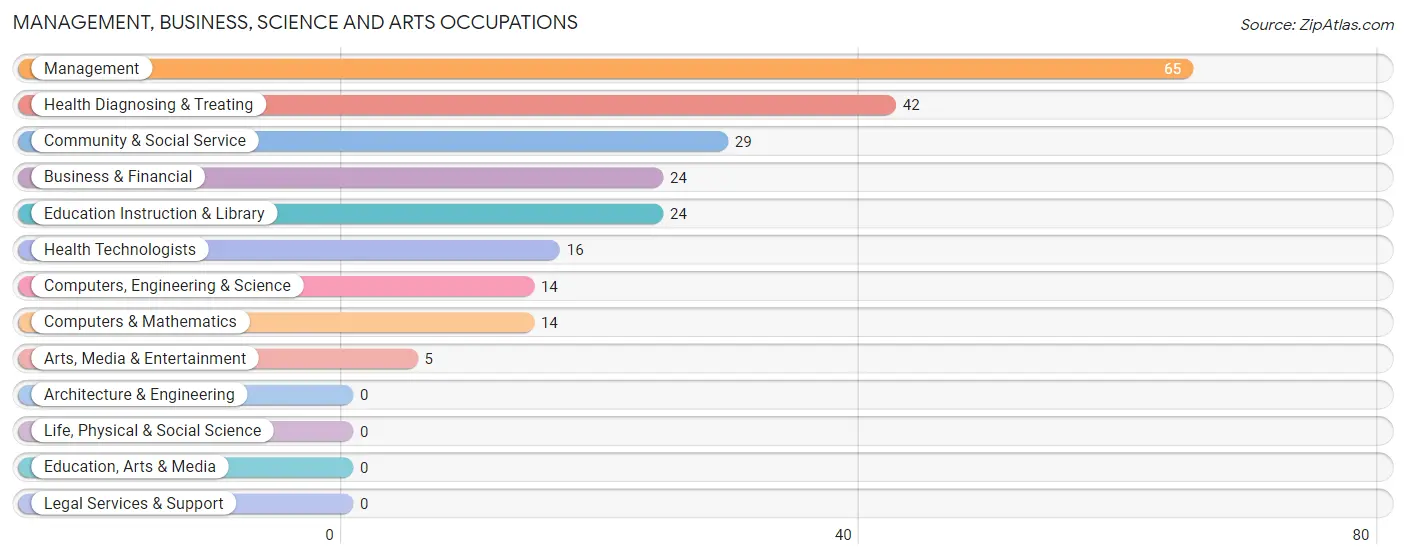
Management, Business, Science and Arts Occupations
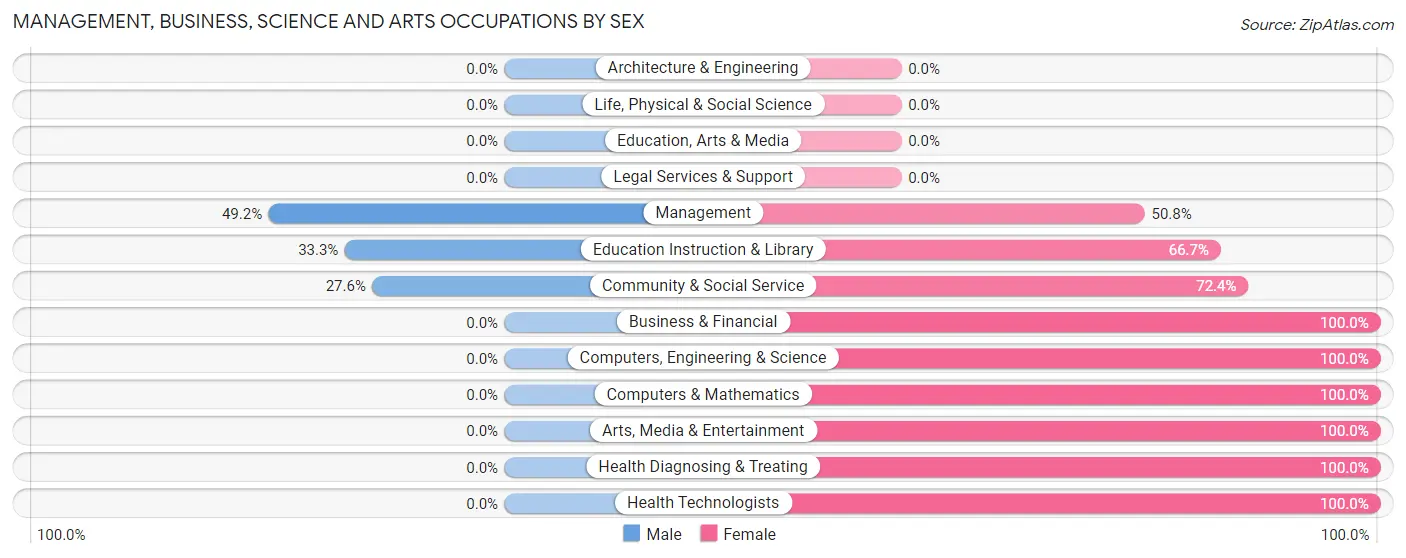
The most common Management, Business, Science and Arts occupations in Rio Bravo are Management (65 | 4.2%), Health Diagnosing & Treating (42 | 2.7%), Community & Social Service (29 | 1.9%), Business & Financial (24 | 1.5%), and Education Instruction & Library (24 | 1.5%).
Management, Business, Science and Arts Occupations by Sex
Within the Management, Business, Science and Arts occupations in Rio Bravo, the most male-oriented occupations are Management (49.2%), Education Instruction & Library (33.3%), and Community & Social Service (27.6%), while the most female-oriented occupations are Business & Financial (100.0%), Computers, Engineering & Science (100.0%), and Computers & Mathematics (100.0%).
| Occupation | Male | Female |
| Management | 32 (49.2%) | 33 (50.8%) |
| Business & Financial | 0 (0.0%) | 24 (100.0%) |
| Computers, Engineering & Science | 0 (0.0%) | 14 (100.0%) |
| Computers & Mathematics | 0 (0.0%) | 14 (100.0%) |
| Architecture & Engineering | 0 (0.0%) | 0 (0.0%) |
| Life, Physical & Social Science | 0 (0.0%) | 0 (0.0%) |
| Community & Social Service | 8 (27.6%) | 21 (72.4%) |
| Education, Arts & Media | 0 (0.0%) | 0 (0.0%) |
| Legal Services & Support | 0 (0.0%) | 0 (0.0%) |
| Education Instruction & Library | 8 (33.3%) | 16 (66.7%) |
| Arts, Media & Entertainment | 0 (0.0%) | 5 (100.0%) |
| Health Diagnosing & Treating | 0 (0.0%) | 42 (100.0%) |
| Health Technologists | 0 (0.0%) | 16 (100.0%) |
| Total (Category) | 40 (23.0%) | 134 (77.0%) |
| Total (Overall) | 867 (55.9%) | 683 (44.1%) |
Services Occupations
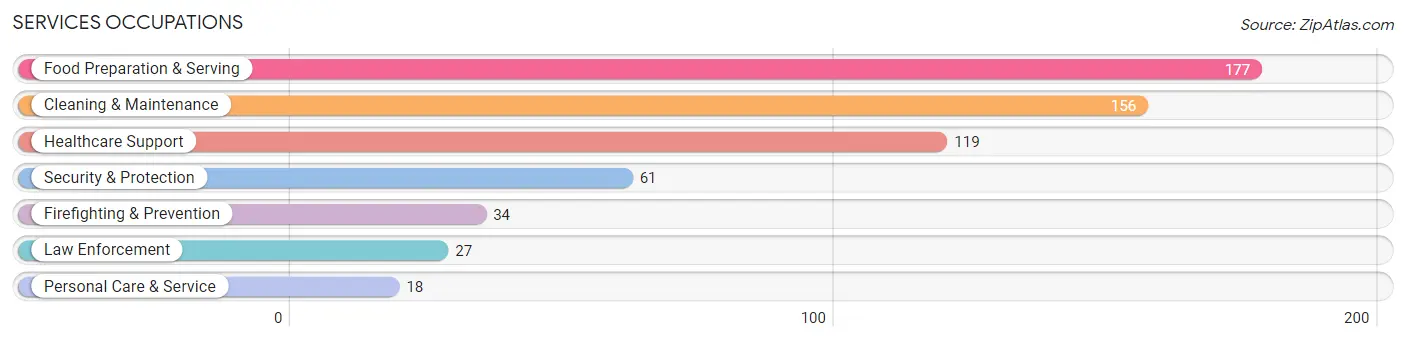
The most common Services occupations in Rio Bravo are Food Preparation & Serving (177 | 11.4%), Cleaning & Maintenance (156 | 10.1%), Healthcare Support (119 | 7.7%), Security & Protection (61 | 3.9%), and Firefighting & Prevention (34 | 2.2%).
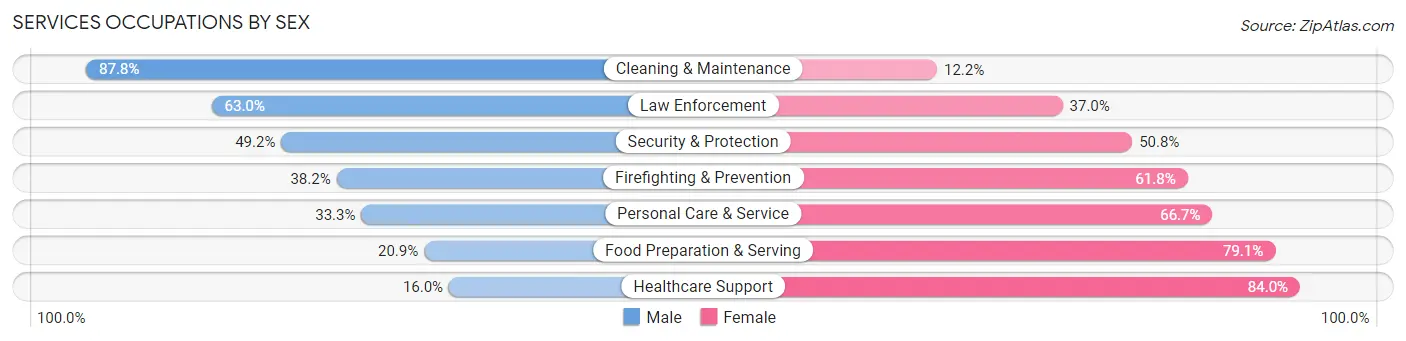
Services Occupations by Sex
Within the Services occupations in Rio Bravo, the most male-oriented occupations are Cleaning & Maintenance (87.8%), Law Enforcement (63.0%), and Security & Protection (49.2%), while the most female-oriented occupations are Healthcare Support (84.0%), Food Preparation & Serving (79.1%), and Personal Care & Service (66.7%).
| Occupation | Male | Female |
| Healthcare Support | 19 (16.0%) | 100 (84.0%) |
| Security & Protection | 30 (49.2%) | 31 (50.8%) |
| Firefighting & Prevention | 13 (38.2%) | 21 (61.8%) |
| Law Enforcement | 17 (63.0%) | 10 (37.0%) |
| Food Preparation & Serving | 37 (20.9%) | 140 (79.1%) |
| Cleaning & Maintenance | 137 (87.8%) | 19 (12.2%) |
| Personal Care & Service | 6 (33.3%) | 12 (66.7%) |
| Total (Category) | 229 (43.1%) | 302 (56.9%) |
| Total (Overall) | 867 (55.9%) | 683 (44.1%) |
Sales and Office Occupations
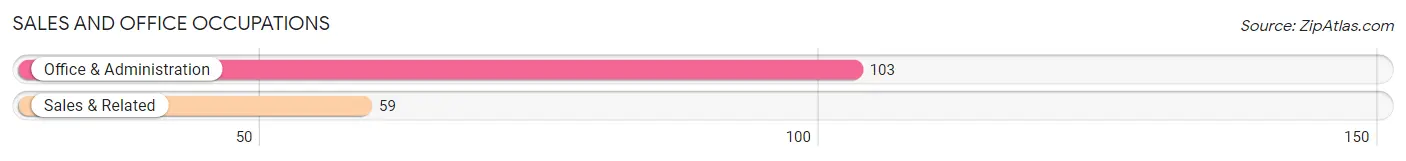
The most common Sales and Office occupations in Rio Bravo are Office & Administration (103 | 6.7%), and Sales & Related (59 | 3.8%).
Sales and Office Occupations by Sex
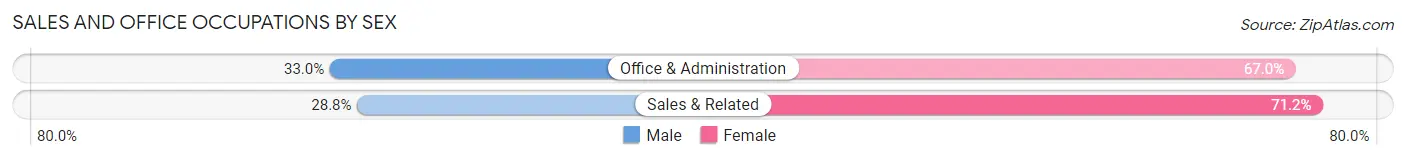
| Occupation | Male | Female |
| Sales & Related | 17 (28.8%) | 42 (71.2%) |
| Office & Administration | 34 (33.0%) | 69 (67.0%) |
| Total (Category) | 51 (31.5%) | 111 (68.5%) |
| Total (Overall) | 867 (55.9%) | 683 (44.1%) |
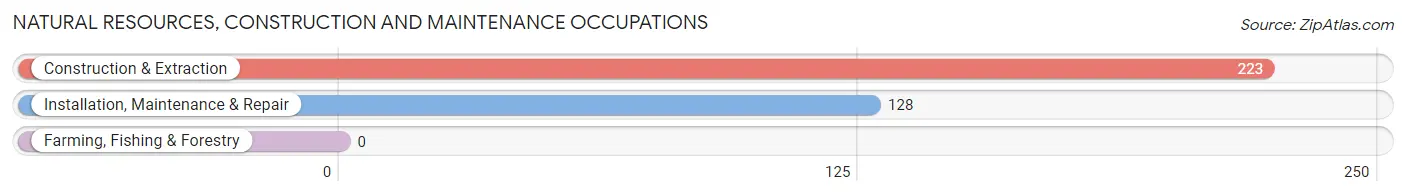
Natural Resources, Construction and Maintenance Occupations
The most common Natural Resources, Construction and Maintenance occupations in Rio Bravo are Construction & Extraction (223 | 14.4%), and Installation, Maintenance & Repair (128 | 8.3%).
Natural Resources, Construction and Maintenance Occupations by Sex
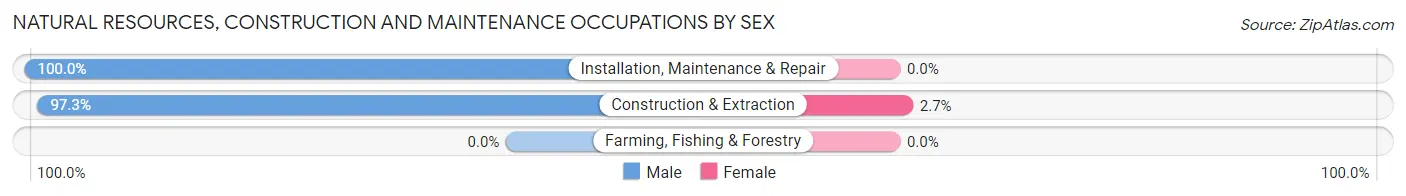
| Occupation | Male | Female |
| Farming, Fishing & Forestry | 0 (0.0%) | 0 (0.0%) |
| Construction & Extraction | 217 (97.3%) | 6 (2.7%) |
| Installation, Maintenance & Repair | 128 (100.0%) | 0 (0.0%) |
| Total (Category) | 345 (98.3%) | 6 (1.7%) |
| Total (Overall) | 867 (55.9%) | 683 (44.1%) |
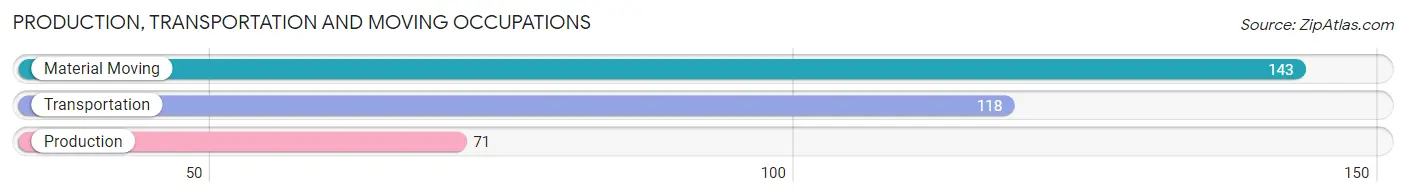
Production, Transportation and Moving Occupations
The most common Production, Transportation and Moving occupations in Rio Bravo are Material Moving (143 | 9.2%), Transportation (118 | 7.6%), and Production (71 | 4.6%).
Production, Transportation and Moving Occupations by Sex
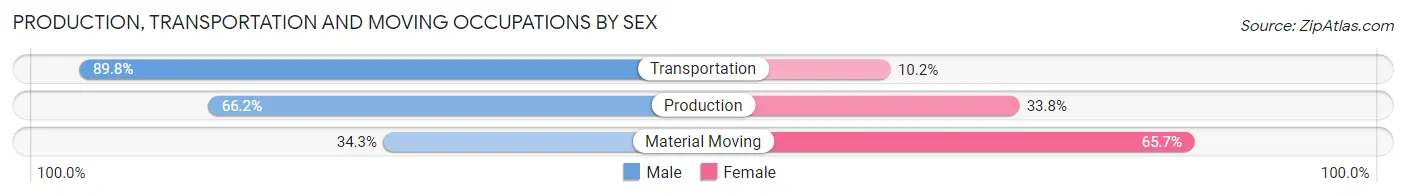
| Occupation | Male | Female |
| Production | 47 (66.2%) | 24 (33.8%) |
| Transportation | 106 (89.8%) | 12 (10.2%) |
| Material Moving | 49 (34.3%) | 94 (65.7%) |
| Total (Category) | 202 (60.8%) | 130 (39.2%) |
| Total (Overall) | 867 (55.9%) | 683 (44.1%) |
Employment Industries by Sex in Rio Bravo
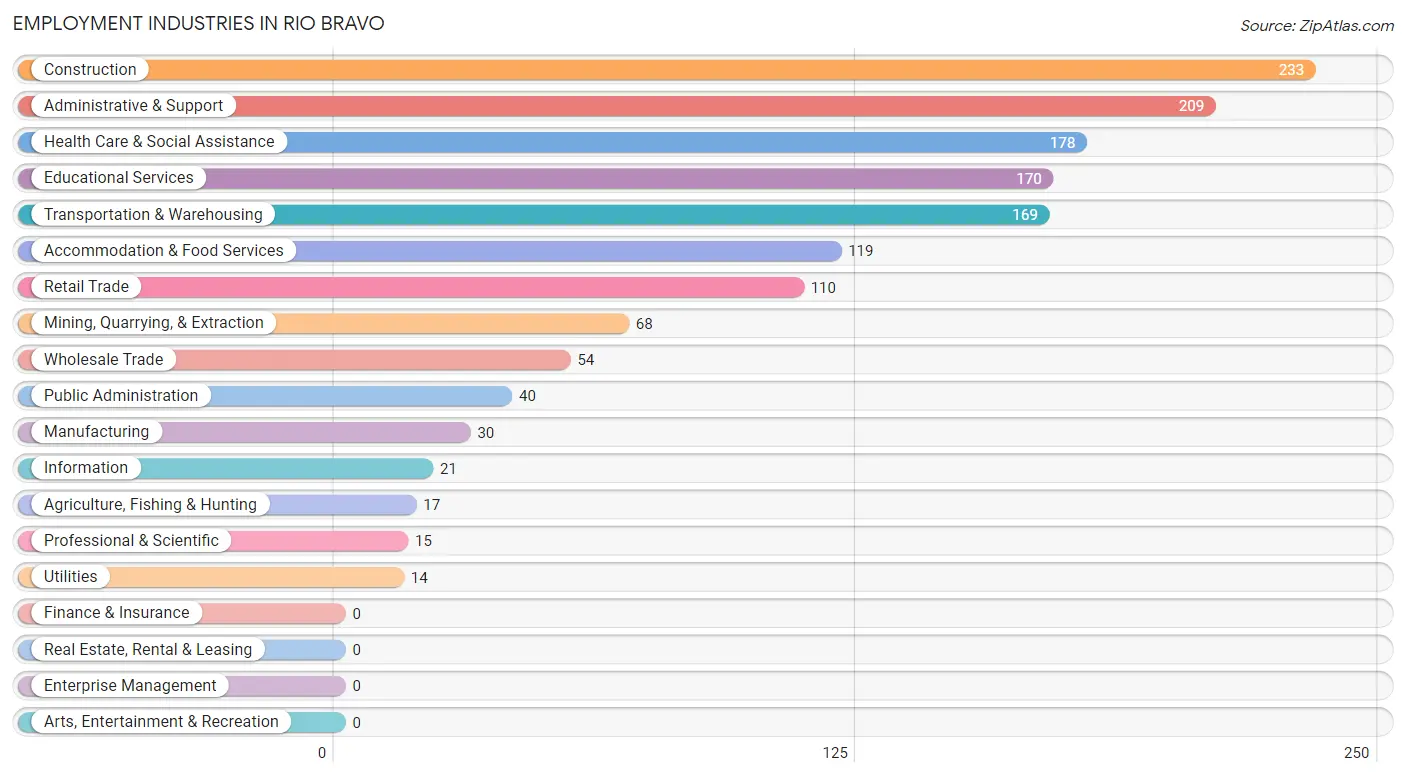
Employment Industries in Rio Bravo
The major employment industries in Rio Bravo include Construction (233 | 15.0%), Administrative & Support (209 | 13.5%), Health Care & Social Assistance (178 | 11.5%), Educational Services (170 | 11.0%), and Transportation & Warehousing (169 | 10.9%).
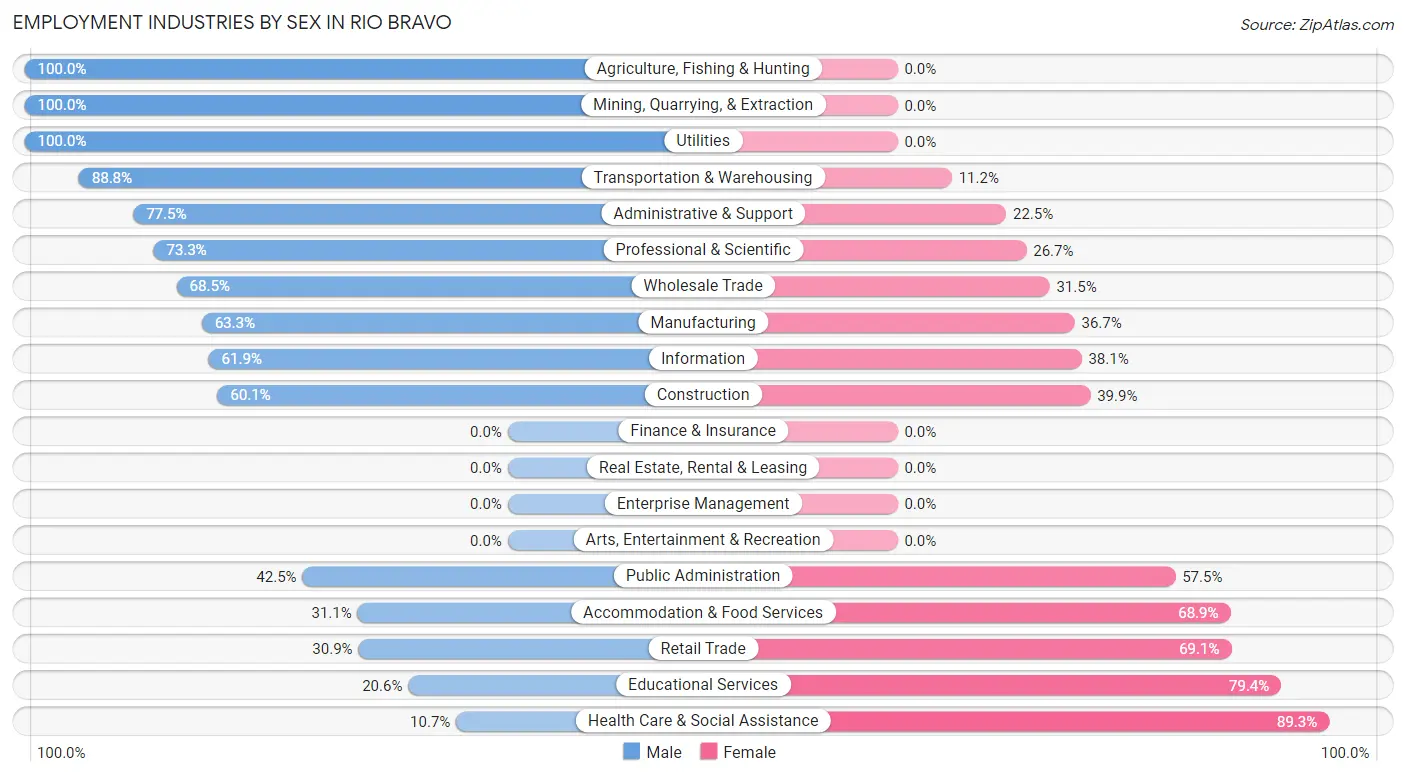
Employment Industries by Sex in Rio Bravo
The Rio Bravo industries that see more men than women are Agriculture, Fishing & Hunting (100.0%), Mining, Quarrying, & Extraction (100.0%), and Utilities (100.0%), whereas the industries that tend to have a higher number of women are Health Care & Social Assistance (89.3%), Educational Services (79.4%), and Retail Trade (69.1%).
| Industry | Male | Female |
| Agriculture, Fishing & Hunting | 17 (100.0%) | 0 (0.0%) |
| Mining, Quarrying, & Extraction | 68 (100.0%) | 0 (0.0%) |
| Construction | 140 (60.1%) | 93 (39.9%) |
| Manufacturing | 19 (63.3%) | 11 (36.7%) |
| Wholesale Trade | 37 (68.5%) | 17 (31.5%) |
| Retail Trade | 34 (30.9%) | 76 (69.1%) |
| Transportation & Warehousing | 150 (88.8%) | 19 (11.2%) |
| Utilities | 14 (100.0%) | 0 (0.0%) |
| Information | 13 (61.9%) | 8 (38.1%) |
| Finance & Insurance | 0 (0.0%) | 0 (0.0%) |
| Real Estate, Rental & Leasing | 0 (0.0%) | 0 (0.0%) |
| Professional & Scientific | 11 (73.3%) | 4 (26.7%) |
| Enterprise Management | 0 (0.0%) | 0 (0.0%) |
| Administrative & Support | 162 (77.5%) | 47 (22.5%) |
| Educational Services | 35 (20.6%) | 135 (79.4%) |
| Health Care & Social Assistance | 19 (10.7%) | 159 (89.3%) |
| Arts, Entertainment & Recreation | 0 (0.0%) | 0 (0.0%) |
| Accommodation & Food Services | 37 (31.1%) | 82 (68.9%) |
| Public Administration | 17 (42.5%) | 23 (57.5%) |
| Total | 867 (55.9%) | 683 (44.1%) |
Education in Rio Bravo
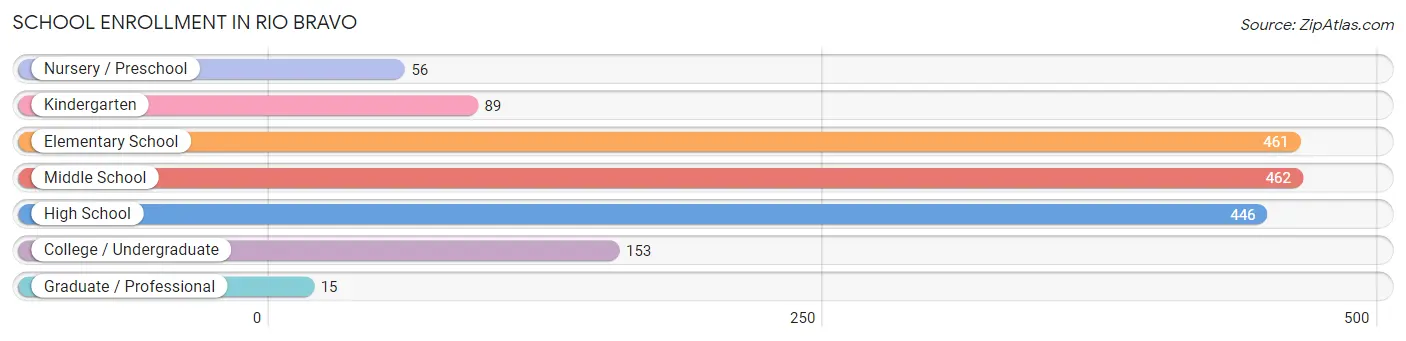
School Enrollment in Rio Bravo
The most common levels of schooling among the 1,682 students in Rio Bravo are middle school (462 | 27.5%), elementary school (461 | 27.4%), and high school (446 | 26.5%).
| School Level | # Students | % Students |
| Nursery / Preschool | 56 | 3.3% |
| Kindergarten | 89 | 5.3% |
| Elementary School | 461 | 27.4% |
| Middle School | 462 | 27.5% |
| High School | 446 | 26.5% |
| College / Undergraduate | 153 | 9.1% |
| Graduate / Professional | 15 | 0.9% |
| Total | 1,682 | 100.0% |
School Enrollment by Age by Funding Source in Rio Bravo
Out of a total of 1,682 students who are enrolled in schools in Rio Bravo, 35 (2.1%) attend a private institution, while the remaining 1,647 (97.9%) are enrolled in public schools. The age group of 15 to 17 year olds has the highest likelihood of being enrolled in private schools, with 14 (4.0% in the age bracket) enrolled. Conversely, the age group of 3 to 4 year olds has the lowest likelihood of being enrolled in a private school, with 62 (100.0% in the age bracket) attending a public institution.
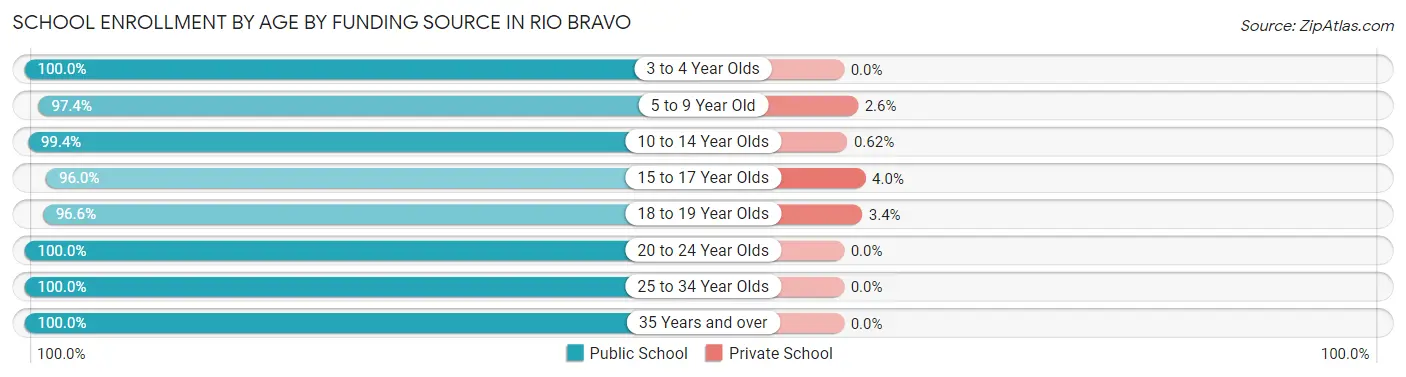
| Age Bracket | Public School | Private School |
| 3 to 4 Year Olds | 62 (100.0%) | 0 (0.0%) |
| 5 to 9 Year Old | 485 (97.4%) | 13 (2.6%) |
| 10 to 14 Year Olds | 479 (99.4%) | 3 (0.6%) |
| 15 to 17 Year Olds | 336 (96.0%) | 14 (4.0%) |
| 18 to 19 Year Olds | 143 (96.6%) | 5 (3.4%) |
| 20 to 24 Year Olds | 115 (100.0%) | 0 (0.0%) |
| 25 to 34 Year Olds | 23 (100.0%) | 0 (0.0%) |
| 35 Years and over | 4 (100.0%) | 0 (0.0%) |
| Total | 1,647 (97.9%) | 35 (2.1%) |
Educational Attainment by Field of Study in Rio Bravo
Engineering (23 | 23.5%), arts & humanities (22 | 22.5%), business (19 | 19.4%), education (15 | 15.3%), and science & technology (14 | 14.3%) are the most common fields of study among 98 individuals in Rio Bravo who have obtained a bachelor's degree or higher.
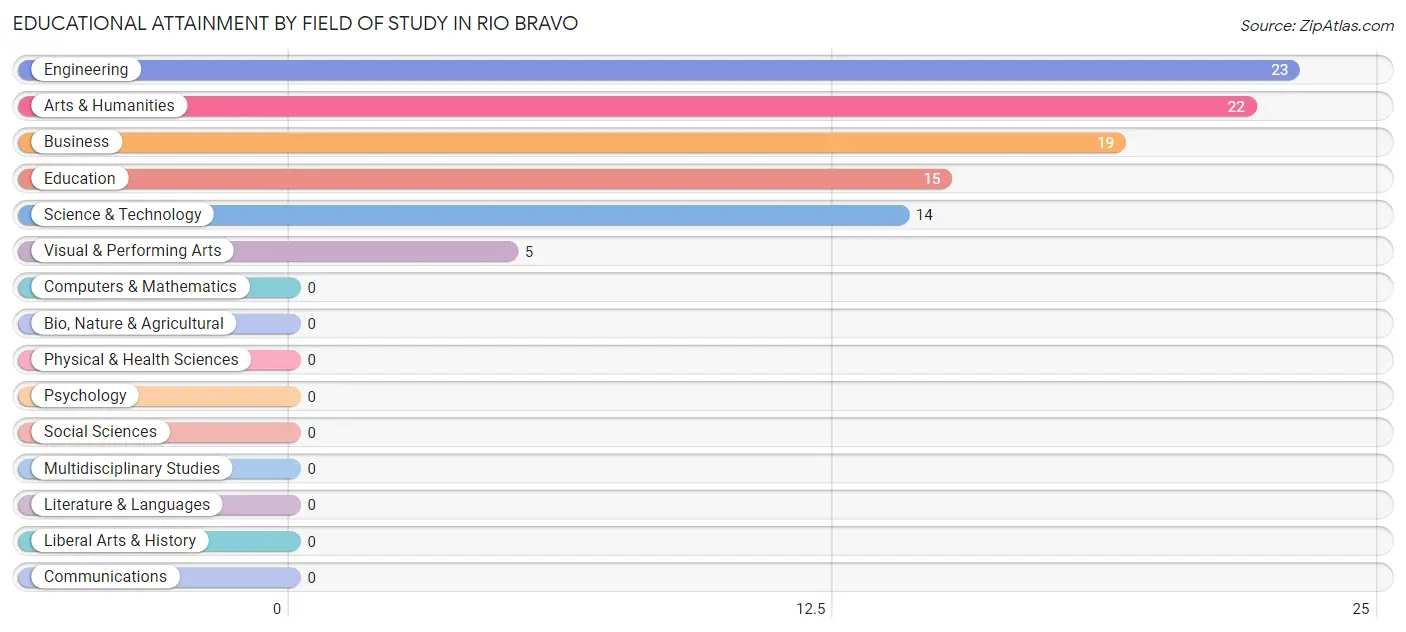
| Field of Study | # Graduates | % Graduates |
| Computers & Mathematics | 0 | 0.0% |
| Bio, Nature & Agricultural | 0 | 0.0% |
| Physical & Health Sciences | 0 | 0.0% |
| Psychology | 0 | 0.0% |
| Social Sciences | 0 | 0.0% |
| Engineering | 23 | 23.5% |
| Multidisciplinary Studies | 0 | 0.0% |
| Science & Technology | 14 | 14.3% |
| Business | 19 | 19.4% |
| Education | 15 | 15.3% |
| Literature & Languages | 0 | 0.0% |
| Liberal Arts & History | 0 | 0.0% |
| Visual & Performing Arts | 5 | 5.1% |
| Communications | 0 | 0.0% |
| Arts & Humanities | 22 | 22.5% |
| Total | 98 | 100.0% |
Transportation & Commute in Rio Bravo
Vehicle Availability by Sex in Rio Bravo
The most prevalent vehicle ownership categories in Rio Bravo are males with 2 vehicles (495, accounting for 57.1%) and females with 2 vehicles (380, making up 73.6%).
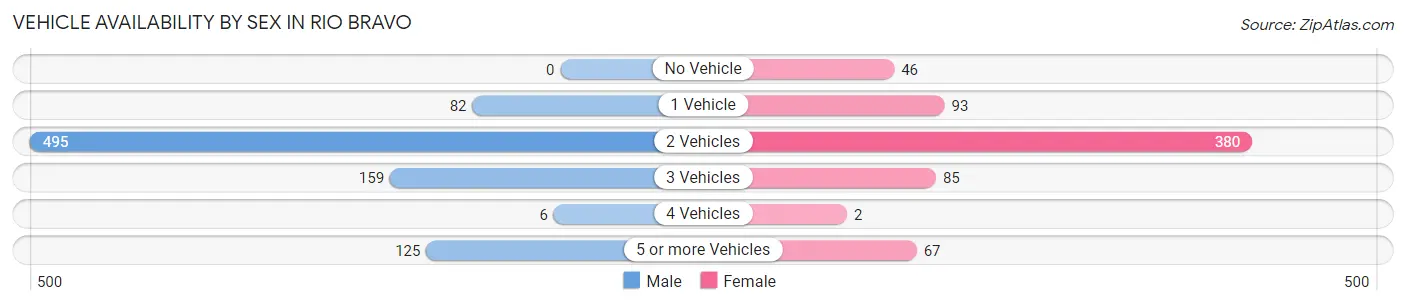
| Vehicles Available | Male | Female |
| No Vehicle | 0 (0.0%) | 46 (6.8%) |
| 1 Vehicle | 82 (9.5%) | 93 (13.8%) |
| 2 Vehicles | 495 (57.1%) | 380 (56.5%) |
| 3 Vehicles | 159 (18.3%) | 85 (12.6%) |
| 4 Vehicles | 6 (0.7%) | 2 (0.3%) |
| 5 or more Vehicles | 125 (14.4%) | 67 (10.0%) |
| Total | 867 (100.0%) | 673 (100.0%) |
Commute Time in Rio Bravo
The most frequently occuring commute durations in Rio Bravo are 45 to 59 minutes (284 commuters, 18.7%), 10 to 14 minutes (198 commuters, 13.0%), and 20 to 24 minutes (194 commuters, 12.8%).
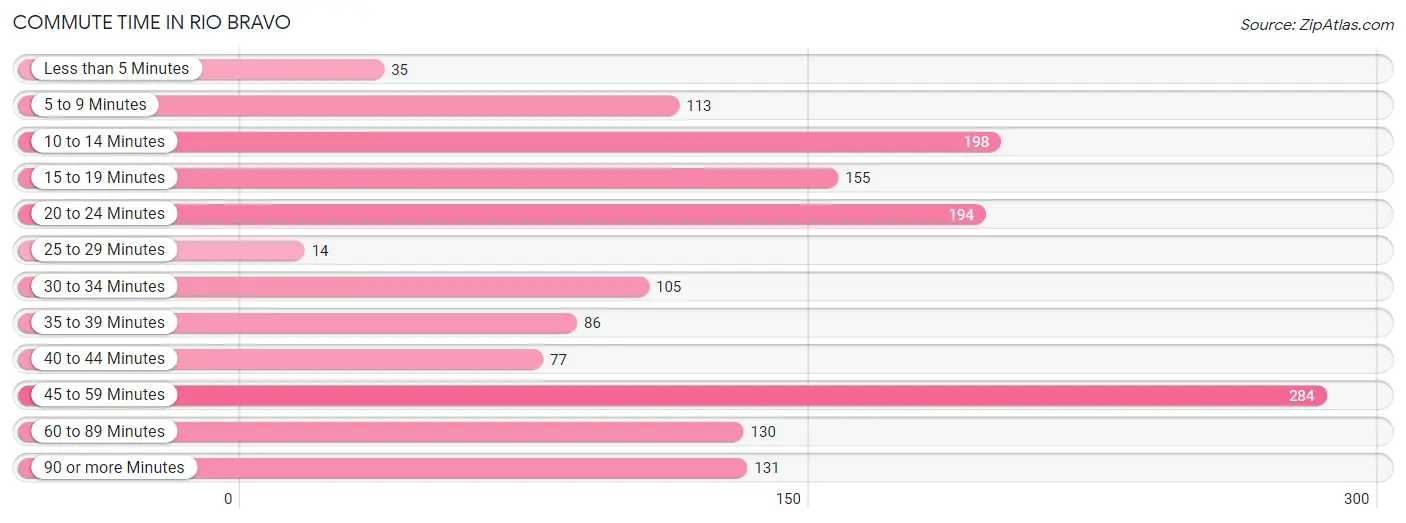
| Commute Time | # Commuters | % Commuters |
| Less than 5 Minutes | 35 | 2.3% |
| 5 to 9 Minutes | 113 | 7.4% |
| 10 to 14 Minutes | 198 | 13.0% |
| 15 to 19 Minutes | 155 | 10.2% |
| 20 to 24 Minutes | 194 | 12.8% |
| 25 to 29 Minutes | 14 | 0.9% |
| 30 to 34 Minutes | 105 | 6.9% |
| 35 to 39 Minutes | 86 | 5.7% |
| 40 to 44 Minutes | 77 | 5.1% |
| 45 to 59 Minutes | 284 | 18.7% |
| 60 to 89 Minutes | 130 | 8.5% |
| 90 or more Minutes | 131 | 8.6% |
Commute Time by Sex in Rio Bravo
The most common commute times in Rio Bravo are 45 to 59 minutes (218 commuters, 25.7%) for males and 10 to 14 minutes (147 commuters, 21.8%) for females.
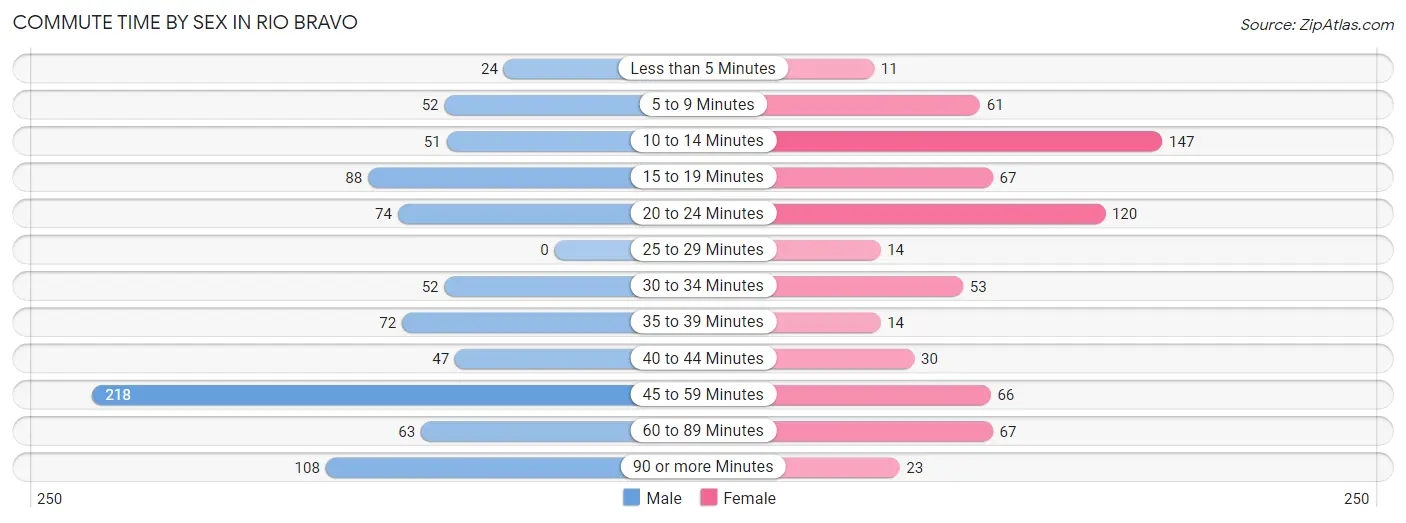
| Commute Time | Male | Female |
| Less than 5 Minutes | 24 (2.8%) | 11 (1.6%) |
| 5 to 9 Minutes | 52 (6.1%) | 61 (9.1%) |
| 10 to 14 Minutes | 51 (6.0%) | 147 (21.8%) |
| 15 to 19 Minutes | 88 (10.4%) | 67 (10.0%) |
| 20 to 24 Minutes | 74 (8.7%) | 120 (17.8%) |
| 25 to 29 Minutes | 0 (0.0%) | 14 (2.1%) |
| 30 to 34 Minutes | 52 (6.1%) | 53 (7.9%) |
| 35 to 39 Minutes | 72 (8.5%) | 14 (2.1%) |
| 40 to 44 Minutes | 47 (5.5%) | 30 (4.5%) |
| 45 to 59 Minutes | 218 (25.7%) | 66 (9.8%) |
| 60 to 89 Minutes | 63 (7.4%) | 67 (10.0%) |
| 90 or more Minutes | 108 (12.7%) | 23 (3.4%) |
Time of Departure to Work by Sex in Rio Bravo
The most frequent times of departure to work in Rio Bravo are 5:00 AM to 5:29 AM (188, 22.1%) for males and 6:30 AM to 6:59 AM (159, 23.6%) for females.
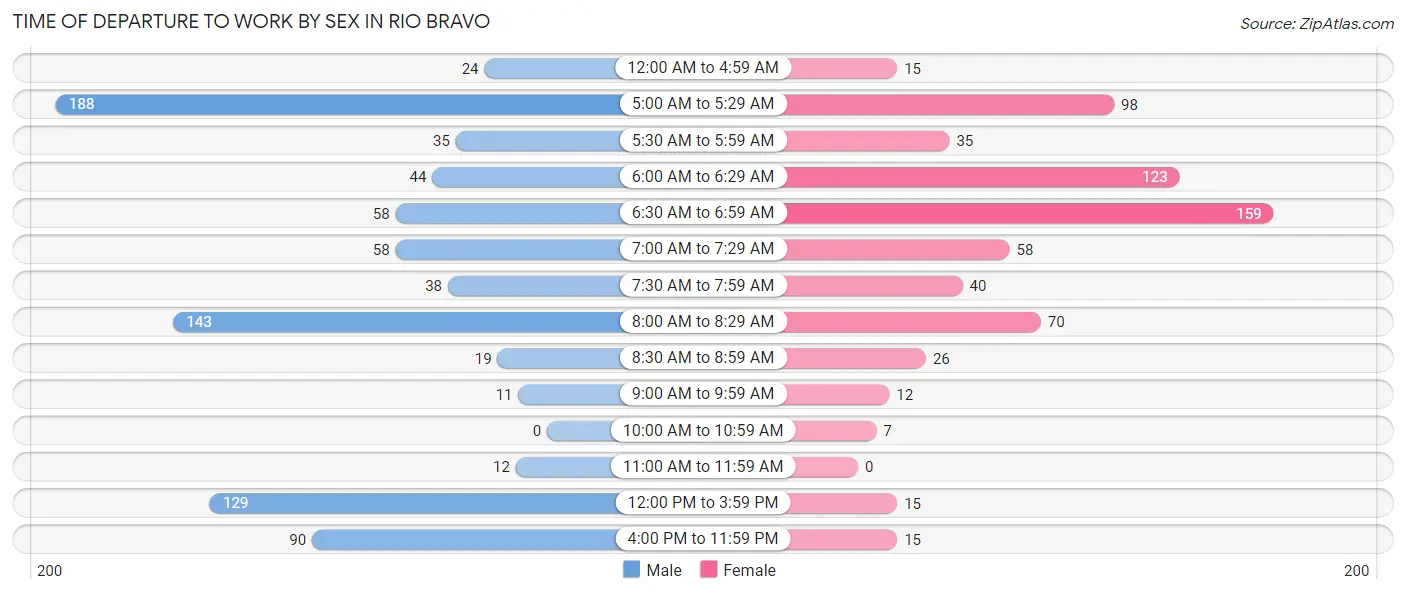
| Time of Departure | Male | Female |
| 12:00 AM to 4:59 AM | 24 (2.8%) | 15 (2.2%) |
| 5:00 AM to 5:29 AM | 188 (22.1%) | 98 (14.6%) |
| 5:30 AM to 5:59 AM | 35 (4.1%) | 35 (5.2%) |
| 6:00 AM to 6:29 AM | 44 (5.2%) | 123 (18.3%) |
| 6:30 AM to 6:59 AM | 58 (6.8%) | 159 (23.6%) |
| 7:00 AM to 7:29 AM | 58 (6.8%) | 58 (8.6%) |
| 7:30 AM to 7:59 AM | 38 (4.5%) | 40 (5.9%) |
| 8:00 AM to 8:29 AM | 143 (16.8%) | 70 (10.4%) |
| 8:30 AM to 8:59 AM | 19 (2.2%) | 26 (3.9%) |
| 9:00 AM to 9:59 AM | 11 (1.3%) | 12 (1.8%) |
| 10:00 AM to 10:59 AM | 0 (0.0%) | 7 (1.0%) |
| 11:00 AM to 11:59 AM | 12 (1.4%) | 0 (0.0%) |
| 12:00 PM to 3:59 PM | 129 (15.2%) | 15 (2.2%) |
| 4:00 PM to 11:59 PM | 90 (10.6%) | 15 (2.2%) |
| Total | 849 (100.0%) | 673 (100.0%) |
Housing Occupancy in Rio Bravo
Occupancy by Ownership in Rio Bravo
Of the total 1,043 dwellings in Rio Bravo, owner-occupied units account for 769 (73.7%), while renter-occupied units make up 274 (26.3%).
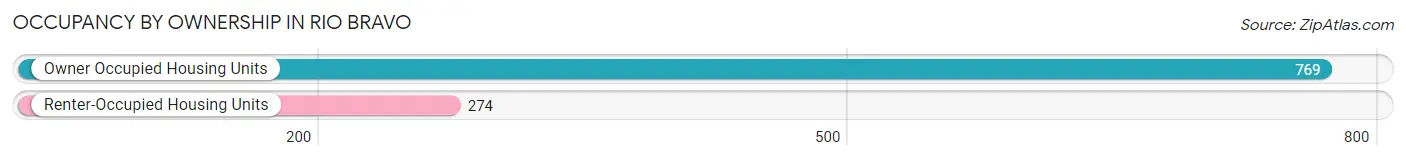
| Occupancy | # Housing Units | % Housing Units |
| Owner Occupied Housing Units | 769 | 73.7% |
| Renter-Occupied Housing Units | 274 | 26.3% |
| Total Occupied Housing Units | 1,043 | 100.0% |
Occupancy by Household Size in Rio Bravo
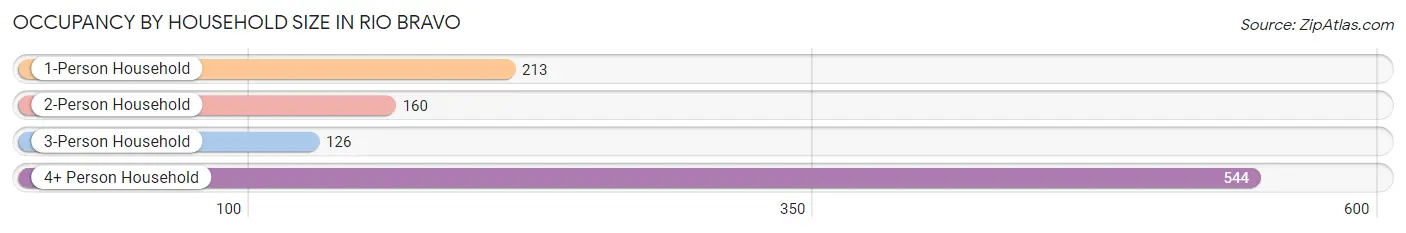
| Household Size | # Housing Units | % Housing Units |
| 1-Person Household | 213 | 20.4% |
| 2-Person Household | 160 | 15.3% |
| 3-Person Household | 126 | 12.1% |
| 4+ Person Household | 544 | 52.2% |
| Total Housing Units | 1,043 | 100.0% |
Occupancy by Ownership by Household Size in Rio Bravo
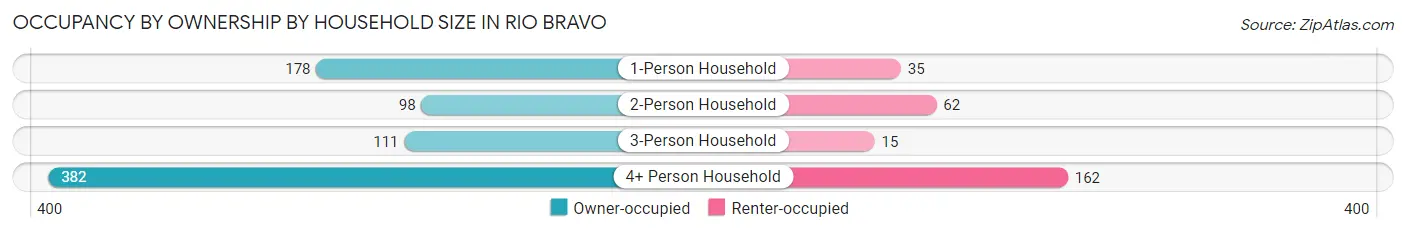
| Household Size | Owner-occupied | Renter-occupied |
| 1-Person Household | 178 (83.6%) | 35 (16.4%) |
| 2-Person Household | 98 (61.3%) | 62 (38.8%) |
| 3-Person Household | 111 (88.1%) | 15 (11.9%) |
| 4+ Person Household | 382 (70.2%) | 162 (29.8%) |
| Total Housing Units | 769 (73.7%) | 274 (26.3%) |
Occupancy by Educational Attainment in Rio Bravo
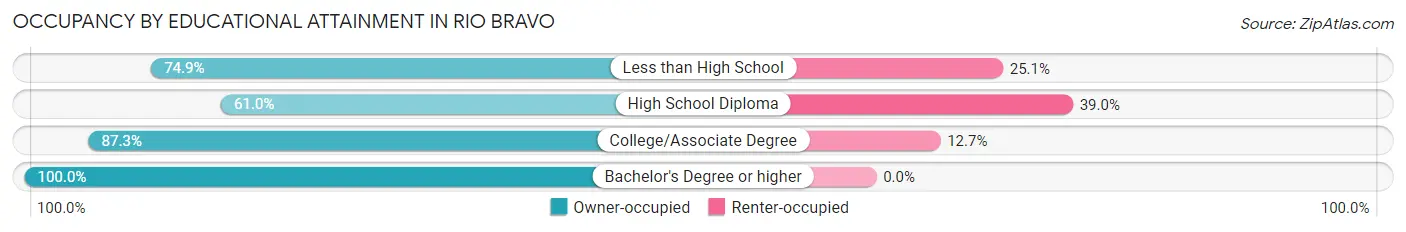
| Household Size | Owner-occupied | Renter-occupied |
| Less than High School | 522 (74.9%) | 175 (25.1%) |
| High School Diploma | 130 (61.0%) | 83 (39.0%) |
| College/Associate Degree | 110 (87.3%) | 16 (12.7%) |
| Bachelor's Degree or higher | 7 (100.0%) | 0 (0.0%) |
Occupancy by Age of Householder in Rio Bravo
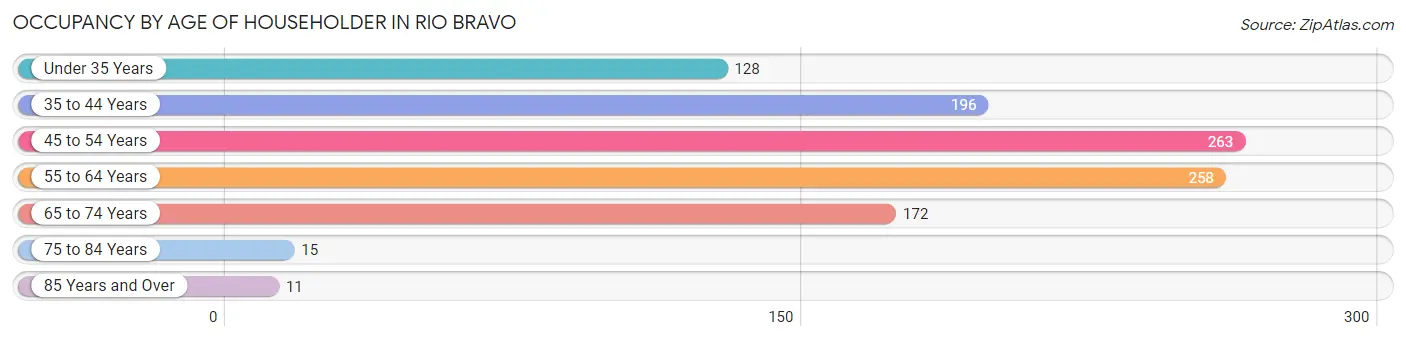
| Age Bracket | # Households | % Households |
| Under 35 Years | 128 | 12.3% |
| 35 to 44 Years | 196 | 18.8% |
| 45 to 54 Years | 263 | 25.2% |
| 55 to 64 Years | 258 | 24.7% |
| 65 to 74 Years | 172 | 16.5% |
| 75 to 84 Years | 15 | 1.4% |
| 85 Years and Over | 11 | 1.1% |
| Total | 1,043 | 100.0% |
Housing Finances in Rio Bravo
Median Income by Occupancy in Rio Bravo
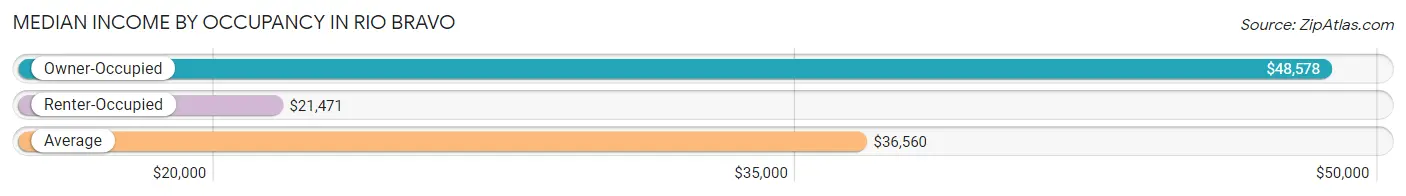
| Occupancy Type | # Households | Median Income |
| Owner-Occupied | 769 (73.7%) | $48,578 |
| Renter-Occupied | 274 (26.3%) | $21,471 |
| Average | 1,043 (100.0%) | $36,560 |
Occupancy by Householder Income Bracket in Rio Bravo
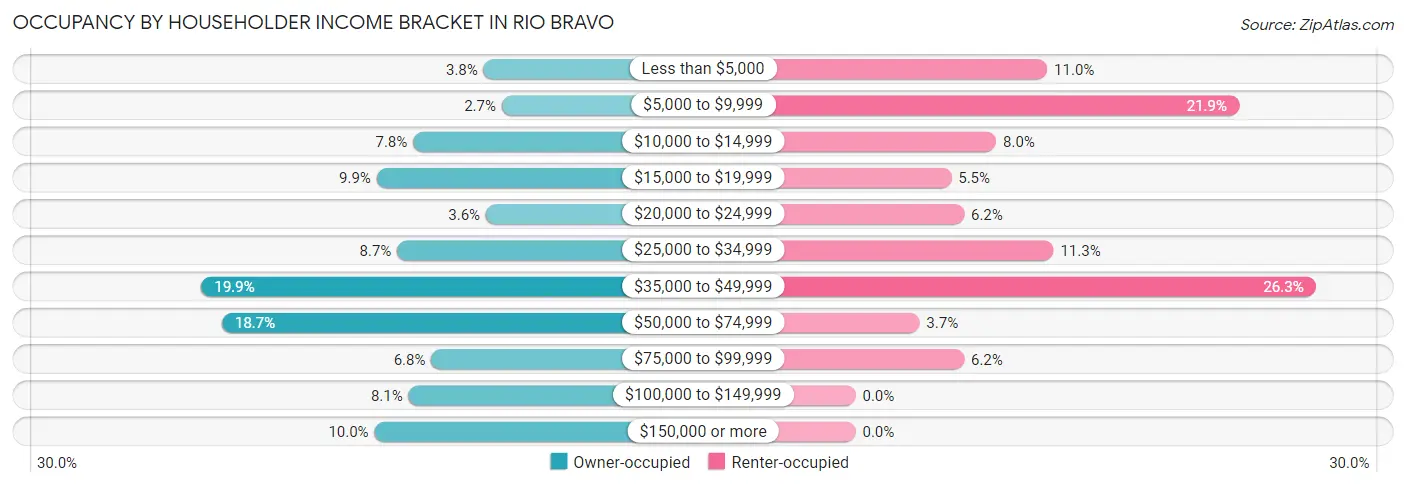
| Income Bracket | Owner-occupied | Renter-occupied |
| Less than $5,000 | 29 (3.8%) | 30 (11.0%) |
| $5,000 to $9,999 | 21 (2.7%) | 60 (21.9%) |
| $10,000 to $14,999 | 60 (7.8%) | 22 (8.0%) |
| $15,000 to $19,999 | 76 (9.9%) | 15 (5.5%) |
| $20,000 to $24,999 | 28 (3.6%) | 17 (6.2%) |
| $25,000 to $34,999 | 67 (8.7%) | 31 (11.3%) |
| $35,000 to $49,999 | 153 (19.9%) | 72 (26.3%) |
| $50,000 to $74,999 | 144 (18.7%) | 10 (3.6%) |
| $75,000 to $99,999 | 52 (6.8%) | 17 (6.2%) |
| $100,000 to $149,999 | 62 (8.1%) | 0 (0.0%) |
| $150,000 or more | 77 (10.0%) | 0 (0.0%) |
| Total | 769 (100.0%) | 274 (100.0%) |
Monthly Housing Cost Tiers in Rio Bravo
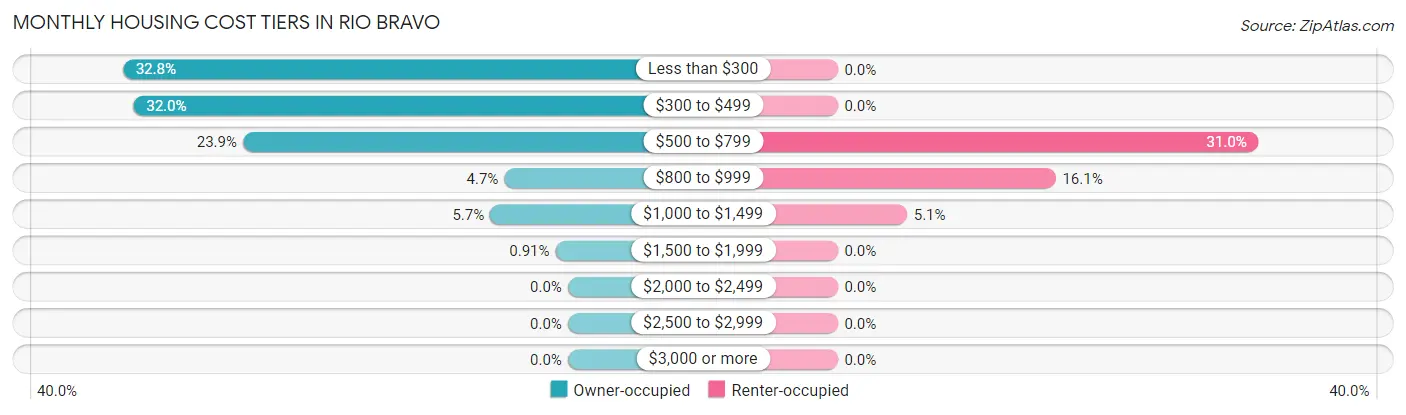
| Monthly Cost | Owner-occupied | Renter-occupied |
| Less than $300 | 252 (32.8%) | 0 (0.0%) |
| $300 to $499 | 246 (32.0%) | 0 (0.0%) |
| $500 to $799 | 184 (23.9%) | 85 (31.0%) |
| $800 to $999 | 36 (4.7%) | 44 (16.1%) |
| $1,000 to $1,499 | 44 (5.7%) | 14 (5.1%) |
| $1,500 to $1,999 | 7 (0.9%) | 0 (0.0%) |
| $2,000 to $2,499 | 0 (0.0%) | 0 (0.0%) |
| $2,500 to $2,999 | 0 (0.0%) | 0 (0.0%) |
| $3,000 or more | 0 (0.0%) | 0 (0.0%) |
| Total | 769 (100.0%) | 274 (100.0%) |
Physical Housing Characteristics in Rio Bravo
Housing Structures in Rio Bravo
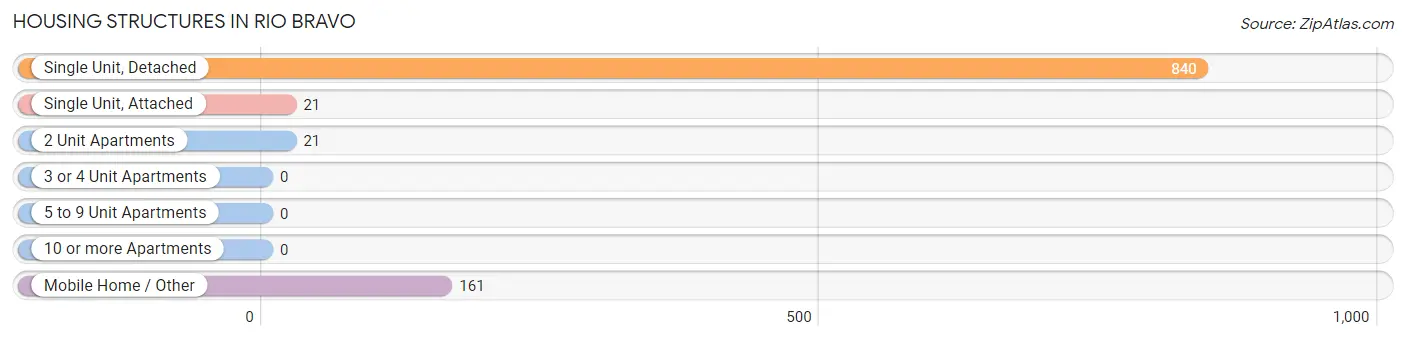
| Structure Type | # Housing Units | % Housing Units |
| Single Unit, Detached | 840 | 80.5% |
| Single Unit, Attached | 21 | 2.0% |
| 2 Unit Apartments | 21 | 2.0% |
| 3 or 4 Unit Apartments | 0 | 0.0% |
| 5 to 9 Unit Apartments | 0 | 0.0% |
| 10 or more Apartments | 0 | 0.0% |
| Mobile Home / Other | 161 | 15.4% |
| Total | 1,043 | 100.0% |
Housing Structures by Occupancy in Rio Bravo
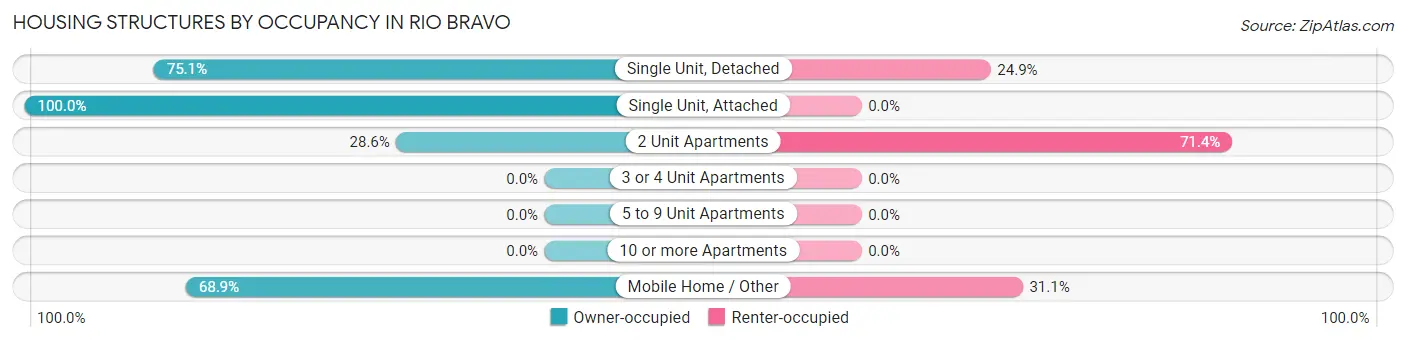
| Structure Type | Owner-occupied | Renter-occupied |
| Single Unit, Detached | 631 (75.1%) | 209 (24.9%) |
| Single Unit, Attached | 21 (100.0%) | 0 (0.0%) |
| 2 Unit Apartments | 6 (28.6%) | 15 (71.4%) |
| 3 or 4 Unit Apartments | 0 (0.0%) | 0 (0.0%) |
| 5 to 9 Unit Apartments | 0 (0.0%) | 0 (0.0%) |
| 10 or more Apartments | 0 (0.0%) | 0 (0.0%) |
| Mobile Home / Other | 111 (68.9%) | 50 (31.1%) |
| Total | 769 (73.7%) | 274 (26.3%) |
Housing Structures by Number of Rooms in Rio Bravo
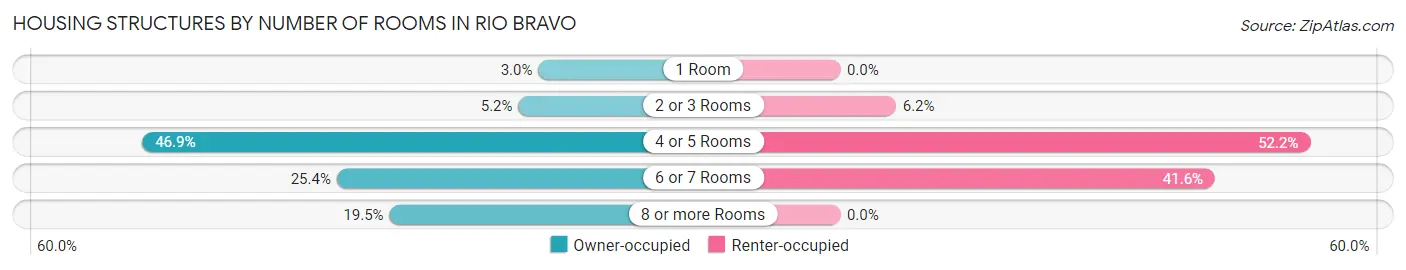
| Number of Rooms | Owner-occupied | Renter-occupied |
| 1 Room | 23 (3.0%) | 0 (0.0%) |
| 2 or 3 Rooms | 40 (5.2%) | 17 (6.2%) |
| 4 or 5 Rooms | 361 (46.9%) | 143 (52.2%) |
| 6 or 7 Rooms | 195 (25.4%) | 114 (41.6%) |
| 8 or more Rooms | 150 (19.5%) | 0 (0.0%) |
| Total | 769 (100.0%) | 274 (100.0%) |
Housing Structure by Heating Type in Rio Bravo
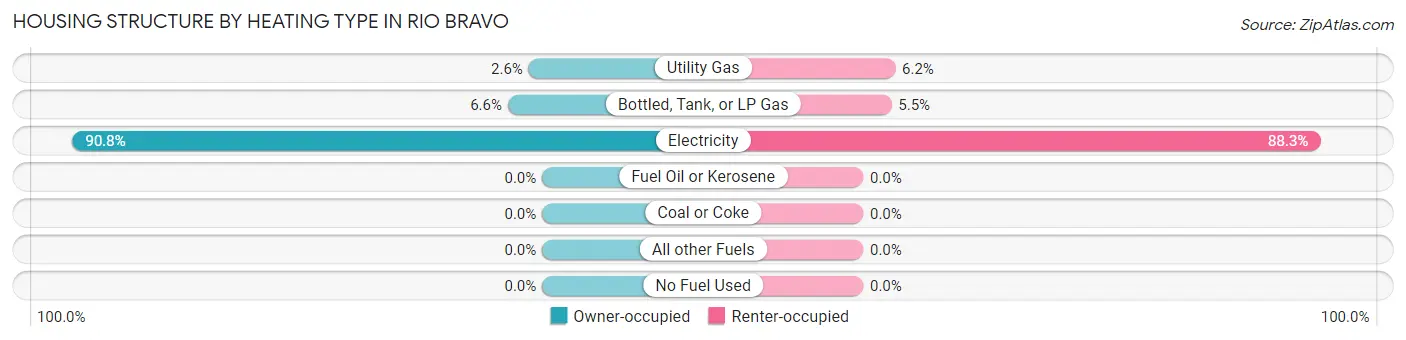
| Heating Type | Owner-occupied | Renter-occupied |
| Utility Gas | 20 (2.6%) | 17 (6.2%) |
| Bottled, Tank, or LP Gas | 51 (6.6%) | 15 (5.5%) |
| Electricity | 698 (90.8%) | 242 (88.3%) |
| Fuel Oil or Kerosene | 0 (0.0%) | 0 (0.0%) |
| Coal or Coke | 0 (0.0%) | 0 (0.0%) |
| All other Fuels | 0 (0.0%) | 0 (0.0%) |
| No Fuel Used | 0 (0.0%) | 0 (0.0%) |
| Total | 769 (100.0%) | 274 (100.0%) |
Household Vehicle Usage in Rio Bravo
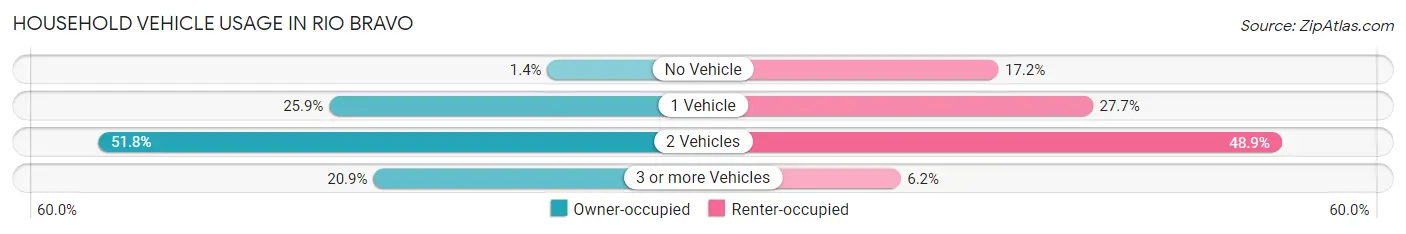
| Vehicles per Household | Owner-occupied | Renter-occupied |
| No Vehicle | 11 (1.4%) | 47 (17.2%) |
| 1 Vehicle | 199 (25.9%) | 76 (27.7%) |
| 2 Vehicles | 398 (51.8%) | 134 (48.9%) |
| 3 or more Vehicles | 161 (20.9%) | 17 (6.2%) |
| Total | 769 (100.0%) | 274 (100.0%) |
Real Estate & Mortgages in Rio Bravo
Real Estate and Mortgage Overview in Rio Bravo
| Characteristic | Without Mortgage | With Mortgage |
| Housing Units | 691 | 78 |
| Median Property Value | $68,200 | $132,400 |
| Median Household Income | $48,951 | $7 |
| Monthly Housing Costs | $417 | $0 |
| Real Estate Taxes | $1,200 | $0 |
Property Value by Mortgage Status in Rio Bravo
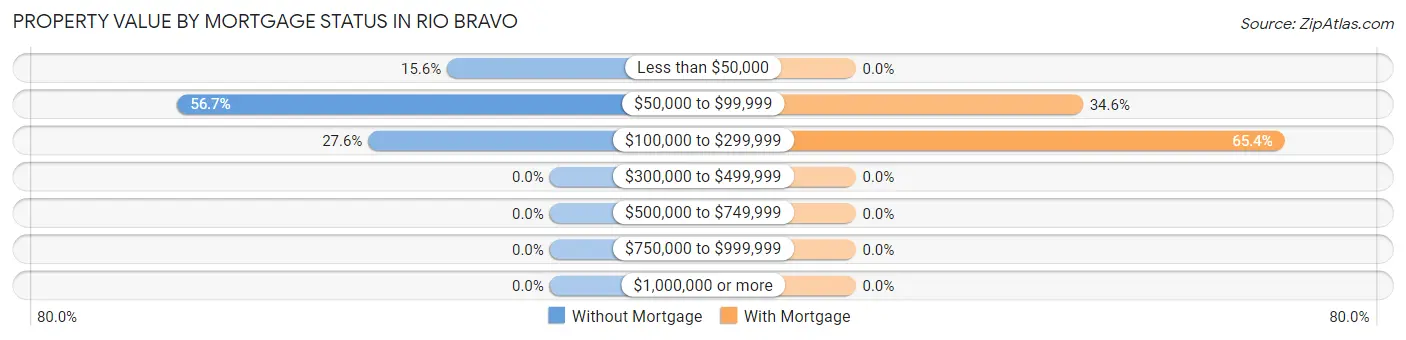
| Property Value | Without Mortgage | With Mortgage |
| Less than $50,000 | 108 (15.6%) | 0 (0.0%) |
| $50,000 to $99,999 | 392 (56.7%) | 27 (34.6%) |
| $100,000 to $299,999 | 191 (27.6%) | 51 (65.4%) |
| $300,000 to $499,999 | 0 (0.0%) | 0 (0.0%) |
| $500,000 to $749,999 | 0 (0.0%) | 0 (0.0%) |
| $750,000 to $999,999 | 0 (0.0%) | 0 (0.0%) |
| $1,000,000 or more | 0 (0.0%) | 0 (0.0%) |
| Total | 691 (100.0%) | 78 (100.0%) |
Household Income by Mortgage Status in Rio Bravo
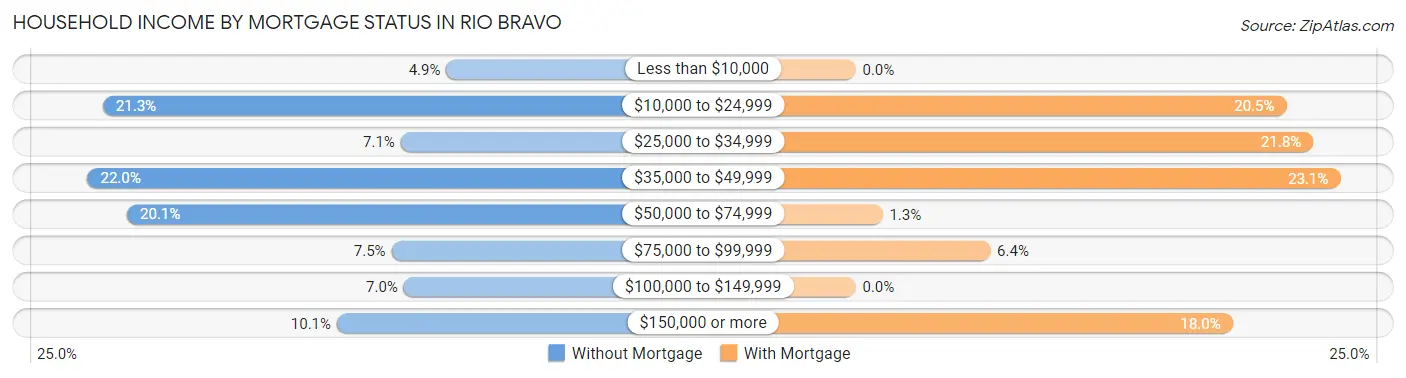
| Household Income | Without Mortgage | With Mortgage |
| Less than $10,000 | 34 (4.9%) | 0 (0.0%) |
| $10,000 to $24,999 | 147 (21.3%) | 16 (20.5%) |
| $25,000 to $34,999 | 49 (7.1%) | 17 (21.8%) |
| $35,000 to $49,999 | 152 (22.0%) | 18 (23.1%) |
| $50,000 to $74,999 | 139 (20.1%) | 1 (1.3%) |
| $75,000 to $99,999 | 52 (7.5%) | 5 (6.4%) |
| $100,000 to $149,999 | 48 (7.0%) | 0 (0.0%) |
| $150,000 or more | 70 (10.1%) | 14 (17.9%) |
| Total | 691 (100.0%) | 78 (100.0%) |
Property Value to Household Income Ratio in Rio Bravo
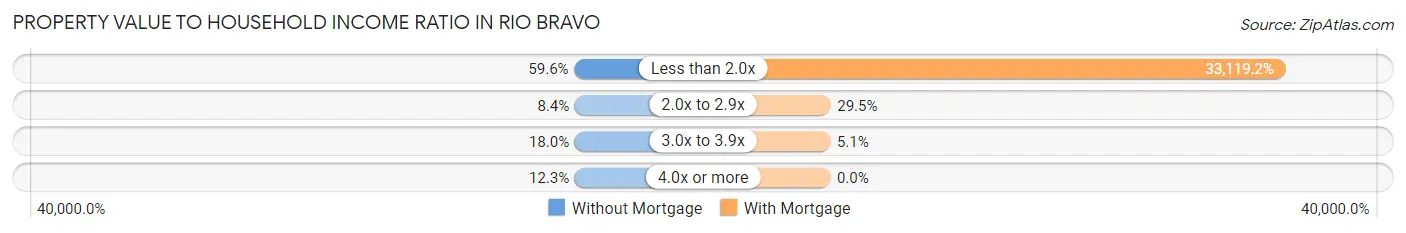
| Value-to-Income Ratio | Without Mortgage | With Mortgage |
| Less than 2.0x | 412 (59.6%) | 25,833 (33,119.2%) |
| 2.0x to 2.9x | 58 (8.4%) | 23 (29.5%) |
| 3.0x to 3.9x | 124 (17.9%) | 4 (5.1%) |
| 4.0x or more | 85 (12.3%) | 0 (0.0%) |
| Total | 691 (100.0%) | 78 (100.0%) |
Real Estate Taxes by Mortgage Status in Rio Bravo
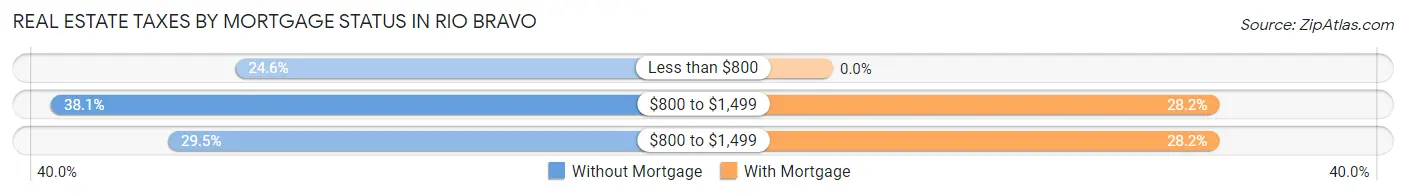
| Property Taxes | Without Mortgage | With Mortgage |
| Less than $800 | 170 (24.6%) | 0 (0.0%) |
| $800 to $1,499 | 263 (38.1%) | 22 (28.2%) |
| $800 to $1,499 | 204 (29.5%) | 22 (28.2%) |
| Total | 691 (100.0%) | 78 (100.0%) |
Health & Disability in Rio Bravo
Health Insurance Coverage by Age in Rio Bravo
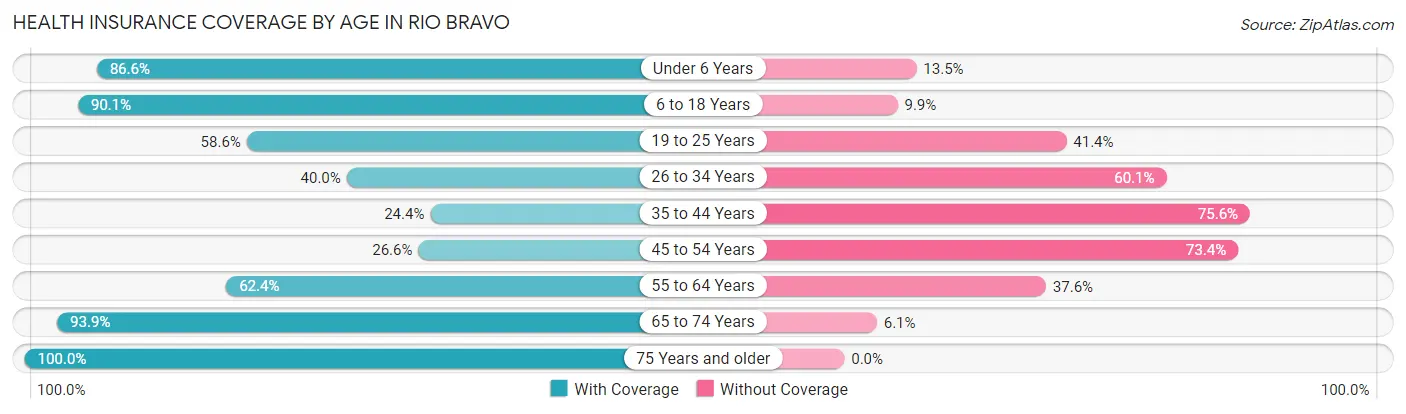
| Age Bracket | With Coverage | Without Coverage |
| Under 6 Years | 354 (86.6%) | 55 (13.5%) |
| 6 to 18 Years | 1,270 (90.1%) | 140 (9.9%) |
| 19 to 25 Years | 300 (58.6%) | 212 (41.4%) |
| 26 to 34 Years | 171 (40.0%) | 257 (60.1%) |
| 35 to 44 Years | 115 (24.4%) | 357 (75.6%) |
| 45 to 54 Years | 139 (26.6%) | 384 (73.4%) |
| 55 to 64 Years | 239 (62.4%) | 144 (37.6%) |
| 65 to 74 Years | 248 (93.9%) | 16 (6.1%) |
| 75 Years and older | 36 (100.0%) | 0 (0.0%) |
| Total | 2,872 (64.7%) | 1,565 (35.3%) |
Health Insurance Coverage by Citizenship Status in Rio Bravo
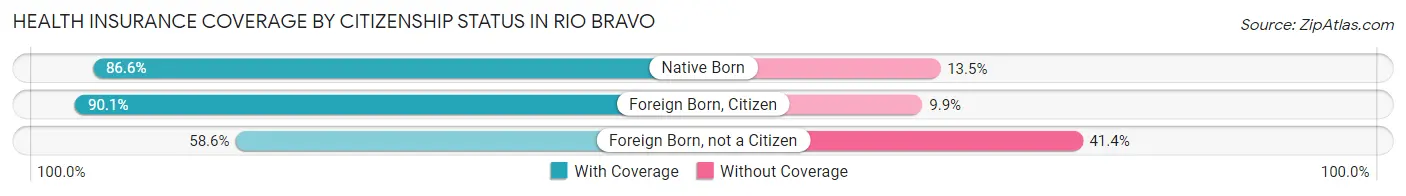
| Citizenship Status | With Coverage | Without Coverage |
| Native Born | 354 (86.6%) | 55 (13.5%) |
| Foreign Born, Citizen | 1,270 (90.1%) | 140 (9.9%) |
| Foreign Born, not a Citizen | 300 (58.6%) | 212 (41.4%) |
Health Insurance Coverage by Household Income in Rio Bravo
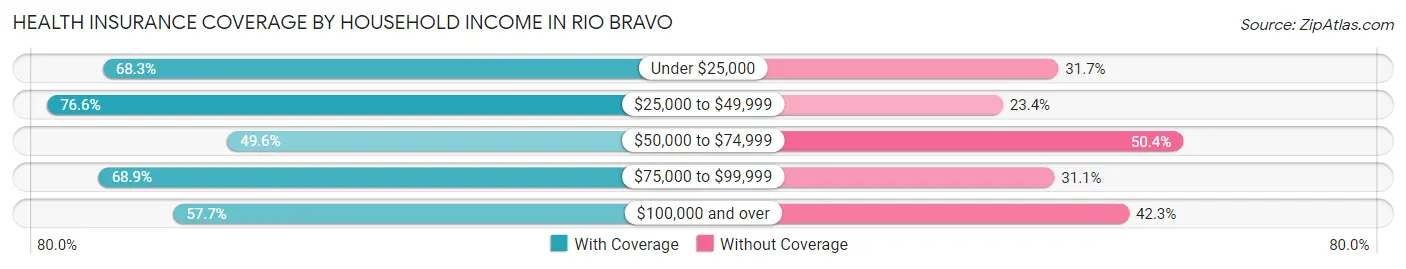
| Household Income | With Coverage | Without Coverage |
| Under $25,000 | 986 (68.3%) | 458 (31.7%) |
| $25,000 to $49,999 | 776 (76.6%) | 237 (23.4%) |
| $50,000 to $74,999 | 384 (49.6%) | 390 (50.4%) |
| $75,000 to $99,999 | 186 (68.9%) | 84 (31.1%) |
| $100,000 and over | 540 (57.7%) | 396 (42.3%) |
Public vs Private Health Insurance Coverage by Age in Rio Bravo
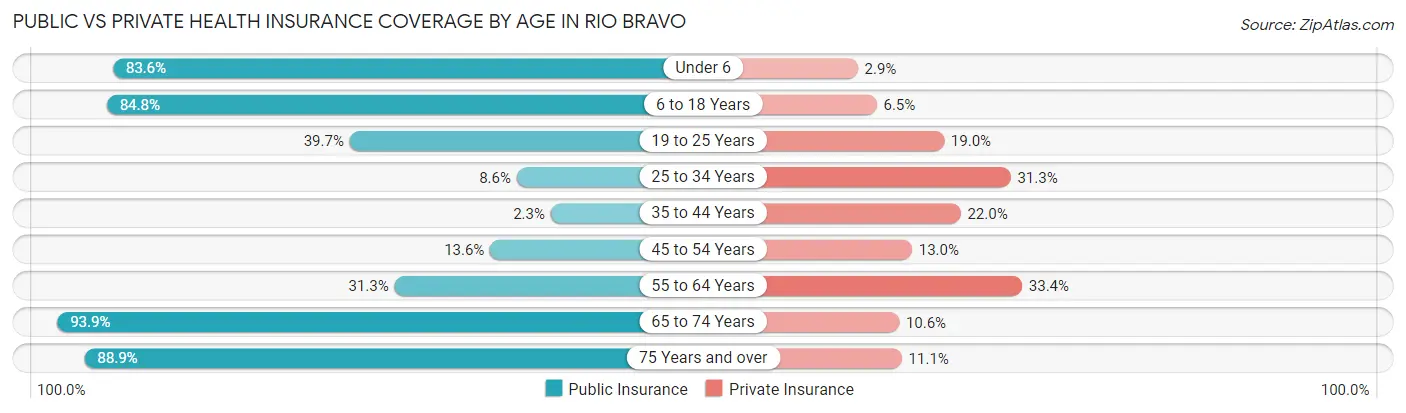
| Age Bracket | Public Insurance | Private Insurance |
| Under 6 | 342 (83.6%) | 12 (2.9%) |
| 6 to 18 Years | 1,195 (84.8%) | 91 (6.5%) |
| 19 to 25 Years | 203 (39.7%) | 97 (19.0%) |
| 25 to 34 Years | 37 (8.6%) | 134 (31.3%) |
| 35 to 44 Years | 11 (2.3%) | 104 (22.0%) |
| 45 to 54 Years | 71 (13.6%) | 68 (13.0%) |
| 55 to 64 Years | 120 (31.3%) | 128 (33.4%) |
| 65 to 74 Years | 248 (93.9%) | 28 (10.6%) |
| 75 Years and over | 32 (88.9%) | 4 (11.1%) |
| Total | 2,259 (50.9%) | 666 (15.0%) |
Disability Status by Sex by Age in Rio Bravo
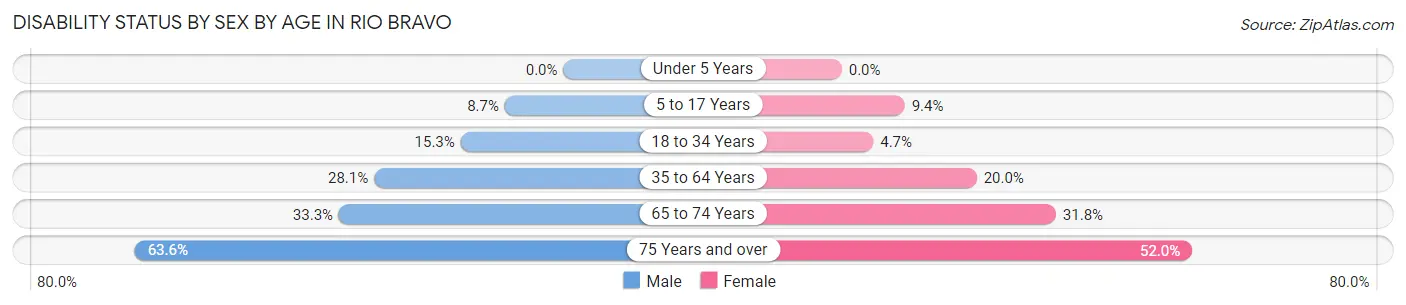
| Age Bracket | Male | Female |
| Under 5 Years | 0 (0.0%) | 0 (0.0%) |
| 5 to 17 Years | 48 (8.7%) | 75 (9.3%) |
| 18 to 34 Years | 96 (15.3%) | 20 (4.7%) |
| 35 to 64 Years | 174 (28.1%) | 152 (20.0%) |
| 65 to 74 Years | 23 (33.3%) | 62 (31.8%) |
| 75 Years and over | 7 (63.6%) | 13 (52.0%) |
Disability Class by Sex by Age in Rio Bravo
Disability Class: Hearing Difficulty
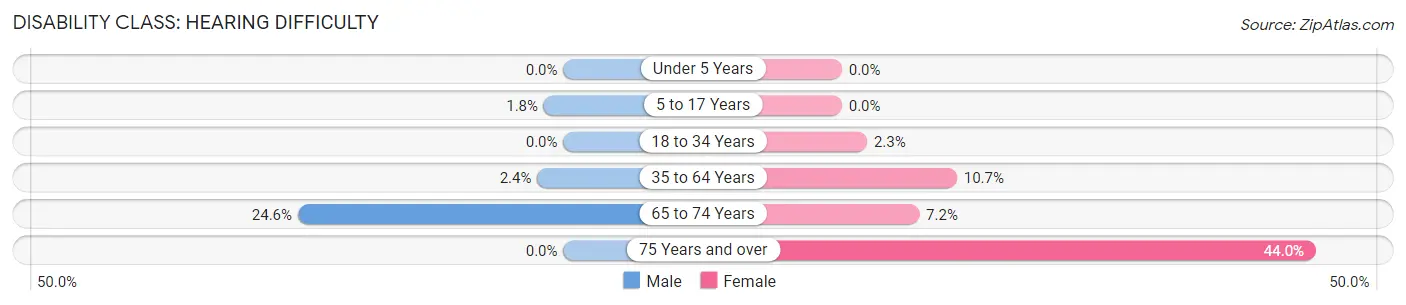
| Age Bracket | Male | Female |
| Under 5 Years | 0 (0.0%) | 0 (0.0%) |
| 5 to 17 Years | 10 (1.8%) | 0 (0.0%) |
| 18 to 34 Years | 0 (0.0%) | 10 (2.3%) |
| 35 to 64 Years | 15 (2.4%) | 81 (10.7%) |
| 65 to 74 Years | 17 (24.6%) | 14 (7.2%) |
| 75 Years and over | 0 (0.0%) | 11 (44.0%) |
Disability Class: Vision Difficulty
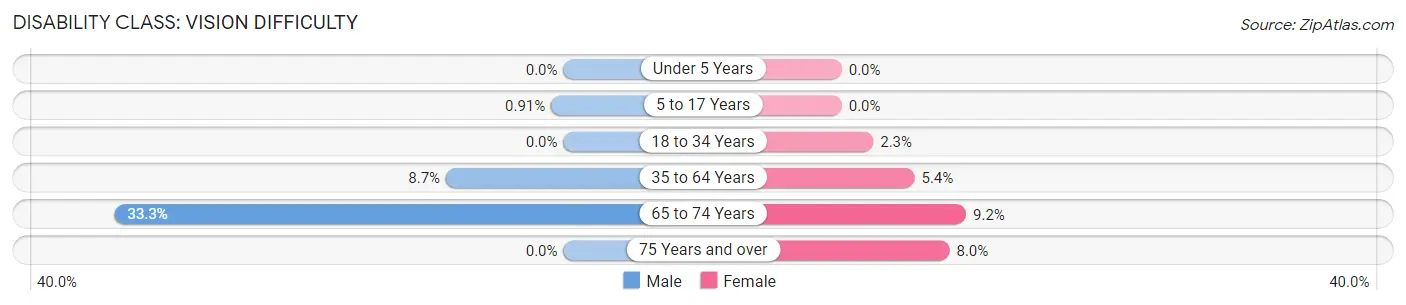
| Age Bracket | Male | Female |
| Under 5 Years | 0 (0.0%) | 0 (0.0%) |
| 5 to 17 Years | 5 (0.9%) | 0 (0.0%) |
| 18 to 34 Years | 0 (0.0%) | 10 (2.3%) |
| 35 to 64 Years | 54 (8.7%) | 41 (5.4%) |
| 65 to 74 Years | 23 (33.3%) | 18 (9.2%) |
| 75 Years and over | 0 (0.0%) | 2 (8.0%) |
Disability Class: Cognitive Difficulty
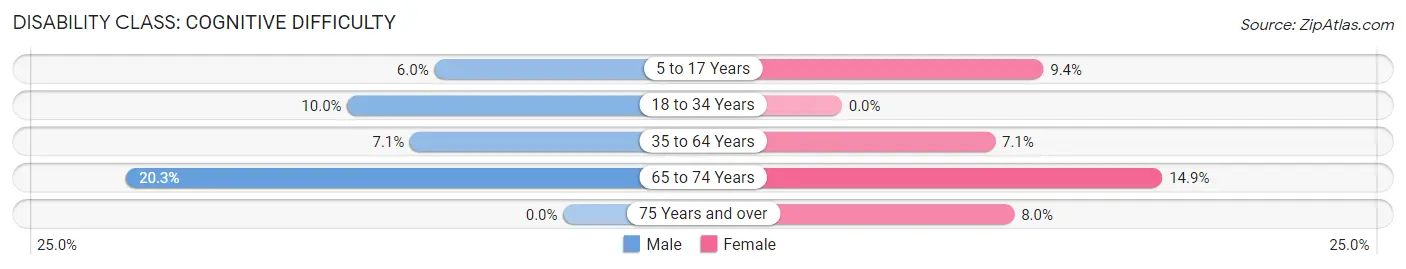
| Age Bracket | Male | Female |
| 5 to 17 Years | 33 (6.0%) | 75 (9.3%) |
| 18 to 34 Years | 63 (10.0%) | 0 (0.0%) |
| 35 to 64 Years | 44 (7.1%) | 54 (7.1%) |
| 65 to 74 Years | 14 (20.3%) | 29 (14.9%) |
| 75 Years and over | 0 (0.0%) | 2 (8.0%) |
Disability Class: Ambulatory Difficulty
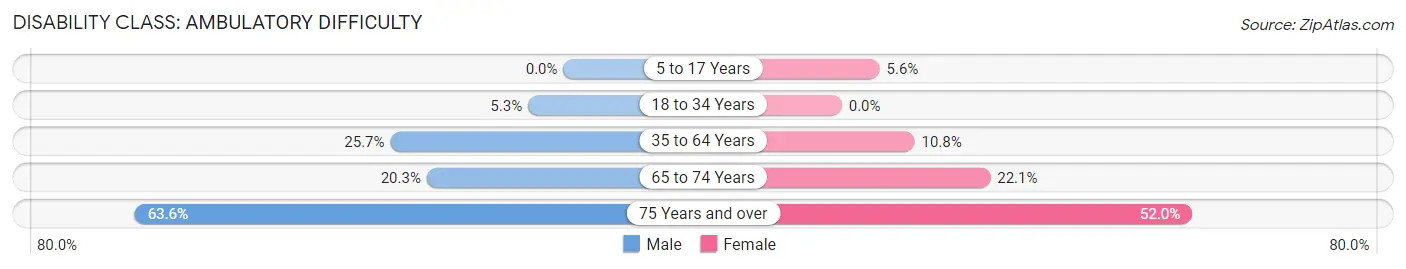
| Age Bracket | Male | Female |
| 5 to 17 Years | 0 (0.0%) | 45 (5.6%) |
| 18 to 34 Years | 33 (5.2%) | 0 (0.0%) |
| 35 to 64 Years | 159 (25.7%) | 82 (10.8%) |
| 65 to 74 Years | 14 (20.3%) | 43 (22.1%) |
| 75 Years and over | 7 (63.6%) | 13 (52.0%) |
Disability Class: Self-Care Difficulty
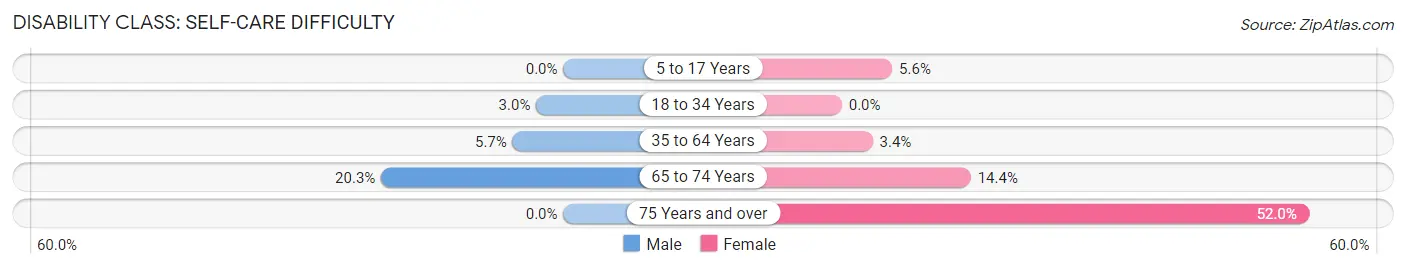
| Age Bracket | Male | Female |
| 5 to 17 Years | 0 (0.0%) | 45 (5.6%) |
| 18 to 34 Years | 19 (3.0%) | 0 (0.0%) |
| 35 to 64 Years | 35 (5.7%) | 26 (3.4%) |
| 65 to 74 Years | 14 (20.3%) | 28 (14.4%) |
| 75 Years and over | 0 (0.0%) | 13 (52.0%) |
Technology Access in Rio Bravo
Computing Device Access in Rio Bravo
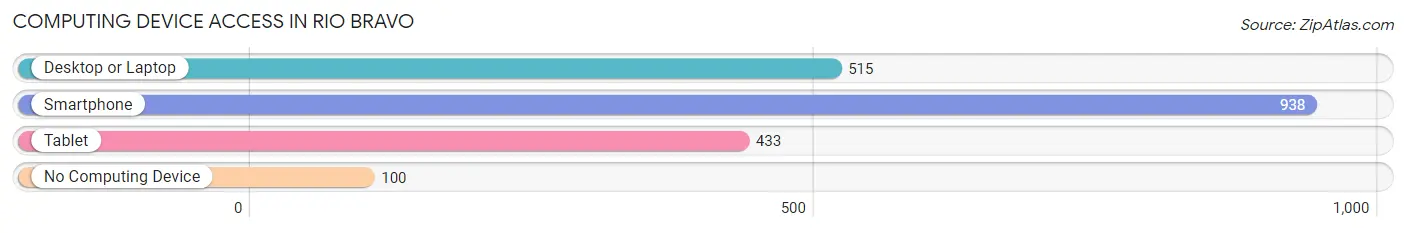
| Device Type | # Households | % Households |
| Desktop or Laptop | 515 | 49.4% |
| Smartphone | 938 | 89.9% |
| Tablet | 433 | 41.5% |
| No Computing Device | 100 | 9.6% |
| Total | 1,043 | 100.0% |
Internet Access in Rio Bravo
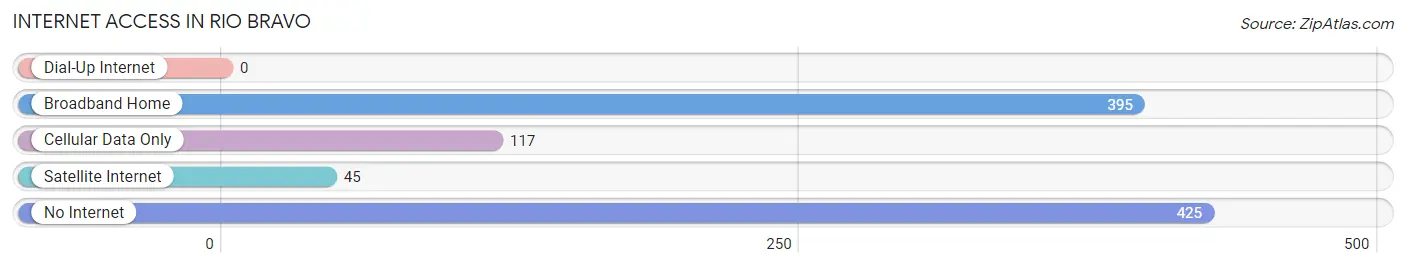
| Internet Type | # Households | % Households |
| Dial-Up Internet | 0 | 0.0% |
| Broadband Home | 395 | 37.9% |
| Cellular Data Only | 117 | 11.2% |
| Satellite Internet | 45 | 4.3% |
| No Internet | 425 | 40.7% |
| Total | 1,043 | 100.0% |
Rio Bravo Summary
Rio Bravo is a small town located in the state of Texas, United States. It is situated in the Rio Grande Valley, in the southernmost part of the state. The town is located in Cameron County, and is part of the Brownsville–Harlingen–Raymondville metropolitan area. The population of Rio Bravo was estimated to be 1,845 in 2019.
History
Rio Bravo was founded in the late 19th century by Mexican immigrants who were looking for a place to settle and start a new life. The town was originally called “Rio Bravo del Norte”, which translates to “Big River of the North”. The name was changed to Rio Bravo in the early 20th century.
The town was initially a small farming community, but it began to grow in the early 20th century when the railroad was built through the area. This allowed for the transportation of goods and people, and the town began to thrive.
In the mid-20th century, Rio Bravo experienced a period of rapid growth due to the influx of Mexican immigrants. This growth was further fueled by the construction of the Falcon Dam in the 1950s, which provided irrigation for the area.
Geography
Rio Bravo is located in the Rio Grande Valley, in the southernmost part of Texas. The town is situated in Cameron County, and is part of the Brownsville–Harlingen–Raymondville metropolitan area.
The town is located on the banks of the Rio Grande River, which forms the border between the United States and Mexico. The town is surrounded by agricultural land, and is located near the Laguna Atascosa National Wildlife Refuge.
The climate in Rio Bravo is subtropical, with hot summers and mild winters. The average temperature in the summer is around 90°F (32°C), and the average temperature in the winter is around 70°F (21°C).
Economy
Rio Bravo’s economy is largely based on agriculture. The town is surrounded by agricultural land, and the main crops grown in the area are cotton, corn, sorghum, and wheat.
The town is also home to several manufacturing companies, including a furniture factory and a plastics factory. The town is also home to a number of small businesses, including restaurants, grocery stores, and retail stores.
Demographics
As of 2019, the population of Rio Bravo was estimated to be 1,845. The town has a diverse population, with the majority of residents being of Hispanic or Latino descent. The town also has a small population of African Americans, Native Americans, and Asians.
The median household income in Rio Bravo is $30,000, and the median home value is $90,000. The town has a poverty rate of 28.3%, which is higher than the national average.
Conclusion
Rio Bravo is a small town located in the Rio Grande Valley of Texas. The town was founded in the late 19th century by Mexican immigrants, and has since grown into a thriving agricultural community. The town has a diverse population, and its economy is largely based on agriculture and manufacturing. The median household income in Rio Bravo is $30,000, and the median home value is $90,000.
Common Questions
What is Per Capita Income in Rio Bravo?
Per Capita income in Rio Bravo is $12,467.
What is the Median Family Income in Rio Bravo?
Median Family Income in Rio Bravo is $36,847.
What is the Median Household income in Rio Bravo?
Median Household Income in Rio Bravo is $36,560.
What is Income or Wage Gap in Rio Bravo?
Income or Wage Gap in Rio Bravo is 45.9%.
Women in Rio Bravo earn 54.1 cents for every dollar earned by a man.
What is Family Income Deficit in Rio Bravo?
Family Income Deficit in Rio Bravo is $20,764.
Families that are below poverty line in Rio Bravo earn $20,764 less on average than the poverty threshold level.
What is Inequality or Gini Index in Rio Bravo?
Inequality or Gini Index in Rio Bravo is 0.48.
What is the Total Population of Rio Bravo?
Total Population of Rio Bravo is 4,437.
What is the Total Male Population of Rio Bravo?
Total Male Population of Rio Bravo is 2,066.
What is the Total Female Population of Rio Bravo?
Total Female Population of Rio Bravo is 2,371.
What is the Ratio of Males per 100 Females in Rio Bravo?
There are 87.14 Males per 100 Females in Rio Bravo.
What is the Ratio of Females per 100 Males in Rio Bravo?
There are 114.76 Females per 100 Males in Rio Bravo.
What is the Median Population Age in Rio Bravo?
Median Population Age in Rio Bravo is 23.3 Years.
What is the Average Family Size in Rio Bravo
Average Family Size in Rio Bravo is 5.2 People.
What is the Average Household Size in Rio Bravo
Average Household Size in Rio Bravo is 4.2 People.
How Large is the Labor Force in Rio Bravo?
There are 1,603 People in the Labor Forcein in Rio Bravo.
What is the Percentage of People in the Labor Force in Rio Bravo?
53.9% of People are in the Labor Force in Rio Bravo.
What is the Unemployment Rate in Rio Bravo?
Unemployment Rate in Rio Bravo is 3.3%.