Zip Codes with the Highest Percentage of Population Taking Taxi / Cab to Work in Portage, MI
RELATED REPORTS & OPTIONS
Taxi / Cab
Portage
Compare Zip Codes
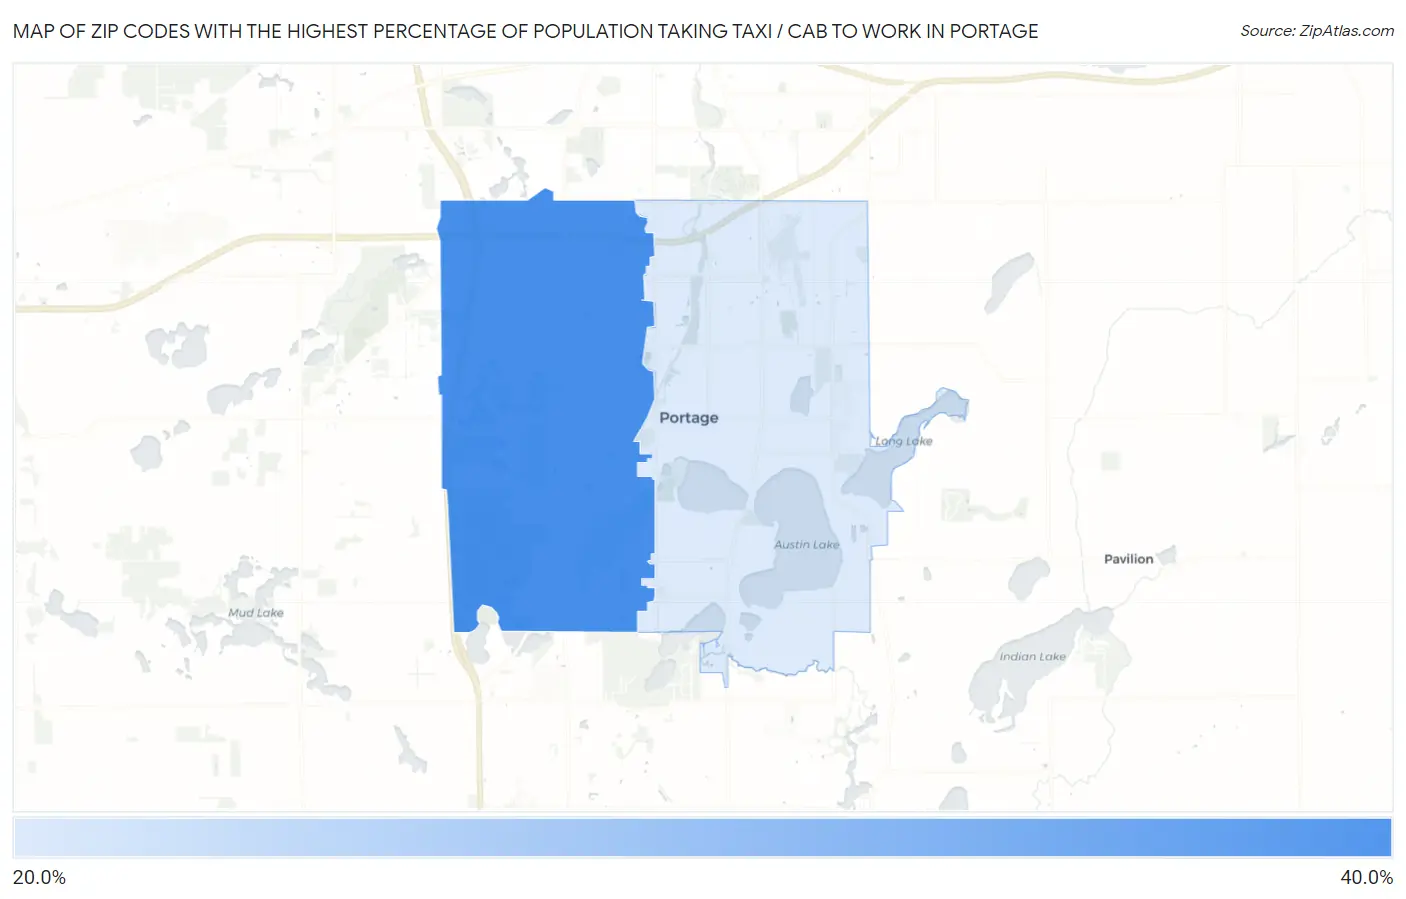
Map of Zip Codes with the Highest Percentage of Population Taking Taxi / Cab to Work in Portage
25.1%
35.2%
Zip Codes with the Highest Percentage of Population Taking Taxi / Cab to Work in Portage, MI
| Zip Code | % Take Taxi / Cab | vs State | vs National | |
| 1. | 49024 | 35.2% | 36.2%(-1.00)#336 | 38.2%(-3.00)#8,810 |
| 2. | 49002 | 25.1% | 36.2%(-11.1)#480 | 38.2%(-13.1)#12,212 |
1
Common Questions
What are the Top Zip Codes with the Highest Percentage of Population Taking Taxi / Cab to Work in Portage, MI?
Top Zip Codes with the Highest Percentage of Population Taking Taxi / Cab to Work in Portage, MI are:
What zip code has the Highest Percentage of Population Taking Taxi / Cab to Work in Portage, MI?
49024 has the Highest Percentage of Population Taking Taxi / Cab to Work in Portage, MI with 35.2%.
What is the Percentage of Population Taking Taxi / Cab to Work in Portage, MI?
Percentage of Population Taking Taxi / Cab to Work in Portage is 25.9%.
What is the Percentage of Population Taking Taxi / Cab to Work in Michigan?
Percentage of Population Taking Taxi / Cab to Work in Michigan is 36.2%.
What is the Percentage of Population Taking Taxi / Cab to Work in the United States?
Percentage of Population Taking Taxi / Cab to Work in the United States is 38.2%.