Gilbertsville, KY Map & Demographics
Gilbertsville Map
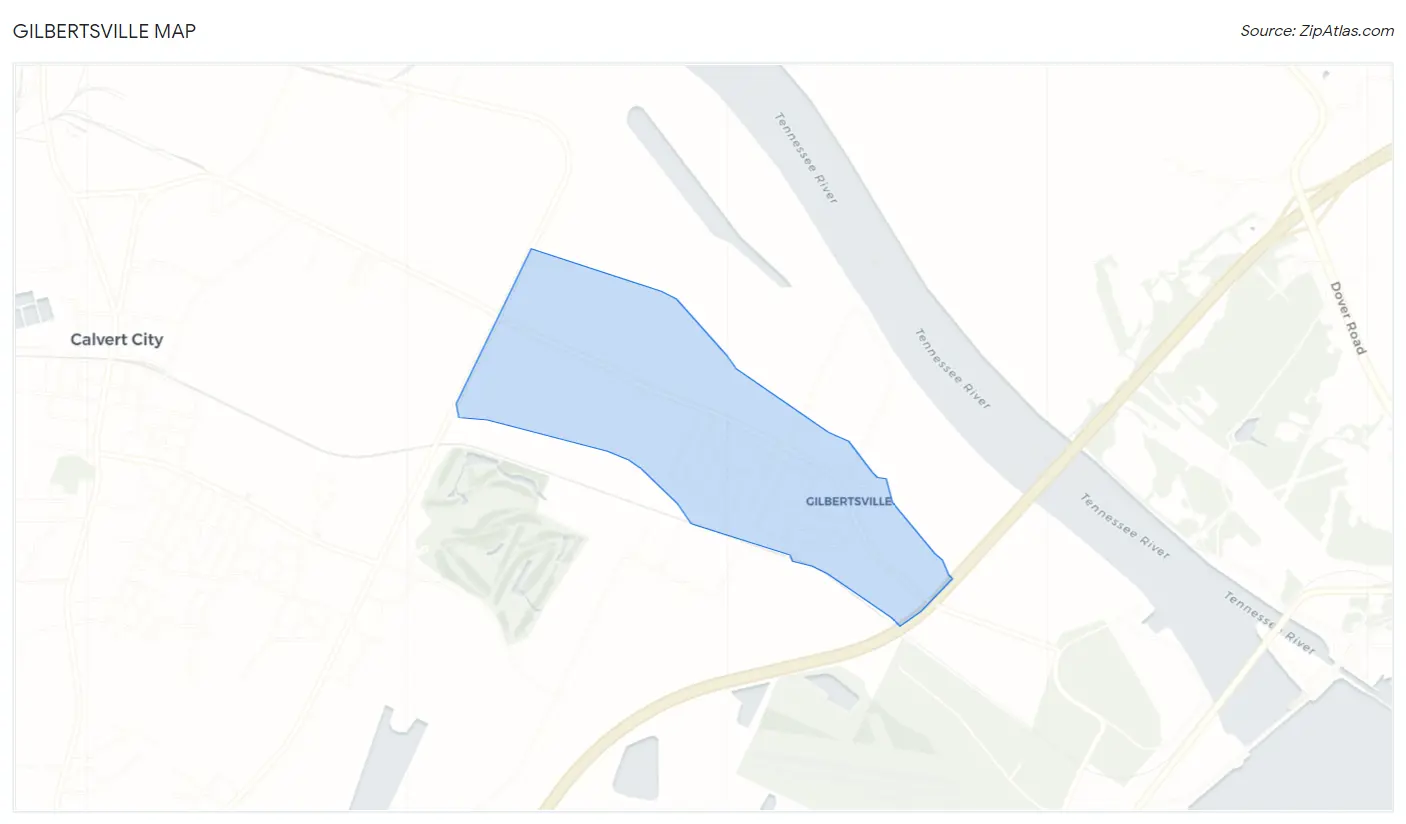
Gilbertsville Overview
$9,221
PER CAPITA INCOME
0.72
INEQUALITY / GINI INDEX
245
TOTAL POPULATION
196
MALE POPULATION
49
FEMALE POPULATION
400.00
MALES / 100 FEMALES
25.00
FEMALES / 100 MALES
51.0
MEDIAN AGE
3.0
AVG FAMILY SIZE
1.5
AVG HOUSEHOLD SIZE
127
LABOR FORCE [ PEOPLE ]
53.1%
PERCENT IN LABOR FORCE
Gilbertsville Zip Codes
Gilbertsville Area Codes
Income in Gilbertsville
Income Overview in Gilbertsville
| Characteristic | Number | Measure |
| Per Capita Income | 245 | $9,221 |
| Median Family Income | 6 | $0 |
| Mean Family Income | 6 | $0 |
| Median Household Income | 166 | $0 |
| Mean Household Income | 166 | $12,987 |
| Income Deficit | 6 | $0 |
| Wage / Income Gap (%) | 245 | 0.00% |
| Wage / Income Gap ($) | 245 | 100.00¢ per $1 |
| Gini / Inequality Index | 245 | 0.72 |
Earnings by Sex in Gilbertsville
| Sex | Number | Average Earnings |
| Male | 84 (66.1%) | $0 |
| Female | 43 (33.9%) | $0 |
| Total | 127 (100.0%) | $0 |
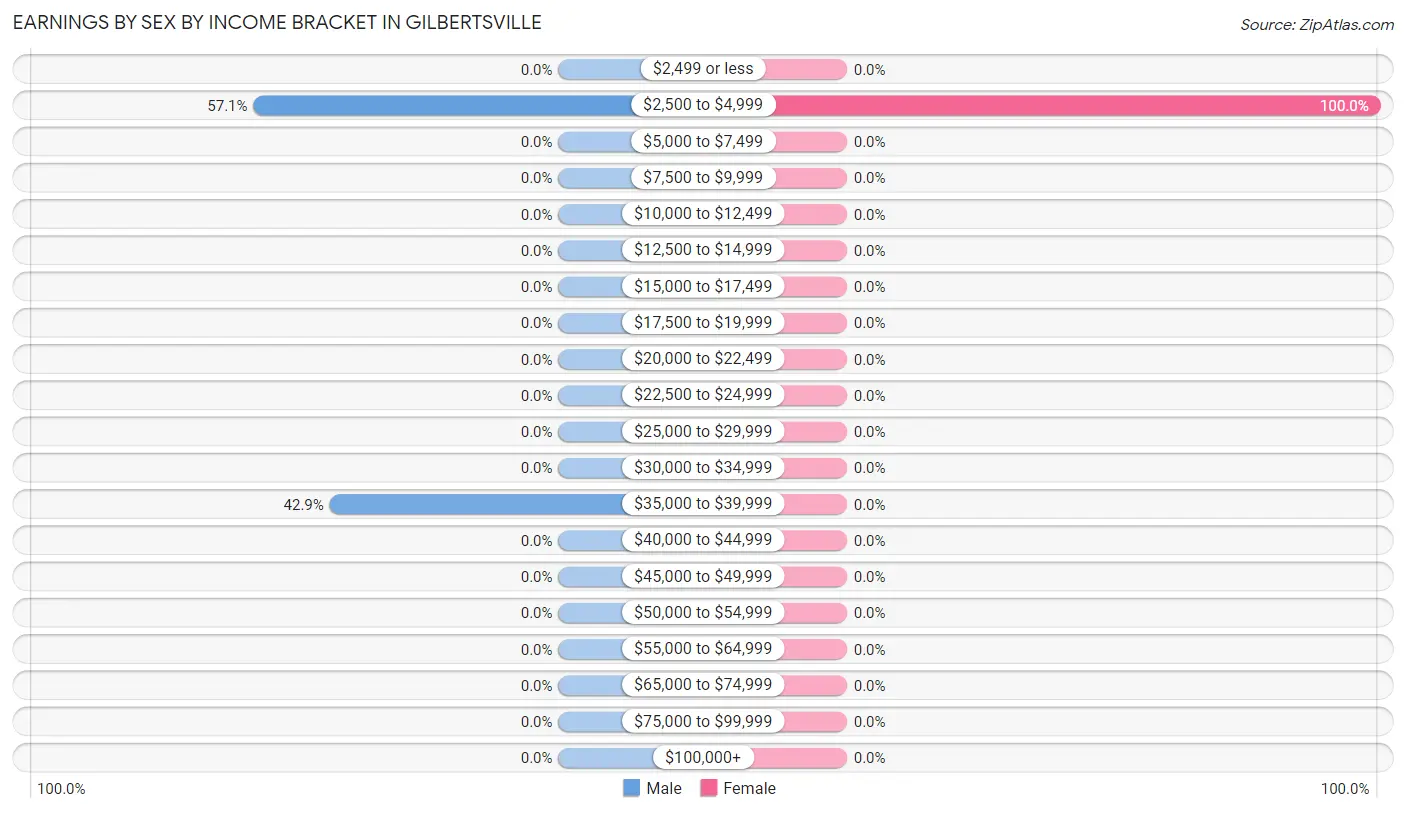
Earnings by Sex by Income Bracket in Gilbertsville
The most common earnings brackets in Gilbertsville are $2,500 to $4,999 for men (48 | 57.1%) and $2,500 to $4,999 for women (43 | 100.0%).
| Income | Male | Female |
| $2,499 or less | 0 (0.0%) | 0 (0.0%) |
| $2,500 to $4,999 | 48 (57.1%) | 43 (100.0%) |
| $5,000 to $7,499 | 0 (0.0%) | 0 (0.0%) |
| $7,500 to $9,999 | 0 (0.0%) | 0 (0.0%) |
| $10,000 to $12,499 | 0 (0.0%) | 0 (0.0%) |
| $12,500 to $14,999 | 0 (0.0%) | 0 (0.0%) |
| $15,000 to $17,499 | 0 (0.0%) | 0 (0.0%) |
| $17,500 to $19,999 | 0 (0.0%) | 0 (0.0%) |
| $20,000 to $22,499 | 0 (0.0%) | 0 (0.0%) |
| $22,500 to $24,999 | 0 (0.0%) | 0 (0.0%) |
| $25,000 to $29,999 | 0 (0.0%) | 0 (0.0%) |
| $30,000 to $34,999 | 0 (0.0%) | 0 (0.0%) |
| $35,000 to $39,999 | 36 (42.9%) | 0 (0.0%) |
| $40,000 to $44,999 | 0 (0.0%) | 0 (0.0%) |
| $45,000 to $49,999 | 0 (0.0%) | 0 (0.0%) |
| $50,000 to $54,999 | 0 (0.0%) | 0 (0.0%) |
| $55,000 to $64,999 | 0 (0.0%) | 0 (0.0%) |
| $65,000 to $74,999 | 0 (0.0%) | 0 (0.0%) |
| $75,000 to $99,999 | 0 (0.0%) | 0 (0.0%) |
| $100,000+ | 0 (0.0%) | 0 (0.0%) |
| Total | 84 (100.0%) | 43 (100.0%) |
Earnings by Sex by Educational Attainment in Gilbertsville
| Educational Attainment | Male Income | Female Income |
| Less than High School | - | - |
| High School Diploma | - | - |
| College or Associate's Degree | - | - |
| Bachelor's Degree | - | - |
| Graduate Degree | - | - |
| Total | - | - |
Family Income in Gilbertsville
Family Income Brackets in Gilbertsville
According to the Gilbertsville family income data, there are 6 families falling into the $10,000 to $14,999 income range, which is the most common income bracket and makes up 100.0% of all families.
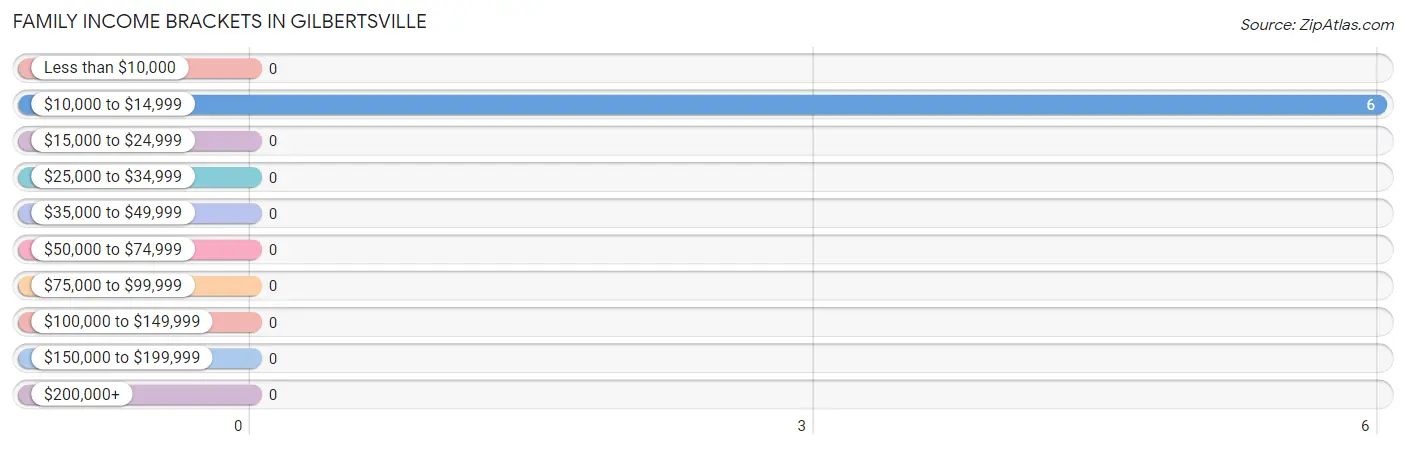
| Income Bracket | # Families | % Families |
| Less than $10,000 | 0 | 0.0% |
| $10,000 to $14,999 | 6 | 100.0% |
| $15,000 to $24,999 | 0 | 0.0% |
| $25,000 to $34,999 | 0 | 0.0% |
| $35,000 to $49,999 | 0 | 0.0% |
| $50,000 to $74,999 | 0 | 0.0% |
| $75,000 to $99,999 | 0 | 0.0% |
| $100,000 to $149,999 | 0 | 0.0% |
| $150,000 to $199,999 | 0 | 0.0% |
| $200,000+ | 0 | 0.0% |
Family Income by Famaliy Size in Gilbertsville
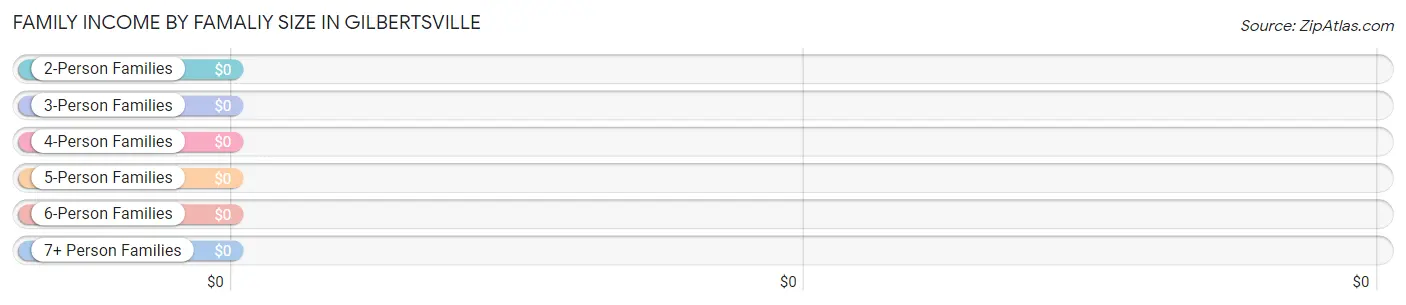
| Income Bracket | # Families | Median Income |
| 2-Person Families | 0 (0.0%) | $0 |
| 3-Person Families | 6 (100.0%) | $0 |
| 4-Person Families | 0 (0.0%) | $0 |
| 5-Person Families | 0 (0.0%) | $0 |
| 6-Person Families | 0 (0.0%) | $0 |
| 7+ Person Families | 0 (0.0%) | $0 |
| Total | 6 (100.0%) | $0 |
Family Income by Number of Earners in Gilbertsville
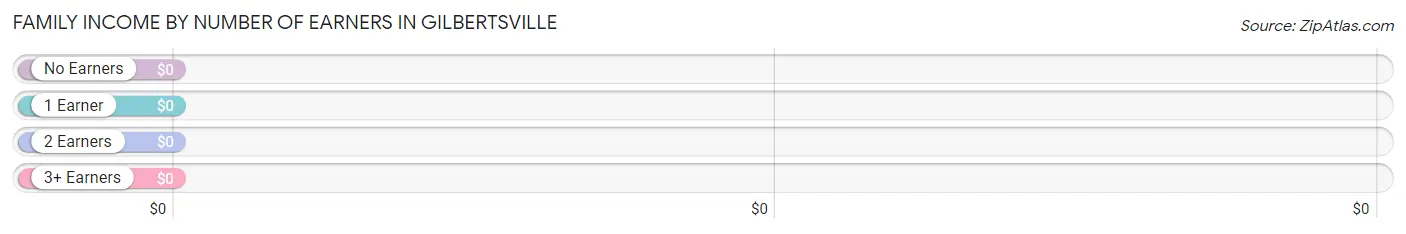
| Number of Earners | # Families | Median Income |
| No Earners | 6 (100.0%) | $0 |
| 1 Earner | 0 (0.0%) | $0 |
| 2 Earners | 0 (0.0%) | $0 |
| 3+ Earners | 0 (0.0%) | $0 |
| Total | 6 (100.0%) | $0 |
Household Income in Gilbertsville
Household Income Brackets in Gilbertsville
With 124 households falling in the category, the less than $10,000 income range is the most frequent in Gilbertsville, accounting for 74.7% of all households.
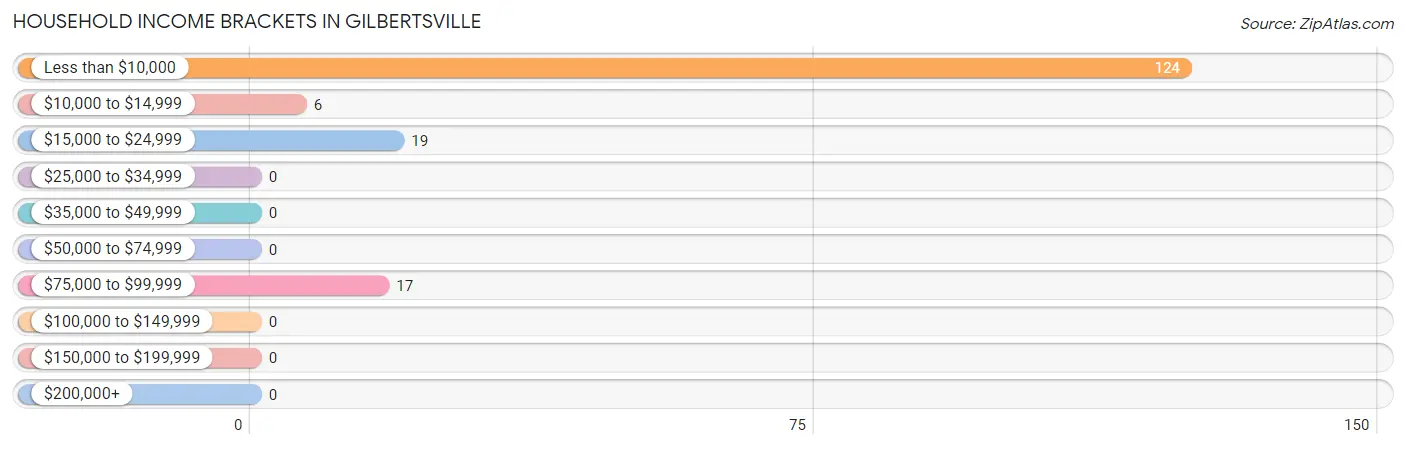
| Income Bracket | # Households | % Households |
| Less than $10,000 | 124 | 74.7% |
| $10,000 to $14,999 | 6 | 3.6% |
| $15,000 to $24,999 | 19 | 11.4% |
| $25,000 to $34,999 | 0 | 0.0% |
| $35,000 to $49,999 | 0 | 0.0% |
| $50,000 to $74,999 | 0 | 0.0% |
| $75,000 to $99,999 | 17 | 10.2% |
| $100,000 to $149,999 | 0 | 0.0% |
| $150,000 to $199,999 | 0 | 0.0% |
| $200,000+ | 0 | 0.0% |
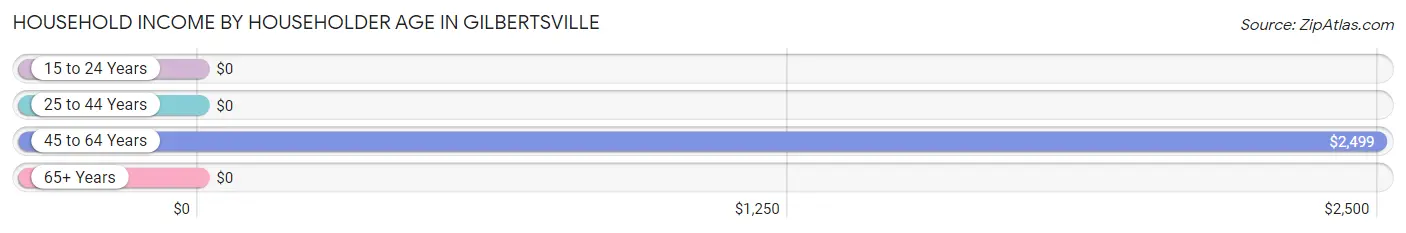
Household Income by Householder Age in Gilbertsville
The median household income in Gilbertsville is $0, with the highest median household income of $2,499 found in the 45 to 64 years age bracket for the primary householder. A total of 147 households (88.5%) fall into this category.
| Income Bracket | # Households | Median Income |
| 15 to 24 Years | 0 (0.0%) | $0 |
| 25 to 44 Years | 0 (0.0%) | $0 |
| 45 to 64 Years | 147 (88.5%) | $2,499 |
| 65+ Years | 19 (11.5%) | $0 |
| Total | 166 (100.0%) | $0 |
Poverty in Gilbertsville
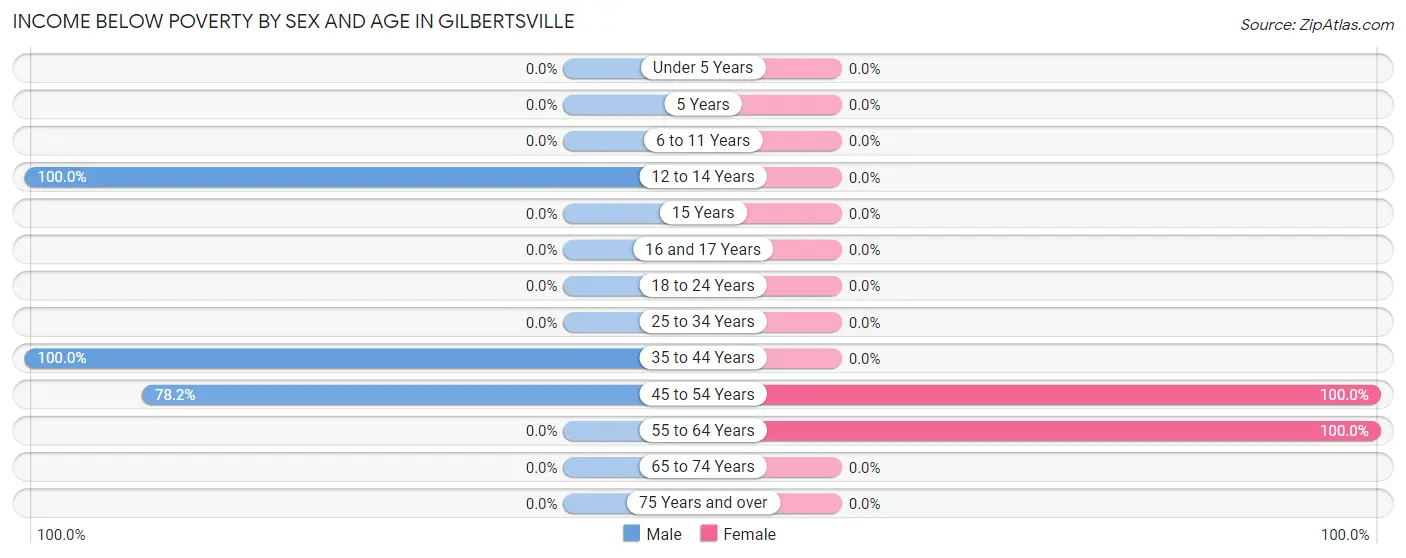
Income Below Poverty by Sex and Age in Gilbertsville
With 71.9% poverty level for males and 100.0% for females among the residents of Gilbertsville, 12 to 14 year old males and 45 to 54 year old females are the most vulnerable to poverty, with 6 males (100.0%) and 43 females (100.0%) in their respective age groups living below the poverty level.
| Age Bracket | Male | Female |
| Under 5 Years | 0 (0.0%) | 0 (0.0%) |
| 5 Years | 0 (0.0%) | 0 (0.0%) |
| 6 to 11 Years | 0 (0.0%) | 0 (0.0%) |
| 12 to 14 Years | 6 (100.0%) | 0 (0.0%) |
| 15 Years | 0 (0.0%) | 0 (0.0%) |
| 16 and 17 Years | 0 (0.0%) | 0 (0.0%) |
| 18 to 24 Years | 0 (0.0%) | 0 (0.0%) |
| 25 to 34 Years | 0 (0.0%) | 0 (0.0%) |
| 35 to 44 Years | 6 (100.0%) | 0 (0.0%) |
| 45 to 54 Years | 129 (78.2%) | 43 (100.0%) |
| 55 to 64 Years | 0 (0.0%) | 6 (100.0%) |
| 65 to 74 Years | 0 (0.0%) | 0 (0.0%) |
| 75 Years and over | 0 (0.0%) | 0 (0.0%) |
| Total | 141 (71.9%) | 49 (100.0%) |
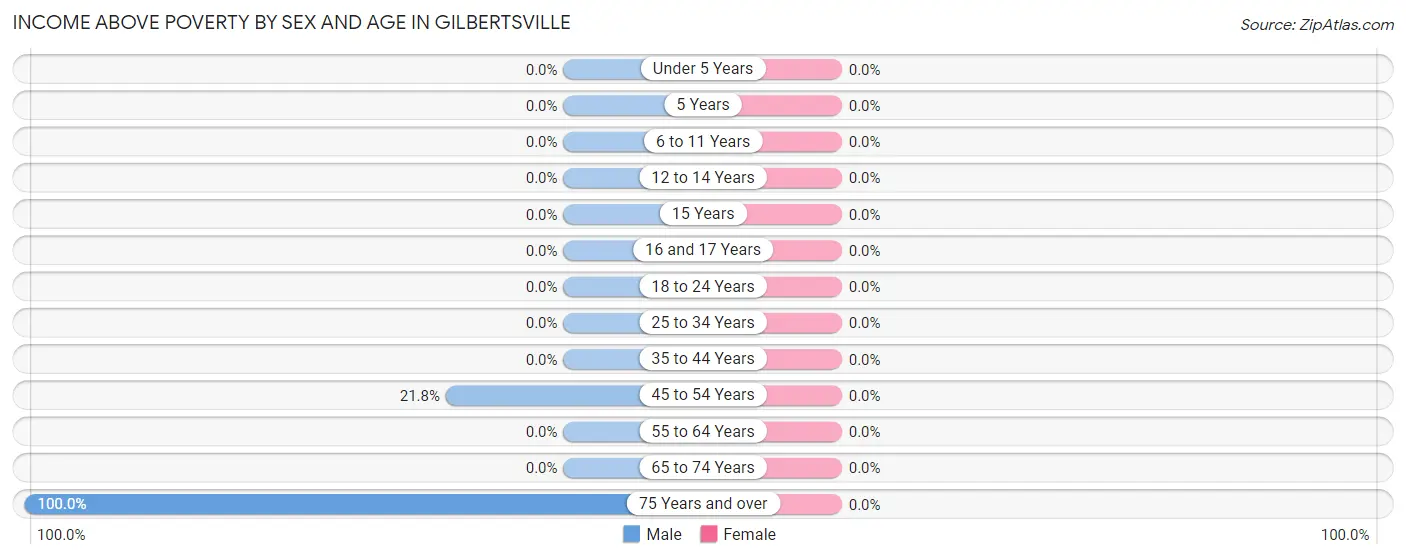
Income Above Poverty by Sex and Age in Gilbertsville
| Age Bracket | Male | Female |
| Under 5 Years | 0 (0.0%) | 0 (0.0%) |
| 5 Years | 0 (0.0%) | 0 (0.0%) |
| 6 to 11 Years | 0 (0.0%) | 0 (0.0%) |
| 12 to 14 Years | 0 (0.0%) | 0 (0.0%) |
| 15 Years | 0 (0.0%) | 0 (0.0%) |
| 16 and 17 Years | 0 (0.0%) | 0 (0.0%) |
| 18 to 24 Years | 0 (0.0%) | 0 (0.0%) |
| 25 to 34 Years | 0 (0.0%) | 0 (0.0%) |
| 35 to 44 Years | 0 (0.0%) | 0 (0.0%) |
| 45 to 54 Years | 36 (21.8%) | 0 (0.0%) |
| 55 to 64 Years | 0 (0.0%) | 0 (0.0%) |
| 65 to 74 Years | 0 (0.0%) | 0 (0.0%) |
| 75 Years and over | 19 (100.0%) | 0 (0.0%) |
| Total | 55 (28.1%) | 0 (0.0%) |
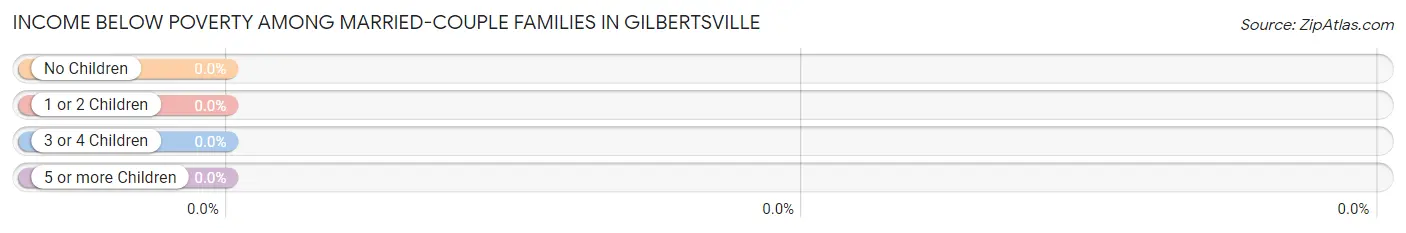
Income Below Poverty Among Married-Couple Families in Gilbertsville
| Children | Above Poverty | Below Poverty |
| No Children | 0 (0.0%) | 0 (0.0%) |
| 1 or 2 Children | 0 (0.0%) | 0 (0.0%) |
| 3 or 4 Children | 0 (0.0%) | 0 (0.0%) |
| 5 or more Children | 0 (0.0%) | 0 (0.0%) |
| Total | 0 (0.0%) | 0 (0.0%) |
Income Below Poverty Among Single-Parent Households in Gilbertsville
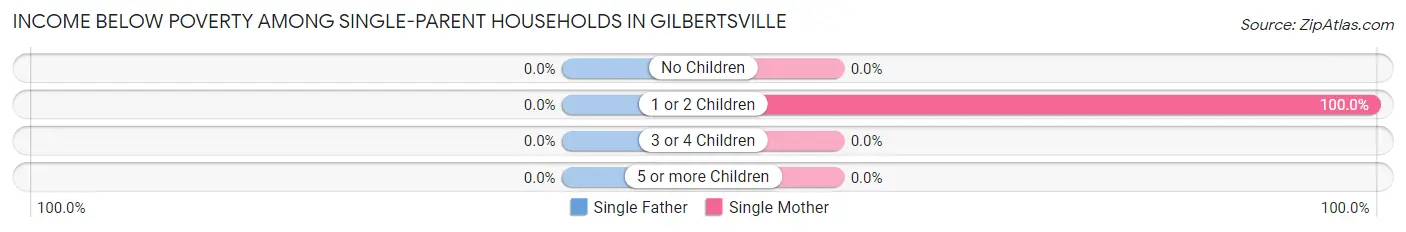
| Children | Single Father | Single Mother |
| No Children | 0 (0.0%) | 0 (0.0%) |
| 1 or 2 Children | 0 (0.0%) | 6 (100.0%) |
| 3 or 4 Children | 0 (0.0%) | 0 (0.0%) |
| 5 or more Children | 0 (0.0%) | 0 (0.0%) |
| Total | 0 (0.0%) | 6 (100.0%) |
Income Below Poverty Among Married-Couple vs Single-Parent Households in Gilbertsville
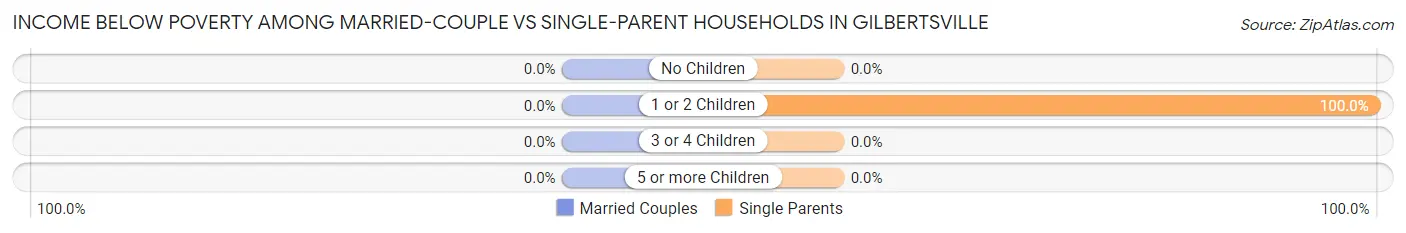
| Children | Married-Couple Families | Single-Parent Households |
| No Children | 0 (0.0%) | 0 (0.0%) |
| 1 or 2 Children | 0 (0.0%) | 6 (100.0%) |
| 3 or 4 Children | 0 (0.0%) | 0 (0.0%) |
| 5 or more Children | 0 (0.0%) | 0 (0.0%) |
| Total | 0 (0.0%) | 6 (100.0%) |
Race in Gilbertsville
The most populous races in Gilbertsville are , and White / Caucasian (245 | 100.0%).
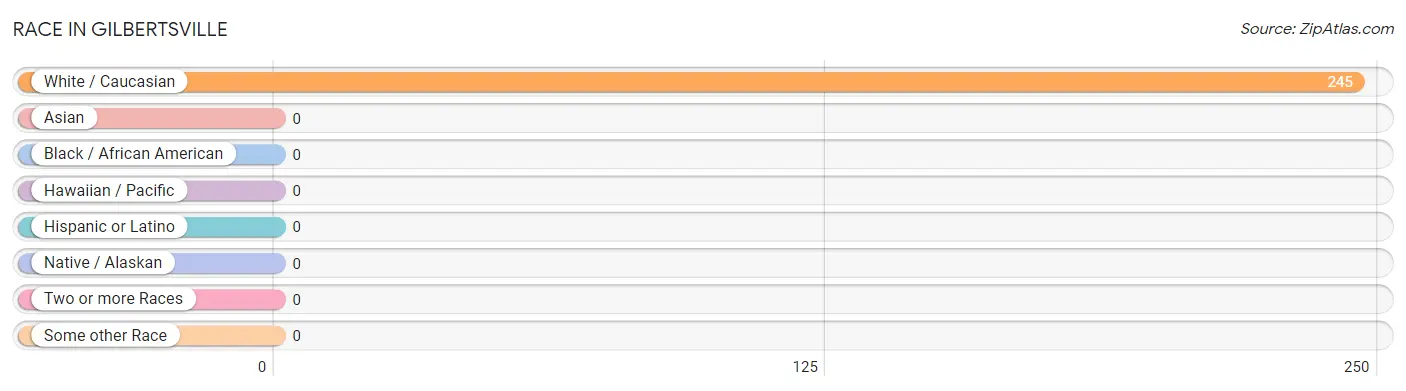
| Race | # Population | % Population |
| Asian | 0 | 0.0% |
| Black / African American | 0 | 0.0% |
| Hawaiian / Pacific | 0 | 0.0% |
| Hispanic or Latino | 0 | 0.0% |
| Native / Alaskan | 0 | 0.0% |
| White / Caucasian | 245 | 100.0% |
| Two or more Races | 0 | 0.0% |
| Some other Race | 0 | 0.0% |
| Total | 245 | 100.0% |
Ancestry in Gilbertsville
The most populous ancestries reported in Gilbertsville are English (112 | 45.7%), Scottish (19 | 7.8%), and German (17 | 6.9%), together accounting for 60.4% of all Gilbertsville residents.
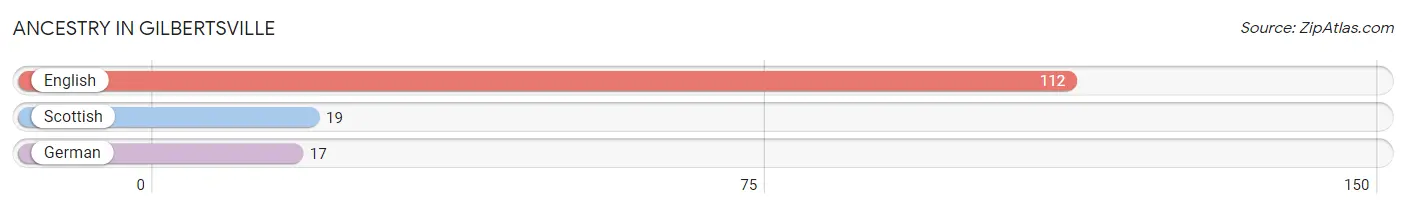
| Ancestry | # Population | % Population |
| English | 112 | 45.7% |
| German | 17 | 6.9% |
| Scottish | 19 | 7.8% | View All 3 Rows |
Immigrants in Gilbertsville

| Immigration Origin | # Population | % Population | View All 0 Rows |
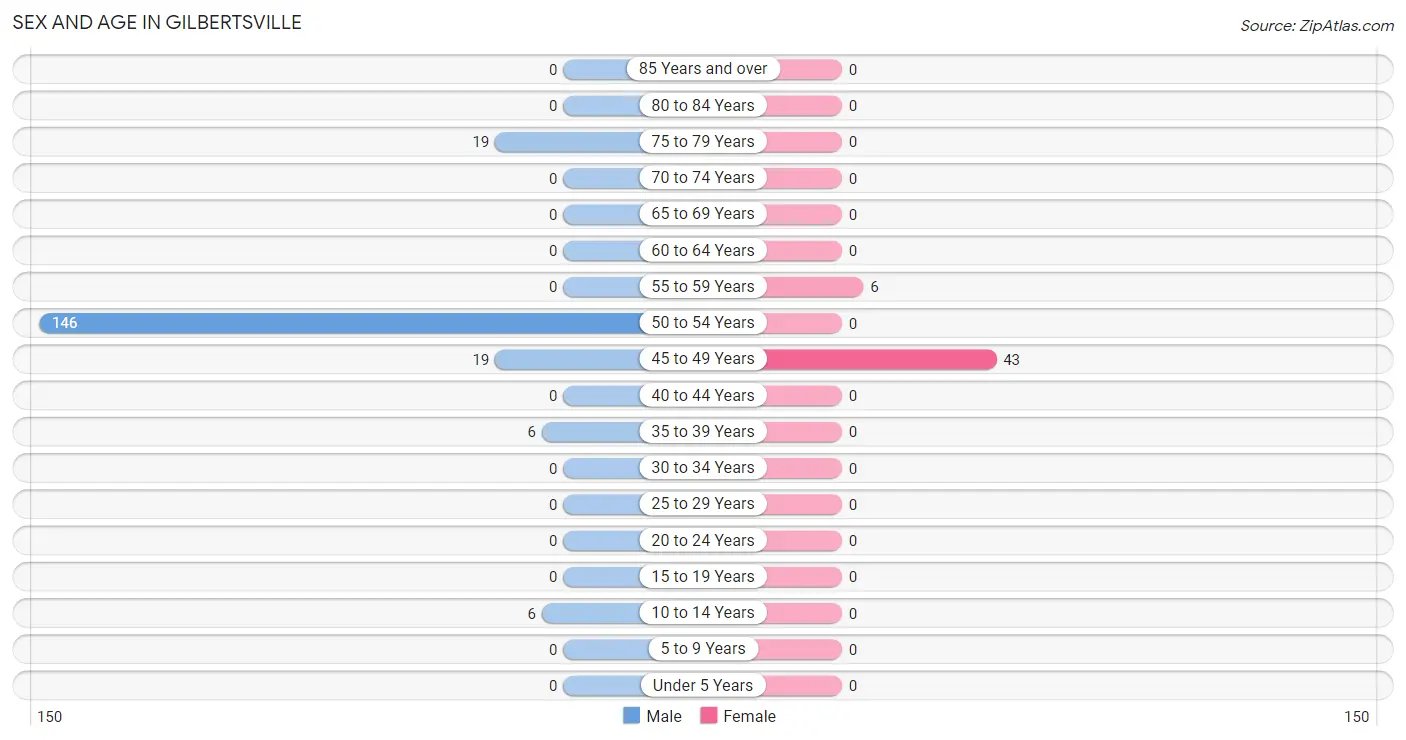
Sex and Age in Gilbertsville
Sex and Age in Gilbertsville
The most populous age groups in Gilbertsville are 50 to 54 Years (146 | 74.5%) for men and 45 to 49 Years (43 | 87.8%) for women.
| Age Bracket | Male | Female |
| Under 5 Years | 0 (0.0%) | 0 (0.0%) |
| 5 to 9 Years | 0 (0.0%) | 0 (0.0%) |
| 10 to 14 Years | 6 (3.1%) | 0 (0.0%) |
| 15 to 19 Years | 0 (0.0%) | 0 (0.0%) |
| 20 to 24 Years | 0 (0.0%) | 0 (0.0%) |
| 25 to 29 Years | 0 (0.0%) | 0 (0.0%) |
| 30 to 34 Years | 0 (0.0%) | 0 (0.0%) |
| 35 to 39 Years | 6 (3.1%) | 0 (0.0%) |
| 40 to 44 Years | 0 (0.0%) | 0 (0.0%) |
| 45 to 49 Years | 19 (9.7%) | 43 (87.8%) |
| 50 to 54 Years | 146 (74.5%) | 0 (0.0%) |
| 55 to 59 Years | 0 (0.0%) | 6 (12.2%) |
| 60 to 64 Years | 0 (0.0%) | 0 (0.0%) |
| 65 to 69 Years | 0 (0.0%) | 0 (0.0%) |
| 70 to 74 Years | 0 (0.0%) | 0 (0.0%) |
| 75 to 79 Years | 19 (9.7%) | 0 (0.0%) |
| 80 to 84 Years | 0 (0.0%) | 0 (0.0%) |
| 85 Years and over | 0 (0.0%) | 0 (0.0%) |
| Total | 196 (100.0%) | 49 (100.0%) |
Families and Households in Gilbertsville
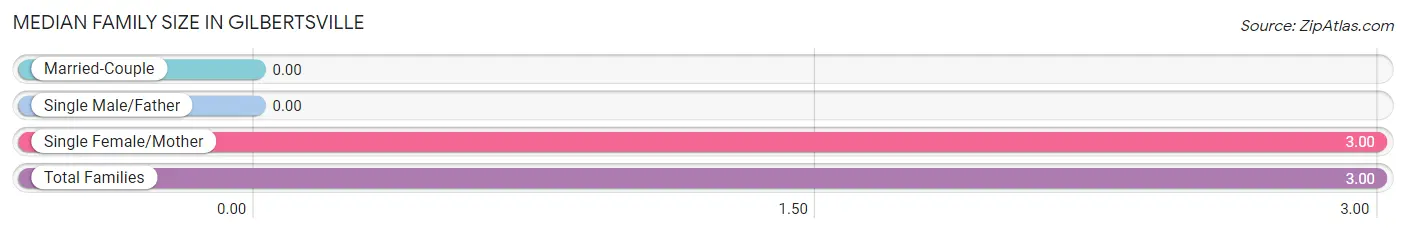
Median Family Size in Gilbertsville
| Family Type | # Families | Family Size |
| Married-Couple | 0 (0.0%) | - |
| Single Male/Father | 0 (0.0%) | - |
| Single Female/Mother | 6 (100.0%) | 3.00 |
| Total Families | 6 (100.0%) | 3.00 |
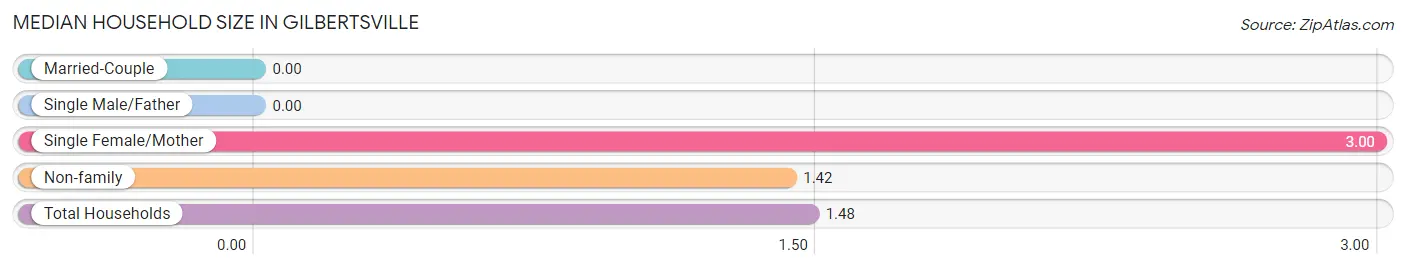
Median Household Size in Gilbertsville
| Household Type | # Households | Household Size |
| Married-Couple | 0 (0.0%) | - |
| Single Male/Father | 0 (0.0%) | - |
| Single Female/Mother | 6 (3.6%) | 3.00 |
| Non-family | 160 (96.4%) | 1.42 |
| Total Households | 166 (100.0%) | 1.48 |
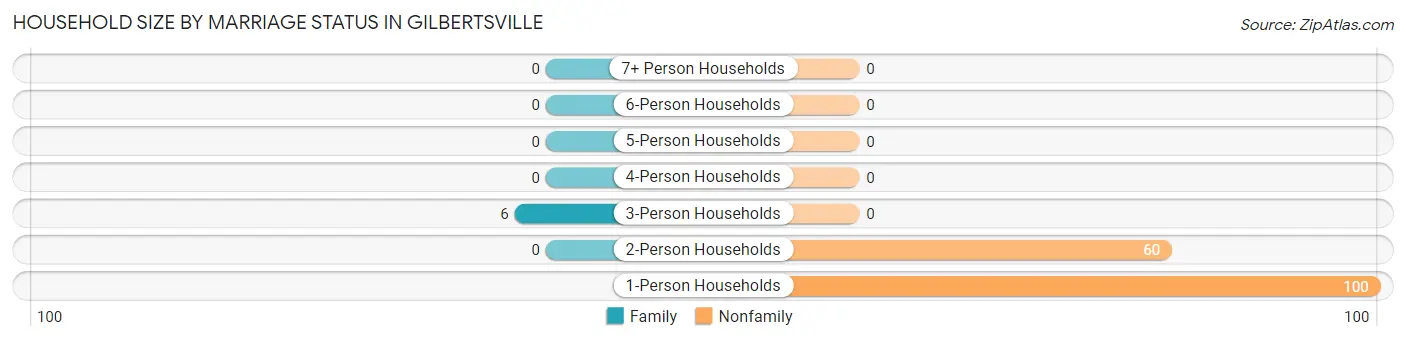
Household Size by Marriage Status in Gilbertsville
Out of a total of 166 households in Gilbertsville, 6 (3.6%) are family households, while 160 (96.4%) are nonfamily households. The most numerous type of family households are 3-person households, comprising 6, and the most common type of nonfamily households are 1-person households, comprising 100.
| Household Size | Family Households | Nonfamily Households |
| 1-Person Households | - | 100 (60.2%) |
| 2-Person Households | 0 (0.0%) | 60 (36.1%) |
| 3-Person Households | 6 (3.6%) | 0 (0.0%) |
| 4-Person Households | 0 (0.0%) | 0 (0.0%) |
| 5-Person Households | 0 (0.0%) | 0 (0.0%) |
| 6-Person Households | 0 (0.0%) | 0 (0.0%) |
| 7+ Person Households | 0 (0.0%) | 0 (0.0%) |
| Total | 6 (3.6%) | 160 (96.4%) |
Female Fertility in Gilbertsville
Fertility by Age in Gilbertsville
| Age Bracket | Women with Births | Births / 1,000 Women |
| 15 to 19 years | 0 (0.0%) | 0.0 |
| 20 to 34 years | 0 (0.0%) | 0.0 |
| 35 to 50 years | 0 (0.0%) | 0.0 |
| Total | 0 (0.0%) | 0.0 |
Fertility by Age by Marriage Status in Gilbertsville
| Age Bracket | Married | Unmarried |
| 15 to 19 years | 0 (0.0%) | 0 (0.0%) |
| 20 to 34 years | 0 (0.0%) | 0 (0.0%) |
| 35 to 50 years | 0 (0.0%) | 0 (0.0%) |
| Total | 0 (0.0%) | 0 (0.0%) |
Fertility by Education in Gilbertsville
| Educational Attainment | Women with Births | Births / 1,000 Women |
| Less than High School | 0 (0.0%) | 0.0 |
| High School Diploma | 0 (0.0%) | 0.0 |
| College or Associate's Degree | 0 (0.0%) | 0.0 |
| Bachelor's Degree | 0 (0.0%) | 0.0 |
| Graduate Degree | 0 (0.0%) | 0.0 |
| Total | 0 (0.0%) | 0.0 |
Fertility by Education by Marriage Status in Gilbertsville
| Educational Attainment | Married | Unmarried |
| Less than High School | 0 (0.0%) | 0 (0.0%) |
| High School Diploma | 0 (0.0%) | 0 (0.0%) |
| College or Associate's Degree | 0 (0.0%) | 0 (0.0%) |
| Bachelor's Degree | 0 (0.0%) | 0 (0.0%) |
| Graduate Degree | 0 (0.0%) | 0 (0.0%) |
| Total | 0 (0.0%) | 0 (0.0%) |
Employment Characteristics in Gilbertsville
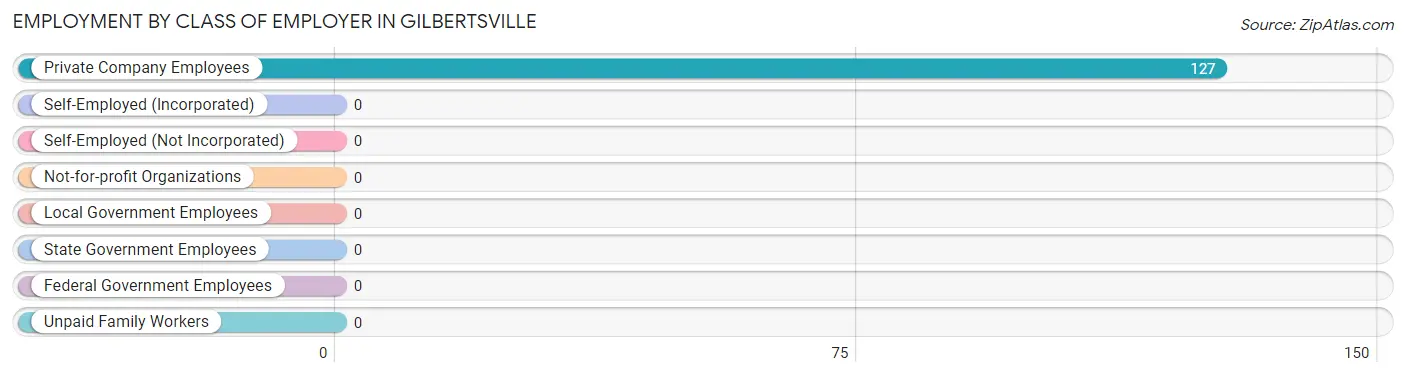
Employment by Class of Employer in Gilbertsville
Among the 127 employed individuals in Gilbertsville, , and private company employees (127 | 100.0%) make up the most common classes of employment.
| Employer Class | # Employees | % Employees |
| Private Company Employees | 127 | 100.0% |
| Self-Employed (Incorporated) | 0 | 0.0% |
| Self-Employed (Not Incorporated) | 0 | 0.0% |
| Not-for-profit Organizations | 0 | 0.0% |
| Local Government Employees | 0 | 0.0% |
| State Government Employees | 0 | 0.0% |
| Federal Government Employees | 0 | 0.0% |
| Unpaid Family Workers | 0 | 0.0% |
| Total | 127 | 100.0% |
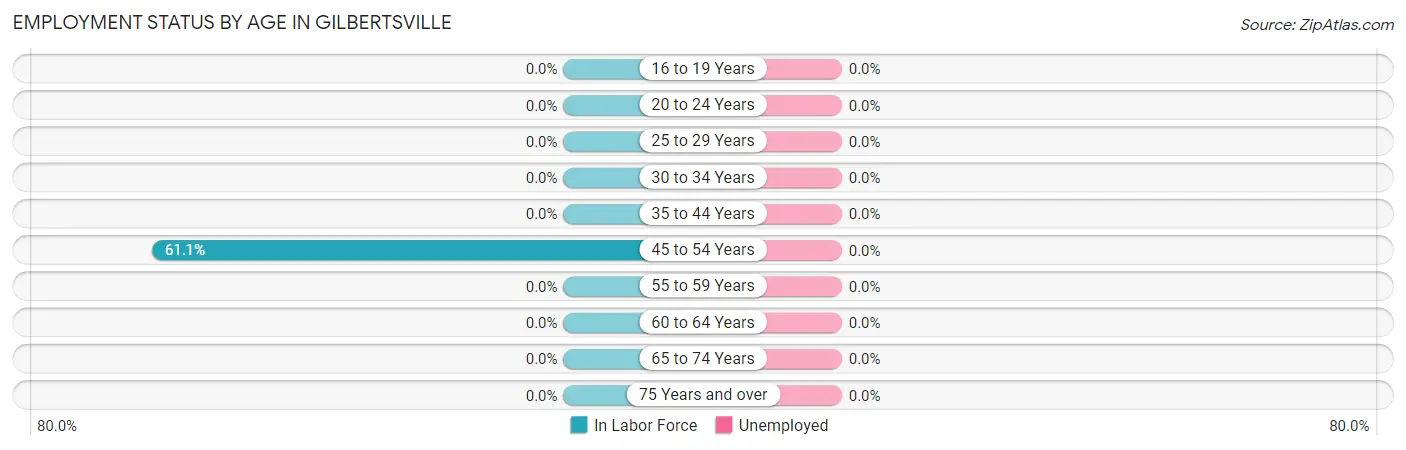
Employment Status by Age in Gilbertsville
| Age Bracket | In Labor Force | Unemployed |
| 16 to 19 Years | 0 (0.0%) | 0 (0.0%) |
| 20 to 24 Years | 0 (0.0%) | 0 (0.0%) |
| 25 to 29 Years | 0 (0.0%) | 0 (0.0%) |
| 30 to 34 Years | 0 (0.0%) | 0 (0.0%) |
| 35 to 44 Years | 0 (0.0%) | 0 (0.0%) |
| 45 to 54 Years | 127 (61.1%) | 0 (0.0%) |
| 55 to 59 Years | 0 (0.0%) | 0 (0.0%) |
| 60 to 64 Years | 0 (0.0%) | 0 (0.0%) |
| 65 to 74 Years | 0 (0.0%) | 0 (0.0%) |
| 75 Years and over | 0 (0.0%) | 0 (0.0%) |
| Total | 127 (53.1%) | 0 (0.0%) |
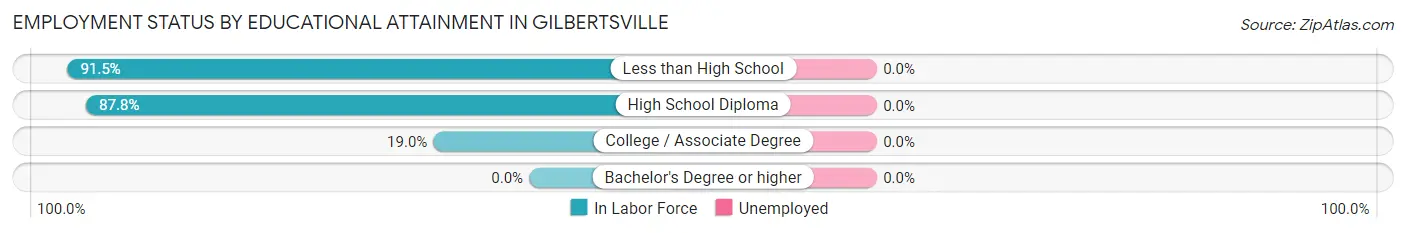
Employment Status by Educational Attainment in Gilbertsville
| Educational Attainment | In Labor Force | Unemployed |
| Less than High School | 65 (91.5%) | 0 (0.0%) |
| High School Diploma | 43 (87.8%) | 0 (0.0%) |
| College / Associate Degree | 19 (19.0%) | 0 (0.0%) |
| Bachelor's Degree or higher | 0 (0.0%) | 0 (0.0%) |
| Total | 127 (57.7%) | 0 (0.0%) |
Employment Occupations by Sex in Gilbertsville
Management, Business, Science and Arts Occupations
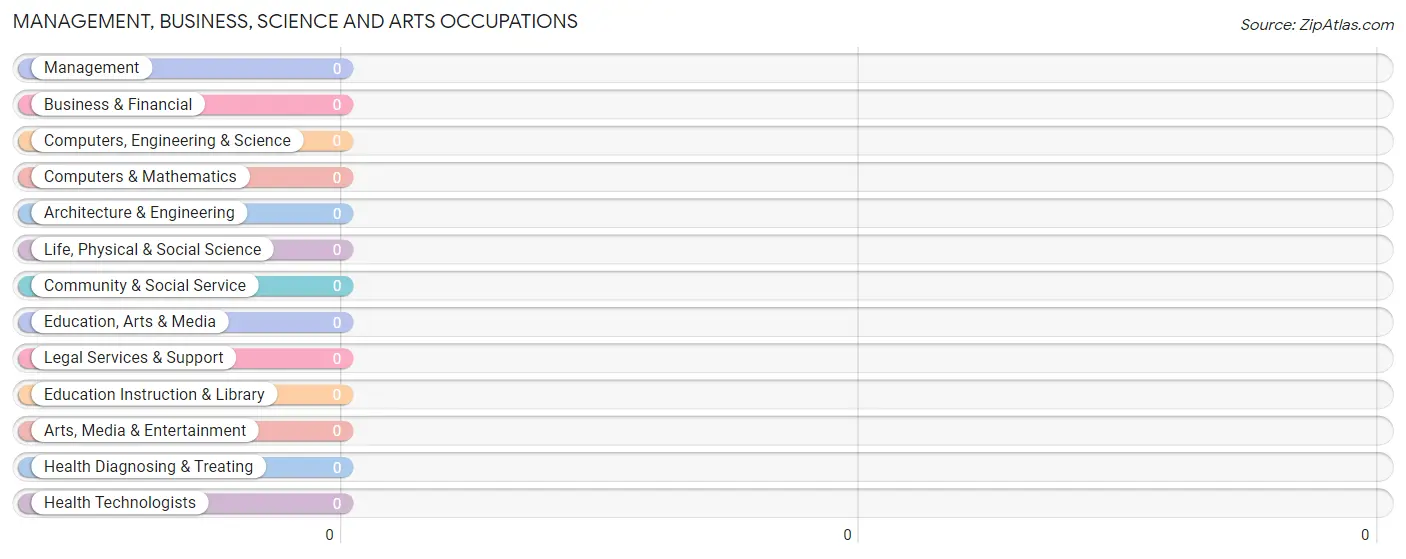
Management, Business, Science and Arts Occupations by Sex
| Occupation | Male | Female |
| Management | 0 (0.0%) | 0 (0.0%) |
| Business & Financial | 0 (0.0%) | 0 (0.0%) |
| Computers, Engineering & Science | 0 (0.0%) | 0 (0.0%) |
| Computers & Mathematics | 0 (0.0%) | 0 (0.0%) |
| Architecture & Engineering | 0 (0.0%) | 0 (0.0%) |
| Life, Physical & Social Science | 0 (0.0%) | 0 (0.0%) |
| Community & Social Service | 0 (0.0%) | 0 (0.0%) |
| Education, Arts & Media | 0 (0.0%) | 0 (0.0%) |
| Legal Services & Support | 0 (0.0%) | 0 (0.0%) |
| Education Instruction & Library | 0 (0.0%) | 0 (0.0%) |
| Arts, Media & Entertainment | 0 (0.0%) | 0 (0.0%) |
| Health Diagnosing & Treating | 0 (0.0%) | 0 (0.0%) |
| Health Technologists | 0 (0.0%) | 0 (0.0%) |
| Total (Category) | 0 (0.0%) | 0 (0.0%) |
| Total (Overall) | 84 (66.1%) | 43 (33.9%) |
Services Occupations
Services Occupations by Sex
| Occupation | Male | Female |
| Healthcare Support | 0 (0.0%) | 0 (0.0%) |
| Security & Protection | 0 (0.0%) | 0 (0.0%) |
| Firefighting & Prevention | 0 (0.0%) | 0 (0.0%) |
| Law Enforcement | 0 (0.0%) | 0 (0.0%) |
| Food Preparation & Serving | 0 (0.0%) | 0 (0.0%) |
| Cleaning & Maintenance | 0 (0.0%) | 0 (0.0%) |
| Personal Care & Service | 0 (0.0%) | 0 (0.0%) |
| Total (Category) | 0 (0.0%) | 0 (0.0%) |
| Total (Overall) | 84 (66.1%) | 43 (33.9%) |
Sales and Office Occupations
Sales and Office Occupations by Sex
| Occupation | Male | Female |
| Sales & Related | 0 (0.0%) | 0 (0.0%) |
| Office & Administration | 0 (0.0%) | 0 (0.0%) |
| Total (Category) | 0 (0.0%) | 0 (0.0%) |
| Total (Overall) | 84 (66.1%) | 43 (33.9%) |
Natural Resources, Construction and Maintenance Occupations

Natural Resources, Construction and Maintenance Occupations by Sex
| Occupation | Male | Female |
| Farming, Fishing & Forestry | 0 (0.0%) | 0 (0.0%) |
| Construction & Extraction | 0 (0.0%) | 0 (0.0%) |
| Installation, Maintenance & Repair | 0 (0.0%) | 0 (0.0%) |
| Total (Category) | 0 (0.0%) | 0 (0.0%) |
| Total (Overall) | 84 (66.1%) | 43 (33.9%) |
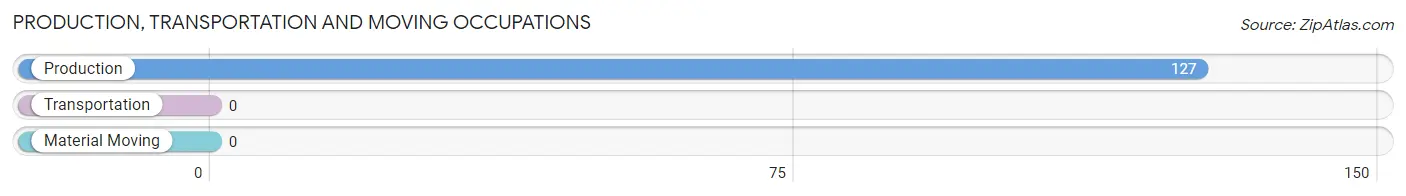
Production, Transportation and Moving Occupations
The most common Production, Transportation and Moving occupations in Gilbertsville are , and Production (127 | 100.0%).
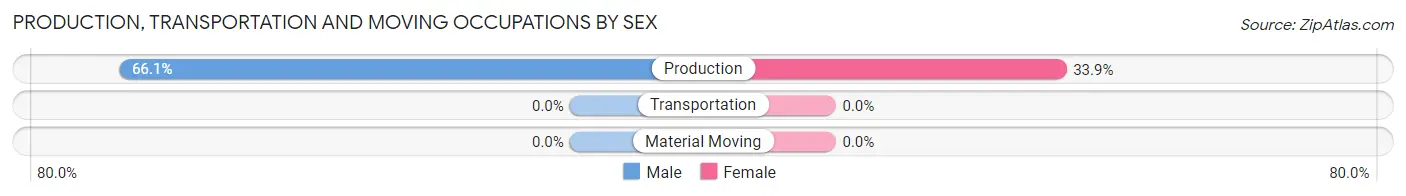
Production, Transportation and Moving Occupations by Sex
| Occupation | Male | Female |
| Production | 84 (66.1%) | 43 (33.9%) |
| Transportation | 0 (0.0%) | 0 (0.0%) |
| Material Moving | 0 (0.0%) | 0 (0.0%) |
| Total (Category) | 84 (66.1%) | 43 (33.9%) |
| Total (Overall) | 84 (66.1%) | 43 (33.9%) |
Employment Industries by Sex in Gilbertsville
Employment Industries in Gilbertsville
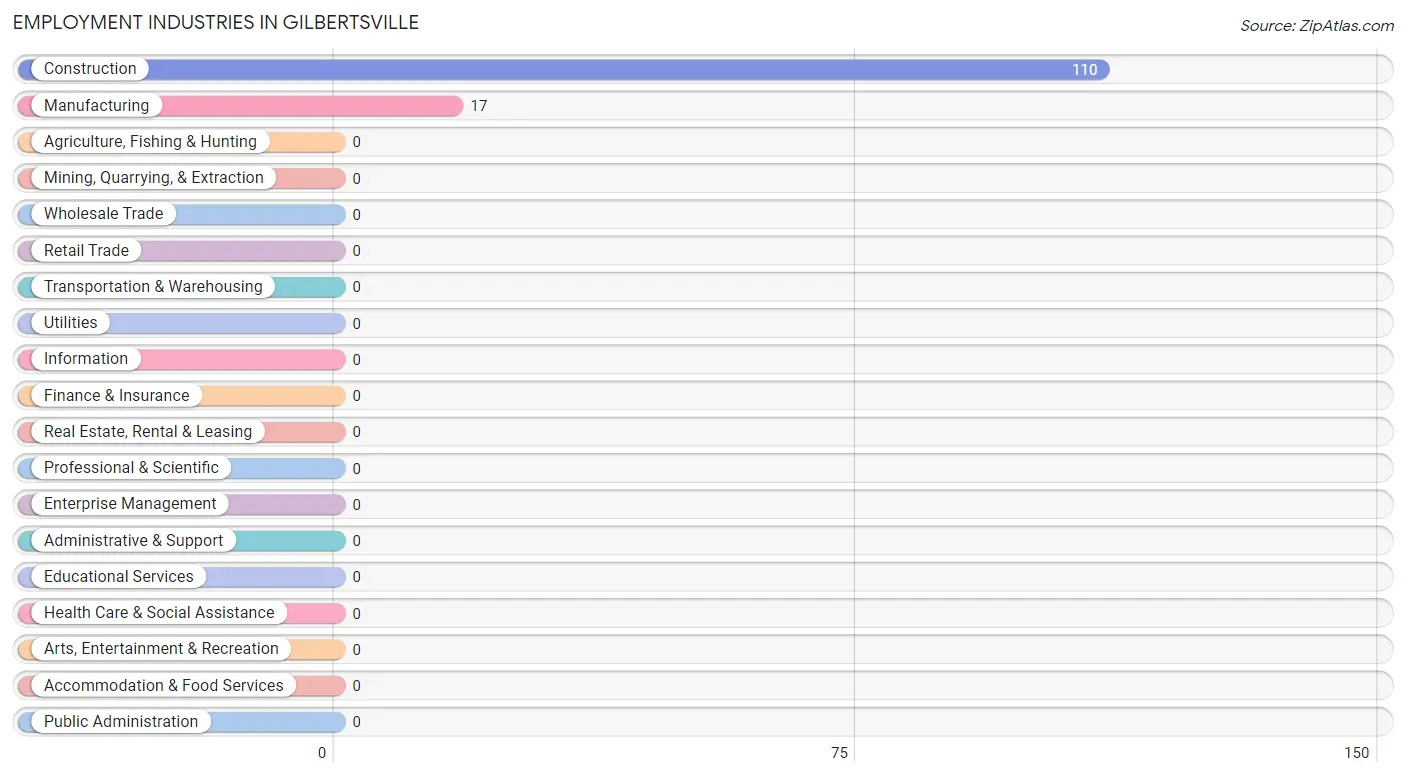
The major employment industries in Gilbertsville include Construction (110 | 86.6%), and Manufacturing (17 | 13.4%).
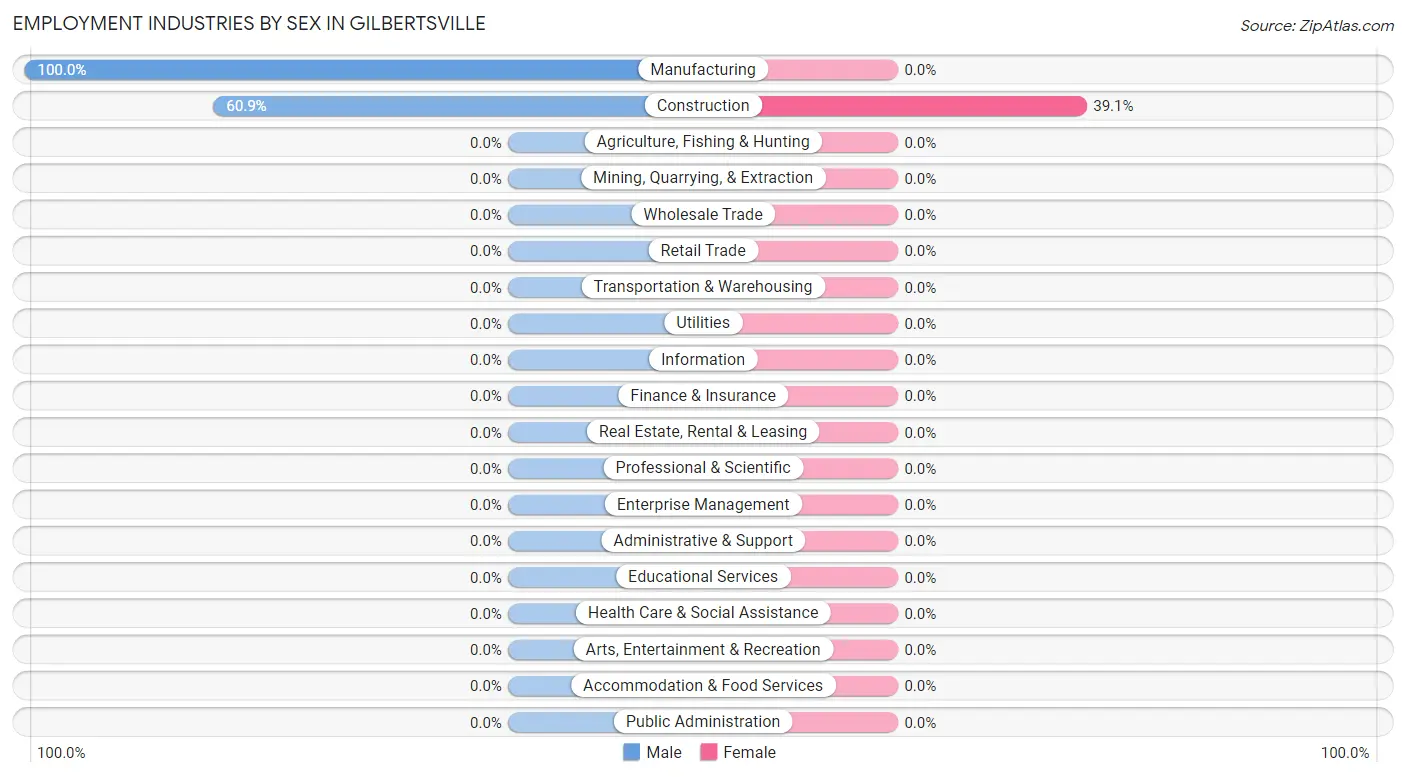
Employment Industries by Sex in Gilbertsville
| Industry | Male | Female |
| Agriculture, Fishing & Hunting | 0 (0.0%) | 0 (0.0%) |
| Mining, Quarrying, & Extraction | 0 (0.0%) | 0 (0.0%) |
| Construction | 67 (60.9%) | 43 (39.1%) |
| Manufacturing | 17 (100.0%) | 0 (0.0%) |
| Wholesale Trade | 0 (0.0%) | 0 (0.0%) |
| Retail Trade | 0 (0.0%) | 0 (0.0%) |
| Transportation & Warehousing | 0 (0.0%) | 0 (0.0%) |
| Utilities | 0 (0.0%) | 0 (0.0%) |
| Information | 0 (0.0%) | 0 (0.0%) |
| Finance & Insurance | 0 (0.0%) | 0 (0.0%) |
| Real Estate, Rental & Leasing | 0 (0.0%) | 0 (0.0%) |
| Professional & Scientific | 0 (0.0%) | 0 (0.0%) |
| Enterprise Management | 0 (0.0%) | 0 (0.0%) |
| Administrative & Support | 0 (0.0%) | 0 (0.0%) |
| Educational Services | 0 (0.0%) | 0 (0.0%) |
| Health Care & Social Assistance | 0 (0.0%) | 0 (0.0%) |
| Arts, Entertainment & Recreation | 0 (0.0%) | 0 (0.0%) |
| Accommodation & Food Services | 0 (0.0%) | 0 (0.0%) |
| Public Administration | 0 (0.0%) | 0 (0.0%) |
| Total | 84 (66.1%) | 43 (33.9%) |
Education in Gilbertsville
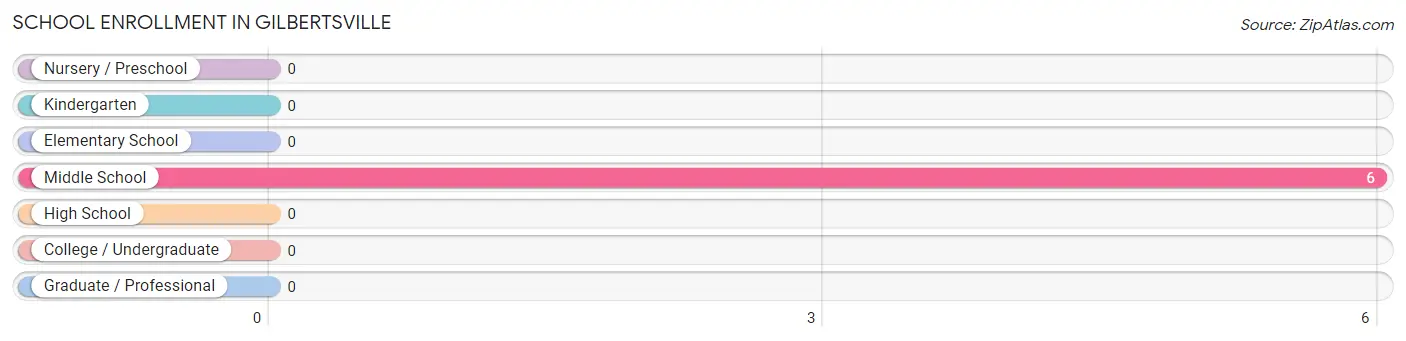
School Enrollment in Gilbertsville
| School Level | # Students | % Students |
| Nursery / Preschool | 0 | 0.0% |
| Kindergarten | 0 | 0.0% |
| Elementary School | 0 | 0.0% |
| Middle School | 6 | 100.0% |
| High School | 0 | 0.0% |
| College / Undergraduate | 0 | 0.0% |
| Graduate / Professional | 0 | 0.0% |
| Total | 6 | 100.0% |
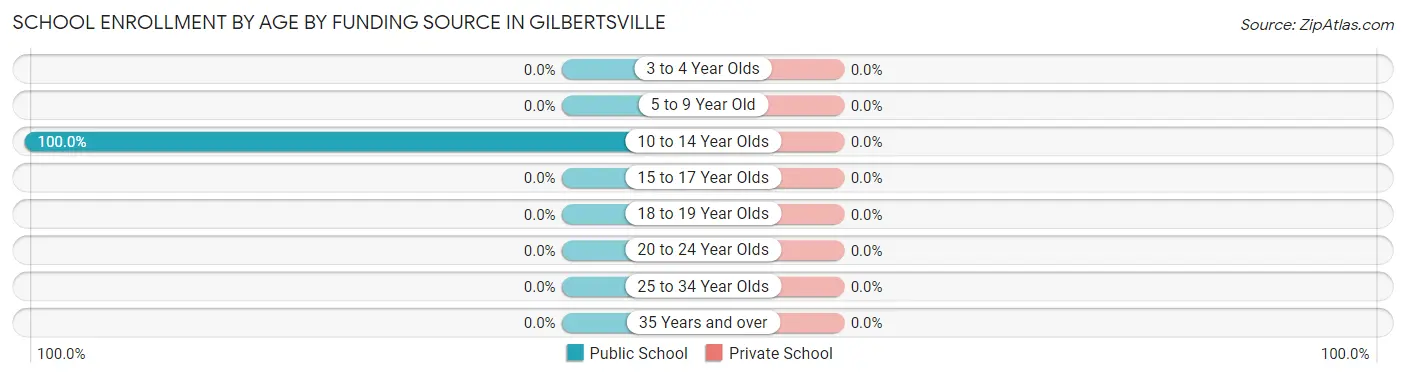
School Enrollment by Age by Funding Source in Gilbertsville
| Age Bracket | Public School | Private School |
| 3 to 4 Year Olds | 0 (0.0%) | 0 (0.0%) |
| 5 to 9 Year Old | 0 (0.0%) | 0 (0.0%) |
| 10 to 14 Year Olds | 6 (100.0%) | 0 (0.0%) |
| 15 to 17 Year Olds | 0 (0.0%) | 0 (0.0%) |
| 18 to 19 Year Olds | 0 (0.0%) | 0 (0.0%) |
| 20 to 24 Year Olds | 0 (0.0%) | 0 (0.0%) |
| 25 to 34 Year Olds | 0 (0.0%) | 0 (0.0%) |
| 35 Years and over | 0 (0.0%) | 0 (0.0%) |
| Total | 6 (100.0%) | 0 (0.0%) |
Educational Attainment by Field of Study in Gilbertsville
| Field of Study | # Graduates | % Graduates |
| Computers & Mathematics | 0 | 0.0% |
| Bio, Nature & Agricultural | 0 | 0.0% |
| Physical & Health Sciences | 0 | 0.0% |
| Psychology | 0 | 0.0% |
| Social Sciences | 0 | 0.0% |
| Engineering | 0 | 0.0% |
| Multidisciplinary Studies | 0 | 0.0% |
| Science & Technology | 0 | 0.0% |
| Business | 0 | 0.0% |
| Education | 0 | 0.0% |
| Literature & Languages | 0 | 0.0% |
| Liberal Arts & History | 0 | 0.0% |
| Visual & Performing Arts | 0 | 0.0% |
| Communications | 0 | 0.0% |
| Arts & Humanities | 0 | 0.0% |
| Total | 0 | 0.0% |
Transportation & Commute in Gilbertsville
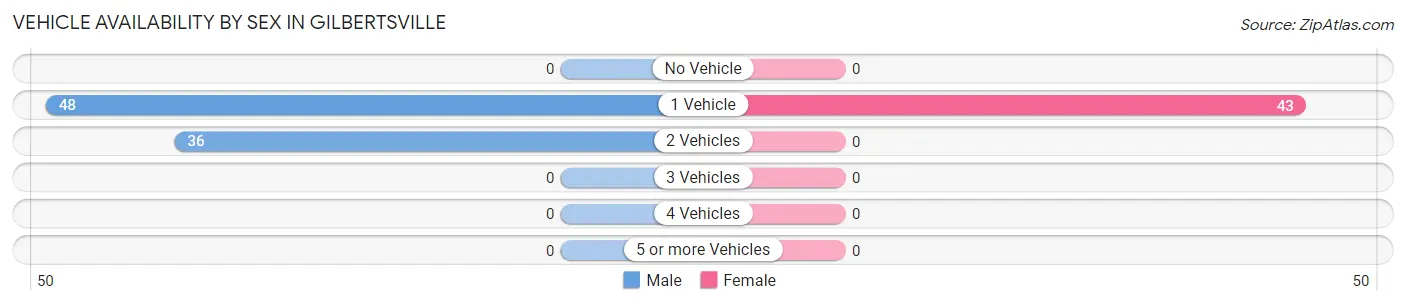
Vehicle Availability by Sex in Gilbertsville
The most prevalent vehicle ownership categories in Gilbertsville are males with 1 vehicle (48, accounting for 57.1%) and females with 1 vehicle (43, making up 111.6%).
| Vehicles Available | Male | Female |
| No Vehicle | 0 (0.0%) | 0 (0.0%) |
| 1 Vehicle | 48 (57.1%) | 43 (100.0%) |
| 2 Vehicles | 36 (42.9%) | 0 (0.0%) |
| 3 Vehicles | 0 (0.0%) | 0 (0.0%) |
| 4 Vehicles | 0 (0.0%) | 0 (0.0%) |
| 5 or more Vehicles | 0 (0.0%) | 0 (0.0%) |
| Total | 84 (100.0%) | 43 (100.0%) |
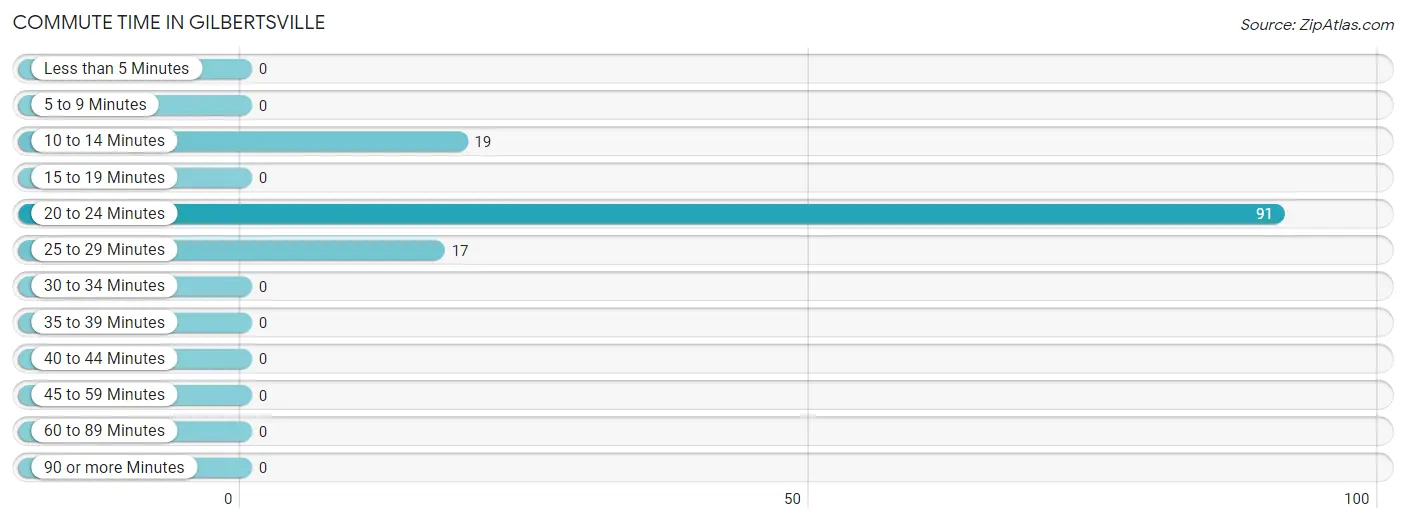
Commute Time in Gilbertsville
The most frequently occuring commute durations in Gilbertsville are 20 to 24 minutes (91 commuters, 71.7%), 10 to 14 minutes (19 commuters, 15.0%), and 25 to 29 minutes (17 commuters, 13.4%).
| Commute Time | # Commuters | % Commuters |
| Less than 5 Minutes | 0 | 0.0% |
| 5 to 9 Minutes | 0 | 0.0% |
| 10 to 14 Minutes | 19 | 15.0% |
| 15 to 19 Minutes | 0 | 0.0% |
| 20 to 24 Minutes | 91 | 71.7% |
| 25 to 29 Minutes | 17 | 13.4% |
| 30 to 34 Minutes | 0 | 0.0% |
| 35 to 39 Minutes | 0 | 0.0% |
| 40 to 44 Minutes | 0 | 0.0% |
| 45 to 59 Minutes | 0 | 0.0% |
| 60 to 89 Minutes | 0 | 0.0% |
| 90 or more Minutes | 0 | 0.0% |
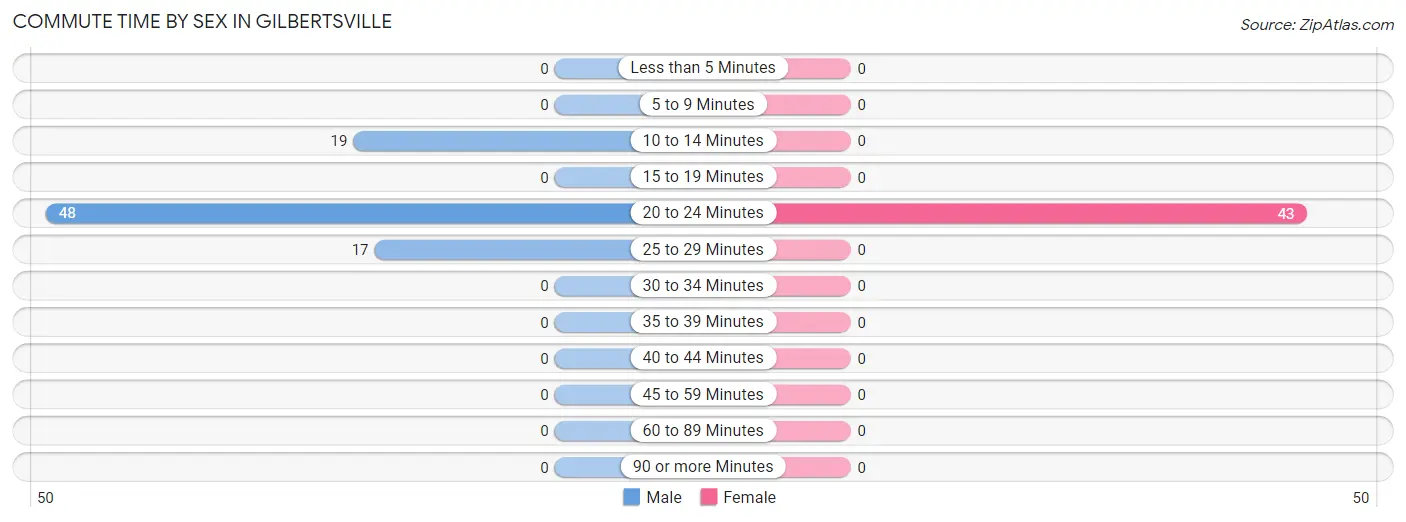
Commute Time by Sex in Gilbertsville
The most common commute times in Gilbertsville are 20 to 24 minutes (48 commuters, 57.1%) for males and 20 to 24 minutes (43 commuters, 100.0%) for females.
| Commute Time | Male | Female |
| Less than 5 Minutes | 0 (0.0%) | 0 (0.0%) |
| 5 to 9 Minutes | 0 (0.0%) | 0 (0.0%) |
| 10 to 14 Minutes | 19 (22.6%) | 0 (0.0%) |
| 15 to 19 Minutes | 0 (0.0%) | 0 (0.0%) |
| 20 to 24 Minutes | 48 (57.1%) | 43 (100.0%) |
| 25 to 29 Minutes | 17 (20.2%) | 0 (0.0%) |
| 30 to 34 Minutes | 0 (0.0%) | 0 (0.0%) |
| 35 to 39 Minutes | 0 (0.0%) | 0 (0.0%) |
| 40 to 44 Minutes | 0 (0.0%) | 0 (0.0%) |
| 45 to 59 Minutes | 0 (0.0%) | 0 (0.0%) |
| 60 to 89 Minutes | 0 (0.0%) | 0 (0.0%) |
| 90 or more Minutes | 0 (0.0%) | 0 (0.0%) |
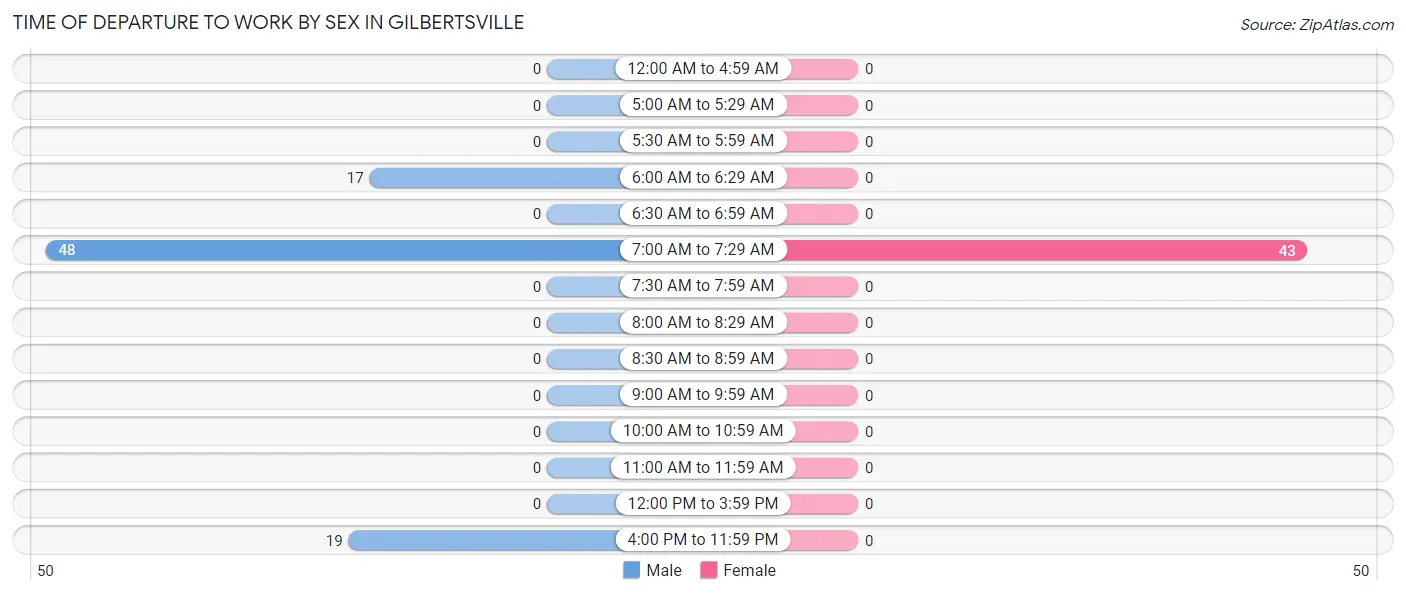
Time of Departure to Work by Sex in Gilbertsville
The most frequent times of departure to work in Gilbertsville are 7:00 AM to 7:29 AM (48, 57.1%) for males and 7:00 AM to 7:29 AM (43, 100.0%) for females.
| Time of Departure | Male | Female |
| 12:00 AM to 4:59 AM | 0 (0.0%) | 0 (0.0%) |
| 5:00 AM to 5:29 AM | 0 (0.0%) | 0 (0.0%) |
| 5:30 AM to 5:59 AM | 0 (0.0%) | 0 (0.0%) |
| 6:00 AM to 6:29 AM | 17 (20.2%) | 0 (0.0%) |
| 6:30 AM to 6:59 AM | 0 (0.0%) | 0 (0.0%) |
| 7:00 AM to 7:29 AM | 48 (57.1%) | 43 (100.0%) |
| 7:30 AM to 7:59 AM | 0 (0.0%) | 0 (0.0%) |
| 8:00 AM to 8:29 AM | 0 (0.0%) | 0 (0.0%) |
| 8:30 AM to 8:59 AM | 0 (0.0%) | 0 (0.0%) |
| 9:00 AM to 9:59 AM | 0 (0.0%) | 0 (0.0%) |
| 10:00 AM to 10:59 AM | 0 (0.0%) | 0 (0.0%) |
| 11:00 AM to 11:59 AM | 0 (0.0%) | 0 (0.0%) |
| 12:00 PM to 3:59 PM | 0 (0.0%) | 0 (0.0%) |
| 4:00 PM to 11:59 PM | 19 (22.6%) | 0 (0.0%) |
| Total | 84 (100.0%) | 43 (100.0%) |
Housing Occupancy in Gilbertsville
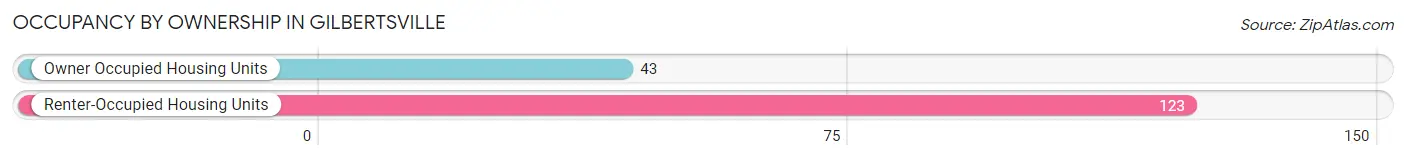
Occupancy by Ownership in Gilbertsville
Of the total 166 dwellings in Gilbertsville, owner-occupied units account for 43 (25.9%), while renter-occupied units make up 123 (74.1%).
| Occupancy | # Housing Units | % Housing Units |
| Owner Occupied Housing Units | 43 | 25.9% |
| Renter-Occupied Housing Units | 123 | 74.1% |
| Total Occupied Housing Units | 166 | 100.0% |
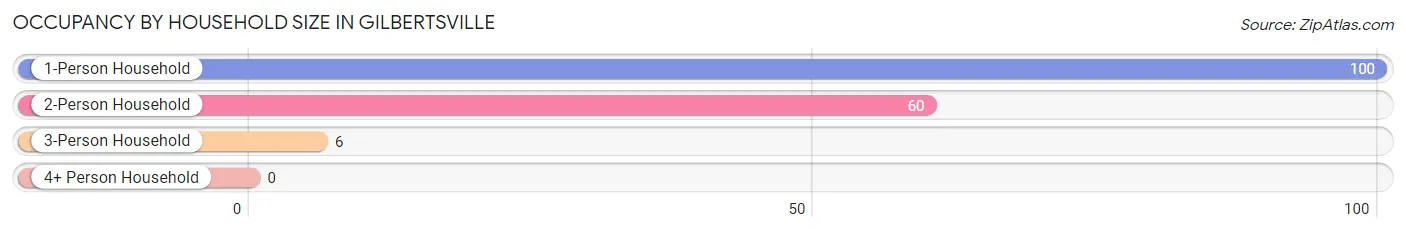
Occupancy by Household Size in Gilbertsville
| Household Size | # Housing Units | % Housing Units |
| 1-Person Household | 100 | 60.2% |
| 2-Person Household | 60 | 36.1% |
| 3-Person Household | 6 | 3.6% |
| 4+ Person Household | 0 | 0.0% |
| Total Housing Units | 166 | 100.0% |
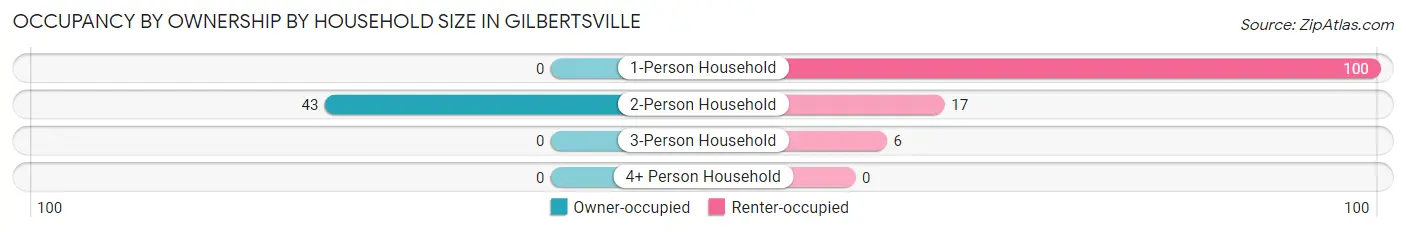
Occupancy by Ownership by Household Size in Gilbertsville
| Household Size | Owner-occupied | Renter-occupied |
| 1-Person Household | 0 (0.0%) | 100 (100.0%) |
| 2-Person Household | 43 (71.7%) | 17 (28.3%) |
| 3-Person Household | 0 (0.0%) | 6 (100.0%) |
| 4+ Person Household | 0 (0.0%) | 0 (0.0%) |
| Total Housing Units | 43 (25.9%) | 123 (74.1%) |
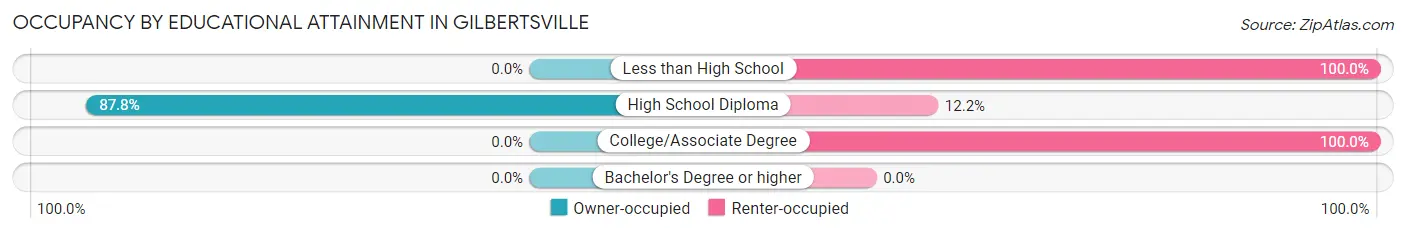
Occupancy by Educational Attainment in Gilbertsville
| Household Size | Owner-occupied | Renter-occupied |
| Less than High School | 0 (0.0%) | 17 (100.0%) |
| High School Diploma | 43 (87.8%) | 6 (12.2%) |
| College/Associate Degree | 0 (0.0%) | 100 (100.0%) |
| Bachelor's Degree or higher | 0 (0.0%) | 0 (0.0%) |
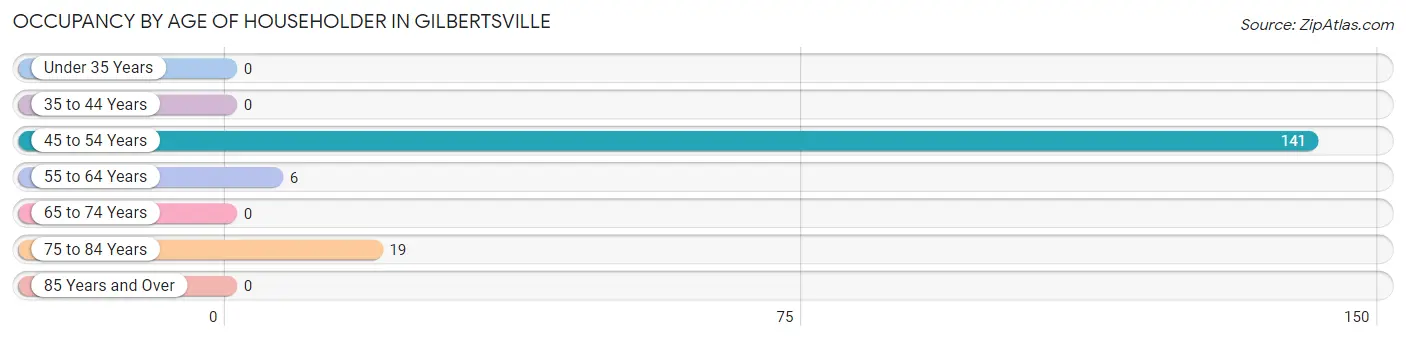
Occupancy by Age of Householder in Gilbertsville
| Age Bracket | # Households | % Households |
| Under 35 Years | 0 | 0.0% |
| 35 to 44 Years | 0 | 0.0% |
| 45 to 54 Years | 141 | 84.9% |
| 55 to 64 Years | 6 | 3.6% |
| 65 to 74 Years | 0 | 0.0% |
| 75 to 84 Years | 19 | 11.5% |
| 85 Years and Over | 0 | 0.0% |
| Total | 166 | 100.0% |
Housing Finances in Gilbertsville
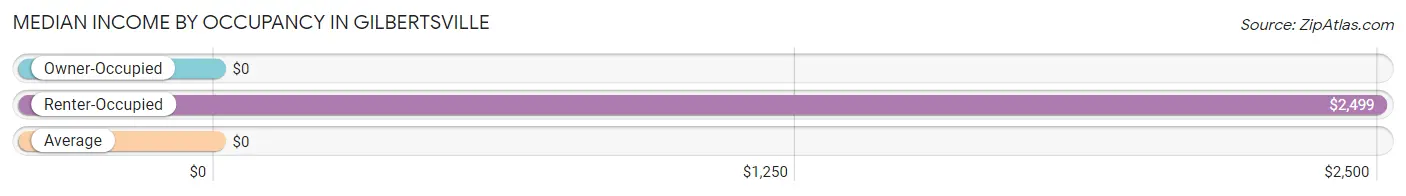
Median Income by Occupancy in Gilbertsville
| Occupancy Type | # Households | Median Income |
| Owner-Occupied | 43 (25.9%) | $0 |
| Renter-Occupied | 123 (74.1%) | $2,499 |
| Average | 166 (100.0%) | $0 |
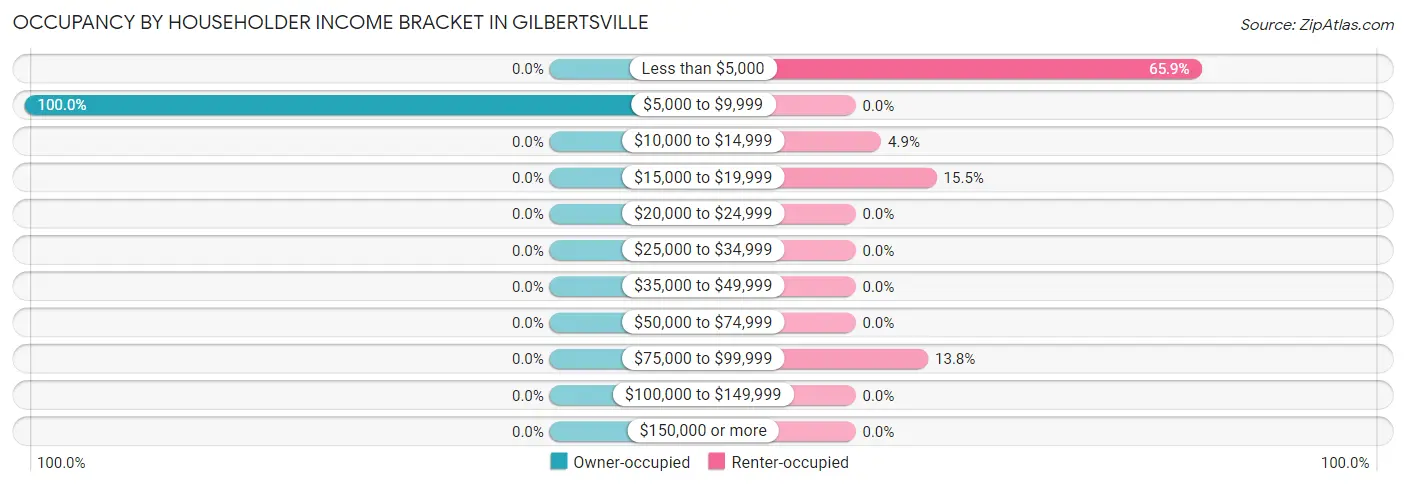
Occupancy by Householder Income Bracket in Gilbertsville
| Income Bracket | Owner-occupied | Renter-occupied |
| Less than $5,000 | 0 (0.0%) | 81 (65.8%) |
| $5,000 to $9,999 | 43 (100.0%) | 0 (0.0%) |
| $10,000 to $14,999 | 0 (0.0%) | 6 (4.9%) |
| $15,000 to $19,999 | 0 (0.0%) | 19 (15.4%) |
| $20,000 to $24,999 | 0 (0.0%) | 0 (0.0%) |
| $25,000 to $34,999 | 0 (0.0%) | 0 (0.0%) |
| $35,000 to $49,999 | 0 (0.0%) | 0 (0.0%) |
| $50,000 to $74,999 | 0 (0.0%) | 0 (0.0%) |
| $75,000 to $99,999 | 0 (0.0%) | 17 (13.8%) |
| $100,000 to $149,999 | 0 (0.0%) | 0 (0.0%) |
| $150,000 or more | 0 (0.0%) | 0 (0.0%) |
| Total | 43 (100.0%) | 123 (100.0%) |
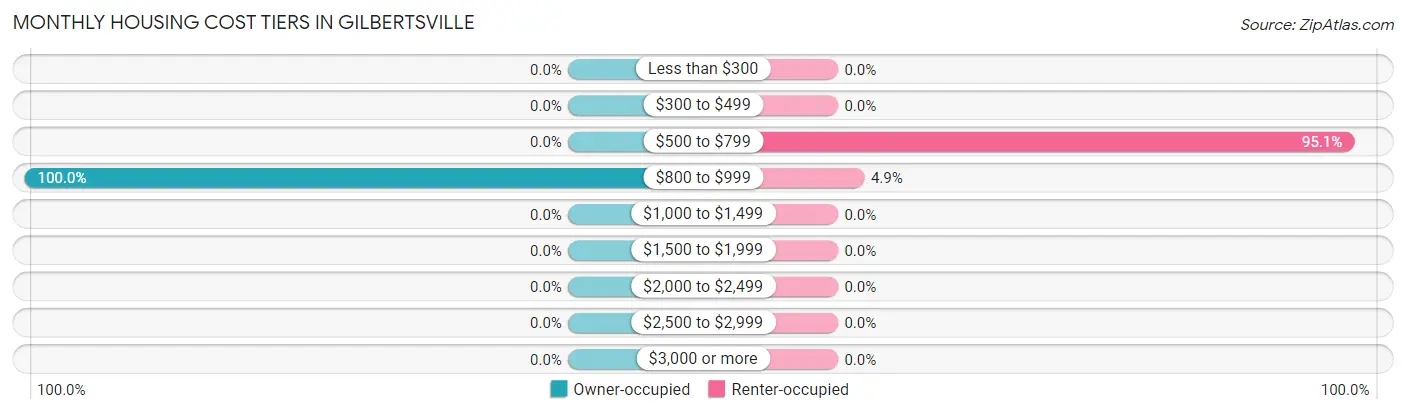
Monthly Housing Cost Tiers in Gilbertsville
| Monthly Cost | Owner-occupied | Renter-occupied |
| Less than $300 | 0 (0.0%) | 0 (0.0%) |
| $300 to $499 | 0 (0.0%) | 0 (0.0%) |
| $500 to $799 | 0 (0.0%) | 117 (95.1%) |
| $800 to $999 | 43 (100.0%) | 6 (4.9%) |
| $1,000 to $1,499 | 0 (0.0%) | 0 (0.0%) |
| $1,500 to $1,999 | 0 (0.0%) | 0 (0.0%) |
| $2,000 to $2,499 | 0 (0.0%) | 0 (0.0%) |
| $2,500 to $2,999 | 0 (0.0%) | 0 (0.0%) |
| $3,000 or more | 0 (0.0%) | 0 (0.0%) |
| Total | 43 (100.0%) | 123 (100.0%) |
Physical Housing Characteristics in Gilbertsville
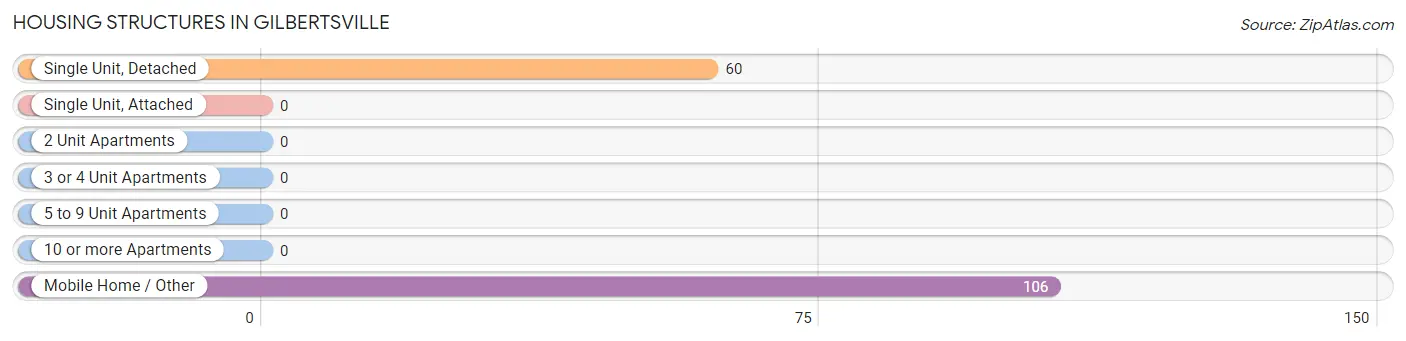
Housing Structures in Gilbertsville
| Structure Type | # Housing Units | % Housing Units |
| Single Unit, Detached | 60 | 36.1% |
| Single Unit, Attached | 0 | 0.0% |
| 2 Unit Apartments | 0 | 0.0% |
| 3 or 4 Unit Apartments | 0 | 0.0% |
| 5 to 9 Unit Apartments | 0 | 0.0% |
| 10 or more Apartments | 0 | 0.0% |
| Mobile Home / Other | 106 | 63.9% |
| Total | 166 | 100.0% |
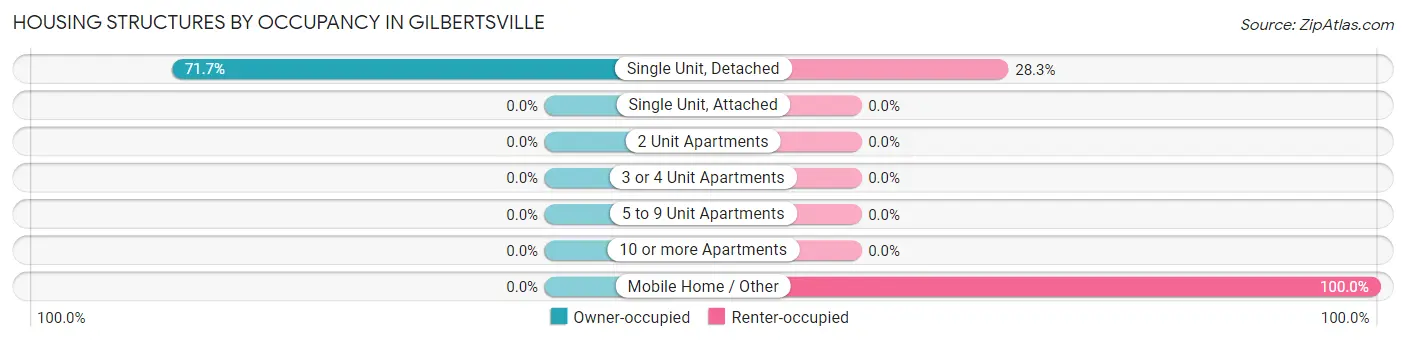
Housing Structures by Occupancy in Gilbertsville
| Structure Type | Owner-occupied | Renter-occupied |
| Single Unit, Detached | 43 (71.7%) | 17 (28.3%) |
| Single Unit, Attached | 0 (0.0%) | 0 (0.0%) |
| 2 Unit Apartments | 0 (0.0%) | 0 (0.0%) |
| 3 or 4 Unit Apartments | 0 (0.0%) | 0 (0.0%) |
| 5 to 9 Unit Apartments | 0 (0.0%) | 0 (0.0%) |
| 10 or more Apartments | 0 (0.0%) | 0 (0.0%) |
| Mobile Home / Other | 0 (0.0%) | 106 (100.0%) |
| Total | 43 (25.9%) | 123 (74.1%) |
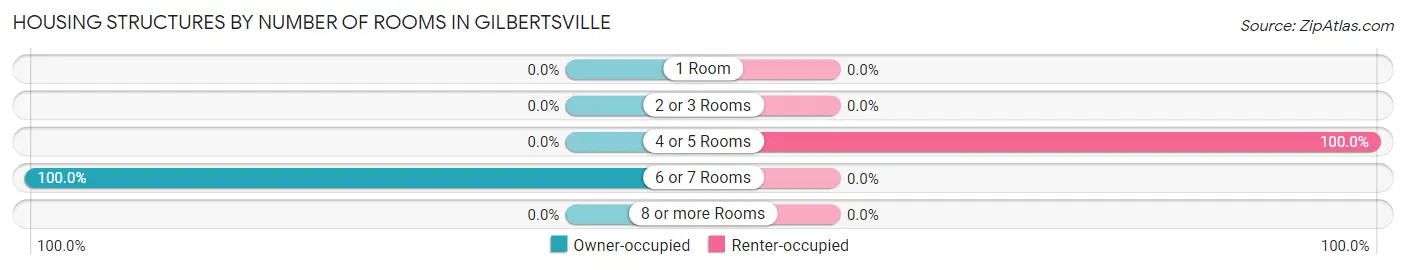
Housing Structures by Number of Rooms in Gilbertsville
| Number of Rooms | Owner-occupied | Renter-occupied |
| 1 Room | 0 (0.0%) | 0 (0.0%) |
| 2 or 3 Rooms | 0 (0.0%) | 0 (0.0%) |
| 4 or 5 Rooms | 0 (0.0%) | 123 (100.0%) |
| 6 or 7 Rooms | 43 (100.0%) | 0 (0.0%) |
| 8 or more Rooms | 0 (0.0%) | 0 (0.0%) |
| Total | 43 (100.0%) | 123 (100.0%) |
Housing Structure by Heating Type in Gilbertsville
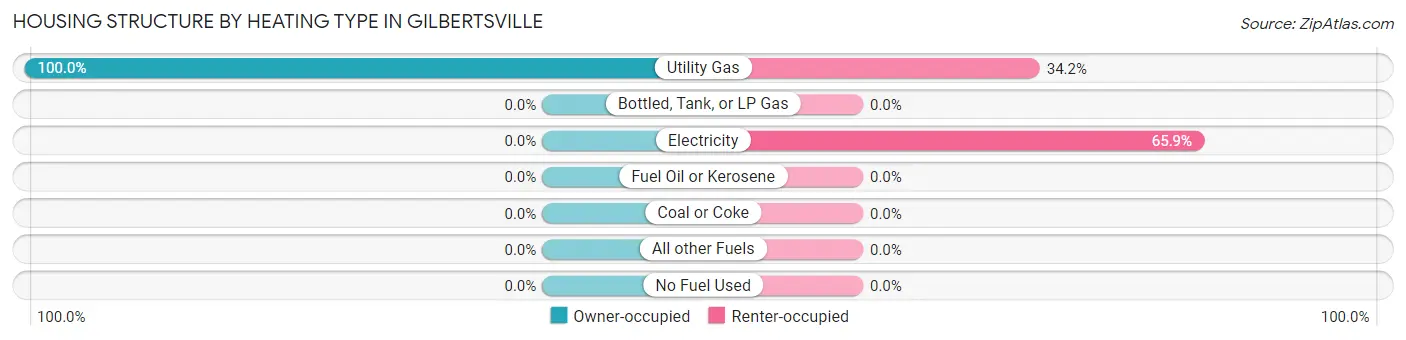
| Heating Type | Owner-occupied | Renter-occupied |
| Utility Gas | 43 (100.0%) | 42 (34.2%) |
| Bottled, Tank, or LP Gas | 0 (0.0%) | 0 (0.0%) |
| Electricity | 0 (0.0%) | 81 (65.8%) |
| Fuel Oil or Kerosene | 0 (0.0%) | 0 (0.0%) |
| Coal or Coke | 0 (0.0%) | 0 (0.0%) |
| All other Fuels | 0 (0.0%) | 0 (0.0%) |
| No Fuel Used | 0 (0.0%) | 0 (0.0%) |
| Total | 43 (100.0%) | 123 (100.0%) |
Household Vehicle Usage in Gilbertsville
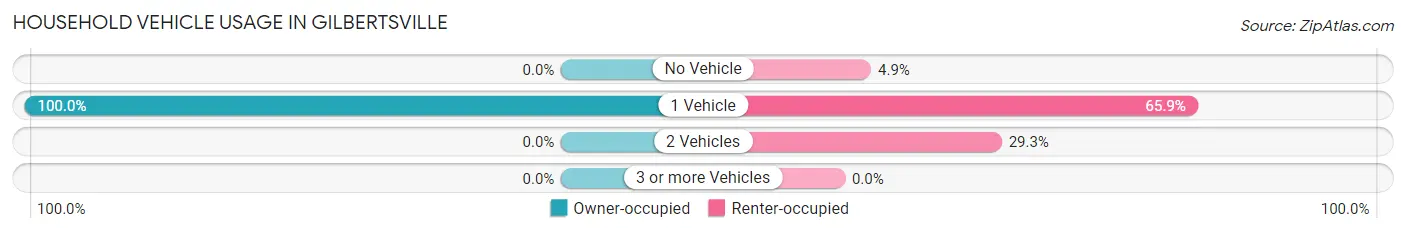
| Vehicles per Household | Owner-occupied | Renter-occupied |
| No Vehicle | 0 (0.0%) | 6 (4.9%) |
| 1 Vehicle | 43 (100.0%) | 81 (65.8%) |
| 2 Vehicles | 0 (0.0%) | 36 (29.3%) |
| 3 or more Vehicles | 0 (0.0%) | 0 (0.0%) |
| Total | 43 (100.0%) | 123 (100.0%) |
Real Estate & Mortgages in Gilbertsville
Real Estate and Mortgage Overview in Gilbertsville
| Characteristic | Without Mortgage | With Mortgage |
| Housing Units | 0 | 43 |
| Median Property Value | - | - |
| Median Household Income | - | - |
| Monthly Housing Costs | - | - |
| Real Estate Taxes | - | - |
Property Value by Mortgage Status in Gilbertsville
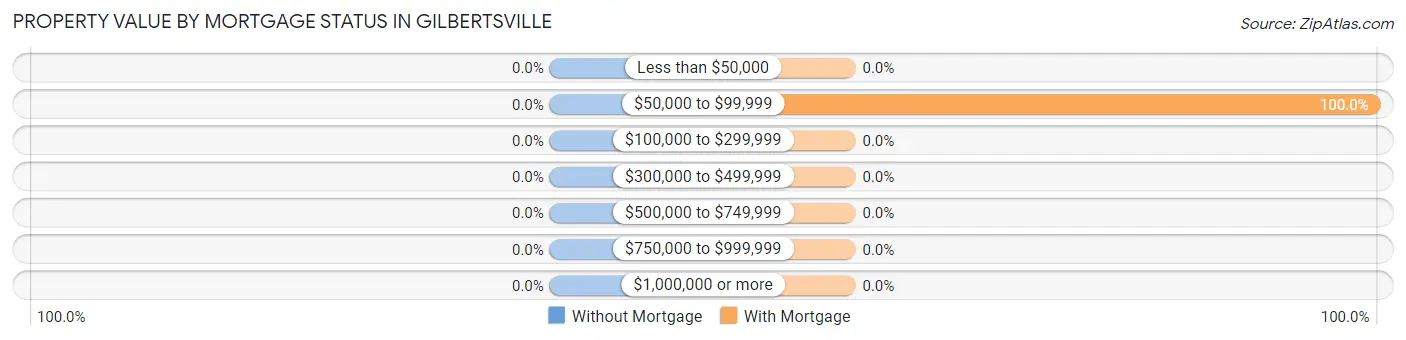
| Property Value | Without Mortgage | With Mortgage |
| Less than $50,000 | 0 (0.0%) | 0 (0.0%) |
| $50,000 to $99,999 | 0 (0.0%) | 43 (100.0%) |
| $100,000 to $299,999 | 0 (0.0%) | 0 (0.0%) |
| $300,000 to $499,999 | 0 (0.0%) | 0 (0.0%) |
| $500,000 to $749,999 | 0 (0.0%) | 0 (0.0%) |
| $750,000 to $999,999 | 0 (0.0%) | 0 (0.0%) |
| $1,000,000 or more | 0 (0.0%) | 0 (0.0%) |
| Total | 0 (0.0%) | 43 (100.0%) |
Household Income by Mortgage Status in Gilbertsville
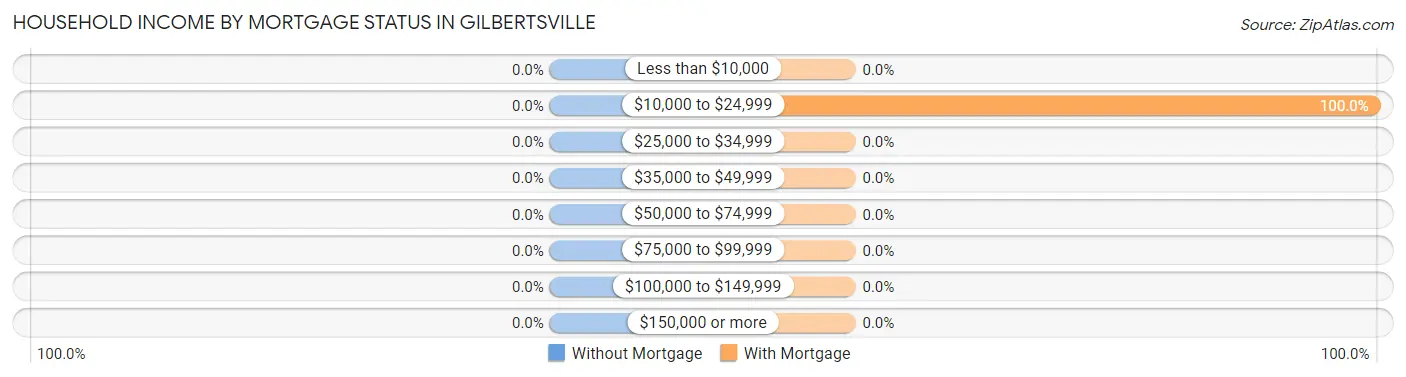
| Household Income | Without Mortgage | With Mortgage |
| Less than $10,000 | 0 (0.0%) | 0 (0.0%) |
| $10,000 to $24,999 | 0 (0.0%) | 43 (100.0%) |
| $25,000 to $34,999 | 0 (0.0%) | 0 (0.0%) |
| $35,000 to $49,999 | 0 (0.0%) | 0 (0.0%) |
| $50,000 to $74,999 | 0 (0.0%) | 0 (0.0%) |
| $75,000 to $99,999 | 0 (0.0%) | 0 (0.0%) |
| $100,000 to $149,999 | 0 (0.0%) | 0 (0.0%) |
| $150,000 or more | 0 (0.0%) | 0 (0.0%) |
| Total | 0 (0.0%) | 43 (100.0%) |
Property Value to Household Income Ratio in Gilbertsville
| Value-to-Income Ratio | Without Mortgage | With Mortgage |
| Less than 2.0x | 0 (0.0%) | 0 (0.0%) |
| 2.0x to 2.9x | 0 (0.0%) | 0 (0.0%) |
| 3.0x to 3.9x | 0 (0.0%) | 0 (0.0%) |
| 4.0x or more | 0 (0.0%) | 0 (0.0%) |
| Total | 0 (0.0%) | 43 (100.0%) |
Real Estate Taxes by Mortgage Status in Gilbertsville
| Property Taxes | Without Mortgage | With Mortgage |
| Less than $800 | 0 (0.0%) | 0 (0.0%) |
| $800 to $1,499 | 0 (0.0%) | 0 (0.0%) |
| $800 to $1,499 | 0 (0.0%) | 43 (100.0%) |
| Total | 0 (0.0%) | 43 (100.0%) |
Health & Disability in Gilbertsville
Health Insurance Coverage by Age in Gilbertsville
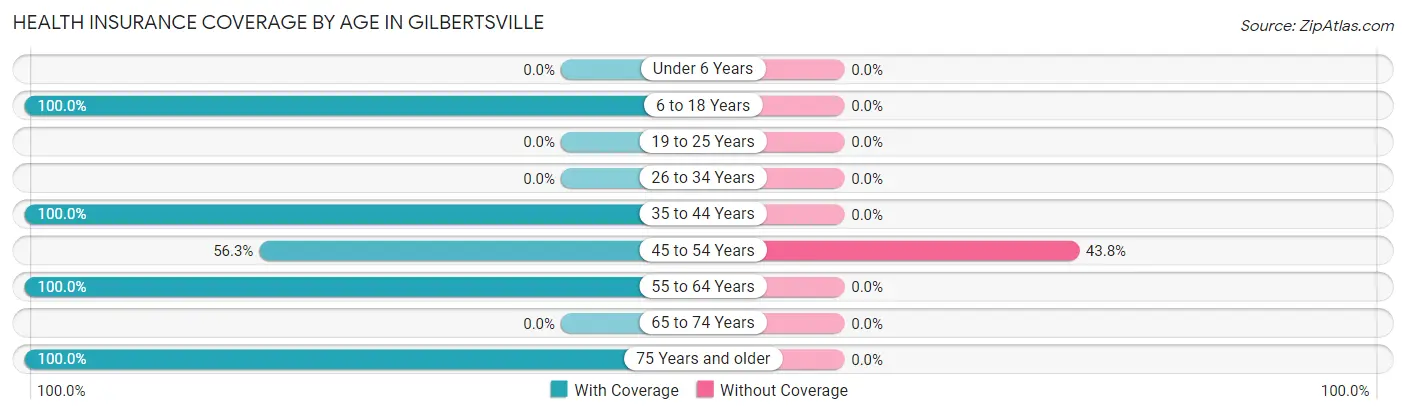
| Age Bracket | With Coverage | Without Coverage |
| Under 6 Years | 0 (0.0%) | 0 (0.0%) |
| 6 to 18 Years | 6 (100.0%) | 0 (0.0%) |
| 19 to 25 Years | 0 (0.0%) | 0 (0.0%) |
| 26 to 34 Years | 0 (0.0%) | 0 (0.0%) |
| 35 to 44 Years | 6 (100.0%) | 0 (0.0%) |
| 45 to 54 Years | 117 (56.2%) | 91 (43.8%) |
| 55 to 64 Years | 6 (100.0%) | 0 (0.0%) |
| 65 to 74 Years | 0 (0.0%) | 0 (0.0%) |
| 75 Years and older | 19 (100.0%) | 0 (0.0%) |
| Total | 154 (62.9%) | 91 (37.1%) |
Health Insurance Coverage by Citizenship Status in Gilbertsville
| Citizenship Status | With Coverage | Without Coverage |
| Native Born | 0 (0.0%) | 0 (0.0%) |
| Foreign Born, Citizen | 6 (100.0%) | 0 (0.0%) |
| Foreign Born, not a Citizen | 0 (0.0%) | 0 (0.0%) |
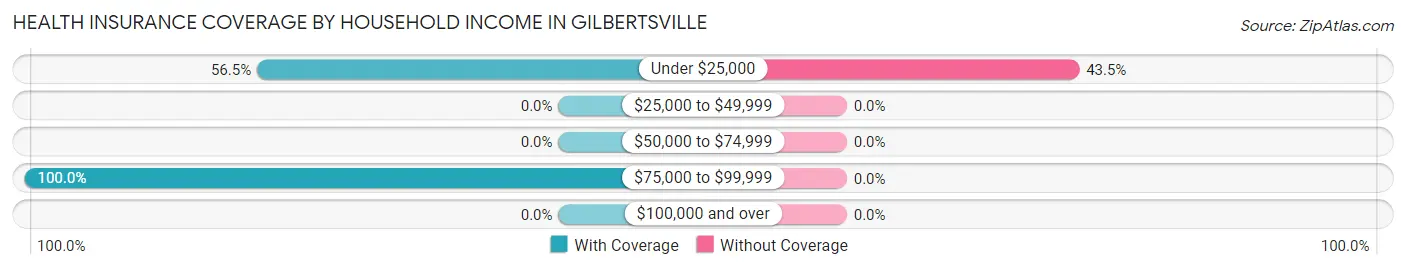
Health Insurance Coverage by Household Income in Gilbertsville
| Household Income | With Coverage | Without Coverage |
| Under $25,000 | 118 (56.5%) | 91 (43.5%) |
| $25,000 to $49,999 | 0 (0.0%) | 0 (0.0%) |
| $50,000 to $74,999 | 0 (0.0%) | 0 (0.0%) |
| $75,000 to $99,999 | 36 (100.0%) | 0 (0.0%) |
| $100,000 and over | 0 (0.0%) | 0 (0.0%) |
Public vs Private Health Insurance Coverage by Age in Gilbertsville
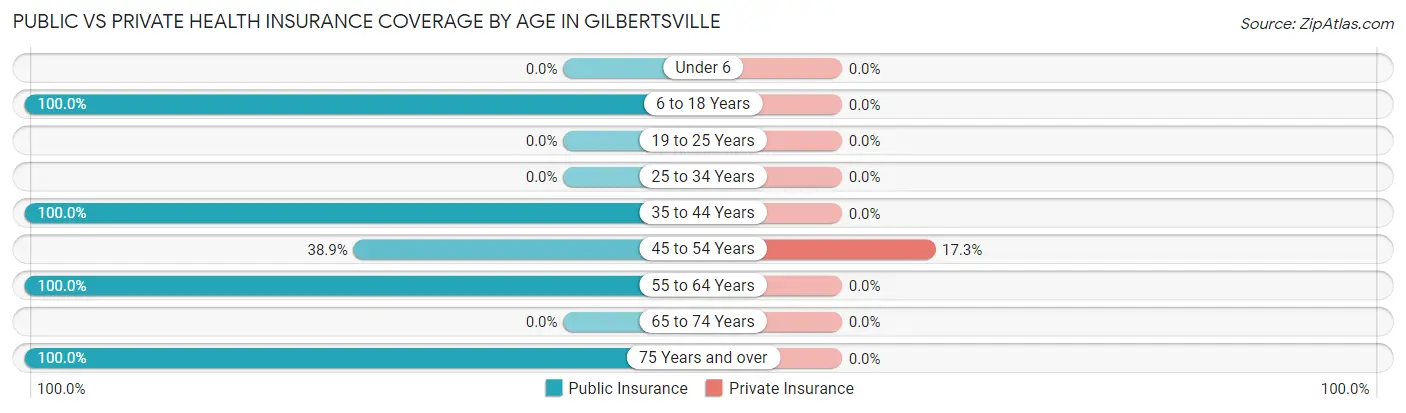
| Age Bracket | Public Insurance | Private Insurance |
| Under 6 | 0 (0.0%) | 0 (0.0%) |
| 6 to 18 Years | 6 (100.0%) | 0 (0.0%) |
| 19 to 25 Years | 0 (0.0%) | 0 (0.0%) |
| 25 to 34 Years | 0 (0.0%) | 0 (0.0%) |
| 35 to 44 Years | 6 (100.0%) | 0 (0.0%) |
| 45 to 54 Years | 81 (38.9%) | 36 (17.3%) |
| 55 to 64 Years | 6 (100.0%) | 0 (0.0%) |
| 65 to 74 Years | 0 (0.0%) | 0 (0.0%) |
| 75 Years and over | 19 (100.0%) | 0 (0.0%) |
| Total | 118 (48.2%) | 36 (14.7%) |
Disability Status by Sex by Age in Gilbertsville
| Age Bracket | Male | Female |
| Under 5 Years | 0 (0.0%) | 0 (0.0%) |
| 5 to 17 Years | 0 (0.0%) | 0 (0.0%) |
| 18 to 34 Years | 0 (0.0%) | 0 (0.0%) |
| 35 to 64 Years | 0 (0.0%) | 0 (0.0%) |
| 65 to 74 Years | 0 (0.0%) | 0 (0.0%) |
| 75 Years and over | 0 (0.0%) | 0 (0.0%) |
Disability Class by Sex by Age in Gilbertsville
Disability Class: Hearing Difficulty
| Age Bracket | Male | Female |
| Under 5 Years | 0 (0.0%) | 0 (0.0%) |
| 5 to 17 Years | 0 (0.0%) | 0 (0.0%) |
| 18 to 34 Years | 0 (0.0%) | 0 (0.0%) |
| 35 to 64 Years | 0 (0.0%) | 0 (0.0%) |
| 65 to 74 Years | 0 (0.0%) | 0 (0.0%) |
| 75 Years and over | 0 (0.0%) | 0 (0.0%) |
Disability Class: Vision Difficulty
| Age Bracket | Male | Female |
| Under 5 Years | 0 (0.0%) | 0 (0.0%) |
| 5 to 17 Years | 0 (0.0%) | 0 (0.0%) |
| 18 to 34 Years | 0 (0.0%) | 0 (0.0%) |
| 35 to 64 Years | 0 (0.0%) | 0 (0.0%) |
| 65 to 74 Years | 0 (0.0%) | 0 (0.0%) |
| 75 Years and over | 0 (0.0%) | 0 (0.0%) |
Disability Class: Cognitive Difficulty
| Age Bracket | Male | Female |
| 5 to 17 Years | 0 (0.0%) | 0 (0.0%) |
| 18 to 34 Years | 0 (0.0%) | 0 (0.0%) |
| 35 to 64 Years | 0 (0.0%) | 0 (0.0%) |
| 65 to 74 Years | 0 (0.0%) | 0 (0.0%) |
| 75 Years and over | 0 (0.0%) | 0 (0.0%) |
Disability Class: Ambulatory Difficulty
| Age Bracket | Male | Female |
| 5 to 17 Years | 0 (0.0%) | 0 (0.0%) |
| 18 to 34 Years | 0 (0.0%) | 0 (0.0%) |
| 35 to 64 Years | 0 (0.0%) | 0 (0.0%) |
| 65 to 74 Years | 0 (0.0%) | 0 (0.0%) |
| 75 Years and over | 0 (0.0%) | 0 (0.0%) |
Disability Class: Self-Care Difficulty
| Age Bracket | Male | Female |
| 5 to 17 Years | 0 (0.0%) | 0 (0.0%) |
| 18 to 34 Years | 0 (0.0%) | 0 (0.0%) |
| 35 to 64 Years | 0 (0.0%) | 0 (0.0%) |
| 65 to 74 Years | 0 (0.0%) | 0 (0.0%) |
| 75 Years and over | 0 (0.0%) | 0 (0.0%) |
Technology Access in Gilbertsville
Computing Device Access in Gilbertsville
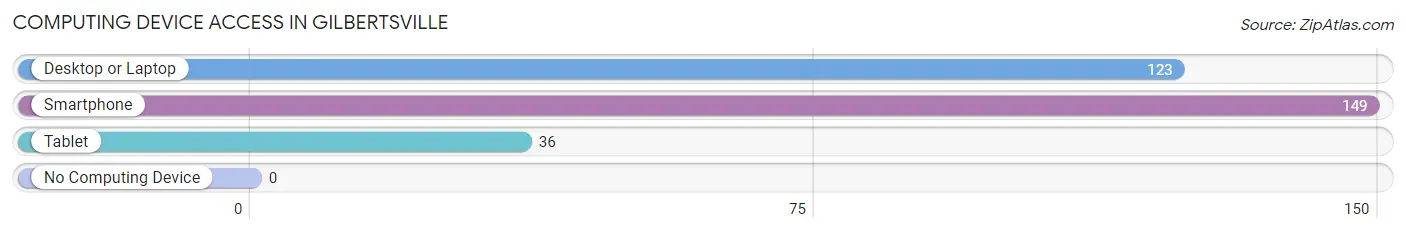
| Device Type | # Households | % Households |
| Desktop or Laptop | 123 | 74.1% |
| Smartphone | 149 | 89.8% |
| Tablet | 36 | 21.7% |
| No Computing Device | 0 | 0.0% |
| Total | 166 | 100.0% |
Internet Access in Gilbertsville
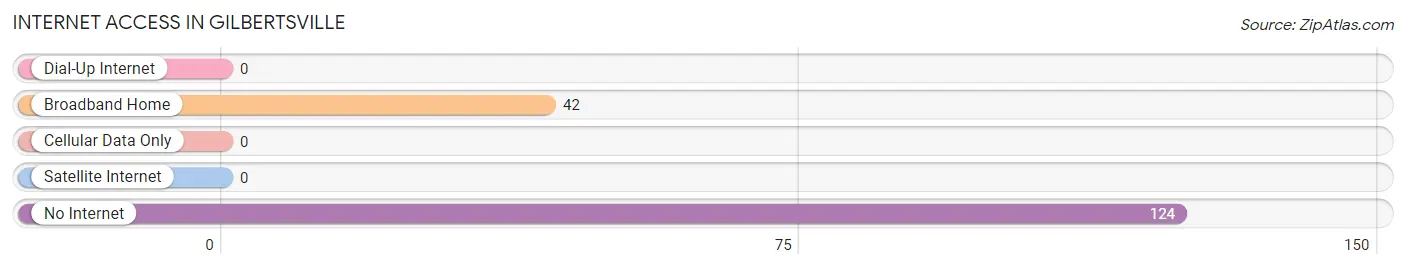
| Internet Type | # Households | % Households |
| Dial-Up Internet | 0 | 0.0% |
| Broadband Home | 42 | 25.3% |
| Cellular Data Only | 0 | 0.0% |
| Satellite Internet | 0 | 0.0% |
| No Internet | 124 | 74.7% |
| Total | 166 | 100.0% |
Gilbertsville Summary
Gilbertsville is a small town located in Marshall County, Kentucky, United States. It is situated on the western shore of Kentucky Lake, a large reservoir created by the Tennessee Valley Authority in the 1930s. The town was founded in 1854 and named after its first postmaster, William Gilbert. As of the 2010 census, the population of Gilbertsville was 1,541.
History
The area around Gilbertsville was first settled in the early 1800s by settlers from Virginia and North Carolina. The town was founded in 1854 and named after its first postmaster, William Gilbert. The town was incorporated in 1872.
In the late 19th century, Gilbertsville was a thriving river port, with steamboats regularly stopping at the town's wharf. The town was also home to a number of businesses, including a sawmill, a gristmill, a cotton gin, and a brickyard.
In the early 20th century, the town's economy shifted to agriculture, with tobacco and corn being the main crops. The town was also home to a number of small businesses, including a general store, a blacksmith shop, and a hotel.
In the 1930s, the Tennessee Valley Authority (TVA) built Kentucky Lake, a large reservoir that flooded much of the surrounding area. The town of Gilbertsville was spared, but many of the surrounding farms and businesses were destroyed.
Geography
Gilbertsville is located in western Marshall County, on the western shore of Kentucky Lake. The town is situated at the intersection of Kentucky Route 80 and Kentucky Route 94.
The town is located in a hilly region of western Kentucky, with the highest point in the area being a hill just south of town, which rises to an elevation of 590 feet (180 m).
Economy
The economy of Gilbertsville is largely based on tourism. The town is home to a number of marinas, campgrounds, and resorts, which attract visitors from all over the region. The town is also home to a number of small businesses, including restaurants, convenience stores, and antique shops.
Demographics
As of the 2010 census, there were 1,541 people, 645 households, and 431 families residing in the town. The population density was 545.3 people per square mile (210.9/km2). There were 745 housing units at an average density of 270.3 per square mile (104.4/km2). The racial makeup of the town was 97.2% White, 0.7% African American, 0.1% Native American, 0.3% Asian, 0.1% Pacific Islander, 0.7% from other races, and 0.9% from two or more races. Hispanic or Latino of any race were 1.3% of the population.
There were 645 households, out of which 28.2% had children under the age of 18 living with them, 48.2% were married couples living together, 12.7% had a female householder with no husband present, and 34.2% were non-families. 30.2% of all households were made up of individuals, and 14.2% had someone living alone who was 65 years of age or older. The average household size was 2.38 and the average family size was 2.94.
In the town, the population was spread out, with 24.2% under the age of 18, 8.2% from 18 to 24, 27.2% from 25 to 44, 24.2% from 45 to 64, and 16.2% who were 65 years of age or older. The median age was 38 years. For every 100 females, there were 91.2 males. For every 100 females age 18 and over, there were 87.2 males.
The median income for a household in the town was $30,000, and the median income for a family was $36,250. Males had a median income of $30,000 versus $20,000 for females. The per capita income for the town was $15,945. About 11.2% of families and 14.2% of the population were below the poverty line, including 19.2% of those under age 18 and 11.2% of those age 65 or over.
Common Questions
What is Per Capita Income in Gilbertsville?
Per Capita income in Gilbertsville is $9,221.
What is Inequality or Gini Index in Gilbertsville?
Inequality or Gini Index in Gilbertsville is 0.72.
What is the Total Population of Gilbertsville?
Total Population of Gilbertsville is 245.
What is the Total Male Population of Gilbertsville?
Total Male Population of Gilbertsville is 196.
What is the Total Female Population of Gilbertsville?
Total Female Population of Gilbertsville is 49.
What is the Ratio of Males per 100 Females in Gilbertsville?
There are 400.00 Males per 100 Females in Gilbertsville.
What is the Ratio of Females per 100 Males in Gilbertsville?
There are 25.00 Females per 100 Males in Gilbertsville.
What is the Median Population Age in Gilbertsville?
Median Population Age in Gilbertsville is 51.0 Years.
What is the Average Family Size in Gilbertsville
Average Family Size in Gilbertsville is 3.0 People.
What is the Average Household Size in Gilbertsville
Average Household Size in Gilbertsville is 1.5 People.
How Large is the Labor Force in Gilbertsville?
There are 127 People in the Labor Forcein in Gilbertsville.
What is the Percentage of People in the Labor Force in Gilbertsville?
53.1% of People are in the Labor Force in Gilbertsville.