Painted Hills, IN Map & Demographics
Painted Hills Map
Painted Hills Overview
$57,086
PER CAPITA INCOME
$89,408
AVG FAMILY INCOME
$89,123
AVG HOUSEHOLD INCOME
0.36
INEQUALITY / GINI INDEX
996
TOTAL POPULATION
514
MALE POPULATION
482
FEMALE POPULATION
106.64
MALES / 100 FEMALES
93.77
FEMALES / 100 MALES
53.0
MEDIAN AGE
2.5
AVG FAMILY SIZE
2.3
AVG HOUSEHOLD SIZE
751
LABOR FORCE [ PEOPLE ]
84.5%
PERCENT IN LABOR FORCE
23.6%
UNEMPLOYMENT RATE
Income in Painted Hills
Income Overview in Painted Hills
Per Capita Income in Painted Hills is $57,086, while median incomes of families and households are $89,408 and $89,123 respectively.
| Characteristic | Number | Measure |
| Per Capita Income | 996 | $57,086 |
| Median Family Income | 391 | $89,408 |
| Mean Family Income | 391 | $109,080 |
| Median Household Income | 426 | $89,123 |
| Mean Household Income | 426 | $108,601 |
| Income Deficit | 391 | $0 |
| Wage / Income Gap (%) | 996 | 0.00% |
| Wage / Income Gap ($) | 996 | 100.00¢ per $1 |
| Gini / Inequality Index | 996 | 0.36 |
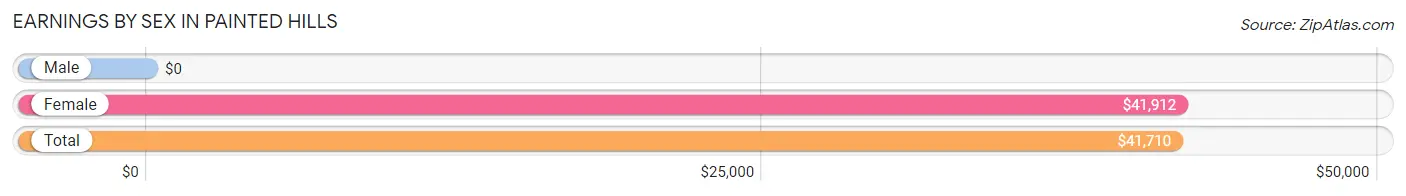
Earnings by Sex in Painted Hills
| Sex | Number | Average Earnings |
| Male | 347 (46.2%) | $0 |
| Female | 404 (53.8%) | $41,912 |
| Total | 751 (100.0%) | $41,710 |
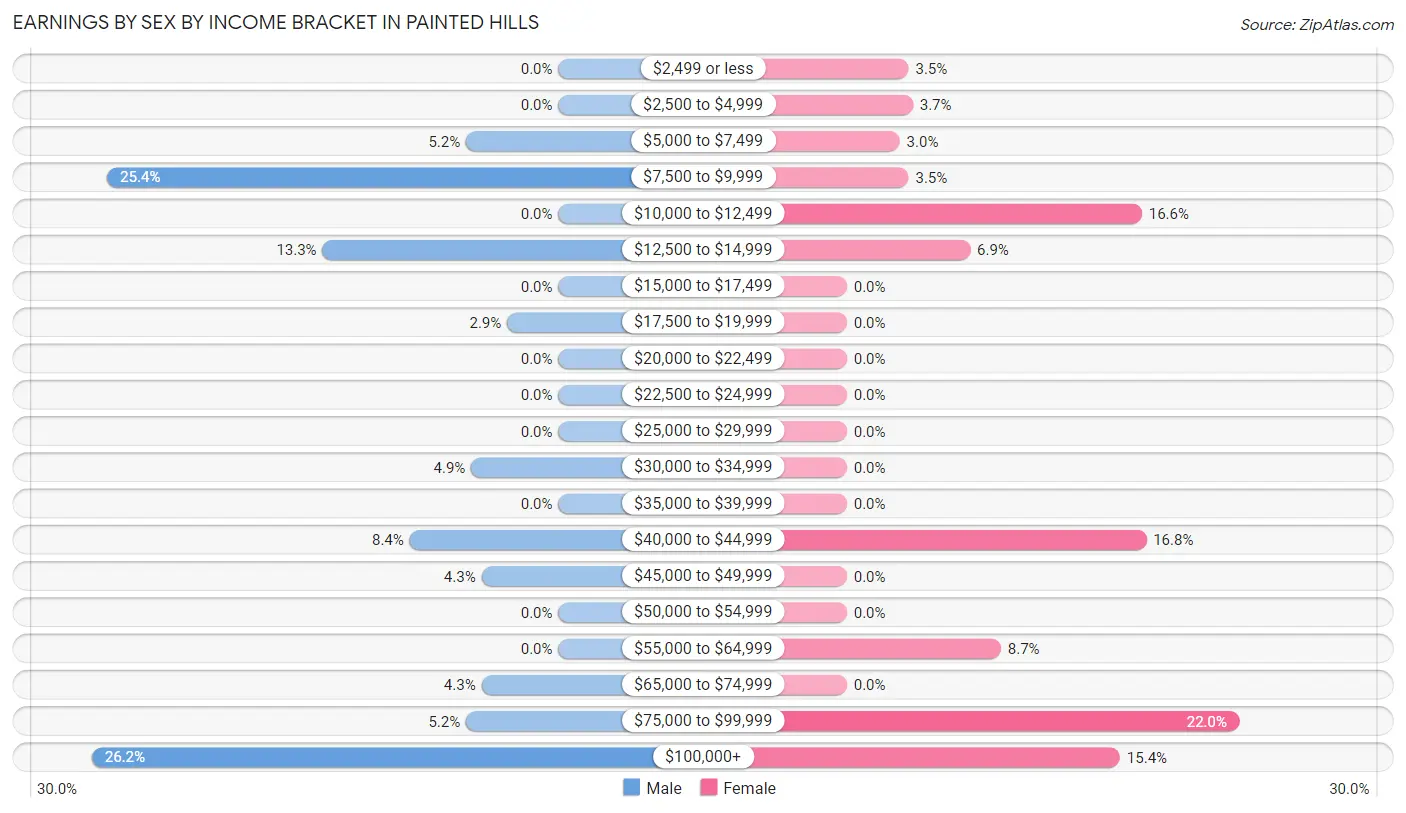
Earnings by Sex by Income Bracket in Painted Hills
The most common earnings brackets in Painted Hills are $100,000+ for men (91 | 26.2%) and $75,000 to $99,999 for women (89 | 22.0%).
| Income | Male | Female |
| $2,499 or less | 0 (0.0%) | 14 (3.5%) |
| $2,500 to $4,999 | 0 (0.0%) | 15 (3.7%) |
| $5,000 to $7,499 | 18 (5.2%) | 12 (3.0%) |
| $7,500 to $9,999 | 88 (25.4%) | 14 (3.5%) |
| $10,000 to $12,499 | 0 (0.0%) | 67 (16.6%) |
| $12,500 to $14,999 | 46 (13.3%) | 28 (6.9%) |
| $15,000 to $17,499 | 0 (0.0%) | 0 (0.0%) |
| $17,500 to $19,999 | 10 (2.9%) | 0 (0.0%) |
| $20,000 to $22,499 | 0 (0.0%) | 0 (0.0%) |
| $22,500 to $24,999 | 0 (0.0%) | 0 (0.0%) |
| $25,000 to $29,999 | 0 (0.0%) | 0 (0.0%) |
| $30,000 to $34,999 | 17 (4.9%) | 0 (0.0%) |
| $35,000 to $39,999 | 0 (0.0%) | 0 (0.0%) |
| $40,000 to $44,999 | 29 (8.4%) | 68 (16.8%) |
| $45,000 to $49,999 | 15 (4.3%) | 0 (0.0%) |
| $50,000 to $54,999 | 0 (0.0%) | 0 (0.0%) |
| $55,000 to $64,999 | 0 (0.0%) | 35 (8.7%) |
| $65,000 to $74,999 | 15 (4.3%) | 0 (0.0%) |
| $75,000 to $99,999 | 18 (5.2%) | 89 (22.0%) |
| $100,000+ | 91 (26.2%) | 62 (15.3%) |
| Total | 347 (100.0%) | 404 (100.0%) |
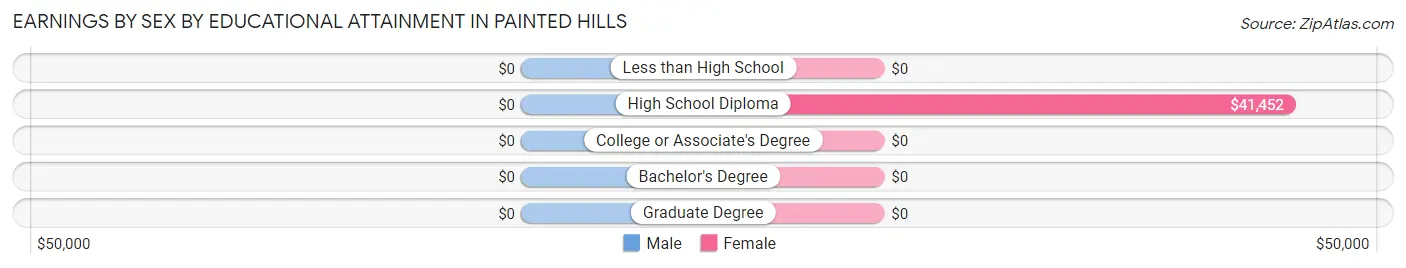
Earnings by Sex by Educational Attainment in Painted Hills
| Educational Attainment | Male Income | Female Income |
| Less than High School | - | - |
| High School Diploma | - | - |
| College or Associate's Degree | - | - |
| Bachelor's Degree | - | - |
| Graduate Degree | - | - |
| Total | - | - |
Family Income in Painted Hills
Family Income Brackets in Painted Hills
According to the Painted Hills family income data, there are 105 families falling into the $75,000 to $99,999 income range, which is the most common income bracket and makes up 26.9% of all families.
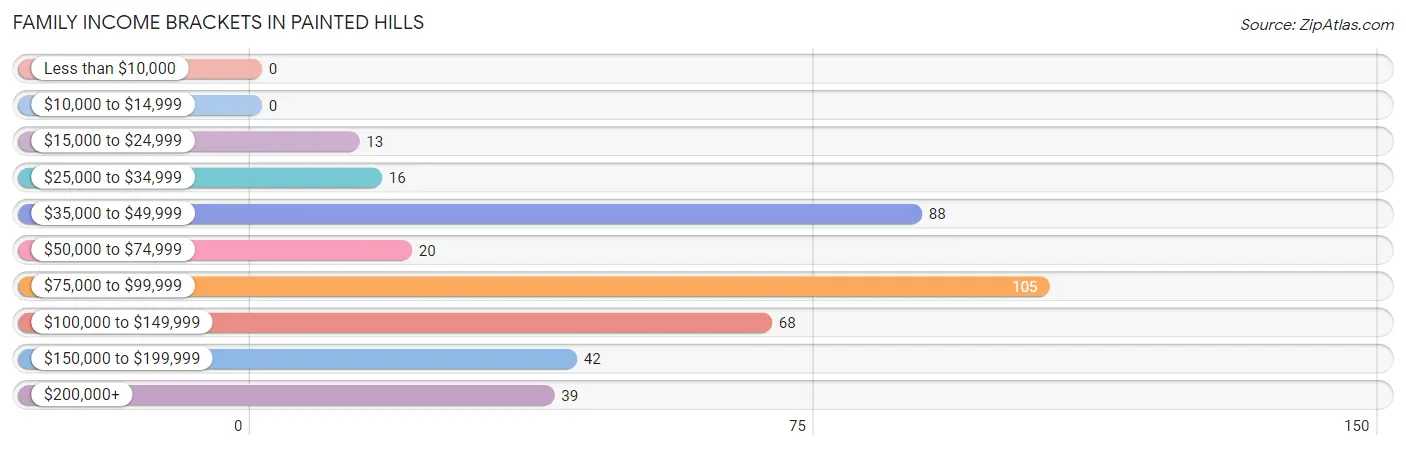
| Income Bracket | # Families | % Families |
| Less than $10,000 | 0 | 0.0% |
| $10,000 to $14,999 | 0 | 0.0% |
| $15,000 to $24,999 | 13 | 3.3% |
| $25,000 to $34,999 | 16 | 4.1% |
| $35,000 to $49,999 | 88 | 22.5% |
| $50,000 to $74,999 | 20 | 5.1% |
| $75,000 to $99,999 | 105 | 26.9% |
| $100,000 to $149,999 | 68 | 17.4% |
| $150,000 to $199,999 | 42 | 10.7% |
| $200,000+ | 39 | 10.0% |
Family Income by Famaliy Size in Painted Hills
2-person families (289 | 73.9%) account for the highest median family income in Painted Hills with $98,125 per family, while 2-person families (289 | 73.9%) have the highest median income of $49,062 per family member.
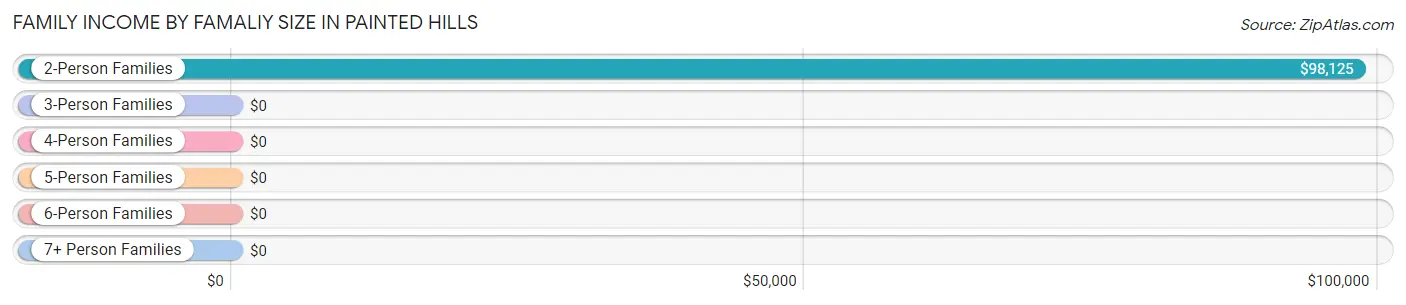
| Income Bracket | # Families | Median Income |
| 2-Person Families | 289 (73.9%) | $98,125 |
| 3-Person Families | 69 (17.6%) | $0 |
| 4-Person Families | 33 (8.4%) | $0 |
| 5-Person Families | 0 (0.0%) | $0 |
| 6-Person Families | 0 (0.0%) | $0 |
| 7+ Person Families | 0 (0.0%) | $0 |
| Total | 391 (100.0%) | $89,408 |
Family Income by Number of Earners in Painted Hills
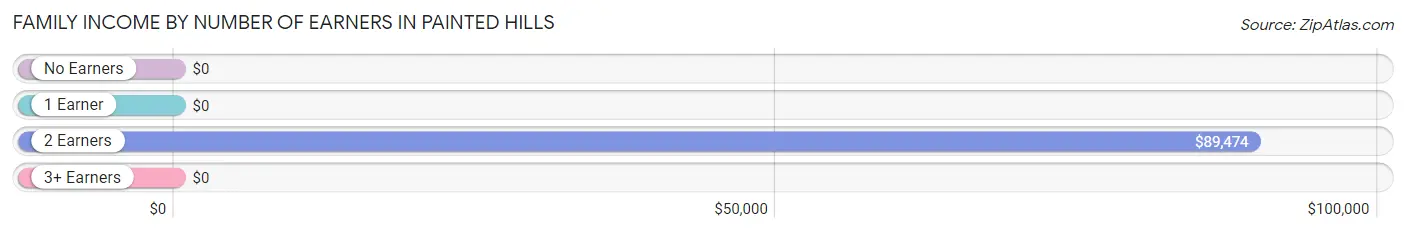
| Number of Earners | # Families | Median Income |
| No Earners | 8 (2.1%) | $0 |
| 1 Earner | 37 (9.5%) | $0 |
| 2 Earners | 346 (88.5%) | $89,474 |
| 3+ Earners | 0 (0.0%) | $0 |
| Total | 391 (100.0%) | $89,408 |
Household Income in Painted Hills
Household Income Brackets in Painted Hills
With 112 households falling in the category, the $35,000 to $49,999 income range is the most frequent in Painted Hills, accounting for 26.3% of all households.
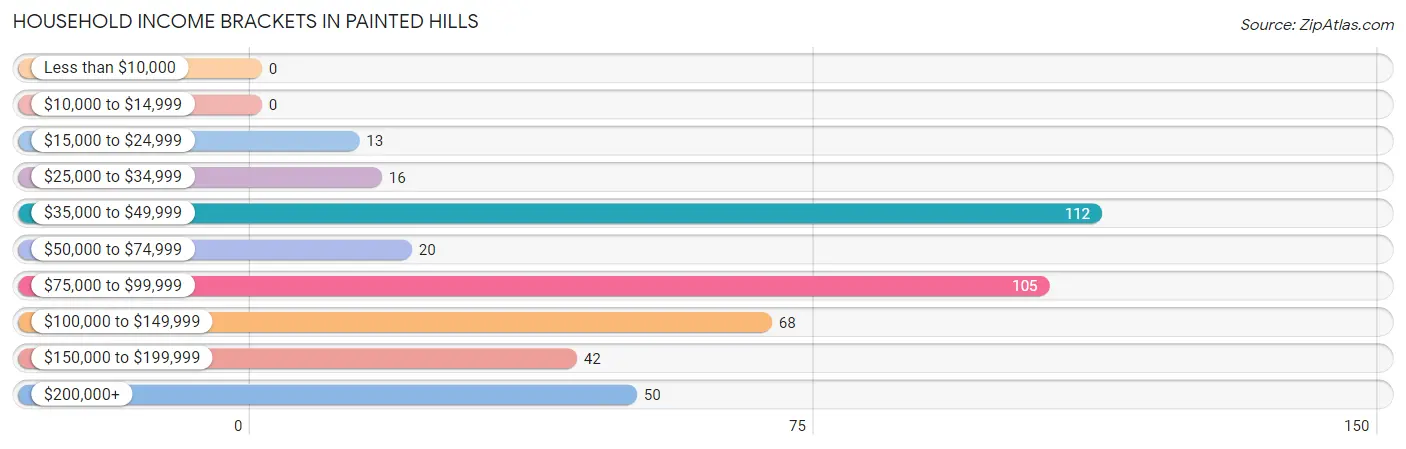
| Income Bracket | # Households | % Households |
| Less than $10,000 | 0 | 0.0% |
| $10,000 to $14,999 | 0 | 0.0% |
| $15,000 to $24,999 | 13 | 3.1% |
| $25,000 to $34,999 | 16 | 3.8% |
| $35,000 to $49,999 | 112 | 26.3% |
| $50,000 to $74,999 | 20 | 4.7% |
| $75,000 to $99,999 | 105 | 24.6% |
| $100,000 to $149,999 | 68 | 16.0% |
| $150,000 to $199,999 | 42 | 9.9% |
| $200,000+ | 50 | 11.7% |
Household Income by Householder Age in Painted Hills
The median household income in Painted Hills is $89,123, with the highest median household income of $89,715 found in the 45 to 64 years age bracket for the primary householder. A total of 333 households (78.2%) fall into this category.
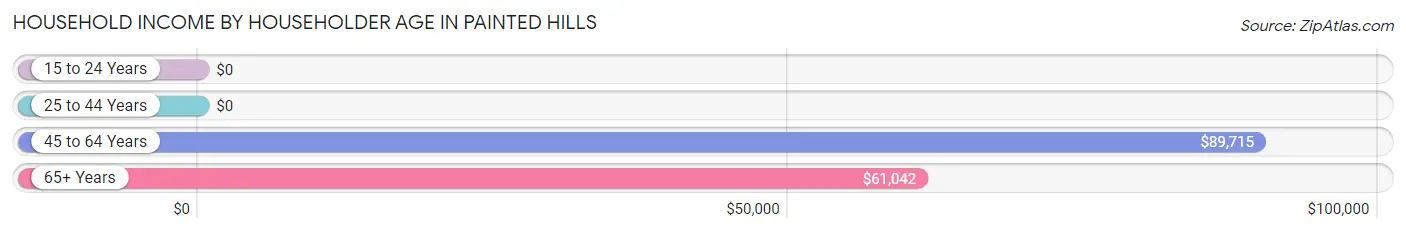
| Income Bracket | # Households | Median Income |
| 15 to 24 Years | 0 (0.0%) | $0 |
| 25 to 44 Years | 33 (7.7%) | $0 |
| 45 to 64 Years | 333 (78.2%) | $89,715 |
| 65+ Years | 60 (14.1%) | $61,042 |
| Total | 426 (100.0%) | $89,123 |
Poverty in Painted Hills
Income Below Poverty by Sex and Age in Painted Hills
With 0.6% poverty level for males and 2.7% for females among the residents of Painted Hills, 18 to 24 year old males and 55 to 64 year old females are the most vulnerable to poverty, with 3 males (100.0%) and 13 females (11.4%) in their respective age groups living below the poverty level.
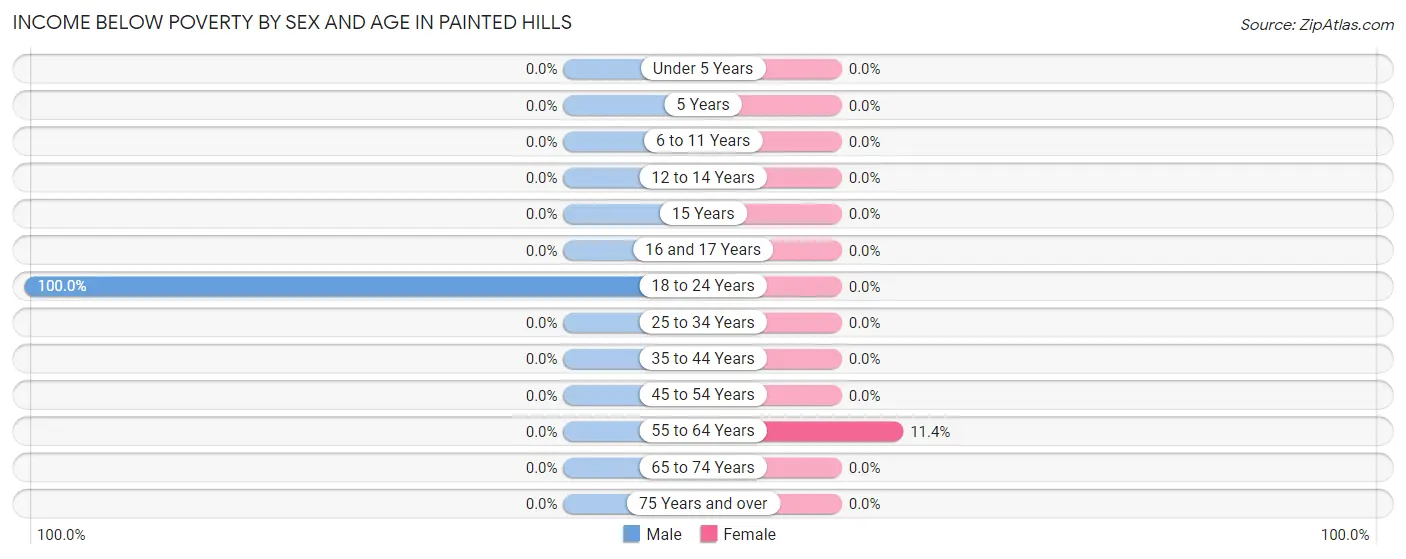
| Age Bracket | Male | Female |
| Under 5 Years | 0 (0.0%) | 0 (0.0%) |
| 5 Years | 0 (0.0%) | 0 (0.0%) |
| 6 to 11 Years | 0 (0.0%) | 0 (0.0%) |
| 12 to 14 Years | 0 (0.0%) | 0 (0.0%) |
| 15 Years | 0 (0.0%) | 0 (0.0%) |
| 16 and 17 Years | 0 (0.0%) | 0 (0.0%) |
| 18 to 24 Years | 3 (100.0%) | 0 (0.0%) |
| 25 to 34 Years | 0 (0.0%) | 0 (0.0%) |
| 35 to 44 Years | 0 (0.0%) | 0 (0.0%) |
| 45 to 54 Years | 0 (0.0%) | 0 (0.0%) |
| 55 to 64 Years | 0 (0.0%) | 13 (11.4%) |
| 65 to 74 Years | 0 (0.0%) | 0 (0.0%) |
| 75 Years and over | 0 (0.0%) | 0 (0.0%) |
| Total | 3 (0.6%) | 13 (2.7%) |
Income Above Poverty by Sex and Age in Painted Hills
According to the poverty statistics in Painted Hills, males aged under 5 years and females aged 5 years are the age groups that are most secure financially, with 100.0% of males and 100.0% of females in these age groups living above the poverty line.
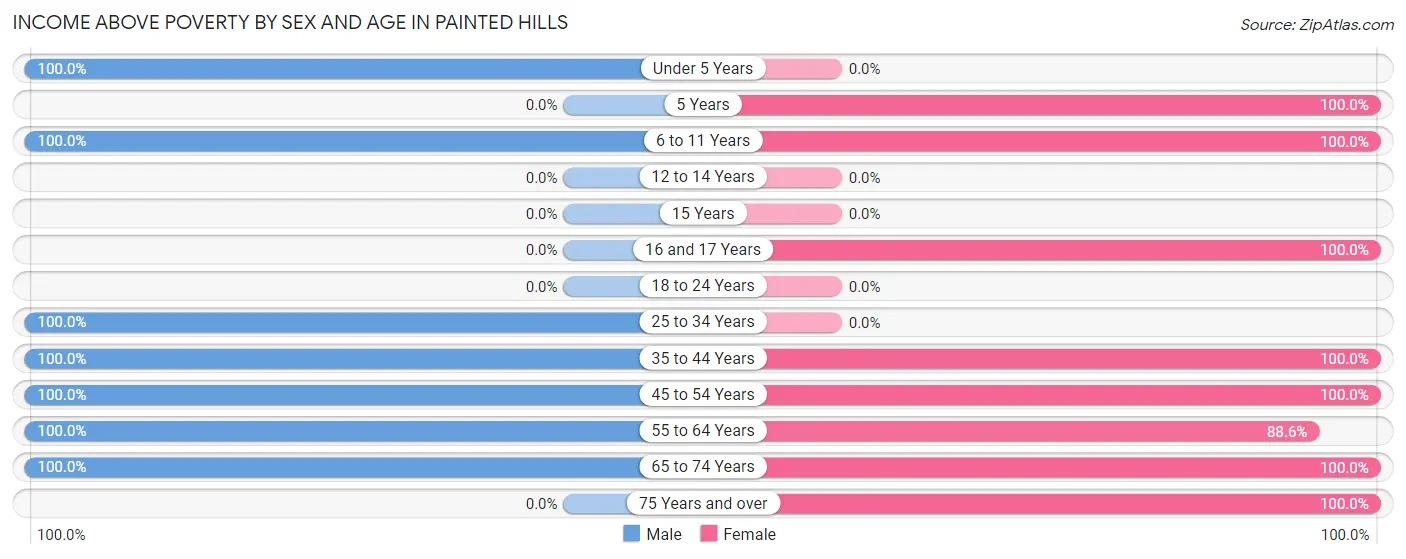
| Age Bracket | Male | Female |
| Under 5 Years | 15 (100.0%) | 0 (0.0%) |
| 5 Years | 0 (0.0%) | 23 (100.0%) |
| 6 to 11 Years | 52 (100.0%) | 17 (100.0%) |
| 12 to 14 Years | 0 (0.0%) | 0 (0.0%) |
| 15 Years | 0 (0.0%) | 0 (0.0%) |
| 16 and 17 Years | 0 (0.0%) | 67 (100.0%) |
| 18 to 24 Years | 0 (0.0%) | 0 (0.0%) |
| 25 to 34 Years | 76 (100.0%) | 0 (0.0%) |
| 35 to 44 Years | 32 (100.0%) | 33 (100.0%) |
| 45 to 54 Years | 192 (100.0%) | 155 (100.0%) |
| 55 to 64 Years | 105 (100.0%) | 101 (88.6%) |
| 65 to 74 Years | 39 (100.0%) | 58 (100.0%) |
| 75 Years and over | 0 (0.0%) | 15 (100.0%) |
| Total | 511 (99.4%) | 469 (97.3%) |
Income Below Poverty Among Married-Couple Families in Painted Hills
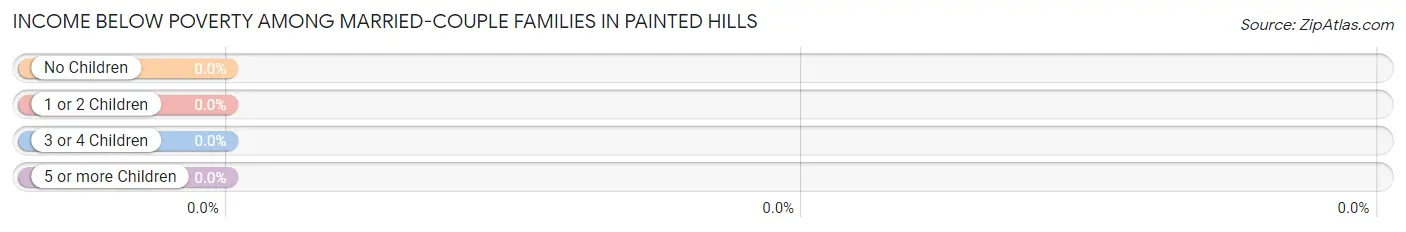
| Children | Above Poverty | Below Poverty |
| No Children | 276 (100.0%) | 0 (0.0%) |
| 1 or 2 Children | 33 (100.0%) | 0 (0.0%) |
| 3 or 4 Children | 0 (0.0%) | 0 (0.0%) |
| 5 or more Children | 0 (0.0%) | 0 (0.0%) |
| Total | 309 (100.0%) | 0 (0.0%) |
Income Below Poverty Among Single-Parent Households in Painted Hills
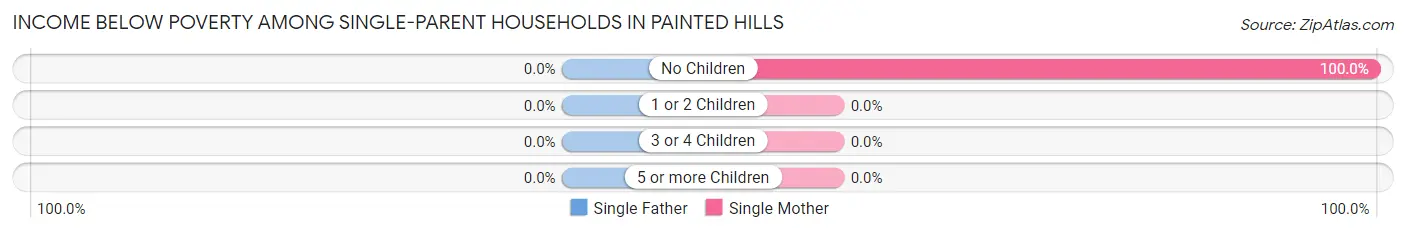
| Children | Single Father | Single Mother |
| No Children | 0 (0.0%) | 13 (100.0%) |
| 1 or 2 Children | 0 (0.0%) | 0 (0.0%) |
| 3 or 4 Children | 0 (0.0%) | 0 (0.0%) |
| 5 or more Children | 0 (0.0%) | 0 (0.0%) |
| Total | 0 (0.0%) | 13 (15.9%) |
Income Below Poverty Among Married-Couple vs Single-Parent Households in Painted Hills
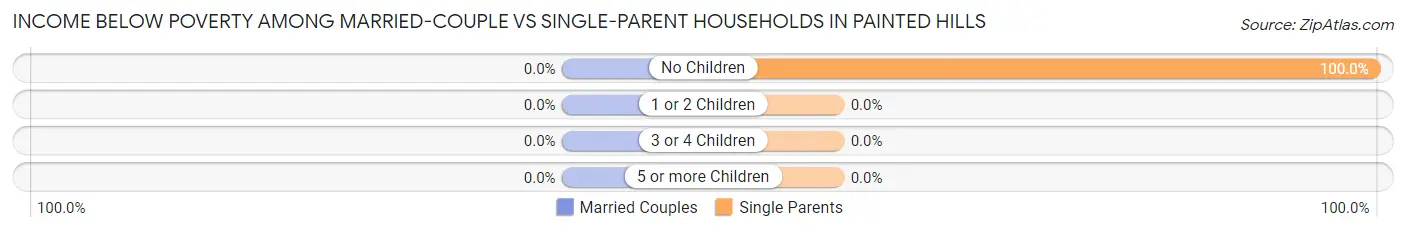
| Children | Married-Couple Families | Single-Parent Households |
| No Children | 0 (0.0%) | 13 (100.0%) |
| 1 or 2 Children | 0 (0.0%) | 0 (0.0%) |
| 3 or 4 Children | 0 (0.0%) | 0 (0.0%) |
| 5 or more Children | 0 (0.0%) | 0 (0.0%) |
| Total | 0 (0.0%) | 13 (15.9%) |
Race in Painted Hills
The most populous races in Painted Hills are White / Caucasian (924 | 92.8%), Two or more Races (69 | 6.9%), and Hispanic or Latino (61 | 6.1%).
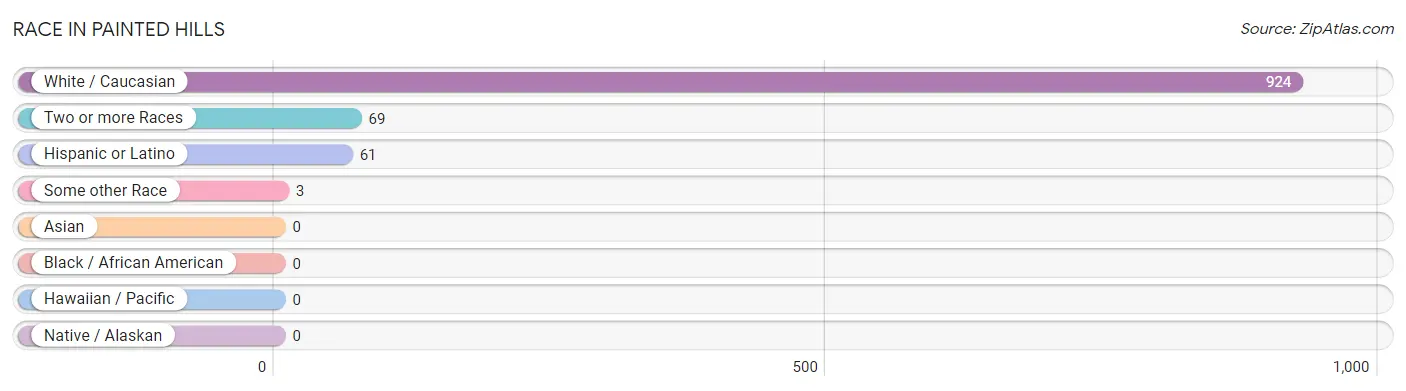
| Race | # Population | % Population |
| Asian | 0 | 0.0% |
| Black / African American | 0 | 0.0% |
| Hawaiian / Pacific | 0 | 0.0% |
| Hispanic or Latino | 61 | 6.1% |
| Native / Alaskan | 0 | 0.0% |
| White / Caucasian | 924 | 92.8% |
| Two or more Races | 69 | 6.9% |
| Some other Race | 3 | 0.3% |
| Total | 996 | 100.0% |
Ancestry in Painted Hills
The most populous ancestries reported in Painted Hills are German (104 | 10.4%), English (98 | 9.8%), Irish (61 | 6.1%), Italian (58 | 5.8%), and Mexican (58 | 5.8%), together accounting for 38.0% of all Painted Hills residents.
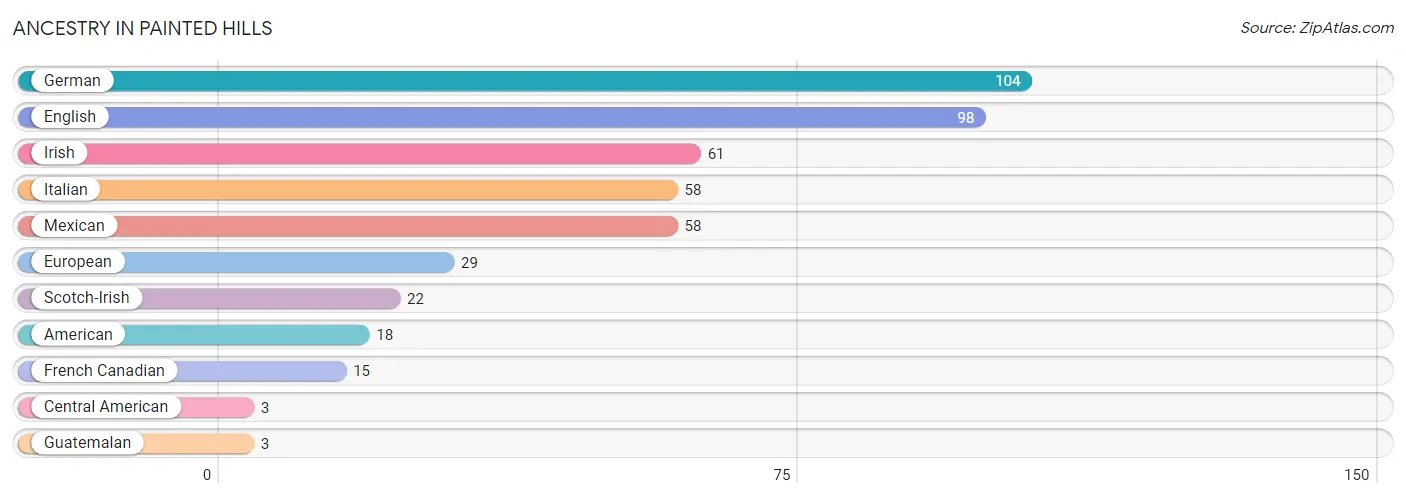
| Ancestry | # Population | % Population |
| American | 18 | 1.8% |
| Central American | 3 | 0.3% |
| English | 98 | 9.8% |
| European | 29 | 2.9% |
| French Canadian | 15 | 1.5% |
| German | 104 | 10.4% |
| Guatemalan | 3 | 0.3% |
| Irish | 61 | 6.1% |
| Italian | 58 | 5.8% |
| Mexican | 58 | 5.8% |
| Scotch-Irish | 22 | 2.2% | View All 11 Rows |
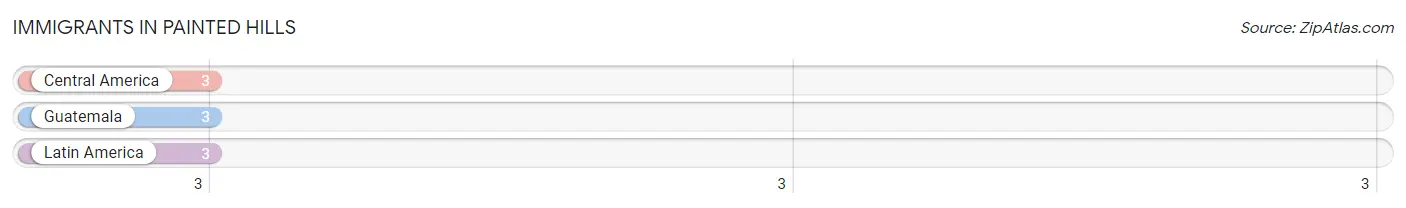
Immigrants in Painted Hills
The most numerous immigrant groups reported in Painted Hills came from Central America (3 | 0.3%), Guatemala (3 | 0.3%), and Latin America (3 | 0.3%), together accounting for 0.9% of all Painted Hills residents.
| Immigration Origin | # Population | % Population |
| Central America | 3 | 0.3% |
| Guatemala | 3 | 0.3% |
| Latin America | 3 | 0.3% | View All 3 Rows |
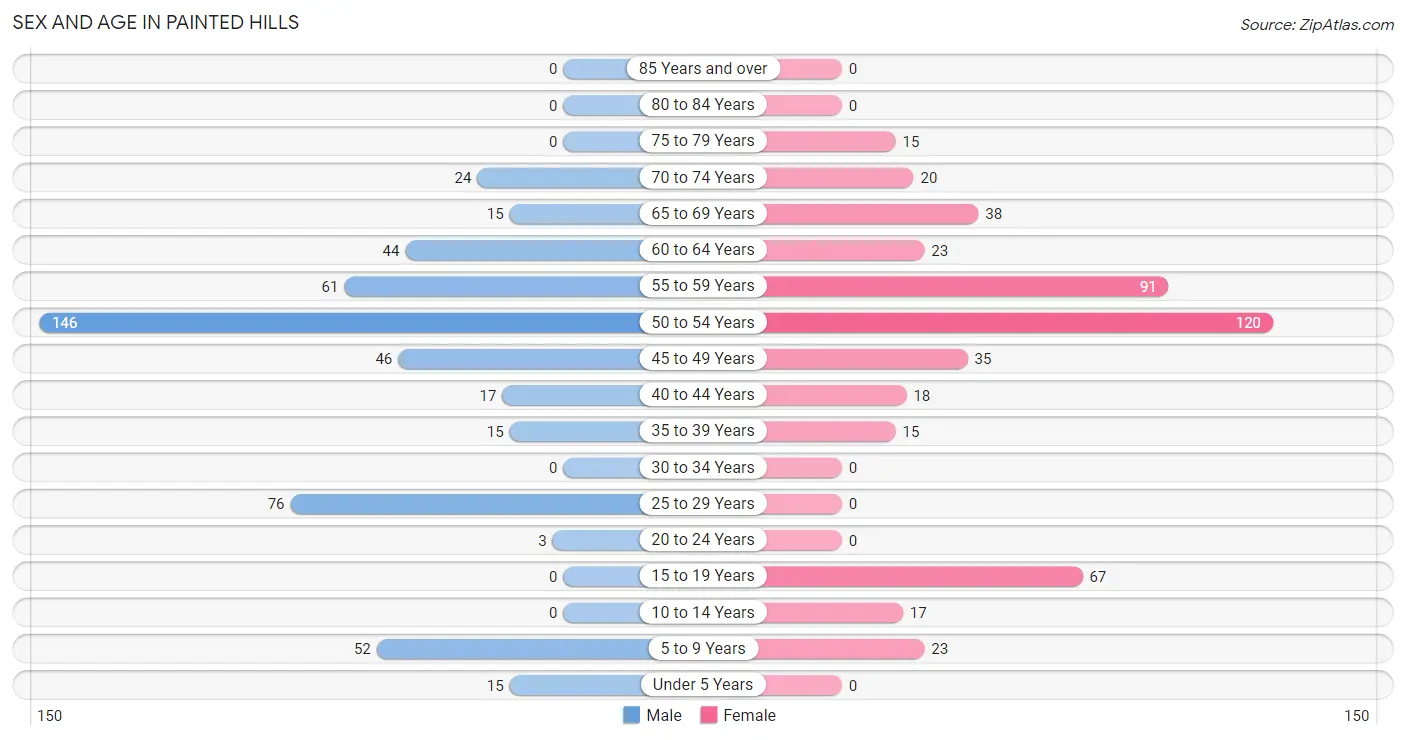
Sex and Age in Painted Hills
Sex and Age in Painted Hills
The most populous age groups in Painted Hills are 50 to 54 Years (146 | 28.4%) for men and 50 to 54 Years (120 | 24.9%) for women.
| Age Bracket | Male | Female |
| Under 5 Years | 15 (2.9%) | 0 (0.0%) |
| 5 to 9 Years | 52 (10.1%) | 23 (4.8%) |
| 10 to 14 Years | 0 (0.0%) | 17 (3.5%) |
| 15 to 19 Years | 0 (0.0%) | 67 (13.9%) |
| 20 to 24 Years | 3 (0.6%) | 0 (0.0%) |
| 25 to 29 Years | 76 (14.8%) | 0 (0.0%) |
| 30 to 34 Years | 0 (0.0%) | 0 (0.0%) |
| 35 to 39 Years | 15 (2.9%) | 15 (3.1%) |
| 40 to 44 Years | 17 (3.3%) | 18 (3.7%) |
| 45 to 49 Years | 46 (8.9%) | 35 (7.3%) |
| 50 to 54 Years | 146 (28.4%) | 120 (24.9%) |
| 55 to 59 Years | 61 (11.9%) | 91 (18.9%) |
| 60 to 64 Years | 44 (8.6%) | 23 (4.8%) |
| 65 to 69 Years | 15 (2.9%) | 38 (7.9%) |
| 70 to 74 Years | 24 (4.7%) | 20 (4.2%) |
| 75 to 79 Years | 0 (0.0%) | 15 (3.1%) |
| 80 to 84 Years | 0 (0.0%) | 0 (0.0%) |
| 85 Years and over | 0 (0.0%) | 0 (0.0%) |
| Total | 514 (100.0%) | 482 (100.0%) |
Families and Households in Painted Hills
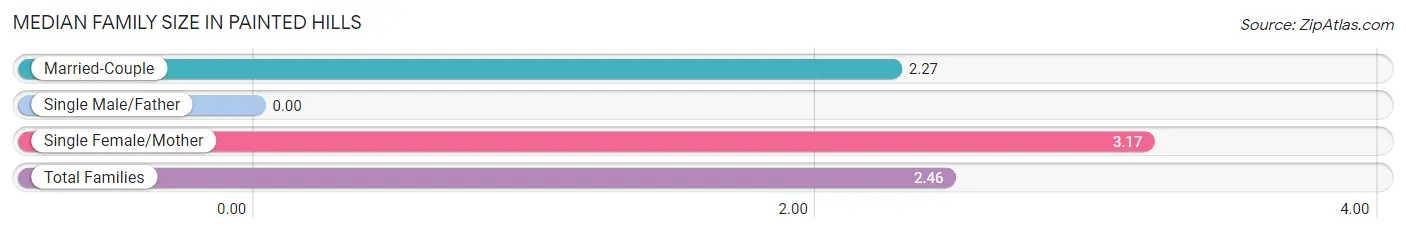
Median Family Size in Painted Hills
| Family Type | # Families | Family Size |
| Married-Couple | 309 (79.0%) | 2.27 |
| Single Male/Father | 0 (0.0%) | - |
| Single Female/Mother | 82 (21.0%) | 3.17 |
| Total Families | 391 (100.0%) | 2.46 |
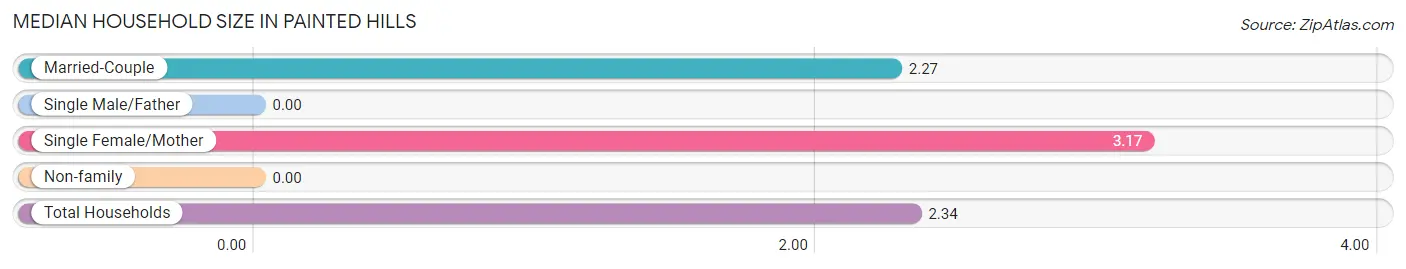
Median Household Size in Painted Hills
| Household Type | # Households | Household Size |
| Married-Couple | 309 (72.5%) | 2.27 |
| Single Male/Father | 0 (0.0%) | - |
| Single Female/Mother | 82 (19.3%) | 3.17 |
| Non-family | 35 (8.2%) | - |
| Total Households | 426 (100.0%) | 2.34 |
Household Size by Marriage Status in Painted Hills
Out of a total of 426 households in Painted Hills, 391 (91.8%) are family households, while 35 (8.2%) are nonfamily households. The most numerous type of family households are 2-person households, comprising 289, and the most common type of nonfamily households are 1-person households, comprising 35.
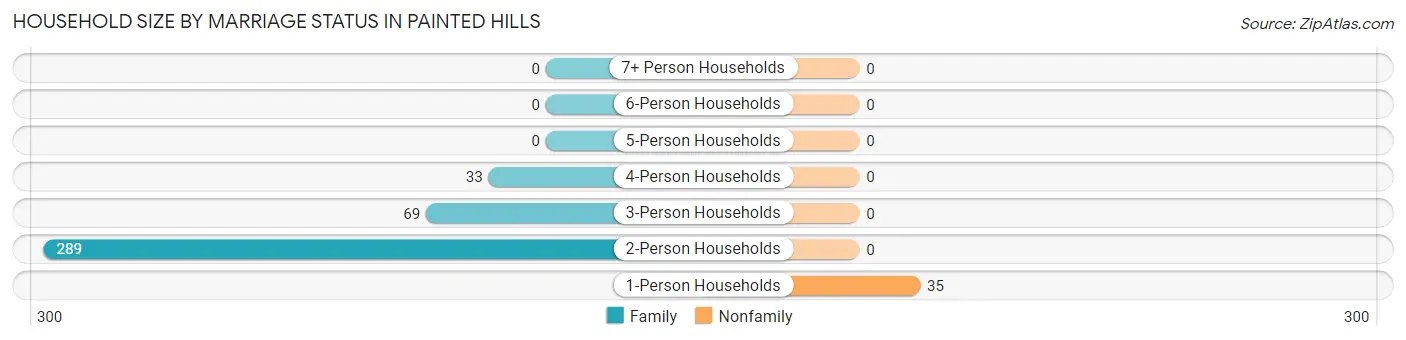
| Household Size | Family Households | Nonfamily Households |
| 1-Person Households | - | 35 (8.2%) |
| 2-Person Households | 289 (67.8%) | 0 (0.0%) |
| 3-Person Households | 69 (16.2%) | 0 (0.0%) |
| 4-Person Households | 33 (7.7%) | 0 (0.0%) |
| 5-Person Households | 0 (0.0%) | 0 (0.0%) |
| 6-Person Households | 0 (0.0%) | 0 (0.0%) |
| 7+ Person Households | 0 (0.0%) | 0 (0.0%) |
| Total | 391 (91.8%) | 35 (8.2%) |
Female Fertility in Painted Hills
Fertility by Age in Painted Hills
| Age Bracket | Women with Births | Births / 1,000 Women |
| 15 to 19 years | 0 (0.0%) | 0.0 |
| 20 to 34 years | 0 (0.0%) | 0.0 |
| 35 to 50 years | 0 (0.0%) | 0.0 |
| Total | 0 (0.0%) | 0.0 |
Fertility by Age by Marriage Status in Painted Hills
| Age Bracket | Married | Unmarried |
| 15 to 19 years | 0 (0.0%) | 0 (0.0%) |
| 20 to 34 years | 0 (0.0%) | 0 (0.0%) |
| 35 to 50 years | 0 (0.0%) | 0 (0.0%) |
| Total | 0 (0.0%) | 0 (0.0%) |
Fertility by Education in Painted Hills
| Educational Attainment | Women with Births | Births / 1,000 Women |
| Less than High School | 0 (0.0%) | 0.0 |
| High School Diploma | 0 (0.0%) | 0.0 |
| College or Associate's Degree | 0 (0.0%) | 0.0 |
| Bachelor's Degree | 0 (0.0%) | 0.0 |
| Graduate Degree | 0 (0.0%) | 0.0 |
| Total | 0 (0.0%) | 0.0 |
Fertility by Education by Marriage Status in Painted Hills
| Educational Attainment | Married | Unmarried |
| Less than High School | 0 (0.0%) | 0 (0.0%) |
| High School Diploma | 0 (0.0%) | 0 (0.0%) |
| College or Associate's Degree | 0 (0.0%) | 0 (0.0%) |
| Bachelor's Degree | 0 (0.0%) | 0 (0.0%) |
| Graduate Degree | 0 (0.0%) | 0 (0.0%) |
| Total | 0 (0.0%) | 0 (0.0%) |
Employment Characteristics in Painted Hills
Employment by Class of Employer in Painted Hills
Among the 574 employed individuals in Painted Hills, private company employees (389 | 67.8%), state government employees (104 | 18.1%), and local government employees (29 | 5.1%) make up the most common classes of employment.
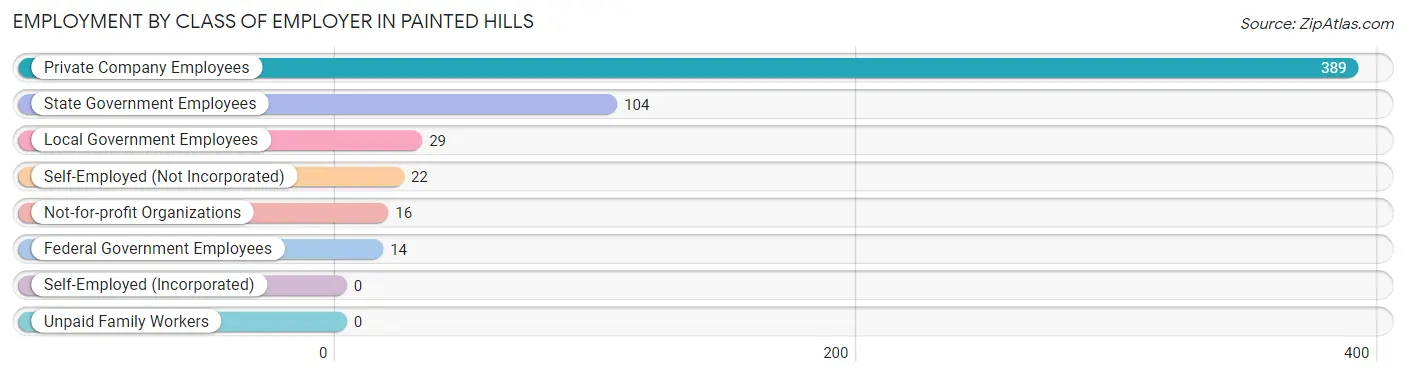
| Employer Class | # Employees | % Employees |
| Private Company Employees | 389 | 67.8% |
| Self-Employed (Incorporated) | 0 | 0.0% |
| Self-Employed (Not Incorporated) | 22 | 3.8% |
| Not-for-profit Organizations | 16 | 2.8% |
| Local Government Employees | 29 | 5.1% |
| State Government Employees | 104 | 18.1% |
| Federal Government Employees | 14 | 2.4% |
| Unpaid Family Workers | 0 | 0.0% |
| Total | 574 | 100.0% |
Employment Status by Age in Painted Hills
According to the labor force statistics for Painted Hills, out of the total population over 16 years of age (889), 84.5% or 751 individuals are in the labor force, with 23.6% or 177 of them unemployed. The age group with the highest labor force participation rate is 16 to 19 years, with 100.0% or 67 individuals in the labor force. Within the labor force, the 25 to 29 years age range has the highest percentage of unemployed individuals, with 100.0% or 76 of them being unemployed.
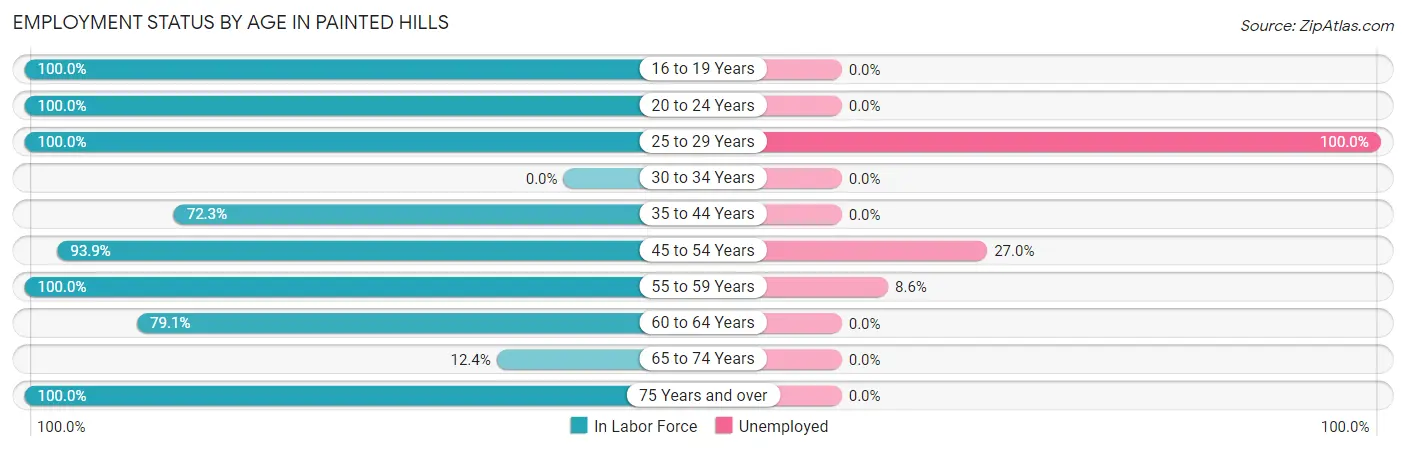
| Age Bracket | In Labor Force | Unemployed |
| 16 to 19 Years | 67 (100.0%) | 0 (0.0%) |
| 20 to 24 Years | 3 (100.0%) | 0 (0.0%) |
| 25 to 29 Years | 76 (100.0%) | 76 (100.0%) |
| 30 to 34 Years | 0 (0.0%) | 0 (0.0%) |
| 35 to 44 Years | 47 (72.3%) | 0 (0.0%) |
| 45 to 54 Years | 326 (93.9%) | 88 (27.0%) |
| 55 to 59 Years | 152 (100.0%) | 13 (8.6%) |
| 60 to 64 Years | 53 (79.1%) | 0 (0.0%) |
| 65 to 74 Years | 12 (12.4%) | 0 (0.0%) |
| 75 Years and over | 15 (100.0%) | 0 (0.0%) |
| Total | 751 (84.5%) | 177 (23.6%) |
Employment Status by Educational Attainment in Painted Hills
According to labor force statistics for Painted Hills, 92.5% of individuals (654) out of the total population between 25 and 64 years of age (707) are in the labor force, with 27.1% or 177 of them being unemployed. The group with the highest labor force participation rate are those with the educational attainment of less than high school, with 100.0% or 88 individuals in the labor force. Within the labor force, individuals with less than high school education have the highest percentage of unemployment, with 100.0% or 88 of them being unemployed.
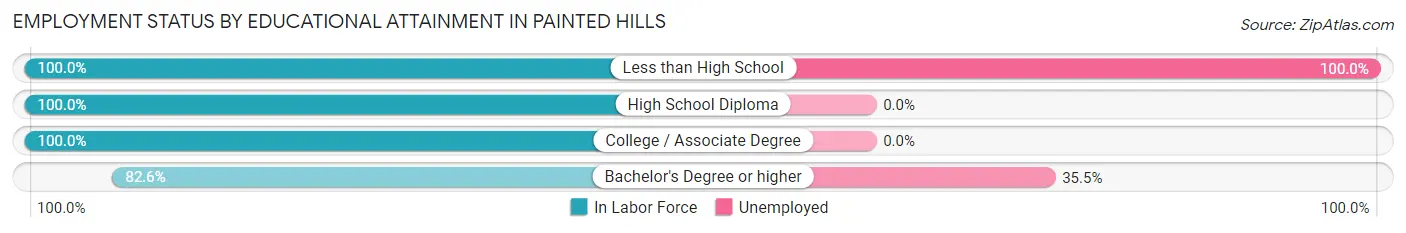
| Educational Attainment | In Labor Force | Unemployed |
| Less than High School | 88 (100.0%) | 88 (100.0%) |
| High School Diploma | 120 (100.0%) | 0 (0.0%) |
| College / Associate Degree | 195 (100.0%) | 0 (0.0%) |
| Bachelor's Degree or higher | 251 (82.6%) | 108 (35.5%) |
| Total | 654 (92.5%) | 192 (27.1%) |
Employment Occupations by Sex in Painted Hills
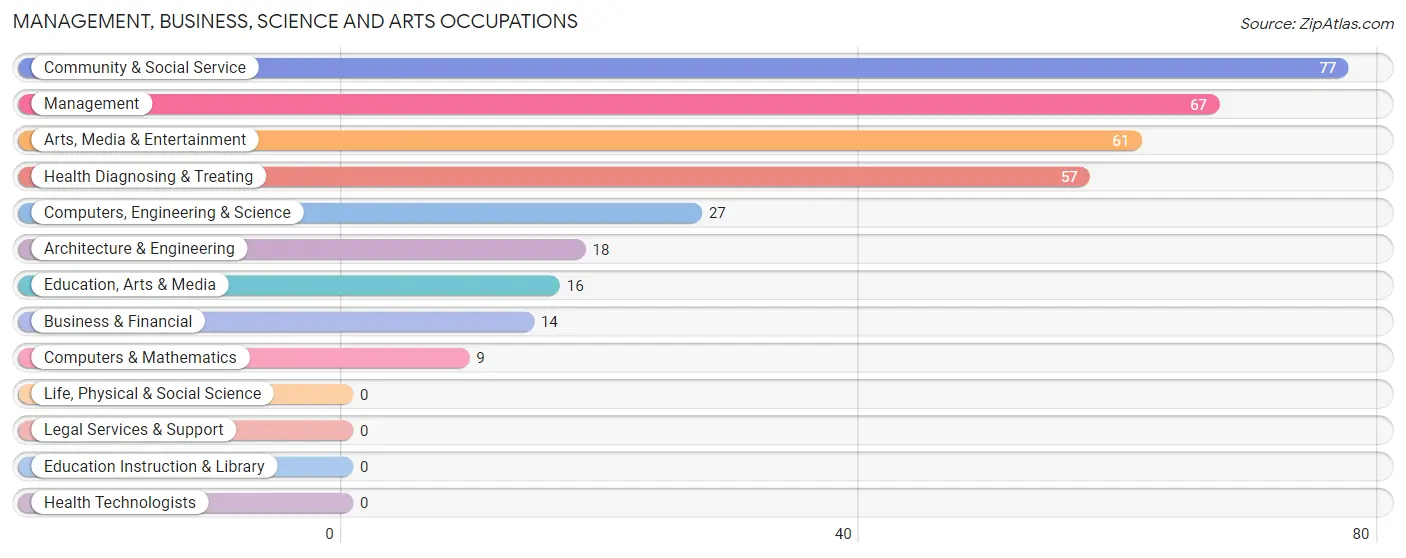
Management, Business, Science and Arts Occupations
The most common Management, Business, Science and Arts occupations in Painted Hills are Community & Social Service (77 | 13.4%), Management (67 | 11.7%), Arts, Media & Entertainment (61 | 10.6%), Health Diagnosing & Treating (57 | 9.9%), and Computers, Engineering & Science (27 | 4.7%).
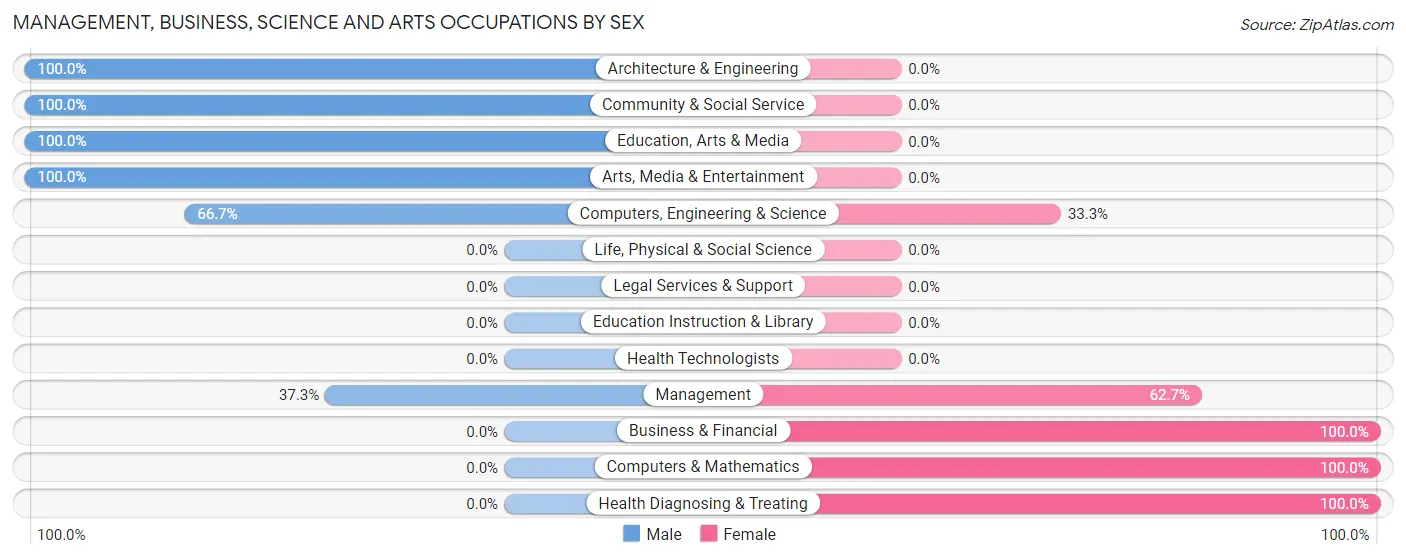
Management, Business, Science and Arts Occupations by Sex
Within the Management, Business, Science and Arts occupations in Painted Hills, the most male-oriented occupations are Architecture & Engineering (100.0%), Community & Social Service (100.0%), and Education, Arts & Media (100.0%), while the most female-oriented occupations are Business & Financial (100.0%), Computers & Mathematics (100.0%), and Health Diagnosing & Treating (100.0%).
| Occupation | Male | Female |
| Management | 25 (37.3%) | 42 (62.7%) |
| Business & Financial | 0 (0.0%) | 14 (100.0%) |
| Computers, Engineering & Science | 18 (66.7%) | 9 (33.3%) |
| Computers & Mathematics | 0 (0.0%) | 9 (100.0%) |
| Architecture & Engineering | 18 (100.0%) | 0 (0.0%) |
| Life, Physical & Social Science | 0 (0.0%) | 0 (0.0%) |
| Community & Social Service | 77 (100.0%) | 0 (0.0%) |
| Education, Arts & Media | 16 (100.0%) | 0 (0.0%) |
| Legal Services & Support | 0 (0.0%) | 0 (0.0%) |
| Education Instruction & Library | 0 (0.0%) | 0 (0.0%) |
| Arts, Media & Entertainment | 61 (100.0%) | 0 (0.0%) |
| Health Diagnosing & Treating | 0 (0.0%) | 57 (100.0%) |
| Health Technologists | 0 (0.0%) | 0 (0.0%) |
| Total (Category) | 120 (49.6%) | 122 (50.4%) |
| Total (Overall) | 244 (42.5%) | 330 (57.5%) |
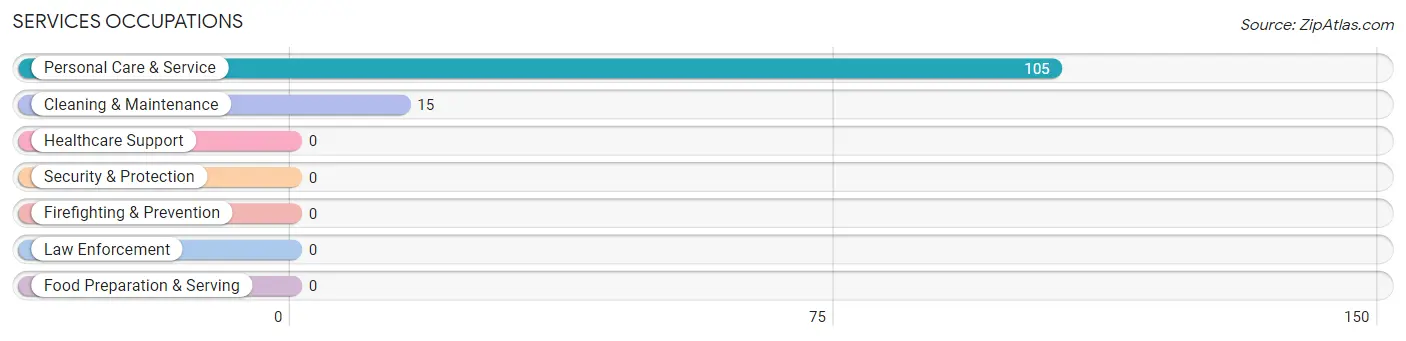
Services Occupations
The most common Services occupations in Painted Hills are Personal Care & Service (105 | 18.3%), and Cleaning & Maintenance (15 | 2.6%).
Services Occupations by Sex
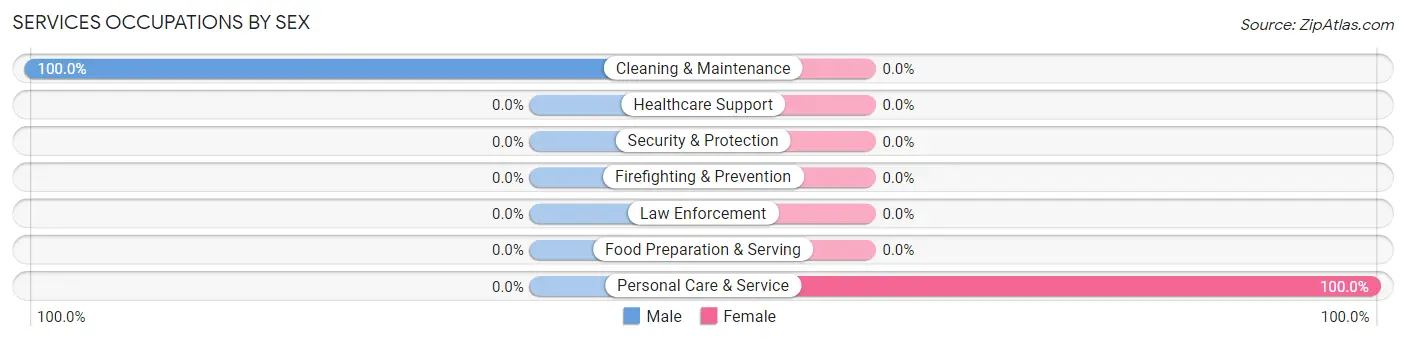
| Occupation | Male | Female |
| Healthcare Support | 0 (0.0%) | 0 (0.0%) |
| Security & Protection | 0 (0.0%) | 0 (0.0%) |
| Firefighting & Prevention | 0 (0.0%) | 0 (0.0%) |
| Law Enforcement | 0 (0.0%) | 0 (0.0%) |
| Food Preparation & Serving | 0 (0.0%) | 0 (0.0%) |
| Cleaning & Maintenance | 15 (100.0%) | 0 (0.0%) |
| Personal Care & Service | 0 (0.0%) | 105 (100.0%) |
| Total (Category) | 15 (12.5%) | 105 (87.5%) |
| Total (Overall) | 244 (42.5%) | 330 (57.5%) |
Sales and Office Occupations
The most common Sales and Office occupations in Painted Hills are Sales & Related (55 | 9.6%), and Office & Administration (50 | 8.7%).
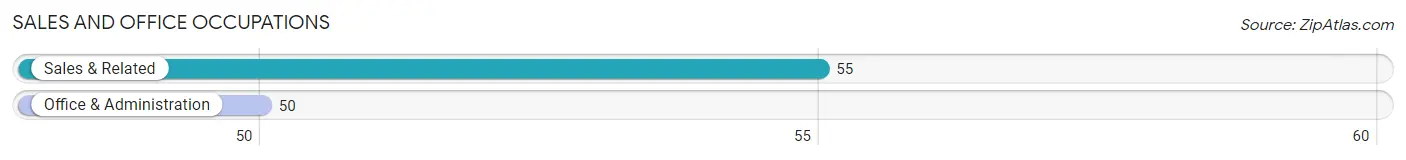
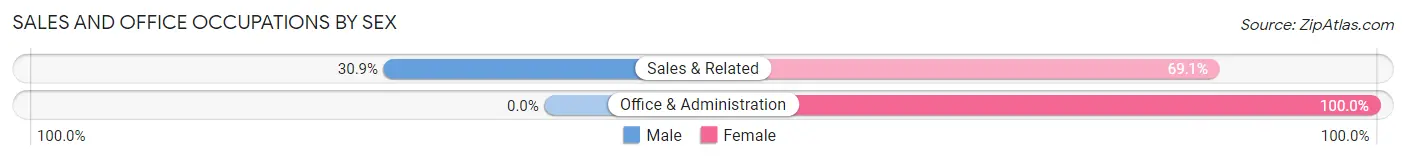
Sales and Office Occupations by Sex
| Occupation | Male | Female |
| Sales & Related | 17 (30.9%) | 38 (69.1%) |
| Office & Administration | 0 (0.0%) | 50 (100.0%) |
| Total (Category) | 17 (16.2%) | 88 (83.8%) |
| Total (Overall) | 244 (42.5%) | 330 (57.5%) |
Natural Resources, Construction and Maintenance Occupations
The most common Natural Resources, Construction and Maintenance occupations in Painted Hills are , and Construction & Extraction (29 | 5.1%).
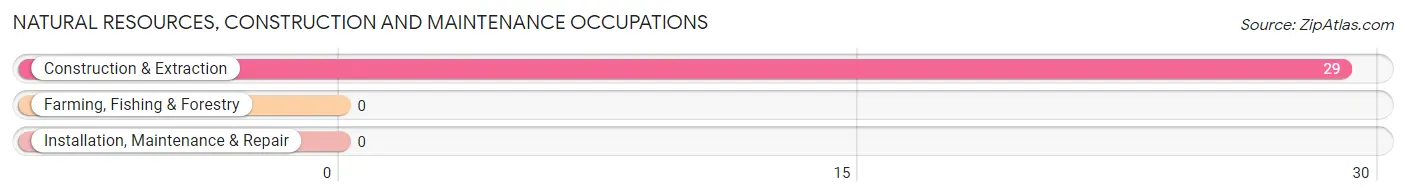
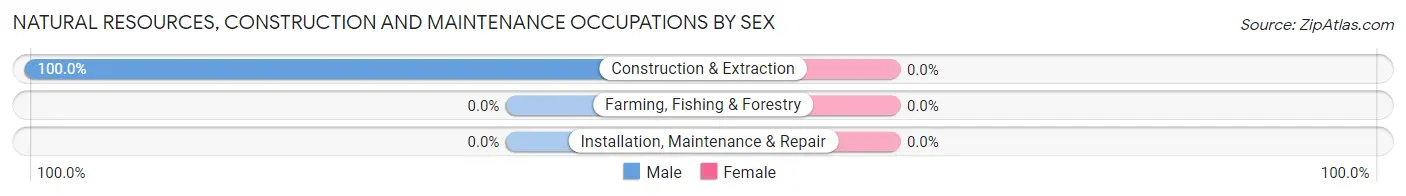
Natural Resources, Construction and Maintenance Occupations by Sex
| Occupation | Male | Female |
| Farming, Fishing & Forestry | 0 (0.0%) | 0 (0.0%) |
| Construction & Extraction | 29 (100.0%) | 0 (0.0%) |
| Installation, Maintenance & Repair | 0 (0.0%) | 0 (0.0%) |
| Total (Category) | 29 (100.0%) | 0 (0.0%) |
| Total (Overall) | 244 (42.5%) | 330 (57.5%) |
Production, Transportation and Moving Occupations
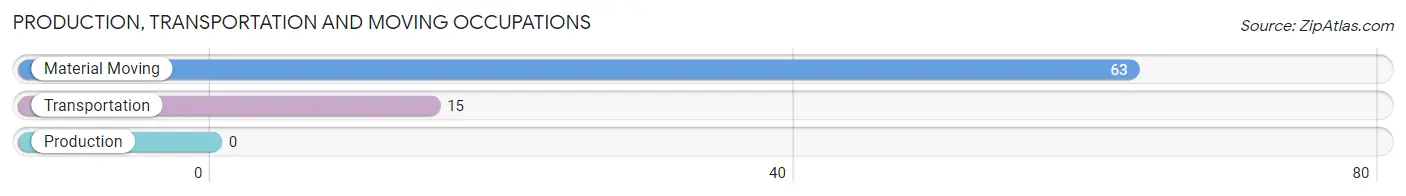
The most common Production, Transportation and Moving occupations in Painted Hills are Material Moving (63 | 11.0%), and Transportation (15 | 2.6%).
Production, Transportation and Moving Occupations by Sex
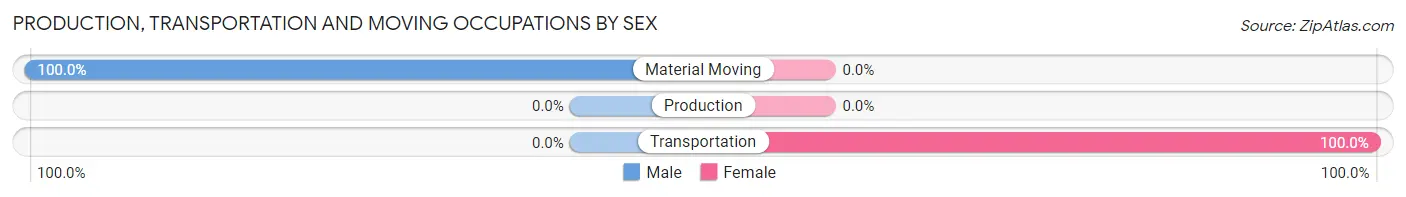
| Occupation | Male | Female |
| Production | 0 (0.0%) | 0 (0.0%) |
| Transportation | 0 (0.0%) | 15 (100.0%) |
| Material Moving | 63 (100.0%) | 0 (0.0%) |
| Total (Category) | 63 (80.8%) | 15 (19.2%) |
| Total (Overall) | 244 (42.5%) | 330 (57.5%) |
Employment Industries by Sex in Painted Hills
Employment Industries in Painted Hills
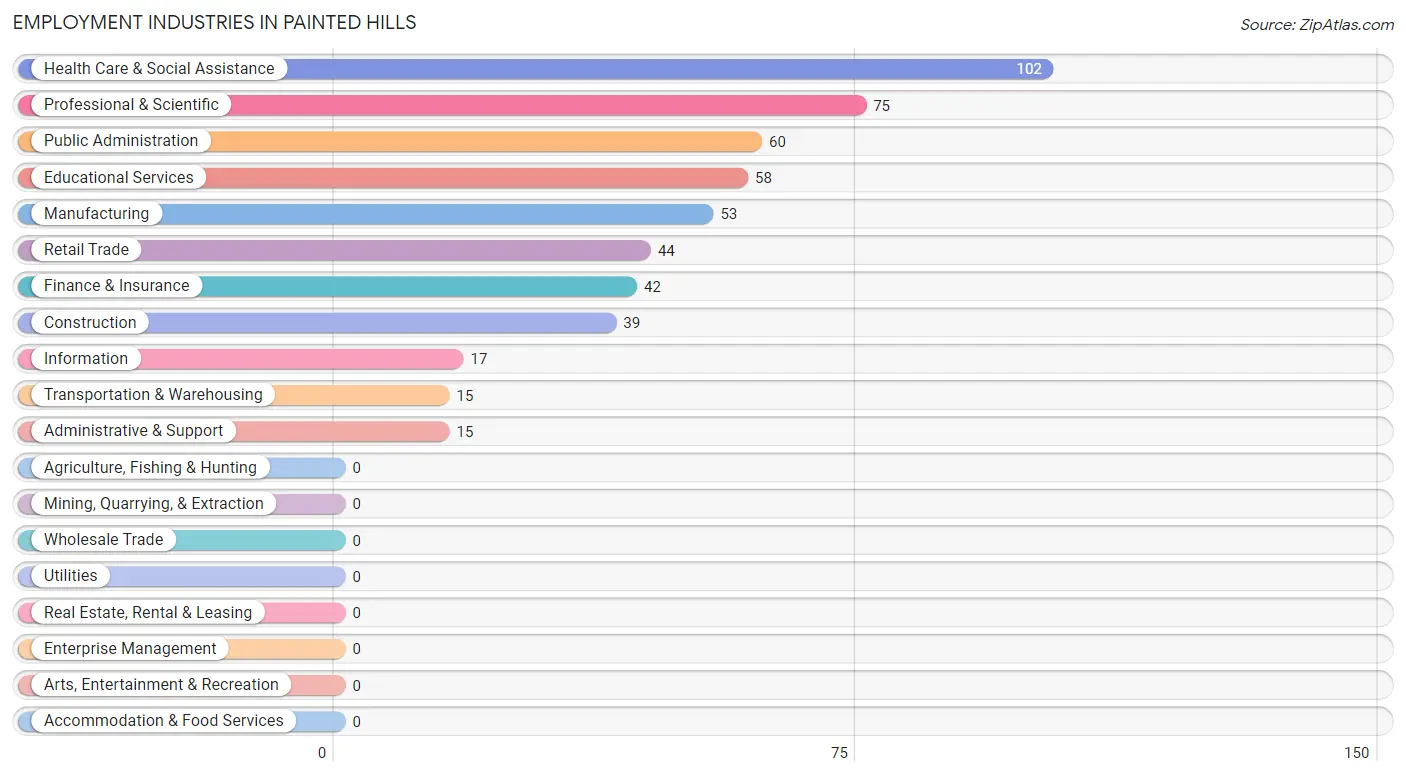
The major employment industries in Painted Hills include Health Care & Social Assistance (102 | 17.8%), Professional & Scientific (75 | 13.1%), Public Administration (60 | 10.4%), Educational Services (58 | 10.1%), and Manufacturing (53 | 9.2%).
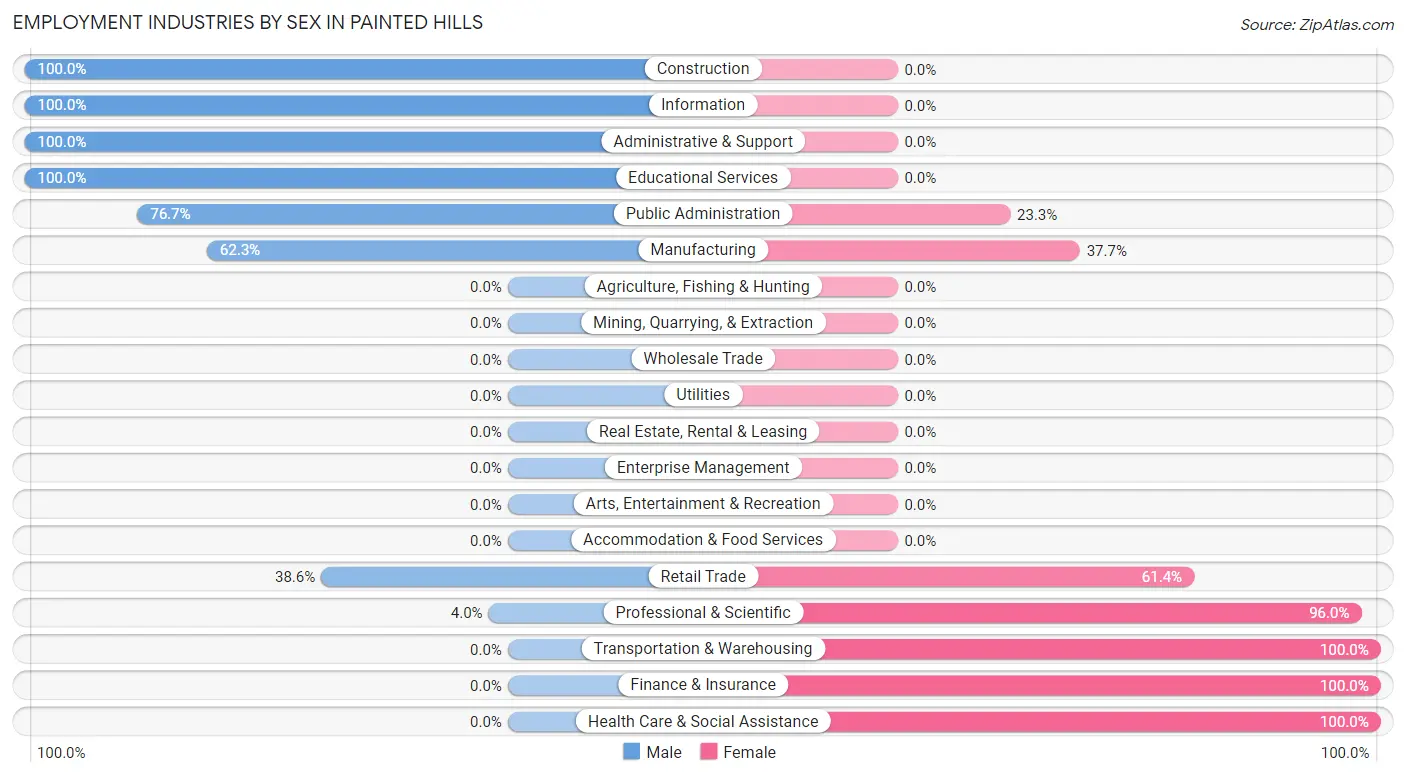
Employment Industries by Sex in Painted Hills
The Painted Hills industries that see more men than women are Construction (100.0%), Information (100.0%), and Administrative & Support (100.0%), whereas the industries that tend to have a higher number of women are Transportation & Warehousing (100.0%), Finance & Insurance (100.0%), and Health Care & Social Assistance (100.0%).
| Industry | Male | Female |
| Agriculture, Fishing & Hunting | 0 (0.0%) | 0 (0.0%) |
| Mining, Quarrying, & Extraction | 0 (0.0%) | 0 (0.0%) |
| Construction | 39 (100.0%) | 0 (0.0%) |
| Manufacturing | 33 (62.3%) | 20 (37.7%) |
| Wholesale Trade | 0 (0.0%) | 0 (0.0%) |
| Retail Trade | 17 (38.6%) | 27 (61.4%) |
| Transportation & Warehousing | 0 (0.0%) | 15 (100.0%) |
| Utilities | 0 (0.0%) | 0 (0.0%) |
| Information | 17 (100.0%) | 0 (0.0%) |
| Finance & Insurance | 0 (0.0%) | 42 (100.0%) |
| Real Estate, Rental & Leasing | 0 (0.0%) | 0 (0.0%) |
| Professional & Scientific | 3 (4.0%) | 72 (96.0%) |
| Enterprise Management | 0 (0.0%) | 0 (0.0%) |
| Administrative & Support | 15 (100.0%) | 0 (0.0%) |
| Educational Services | 58 (100.0%) | 0 (0.0%) |
| Health Care & Social Assistance | 0 (0.0%) | 102 (100.0%) |
| Arts, Entertainment & Recreation | 0 (0.0%) | 0 (0.0%) |
| Accommodation & Food Services | 0 (0.0%) | 0 (0.0%) |
| Public Administration | 46 (76.7%) | 14 (23.3%) |
| Total | 244 (42.5%) | 330 (57.5%) |
Education in Painted Hills
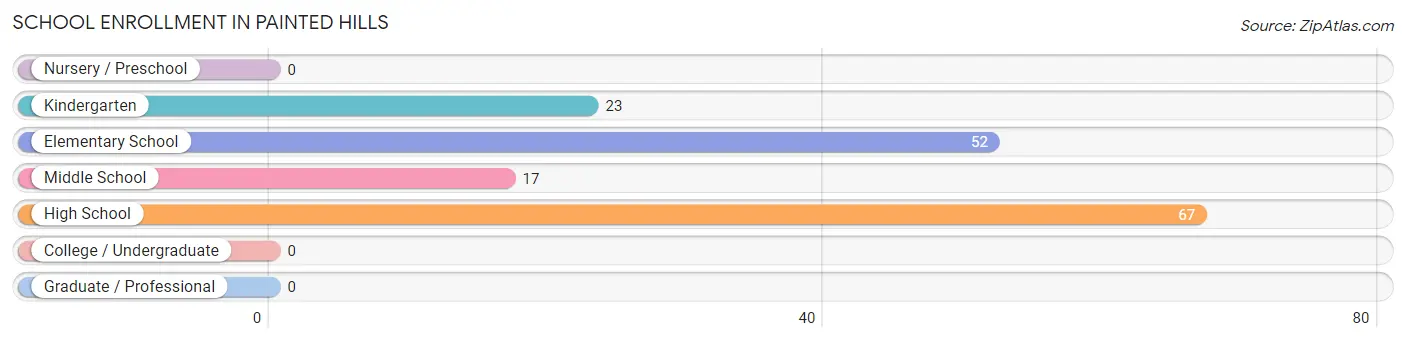
School Enrollment in Painted Hills
The most common levels of schooling among the 159 students in Painted Hills are high school (67 | 42.1%), elementary school (52 | 32.7%), and kindergarten (23 | 14.5%).
| School Level | # Students | % Students |
| Nursery / Preschool | 0 | 0.0% |
| Kindergarten | 23 | 14.5% |
| Elementary School | 52 | 32.7% |
| Middle School | 17 | 10.7% |
| High School | 67 | 42.1% |
| College / Undergraduate | 0 | 0.0% |
| Graduate / Professional | 0 | 0.0% |
| Total | 159 | 100.0% |
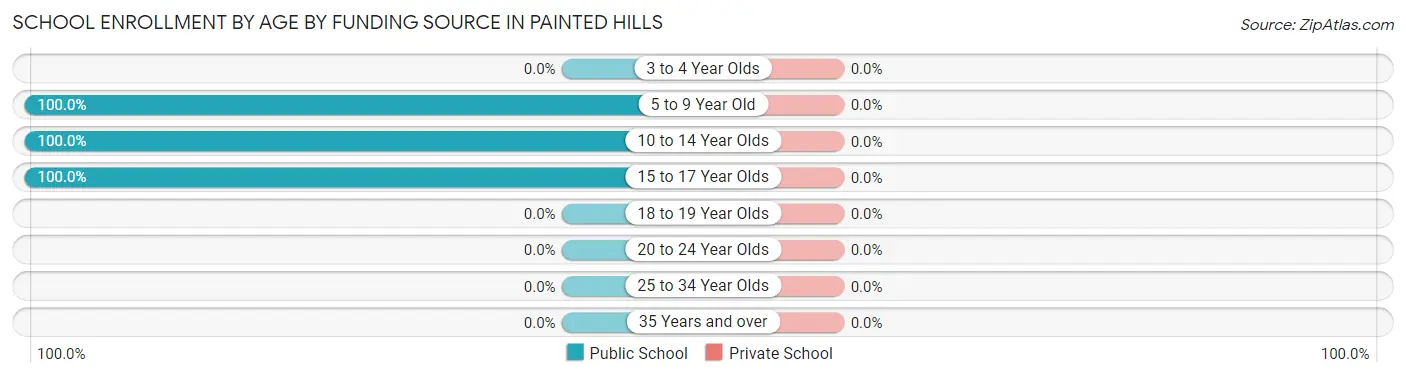
School Enrollment by Age by Funding Source in Painted Hills
| Age Bracket | Public School | Private School |
| 3 to 4 Year Olds | 0 (0.0%) | 0 (0.0%) |
| 5 to 9 Year Old | 75 (100.0%) | 0 (0.0%) |
| 10 to 14 Year Olds | 17 (100.0%) | 0 (0.0%) |
| 15 to 17 Year Olds | 67 (100.0%) | 0 (0.0%) |
| 18 to 19 Year Olds | 0 (0.0%) | 0 (0.0%) |
| 20 to 24 Year Olds | 0 (0.0%) | 0 (0.0%) |
| 25 to 34 Year Olds | 0 (0.0%) | 0 (0.0%) |
| 35 Years and over | 0 (0.0%) | 0 (0.0%) |
| Total | 159 (100.0%) | 0 (0.0%) |
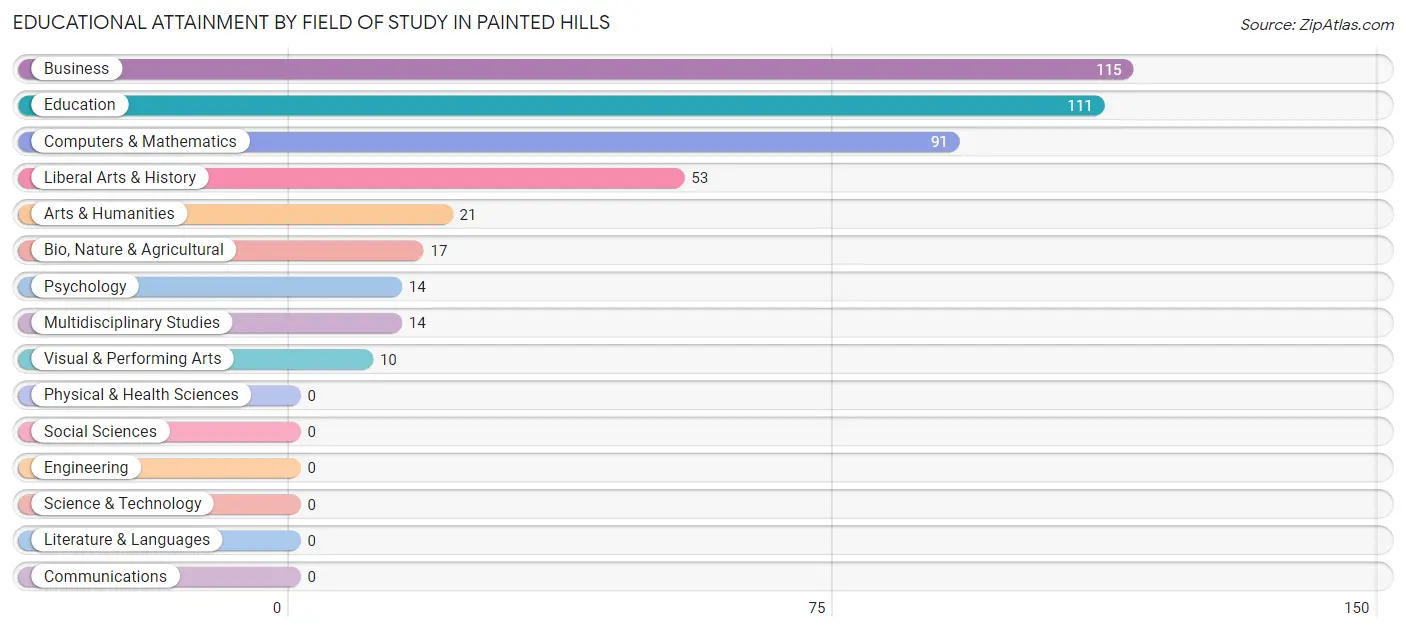
Educational Attainment by Field of Study in Painted Hills
Business (115 | 25.8%), education (111 | 24.9%), computers & mathematics (91 | 20.4%), liberal arts & history (53 | 11.9%), and arts & humanities (21 | 4.7%) are the most common fields of study among 446 individuals in Painted Hills who have obtained a bachelor's degree or higher.
| Field of Study | # Graduates | % Graduates |
| Computers & Mathematics | 91 | 20.4% |
| Bio, Nature & Agricultural | 17 | 3.8% |
| Physical & Health Sciences | 0 | 0.0% |
| Psychology | 14 | 3.1% |
| Social Sciences | 0 | 0.0% |
| Engineering | 0 | 0.0% |
| Multidisciplinary Studies | 14 | 3.1% |
| Science & Technology | 0 | 0.0% |
| Business | 115 | 25.8% |
| Education | 111 | 24.9% |
| Literature & Languages | 0 | 0.0% |
| Liberal Arts & History | 53 | 11.9% |
| Visual & Performing Arts | 10 | 2.2% |
| Communications | 0 | 0.0% |
| Arts & Humanities | 21 | 4.7% |
| Total | 446 | 100.0% |
Transportation & Commute in Painted Hills
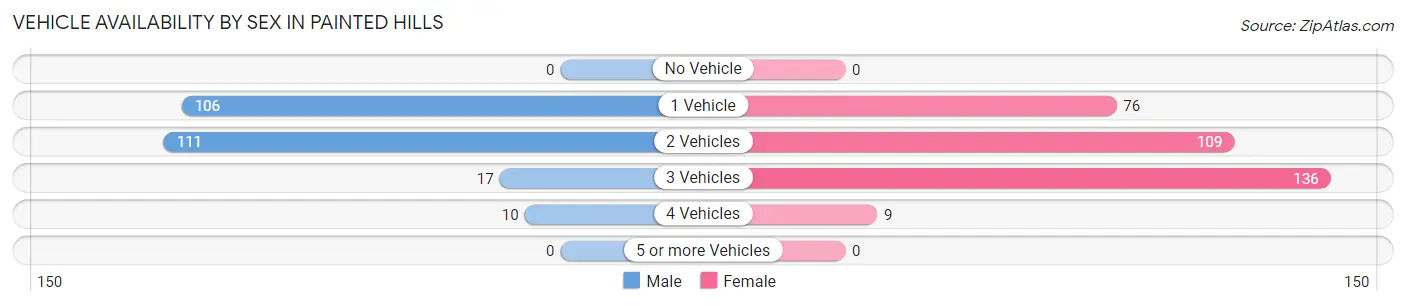
Vehicle Availability by Sex in Painted Hills
The most prevalent vehicle ownership categories in Painted Hills are males with 2 vehicles (111, accounting for 45.5%) and females with 2 vehicles (109, making up 33.6%).
| Vehicles Available | Male | Female |
| No Vehicle | 0 (0.0%) | 0 (0.0%) |
| 1 Vehicle | 106 (43.4%) | 76 (23.0%) |
| 2 Vehicles | 111 (45.5%) | 109 (33.0%) |
| 3 Vehicles | 17 (7.0%) | 136 (41.2%) |
| 4 Vehicles | 10 (4.1%) | 9 (2.7%) |
| 5 or more Vehicles | 0 (0.0%) | 0 (0.0%) |
| Total | 244 (100.0%) | 330 (100.0%) |
Commute Time in Painted Hills
The most frequently occuring commute durations in Painted Hills are 45 to 59 minutes (86 commuters, 23.2%), 20 to 24 minutes (77 commuters, 20.7%), and 35 to 39 minutes (75 commuters, 20.2%).
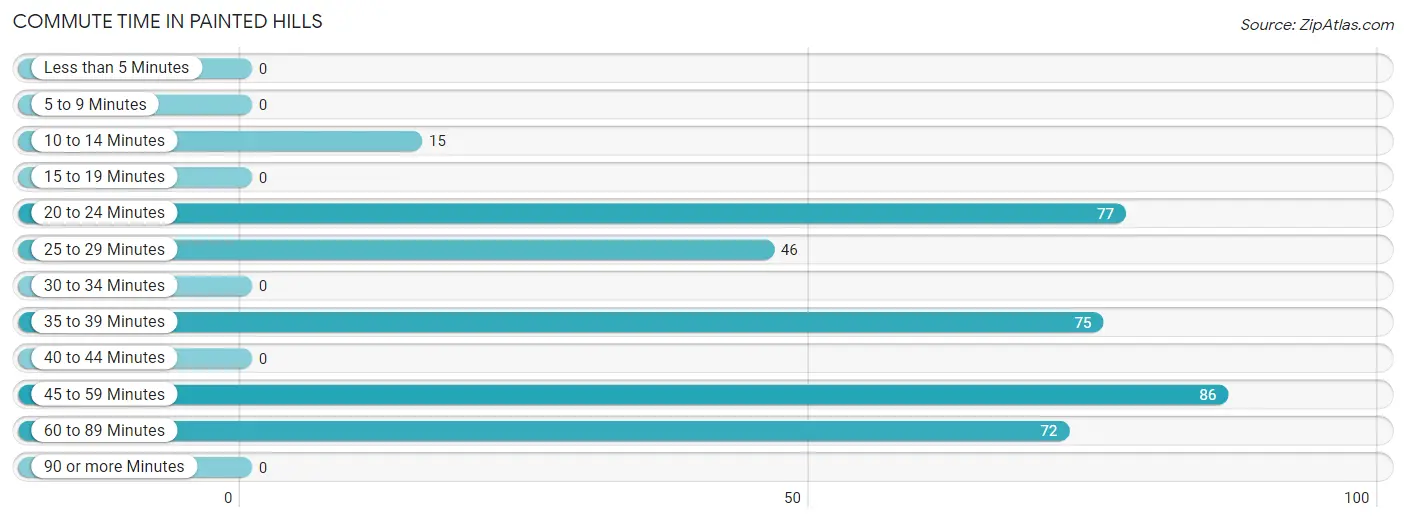
| Commute Time | # Commuters | % Commuters |
| Less than 5 Minutes | 0 | 0.0% |
| 5 to 9 Minutes | 0 | 0.0% |
| 10 to 14 Minutes | 15 | 4.0% |
| 15 to 19 Minutes | 0 | 0.0% |
| 20 to 24 Minutes | 77 | 20.7% |
| 25 to 29 Minutes | 46 | 12.4% |
| 30 to 34 Minutes | 0 | 0.0% |
| 35 to 39 Minutes | 75 | 20.2% |
| 40 to 44 Minutes | 0 | 0.0% |
| 45 to 59 Minutes | 86 | 23.2% |
| 60 to 89 Minutes | 72 | 19.4% |
| 90 or more Minutes | 0 | 0.0% |
Commute Time by Sex in Painted Hills
The most common commute times in Painted Hills are 35 to 39 minutes (75 commuters, 41.2%) for males and 60 to 89 minutes (72 commuters, 38.1%) for females.
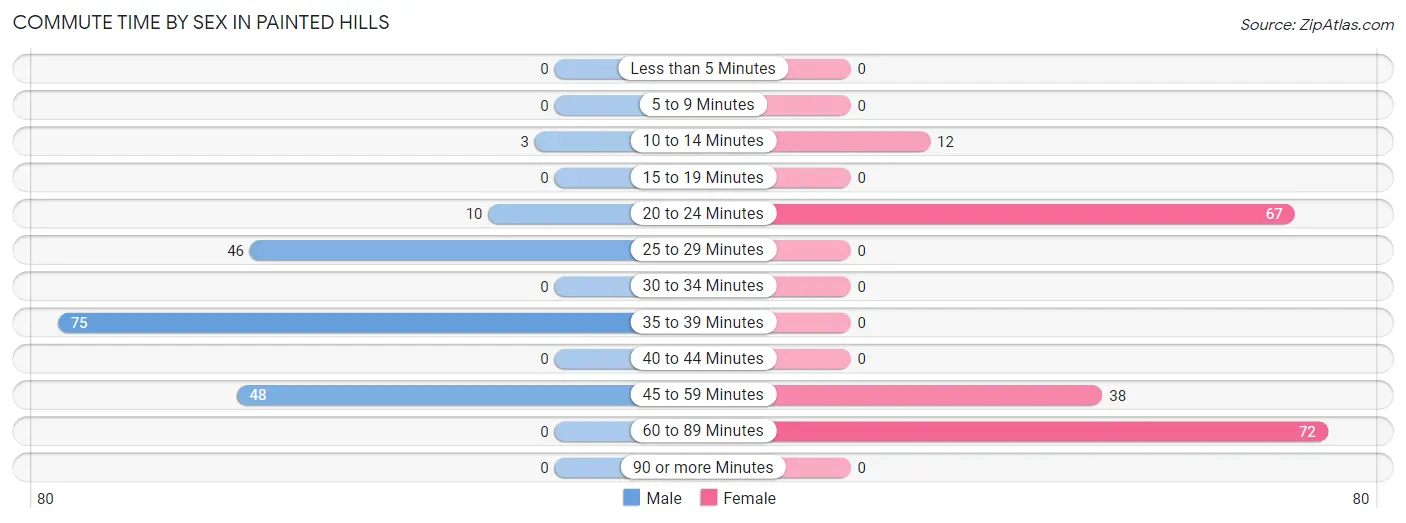
| Commute Time | Male | Female |
| Less than 5 Minutes | 0 (0.0%) | 0 (0.0%) |
| 5 to 9 Minutes | 0 (0.0%) | 0 (0.0%) |
| 10 to 14 Minutes | 3 (1.7%) | 12 (6.4%) |
| 15 to 19 Minutes | 0 (0.0%) | 0 (0.0%) |
| 20 to 24 Minutes | 10 (5.5%) | 67 (35.4%) |
| 25 to 29 Minutes | 46 (25.3%) | 0 (0.0%) |
| 30 to 34 Minutes | 0 (0.0%) | 0 (0.0%) |
| 35 to 39 Minutes | 75 (41.2%) | 0 (0.0%) |
| 40 to 44 Minutes | 0 (0.0%) | 0 (0.0%) |
| 45 to 59 Minutes | 48 (26.4%) | 38 (20.1%) |
| 60 to 89 Minutes | 0 (0.0%) | 72 (38.1%) |
| 90 or more Minutes | 0 (0.0%) | 0 (0.0%) |
Time of Departure to Work by Sex in Painted Hills
The most frequent times of departure to work in Painted Hills are 6:00 AM to 6:29 AM (63, 34.6%) for males and 6:30 AM to 6:59 AM (72, 38.1%) for females.
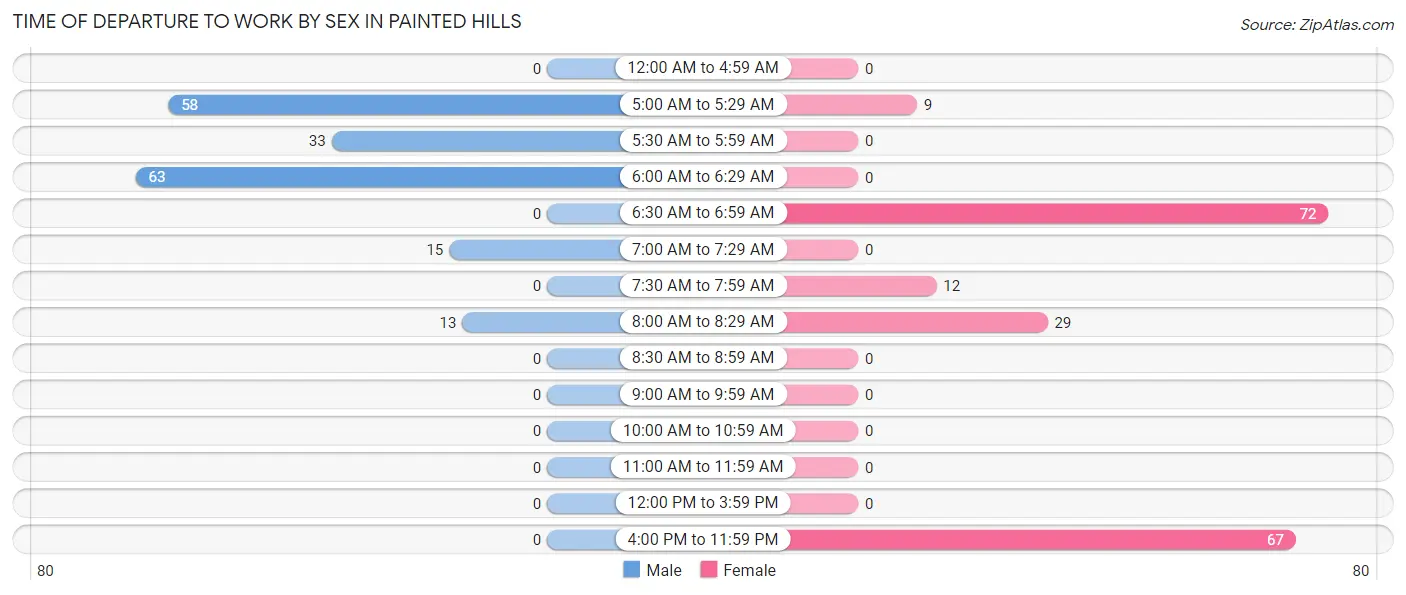
| Time of Departure | Male | Female |
| 12:00 AM to 4:59 AM | 0 (0.0%) | 0 (0.0%) |
| 5:00 AM to 5:29 AM | 58 (31.9%) | 9 (4.8%) |
| 5:30 AM to 5:59 AM | 33 (18.1%) | 0 (0.0%) |
| 6:00 AM to 6:29 AM | 63 (34.6%) | 0 (0.0%) |
| 6:30 AM to 6:59 AM | 0 (0.0%) | 72 (38.1%) |
| 7:00 AM to 7:29 AM | 15 (8.2%) | 0 (0.0%) |
| 7:30 AM to 7:59 AM | 0 (0.0%) | 12 (6.4%) |
| 8:00 AM to 8:29 AM | 13 (7.1%) | 29 (15.3%) |
| 8:30 AM to 8:59 AM | 0 (0.0%) | 0 (0.0%) |
| 9:00 AM to 9:59 AM | 0 (0.0%) | 0 (0.0%) |
| 10:00 AM to 10:59 AM | 0 (0.0%) | 0 (0.0%) |
| 11:00 AM to 11:59 AM | 0 (0.0%) | 0 (0.0%) |
| 12:00 PM to 3:59 PM | 0 (0.0%) | 0 (0.0%) |
| 4:00 PM to 11:59 PM | 0 (0.0%) | 67 (35.4%) |
| Total | 182 (100.0%) | 189 (100.0%) |
Housing Occupancy in Painted Hills
Occupancy by Ownership in Painted Hills
Of the total 426 dwellings in Painted Hills, owner-occupied units account for 411 (96.5%), while renter-occupied units make up 15 (3.5%).
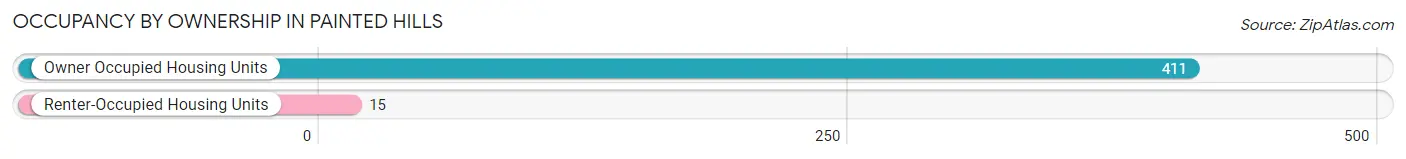
| Occupancy | # Housing Units | % Housing Units |
| Owner Occupied Housing Units | 411 | 96.5% |
| Renter-Occupied Housing Units | 15 | 3.5% |
| Total Occupied Housing Units | 426 | 100.0% |
Occupancy by Household Size in Painted Hills
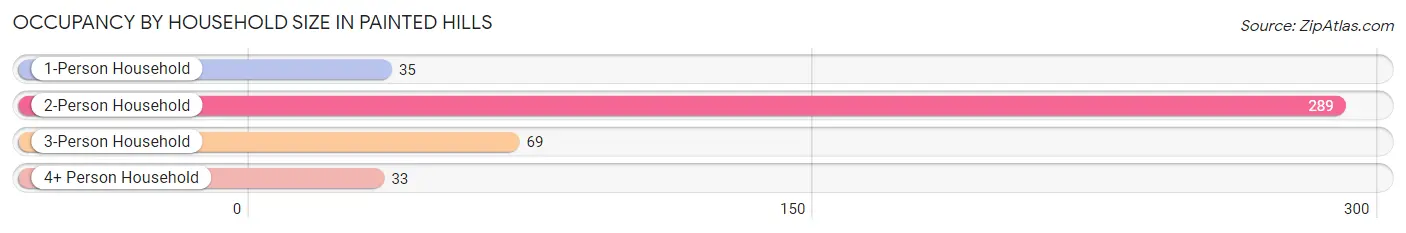
| Household Size | # Housing Units | % Housing Units |
| 1-Person Household | 35 | 8.2% |
| 2-Person Household | 289 | 67.8% |
| 3-Person Household | 69 | 16.2% |
| 4+ Person Household | 33 | 7.7% |
| Total Housing Units | 426 | 100.0% |
Occupancy by Ownership by Household Size in Painted Hills
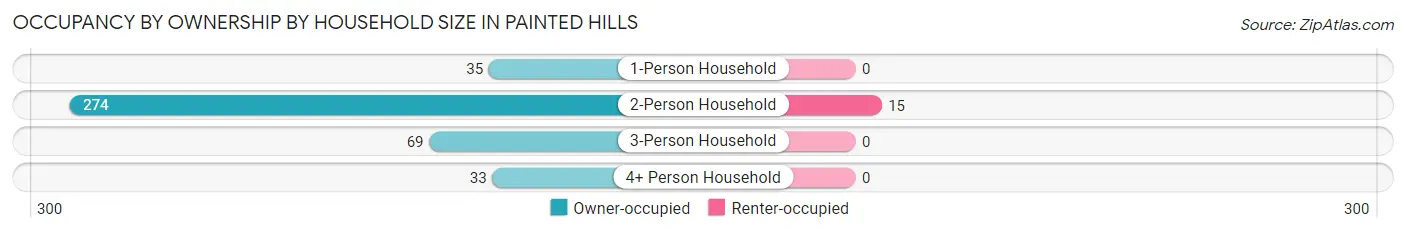
| Household Size | Owner-occupied | Renter-occupied |
| 1-Person Household | 35 (100.0%) | 0 (0.0%) |
| 2-Person Household | 274 (94.8%) | 15 (5.2%) |
| 3-Person Household | 69 (100.0%) | 0 (0.0%) |
| 4+ Person Household | 33 (100.0%) | 0 (0.0%) |
| Total Housing Units | 411 (96.5%) | 15 (3.5%) |
Occupancy by Educational Attainment in Painted Hills
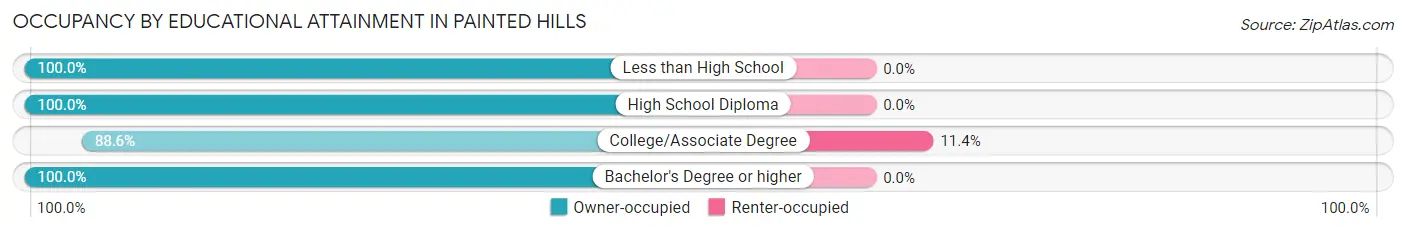
| Household Size | Owner-occupied | Renter-occupied |
| Less than High School | 88 (100.0%) | 0 (0.0%) |
| High School Diploma | 64 (100.0%) | 0 (0.0%) |
| College/Associate Degree | 117 (88.6%) | 15 (11.4%) |
| Bachelor's Degree or higher | 142 (100.0%) | 0 (0.0%) |
Occupancy by Age of Householder in Painted Hills
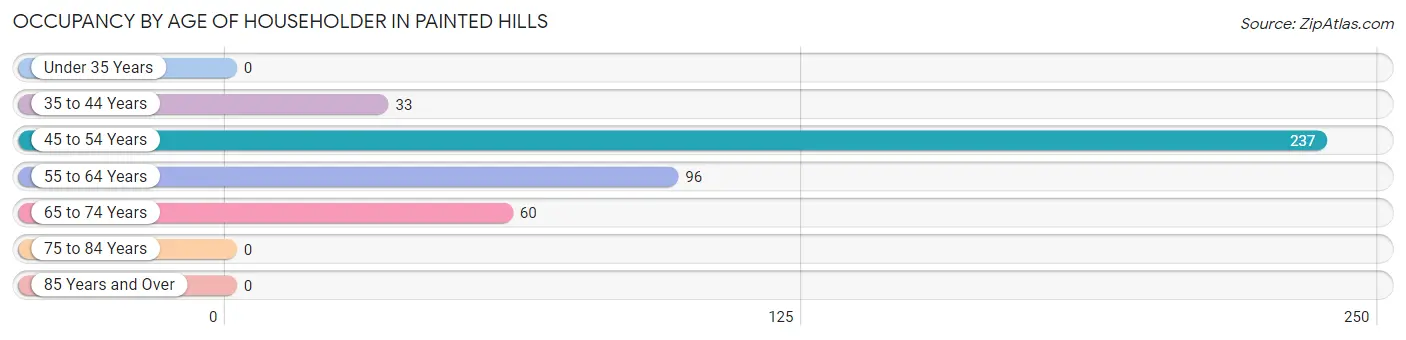
| Age Bracket | # Households | % Households |
| Under 35 Years | 0 | 0.0% |
| 35 to 44 Years | 33 | 7.7% |
| 45 to 54 Years | 237 | 55.6% |
| 55 to 64 Years | 96 | 22.5% |
| 65 to 74 Years | 60 | 14.1% |
| 75 to 84 Years | 0 | 0.0% |
| 85 Years and Over | 0 | 0.0% |
| Total | 426 | 100.0% |
Housing Finances in Painted Hills
Median Income by Occupancy in Painted Hills
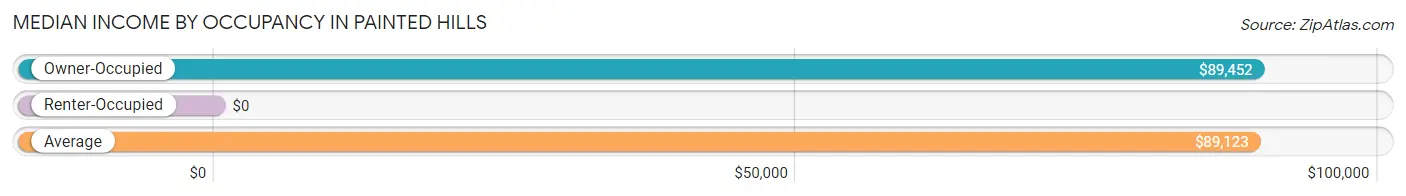
| Occupancy Type | # Households | Median Income |
| Owner-Occupied | 411 (96.5%) | $89,452 |
| Renter-Occupied | 15 (3.5%) | $0 |
| Average | 426 (100.0%) | $89,123 |
Occupancy by Householder Income Bracket in Painted Hills
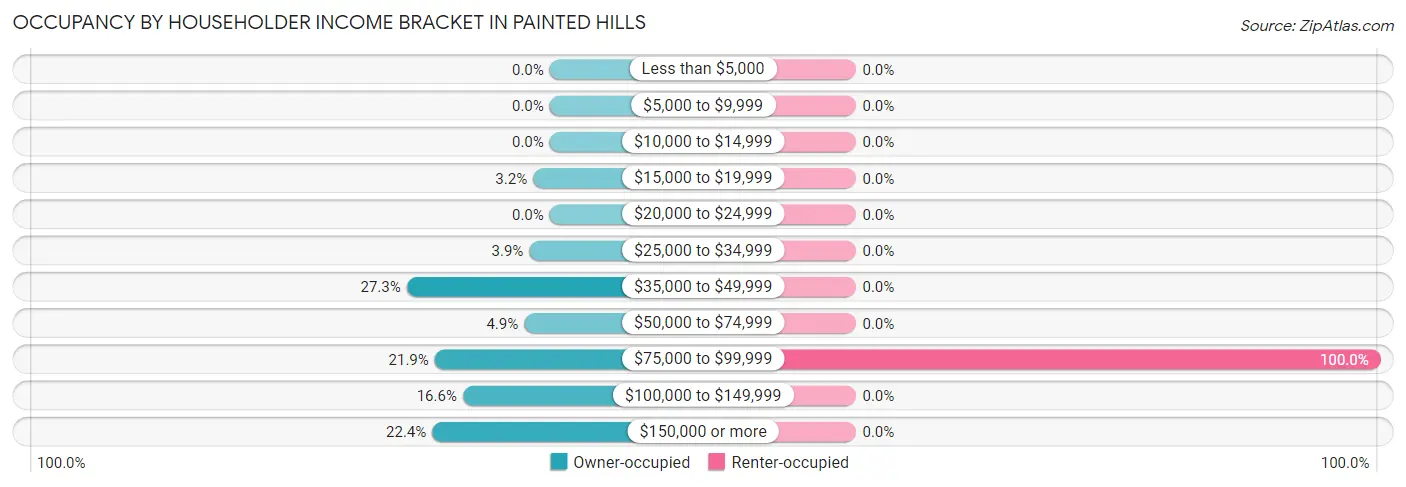
| Income Bracket | Owner-occupied | Renter-occupied |
| Less than $5,000 | 0 (0.0%) | 0 (0.0%) |
| $5,000 to $9,999 | 0 (0.0%) | 0 (0.0%) |
| $10,000 to $14,999 | 0 (0.0%) | 0 (0.0%) |
| $15,000 to $19,999 | 13 (3.2%) | 0 (0.0%) |
| $20,000 to $24,999 | 0 (0.0%) | 0 (0.0%) |
| $25,000 to $34,999 | 16 (3.9%) | 0 (0.0%) |
| $35,000 to $49,999 | 112 (27.3%) | 0 (0.0%) |
| $50,000 to $74,999 | 20 (4.9%) | 0 (0.0%) |
| $75,000 to $99,999 | 90 (21.9%) | 15 (100.0%) |
| $100,000 to $149,999 | 68 (16.6%) | 0 (0.0%) |
| $150,000 or more | 92 (22.4%) | 0 (0.0%) |
| Total | 411 (100.0%) | 15 (100.0%) |
Monthly Housing Cost Tiers in Painted Hills
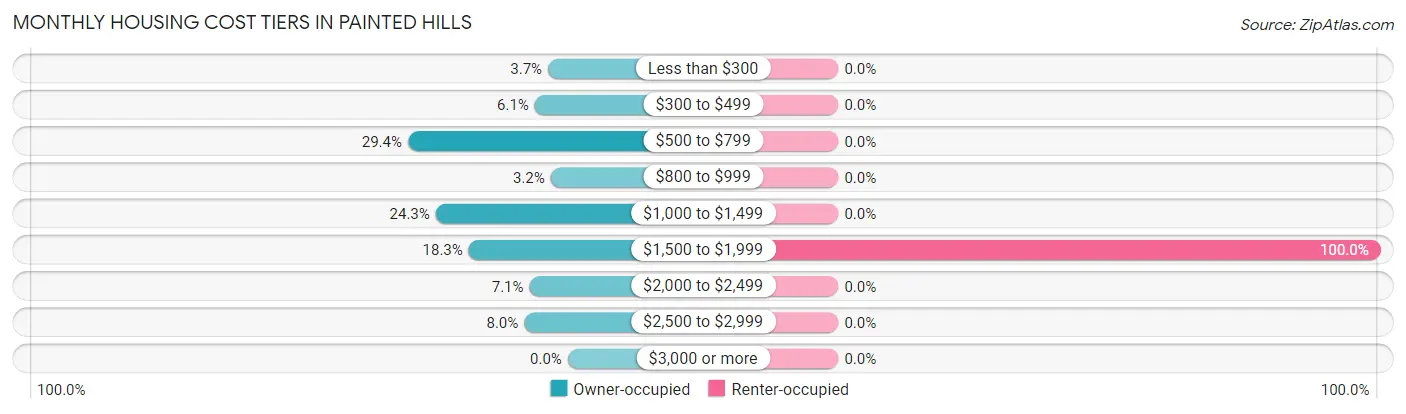
| Monthly Cost | Owner-occupied | Renter-occupied |
| Less than $300 | 15 (3.6%) | 0 (0.0%) |
| $300 to $499 | 25 (6.1%) | 0 (0.0%) |
| $500 to $799 | 121 (29.4%) | 0 (0.0%) |
| $800 to $999 | 13 (3.2%) | 0 (0.0%) |
| $1,000 to $1,499 | 100 (24.3%) | 0 (0.0%) |
| $1,500 to $1,999 | 75 (18.2%) | 15 (100.0%) |
| $2,000 to $2,499 | 29 (7.1%) | 0 (0.0%) |
| $2,500 to $2,999 | 33 (8.0%) | 0 (0.0%) |
| $3,000 or more | 0 (0.0%) | 0 (0.0%) |
| Total | 411 (100.0%) | 15 (100.0%) |
Physical Housing Characteristics in Painted Hills
Housing Structures in Painted Hills
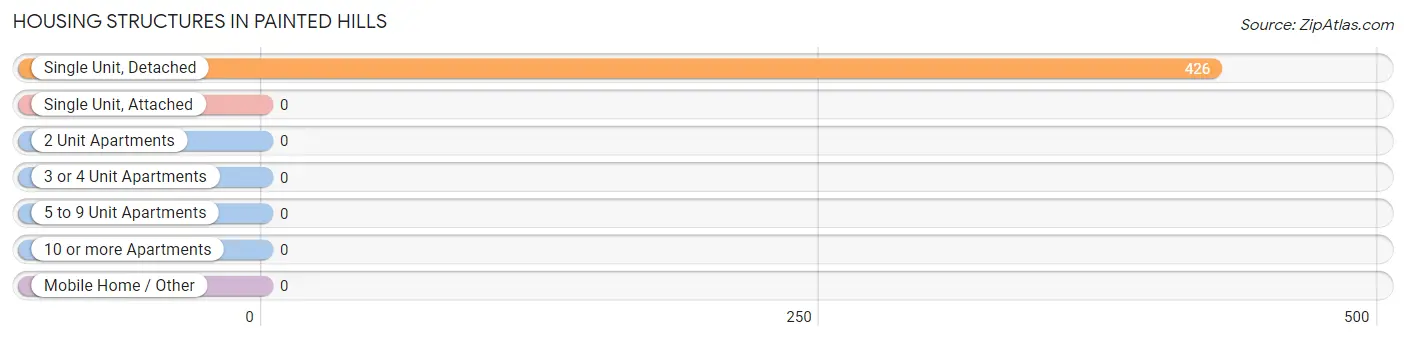
| Structure Type | # Housing Units | % Housing Units |
| Single Unit, Detached | 426 | 100.0% |
| Single Unit, Attached | 0 | 0.0% |
| 2 Unit Apartments | 0 | 0.0% |
| 3 or 4 Unit Apartments | 0 | 0.0% |
| 5 to 9 Unit Apartments | 0 | 0.0% |
| 10 or more Apartments | 0 | 0.0% |
| Mobile Home / Other | 0 | 0.0% |
| Total | 426 | 100.0% |
Housing Structures by Occupancy in Painted Hills
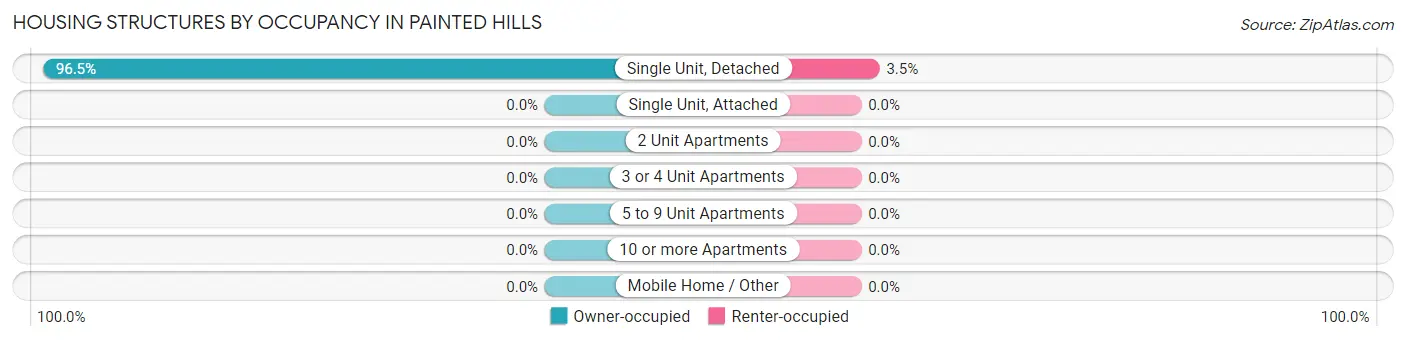
| Structure Type | Owner-occupied | Renter-occupied |
| Single Unit, Detached | 411 (96.5%) | 15 (3.5%) |
| Single Unit, Attached | 0 (0.0%) | 0 (0.0%) |
| 2 Unit Apartments | 0 (0.0%) | 0 (0.0%) |
| 3 or 4 Unit Apartments | 0 (0.0%) | 0 (0.0%) |
| 5 to 9 Unit Apartments | 0 (0.0%) | 0 (0.0%) |
| 10 or more Apartments | 0 (0.0%) | 0 (0.0%) |
| Mobile Home / Other | 0 (0.0%) | 0 (0.0%) |
| Total | 411 (96.5%) | 15 (3.5%) |
Housing Structures by Number of Rooms in Painted Hills
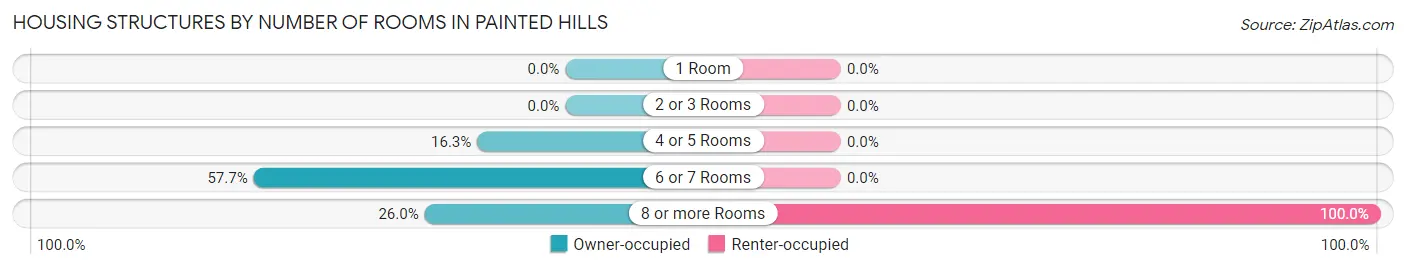
| Number of Rooms | Owner-occupied | Renter-occupied |
| 1 Room | 0 (0.0%) | 0 (0.0%) |
| 2 or 3 Rooms | 0 (0.0%) | 0 (0.0%) |
| 4 or 5 Rooms | 67 (16.3%) | 0 (0.0%) |
| 6 or 7 Rooms | 237 (57.7%) | 0 (0.0%) |
| 8 or more Rooms | 107 (26.0%) | 15 (100.0%) |
| Total | 411 (100.0%) | 15 (100.0%) |
Housing Structure by Heating Type in Painted Hills
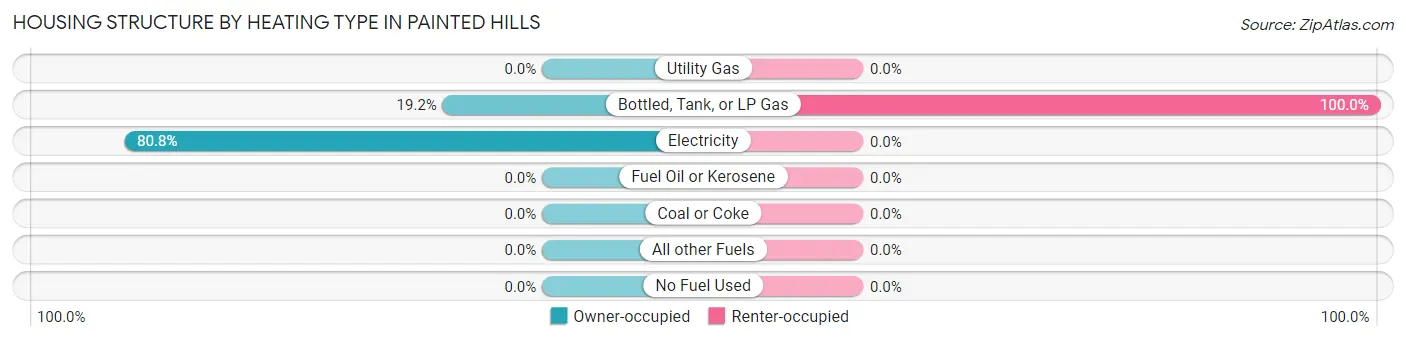
| Heating Type | Owner-occupied | Renter-occupied |
| Utility Gas | 0 (0.0%) | 0 (0.0%) |
| Bottled, Tank, or LP Gas | 79 (19.2%) | 15 (100.0%) |
| Electricity | 332 (80.8%) | 0 (0.0%) |
| Fuel Oil or Kerosene | 0 (0.0%) | 0 (0.0%) |
| Coal or Coke | 0 (0.0%) | 0 (0.0%) |
| All other Fuels | 0 (0.0%) | 0 (0.0%) |
| No Fuel Used | 0 (0.0%) | 0 (0.0%) |
| Total | 411 (100.0%) | 15 (100.0%) |
Household Vehicle Usage in Painted Hills
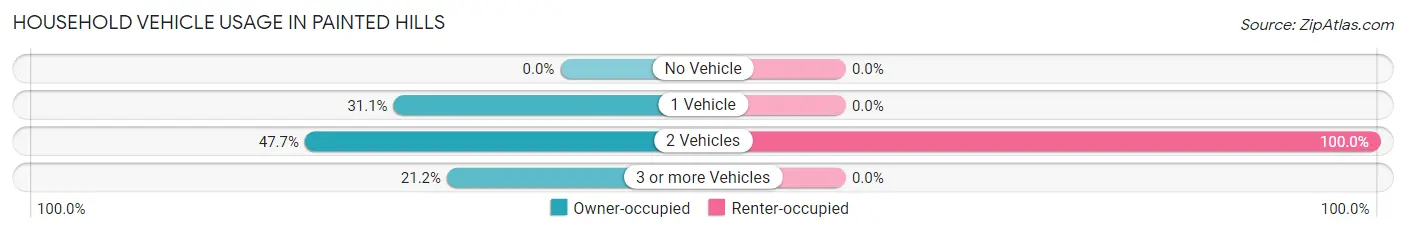
| Vehicles per Household | Owner-occupied | Renter-occupied |
| No Vehicle | 0 (0.0%) | 0 (0.0%) |
| 1 Vehicle | 128 (31.1%) | 0 (0.0%) |
| 2 Vehicles | 196 (47.7%) | 15 (100.0%) |
| 3 or more Vehicles | 87 (21.2%) | 0 (0.0%) |
| Total | 411 (100.0%) | 15 (100.0%) |
Real Estate & Mortgages in Painted Hills
Real Estate and Mortgage Overview in Painted Hills
| Characteristic | Without Mortgage | With Mortgage |
| Housing Units | 61 | 350 |
| Median Property Value | - | - |
| Median Household Income | - | - |
| Monthly Housing Costs | - | - |
| Real Estate Taxes | - | - |
Property Value by Mortgage Status in Painted Hills
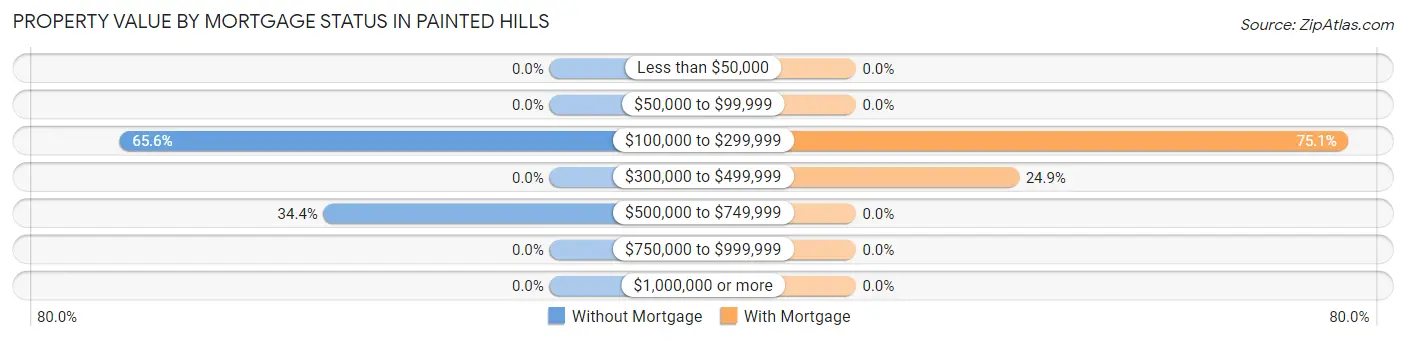
| Property Value | Without Mortgage | With Mortgage |
| Less than $50,000 | 0 (0.0%) | 0 (0.0%) |
| $50,000 to $99,999 | 0 (0.0%) | 0 (0.0%) |
| $100,000 to $299,999 | 40 (65.6%) | 263 (75.1%) |
| $300,000 to $499,999 | 0 (0.0%) | 87 (24.9%) |
| $500,000 to $749,999 | 21 (34.4%) | 0 (0.0%) |
| $750,000 to $999,999 | 0 (0.0%) | 0 (0.0%) |
| $1,000,000 or more | 0 (0.0%) | 0 (0.0%) |
| Total | 61 (100.0%) | 350 (100.0%) |
Household Income by Mortgage Status in Painted Hills
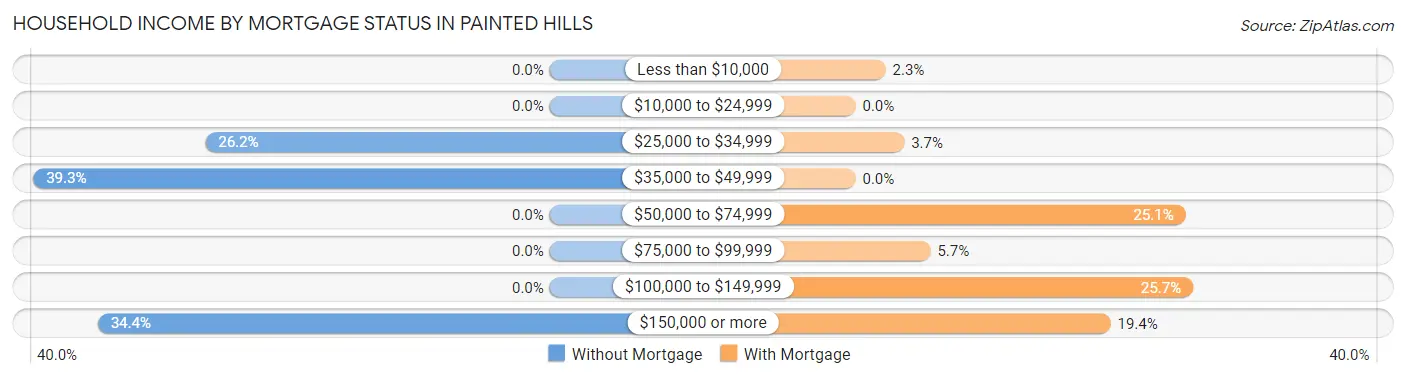
| Household Income | Without Mortgage | With Mortgage |
| Less than $10,000 | 0 (0.0%) | 8 (2.3%) |
| $10,000 to $24,999 | 0 (0.0%) | 0 (0.0%) |
| $25,000 to $34,999 | 16 (26.2%) | 13 (3.7%) |
| $35,000 to $49,999 | 24 (39.3%) | 0 (0.0%) |
| $50,000 to $74,999 | 0 (0.0%) | 88 (25.1%) |
| $75,000 to $99,999 | 0 (0.0%) | 20 (5.7%) |
| $100,000 to $149,999 | 0 (0.0%) | 90 (25.7%) |
| $150,000 or more | 21 (34.4%) | 68 (19.4%) |
| Total | 61 (100.0%) | 350 (100.0%) |
Property Value to Household Income Ratio in Painted Hills
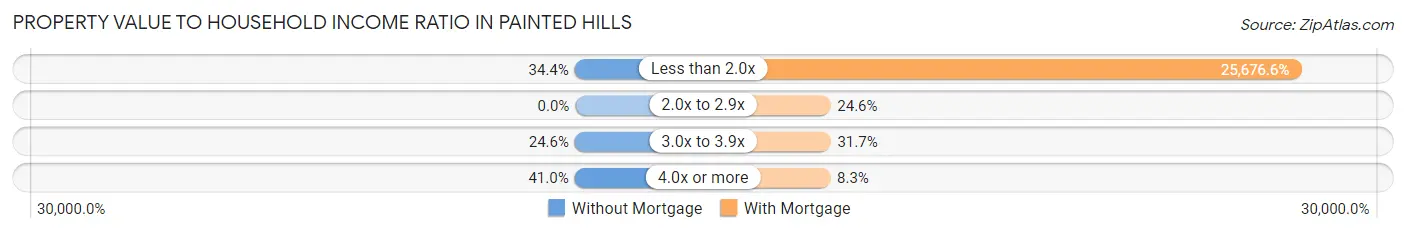
| Value-to-Income Ratio | Without Mortgage | With Mortgage |
| Less than 2.0x | 21 (34.4%) | 89,868 (25,676.6%) |
| 2.0x to 2.9x | 0 (0.0%) | 86 (24.6%) |
| 3.0x to 3.9x | 15 (24.6%) | 111 (31.7%) |
| 4.0x or more | 25 (41.0%) | 29 (8.3%) |
| Total | 61 (100.0%) | 350 (100.0%) |
Real Estate Taxes by Mortgage Status in Painted Hills
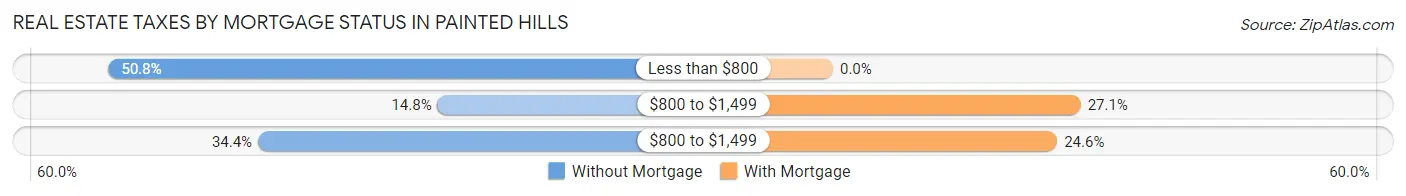
| Property Taxes | Without Mortgage | With Mortgage |
| Less than $800 | 31 (50.8%) | 0 (0.0%) |
| $800 to $1,499 | 9 (14.7%) | 95 (27.1%) |
| $800 to $1,499 | 21 (34.4%) | 86 (24.6%) |
| Total | 61 (100.0%) | 350 (100.0%) |
Health & Disability in Painted Hills
Health Insurance Coverage by Age in Painted Hills
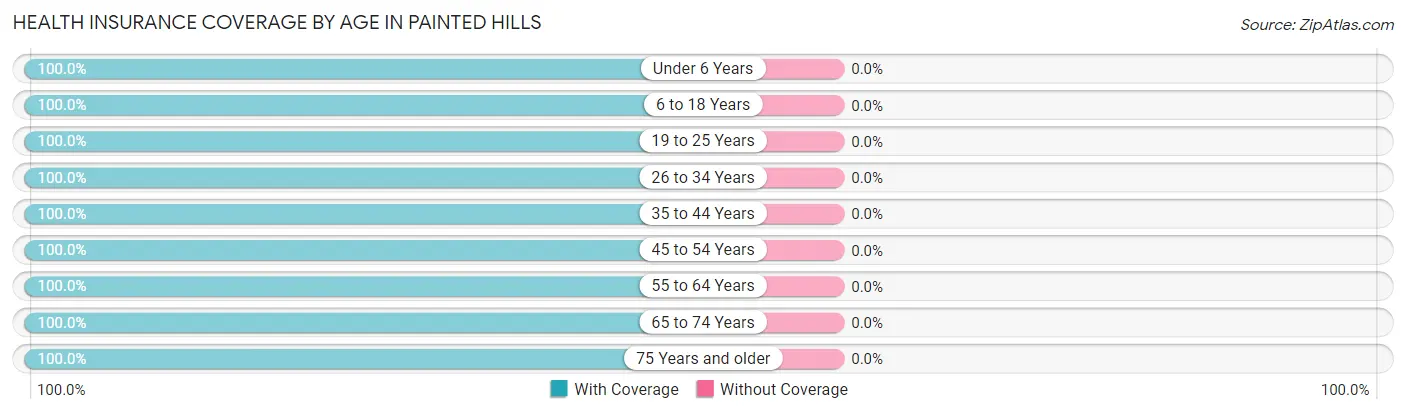
| Age Bracket | With Coverage | Without Coverage |
| Under 6 Years | 38 (100.0%) | 0 (0.0%) |
| 6 to 18 Years | 136 (100.0%) | 0 (0.0%) |
| 19 to 25 Years | 3 (100.0%) | 0 (0.0%) |
| 26 to 34 Years | 76 (100.0%) | 0 (0.0%) |
| 35 to 44 Years | 65 (100.0%) | 0 (0.0%) |
| 45 to 54 Years | 347 (100.0%) | 0 (0.0%) |
| 55 to 64 Years | 219 (100.0%) | 0 (0.0%) |
| 65 to 74 Years | 97 (100.0%) | 0 (0.0%) |
| 75 Years and older | 15 (100.0%) | 0 (0.0%) |
| Total | 996 (100.0%) | 0 (0.0%) |
Health Insurance Coverage by Citizenship Status in Painted Hills
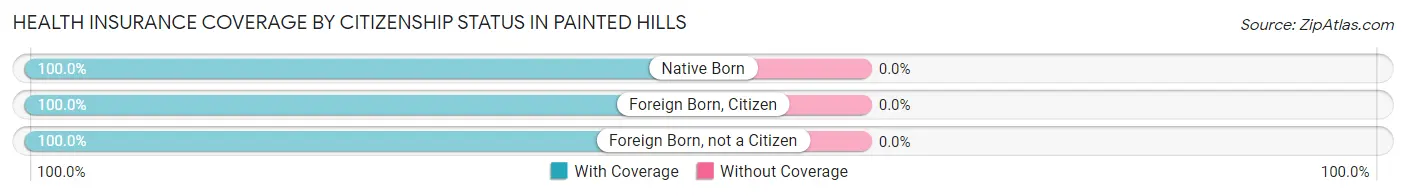
| Citizenship Status | With Coverage | Without Coverage |
| Native Born | 38 (100.0%) | 0 (0.0%) |
| Foreign Born, Citizen | 136 (100.0%) | 0 (0.0%) |
| Foreign Born, not a Citizen | 3 (100.0%) | 0 (0.0%) |
Health Insurance Coverage by Household Income in Painted Hills
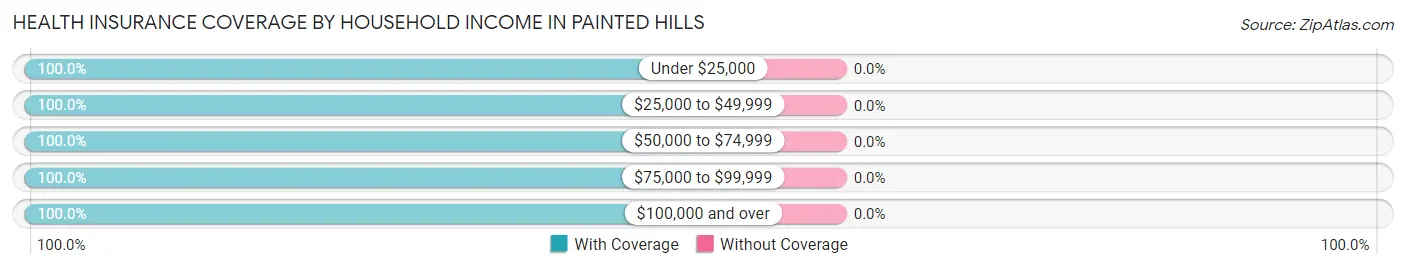
| Household Income | With Coverage | Without Coverage |
| Under $25,000 | 16 (100.0%) | 0 (0.0%) |
| $25,000 to $49,999 | 181 (100.0%) | 0 (0.0%) |
| $50,000 to $74,999 | 60 (100.0%) | 0 (0.0%) |
| $75,000 to $99,999 | 350 (100.0%) | 0 (0.0%) |
| $100,000 and over | 389 (100.0%) | 0 (0.0%) |
Public vs Private Health Insurance Coverage by Age in Painted Hills
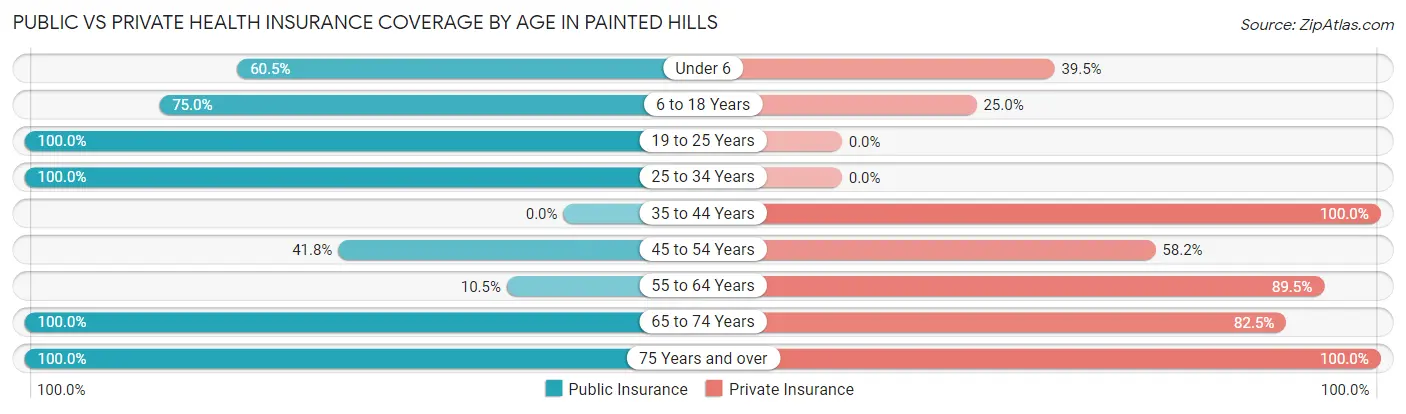
| Age Bracket | Public Insurance | Private Insurance |
| Under 6 | 23 (60.5%) | 15 (39.5%) |
| 6 to 18 Years | 102 (75.0%) | 34 (25.0%) |
| 19 to 25 Years | 3 (100.0%) | 0 (0.0%) |
| 25 to 34 Years | 76 (100.0%) | 0 (0.0%) |
| 35 to 44 Years | 0 (0.0%) | 65 (100.0%) |
| 45 to 54 Years | 145 (41.8%) | 202 (58.2%) |
| 55 to 64 Years | 23 (10.5%) | 196 (89.5%) |
| 65 to 74 Years | 97 (100.0%) | 80 (82.5%) |
| 75 Years and over | 15 (100.0%) | 15 (100.0%) |
| Total | 484 (48.6%) | 607 (60.9%) |
Disability Status by Sex by Age in Painted Hills
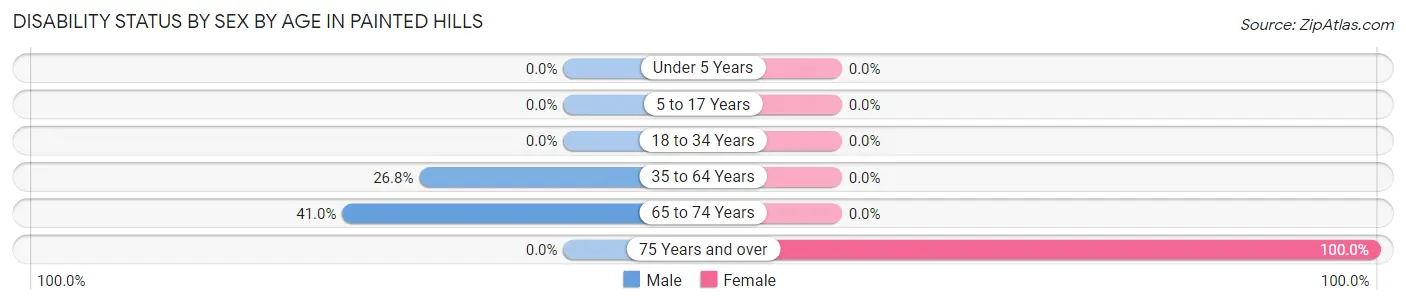
| Age Bracket | Male | Female |
| Under 5 Years | 0 (0.0%) | 0 (0.0%) |
| 5 to 17 Years | 0 (0.0%) | 0 (0.0%) |
| 18 to 34 Years | 0 (0.0%) | 0 (0.0%) |
| 35 to 64 Years | 88 (26.8%) | 0 (0.0%) |
| 65 to 74 Years | 16 (41.0%) | 0 (0.0%) |
| 75 Years and over | 0 (0.0%) | 15 (100.0%) |
Disability Class by Sex by Age in Painted Hills
Disability Class: Hearing Difficulty

| Age Bracket | Male | Female |
| Under 5 Years | 0 (0.0%) | 0 (0.0%) |
| 5 to 17 Years | 0 (0.0%) | 0 (0.0%) |
| 18 to 34 Years | 0 (0.0%) | 0 (0.0%) |
| 35 to 64 Years | 88 (26.8%) | 0 (0.0%) |
| 65 to 74 Years | 0 (0.0%) | 0 (0.0%) |
| 75 Years and over | 0 (0.0%) | 0 (0.0%) |
Disability Class: Vision Difficulty
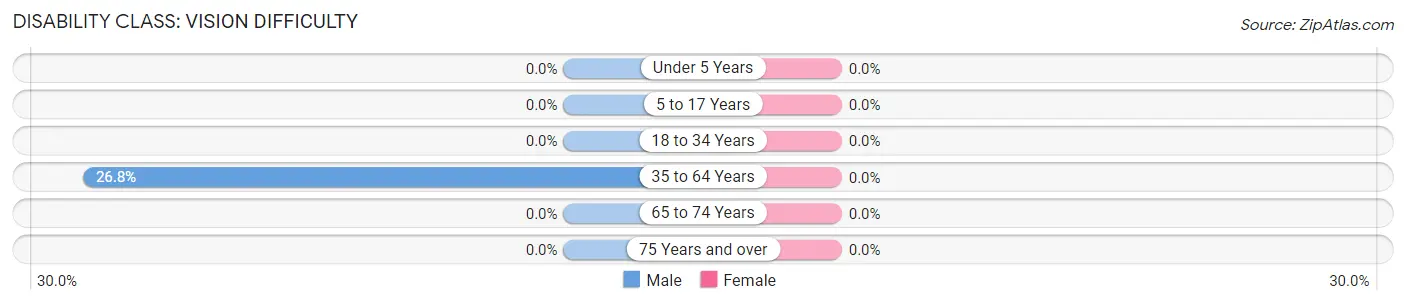
| Age Bracket | Male | Female |
| Under 5 Years | 0 (0.0%) | 0 (0.0%) |
| 5 to 17 Years | 0 (0.0%) | 0 (0.0%) |
| 18 to 34 Years | 0 (0.0%) | 0 (0.0%) |
| 35 to 64 Years | 88 (26.8%) | 0 (0.0%) |
| 65 to 74 Years | 0 (0.0%) | 0 (0.0%) |
| 75 Years and over | 0 (0.0%) | 0 (0.0%) |
Disability Class: Cognitive Difficulty
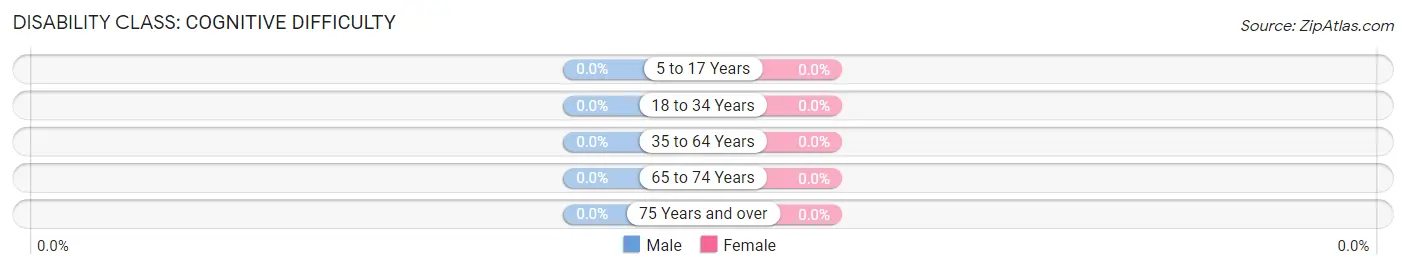
| Age Bracket | Male | Female |
| 5 to 17 Years | 0 (0.0%) | 0 (0.0%) |
| 18 to 34 Years | 0 (0.0%) | 0 (0.0%) |
| 35 to 64 Years | 0 (0.0%) | 0 (0.0%) |
| 65 to 74 Years | 0 (0.0%) | 0 (0.0%) |
| 75 Years and over | 0 (0.0%) | 0 (0.0%) |
Disability Class: Ambulatory Difficulty
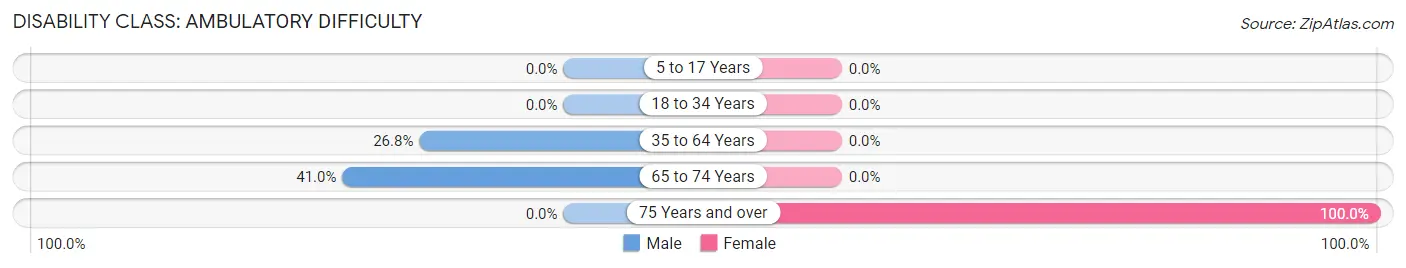
| Age Bracket | Male | Female |
| 5 to 17 Years | 0 (0.0%) | 0 (0.0%) |
| 18 to 34 Years | 0 (0.0%) | 0 (0.0%) |
| 35 to 64 Years | 88 (26.8%) | 0 (0.0%) |
| 65 to 74 Years | 16 (41.0%) | 0 (0.0%) |
| 75 Years and over | 0 (0.0%) | 15 (100.0%) |
Disability Class: Self-Care Difficulty
| Age Bracket | Male | Female |
| 5 to 17 Years | 0 (0.0%) | 0 (0.0%) |
| 18 to 34 Years | 0 (0.0%) | 0 (0.0%) |
| 35 to 64 Years | 0 (0.0%) | 0 (0.0%) |
| 65 to 74 Years | 0 (0.0%) | 0 (0.0%) |
| 75 Years and over | 0 (0.0%) | 0 (0.0%) |
Technology Access in Painted Hills
Computing Device Access in Painted Hills
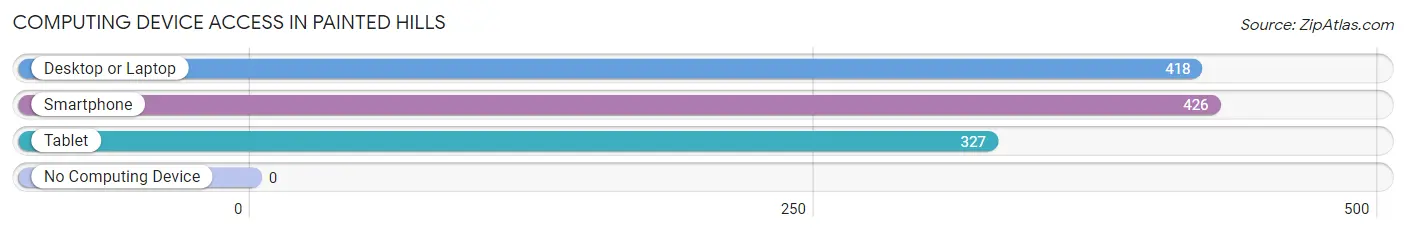
| Device Type | # Households | % Households |
| Desktop or Laptop | 418 | 98.1% |
| Smartphone | 426 | 100.0% |
| Tablet | 327 | 76.8% |
| No Computing Device | 0 | 0.0% |
| Total | 426 | 100.0% |
Internet Access in Painted Hills
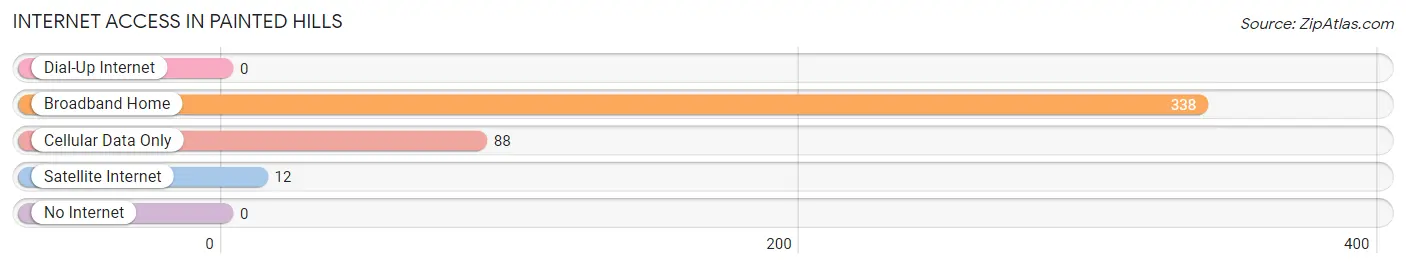
| Internet Type | # Households | % Households |
| Dial-Up Internet | 0 | 0.0% |
| Broadband Home | 338 | 79.3% |
| Cellular Data Only | 88 | 20.7% |
| Satellite Internet | 12 | 2.8% |
| No Internet | 0 | 0.0% |
| Total | 426 | 100.0% |
Painted Hills Summary
Painted Hills is a small town located in the state of Indiana, in the United States. It is situated in the northwest corner of the state, in the county of Porter. The town is located on the banks of the Kankakee River, and is surrounded by rolling hills and farmland. The population of Painted Hills was 1,845 in the year 2000, according to the United States Census Bureau.
Geography
Painted Hills is located in the northwest corner of Indiana, in the county of Porter. The town is situated on the banks of the Kankakee River, and is surrounded by rolling hills and farmland. The town is located at an elevation of 690 feet above sea level. The climate in Painted Hills is classified as humid continental, with hot summers and cold winters. The average annual temperature is around 50 degrees Fahrenheit, with an average high of around 75 degrees in the summer and an average low of around 25 degrees in the winter.
Economy
The economy of Painted Hills is largely based on agriculture and manufacturing. The town is home to several small businesses, including a grocery store, a hardware store, and a few restaurants. The town also has a few small manufacturing plants, which produce a variety of products, including furniture, clothing, and automotive parts. The town is also home to a few small farms, which produce a variety of crops, including corn, soybeans, and wheat.
Demographics
The population of Painted Hills was 1,845 in the year 2000, according to the United States Census Bureau. The racial makeup of the town was 97.3% White, 0.7% African American, 0.2% Native American, 0.3% Asian, 0.1% Pacific Islander, 0.4% from other races, and 1.0% from two or more races. Hispanic or Latino of any race were 1.2% of the population.
The median income for a household in Painted Hills was $37,917, and the median income for a family was $45,938. The per capita income for the town was $17,945. About 8.2% of families and 10.2% of the population were below the poverty line, including 13.2% of those under age 18 and 8.3% of those age 65 or over.
History
Painted Hills was first settled in the early 1800s by a group of settlers from Ohio. The town was originally known as “Paint Creek”, and was later renamed “Painted Hills”. The town was officially incorporated in 1837.
In the late 1800s, the town was a major stop on the Chicago, Rock Island and Pacific Railroad. The railroad brought a great deal of economic growth to the town, and it soon became a bustling center of commerce.
In the early 1900s, the town was home to several large factories, including a furniture factory, a clothing factory, and a canning factory. These factories provided employment for many of the town’s residents, and helped to fuel the town’s economy.
In the late 1900s, the town began to decline, as many of the factories closed down. The town’s population began to decline as well, as many of the town’s residents moved away in search of better opportunities.
Today, Painted Hills is a small, quiet town. The town is still home to a few small businesses, and the town’s economy is largely based on agriculture and manufacturing. The town is also home to a few small farms, which produce a variety of crops, including corn, soybeans, and wheat.
Common Questions
What is Per Capita Income in Painted Hills?
Per Capita income in Painted Hills is $57,086.
What is the Median Family Income in Painted Hills?
Median Family Income in Painted Hills is $89,408.
What is the Median Household income in Painted Hills?
Median Household Income in Painted Hills is $89,123.
What is Inequality or Gini Index in Painted Hills?
Inequality or Gini Index in Painted Hills is 0.36.
What is the Total Population of Painted Hills?
Total Population of Painted Hills is 996.
What is the Total Male Population of Painted Hills?
Total Male Population of Painted Hills is 514.
What is the Total Female Population of Painted Hills?
Total Female Population of Painted Hills is 482.
What is the Ratio of Males per 100 Females in Painted Hills?
There are 106.64 Males per 100 Females in Painted Hills.
What is the Ratio of Females per 100 Males in Painted Hills?
There are 93.77 Females per 100 Males in Painted Hills.
What is the Median Population Age in Painted Hills?
Median Population Age in Painted Hills is 53.0 Years.
What is the Average Family Size in Painted Hills
Average Family Size in Painted Hills is 2.5 People.
What is the Average Household Size in Painted Hills
Average Household Size in Painted Hills is 2.3 People.
How Large is the Labor Force in Painted Hills?
There are 751 People in the Labor Forcein in Painted Hills.
What is the Percentage of People in the Labor Force in Painted Hills?
84.5% of People are in the Labor Force in Painted Hills.
What is the Unemployment Rate in Painted Hills?
Unemployment Rate in Painted Hills is 23.6%.