Renton, WA Map & Demographics
Renton Map
Renton Overview
$47,060
PER CAPITA INCOME
$109,054
AVG FAMILY INCOME
$92,292
AVG HOUSEHOLD INCOME
23.7%
WAGE / INCOME GAP [ % ]
76.3¢/ $1
WAGE / INCOME GAP [ $ ]
$9,812
FAMILY INCOME DEFICIT
0.42
INEQUALITY / GINI INDEX
105,355
TOTAL POPULATION
53,006
MALE POPULATION
52,349
FEMALE POPULATION
101.26
MALES / 100 FEMALES
98.76
FEMALES / 100 MALES
36.1
MEDIAN AGE
3.2
AVG FAMILY SIZE
2.6
AVG HOUSEHOLD SIZE
60,637
LABOR FORCE [ PEOPLE ]
70.7%
PERCENT IN LABOR FORCE
4.2%
UNEMPLOYMENT RATE
Renton Area Codes
Income in Renton
Income Overview in Renton
Per Capita Income in Renton is $47,060, while median incomes of families and households are $109,054 and $92,292 respectively.
| Characteristic | Number | Measure |
| Per Capita Income | 105,355 | $47,060 |
| Median Family Income | 24,704 | $109,054 |
| Mean Family Income | 24,704 | $135,614 |
| Median Household Income | 40,681 | $92,292 |
| Mean Household Income | 40,681 | $118,925 |
| Income Deficit | 24,704 | $9,812 |
| Wage / Income Gap (%) | 105,355 | 23.75% |
| Wage / Income Gap ($) | 105,355 | 76.25¢ per $1 |
| Gini / Inequality Index | 105,355 | 0.42 |
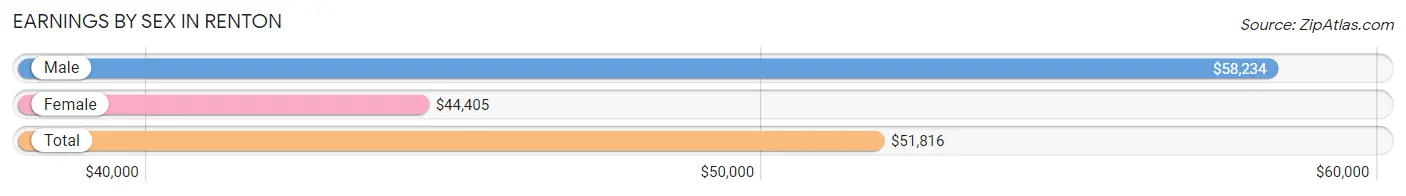
Earnings by Sex in Renton
Average Earnings in Renton are $51,816, $58,234 for men and $44,405 for women, a difference of 23.7%.
| Sex | Number | Average Earnings |
| Male | 33,799 (53.8%) | $58,234 |
| Female | 29,077 (46.2%) | $44,405 |
| Total | 62,876 (100.0%) | $51,816 |
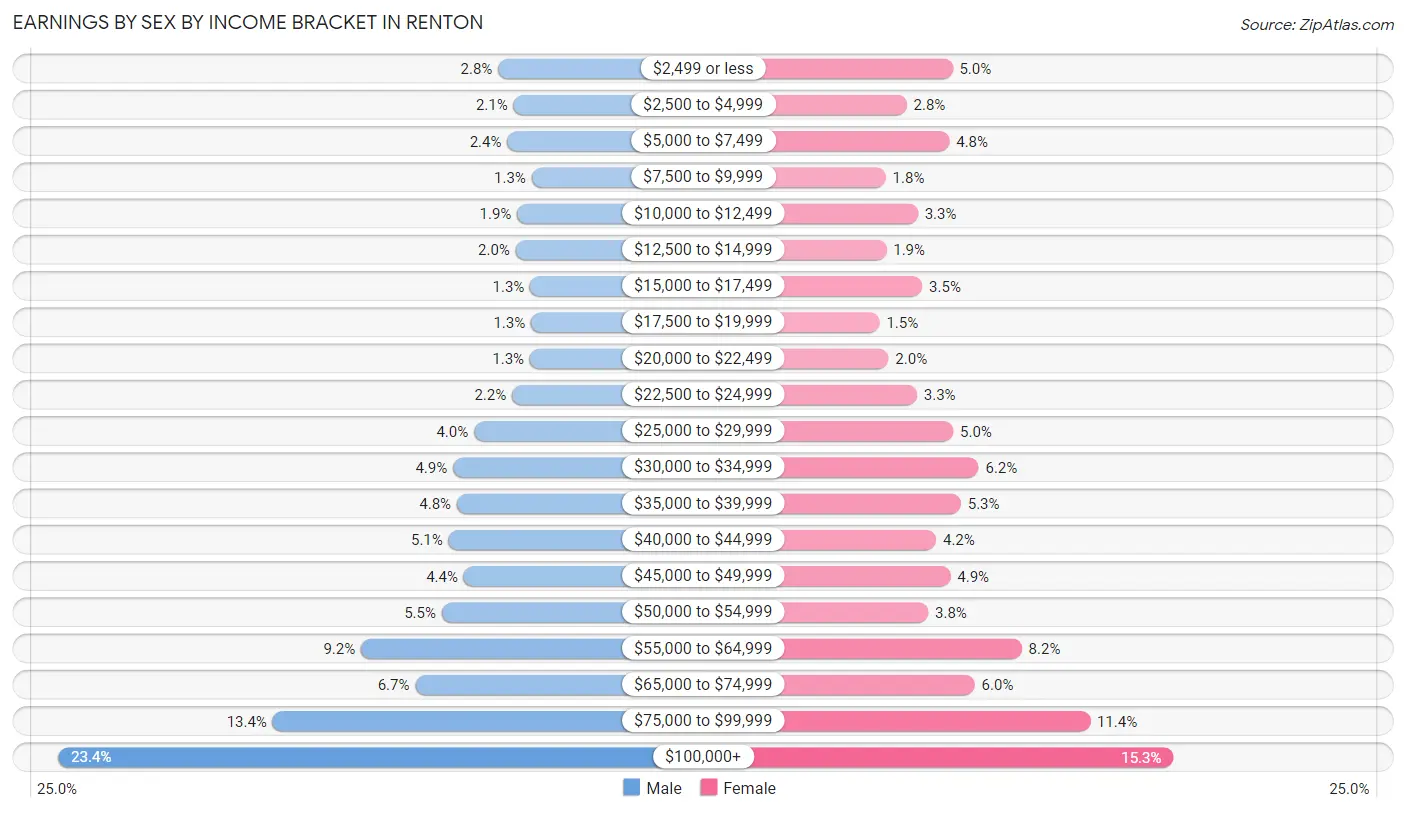
Earnings by Sex by Income Bracket in Renton
The most common earnings brackets in Renton are $100,000+ for men (7,919 | 23.4%) and $100,000+ for women (4,446 | 15.3%).
| Income | Male | Female |
| $2,499 or less | 953 (2.8%) | 1,439 (5.0%) |
| $2,500 to $4,999 | 710 (2.1%) | 813 (2.8%) |
| $5,000 to $7,499 | 807 (2.4%) | 1,396 (4.8%) |
| $7,500 to $9,999 | 423 (1.3%) | 528 (1.8%) |
| $10,000 to $12,499 | 653 (1.9%) | 966 (3.3%) |
| $12,500 to $14,999 | 676 (2.0%) | 539 (1.8%) |
| $15,000 to $17,499 | 446 (1.3%) | 1,026 (3.5%) |
| $17,500 to $19,999 | 434 (1.3%) | 446 (1.5%) |
| $20,000 to $22,499 | 450 (1.3%) | 568 (1.9%) |
| $22,500 to $24,999 | 732 (2.2%) | 953 (3.3%) |
| $25,000 to $29,999 | 1,334 (4.0%) | 1,447 (5.0%) |
| $30,000 to $34,999 | 1,666 (4.9%) | 1,794 (6.2%) |
| $35,000 to $39,999 | 1,604 (4.8%) | 1,552 (5.3%) |
| $40,000 to $44,999 | 1,737 (5.1%) | 1,214 (4.2%) |
| $45,000 to $49,999 | 1,498 (4.4%) | 1,410 (4.9%) |
| $50,000 to $54,999 | 1,844 (5.5%) | 1,108 (3.8%) |
| $55,000 to $64,999 | 3,124 (9.2%) | 2,380 (8.2%) |
| $65,000 to $74,999 | 2,266 (6.7%) | 1,741 (6.0%) |
| $75,000 to $99,999 | 4,523 (13.4%) | 3,311 (11.4%) |
| $100,000+ | 7,919 (23.4%) | 4,446 (15.3%) |
| Total | 33,799 (100.0%) | 29,077 (100.0%) |
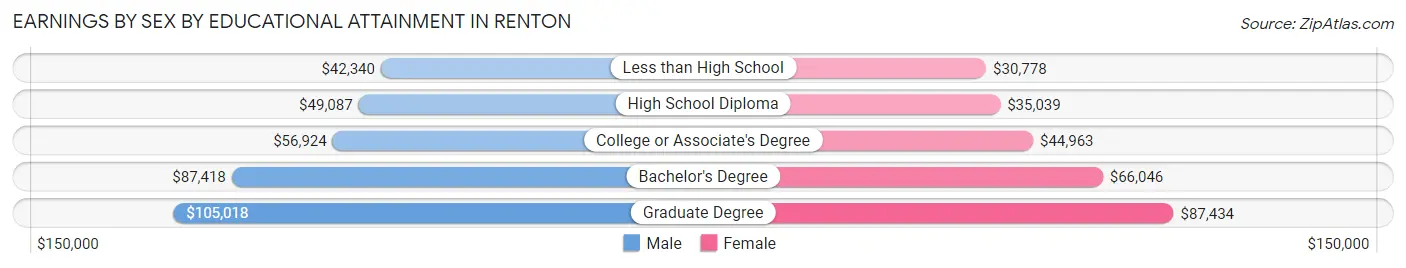
Earnings by Sex by Educational Attainment in Renton
Average earnings in Renton are $63,800 for men and $50,137 for women, a difference of 21.4%. Men with an educational attainment of graduate degree enjoy the highest average annual earnings of $105,018, while those with less than high school education earn the least with $42,340. Women with an educational attainment of graduate degree earn the most with the average annual earnings of $87,434, while those with less than high school education have the smallest earnings of $30,778.
| Educational Attainment | Male Income | Female Income |
| Less than High School | $42,340 | $30,778 |
| High School Diploma | $49,087 | $35,039 |
| College or Associate's Degree | $56,924 | $44,963 |
| Bachelor's Degree | $87,418 | $66,046 |
| Graduate Degree | $105,018 | $87,434 |
| Total | $63,800 | $50,137 |
Family Income in Renton
Family Income Brackets in Renton
According to the Renton family income data, there are 5,484 families falling into the $100,000 to $149,999 income range, which is the most common income bracket and makes up 22.2% of all families. Conversely, the $10,000 to $14,999 income bracket is the least frequent group with only 321 families (1.3%) belonging to this category.
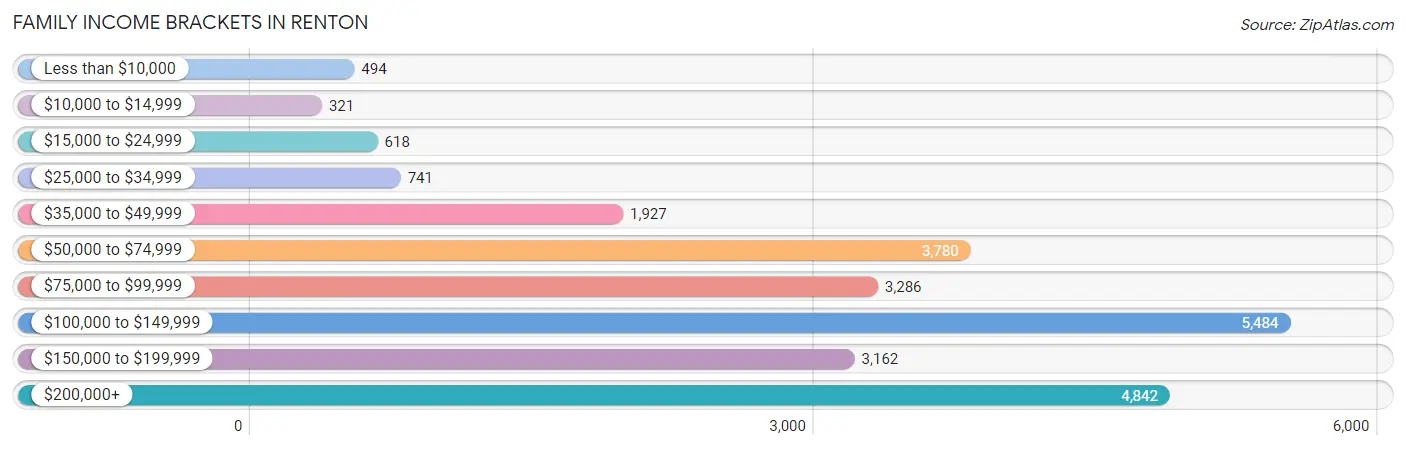
| Income Bracket | # Families | % Families |
| Less than $10,000 | 494 | 2.0% |
| $10,000 to $14,999 | 321 | 1.3% |
| $15,000 to $24,999 | 618 | 2.5% |
| $25,000 to $34,999 | 741 | 3.0% |
| $35,000 to $49,999 | 1,927 | 7.8% |
| $50,000 to $74,999 | 3,780 | 15.3% |
| $75,000 to $99,999 | 3,286 | 13.3% |
| $100,000 to $149,999 | 5,484 | 22.2% |
| $150,000 to $199,999 | 3,162 | 12.8% |
| $200,000+ | 4,842 | 19.6% |
Family Income by Famaliy Size in Renton
4-person families (4,951 | 20.0%) account for the highest median family income in Renton with $147,839 per family, while 2-person families (10,741 | 43.5%) have the highest median income of $46,126 per family member.
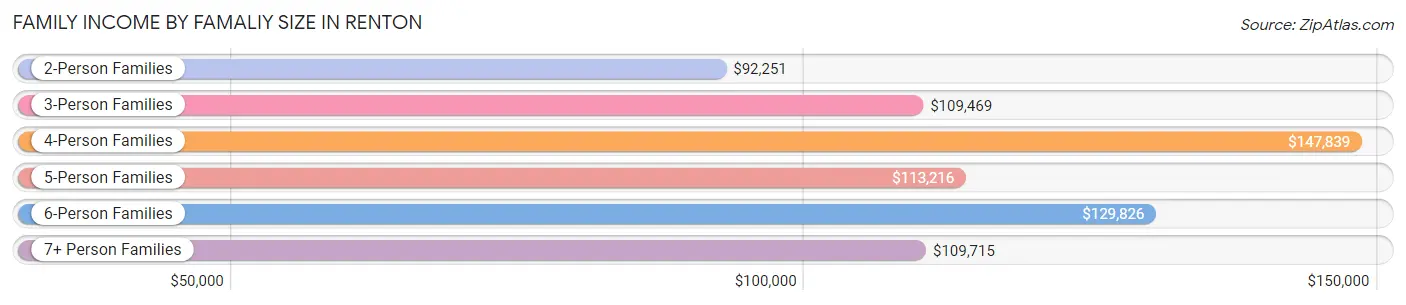
| Income Bracket | # Families | Median Income |
| 2-Person Families | 10,741 (43.5%) | $92,251 |
| 3-Person Families | 5,679 (23.0%) | $109,469 |
| 4-Person Families | 4,951 (20.0%) | $147,839 |
| 5-Person Families | 1,919 (7.8%) | $113,216 |
| 6-Person Families | 900 (3.6%) | $129,826 |
| 7+ Person Families | 514 (2.1%) | $109,715 |
| Total | 24,704 (100.0%) | $109,054 |
Family Income by Number of Earners in Renton
The median family income in Renton is $109,054, with families comprising 3+ earners (3,605) having the highest median family income of $144,551, while families with no earners (2,333) have the lowest median family income of $57,336, accounting for 14.6% and 9.4% of families, respectively.
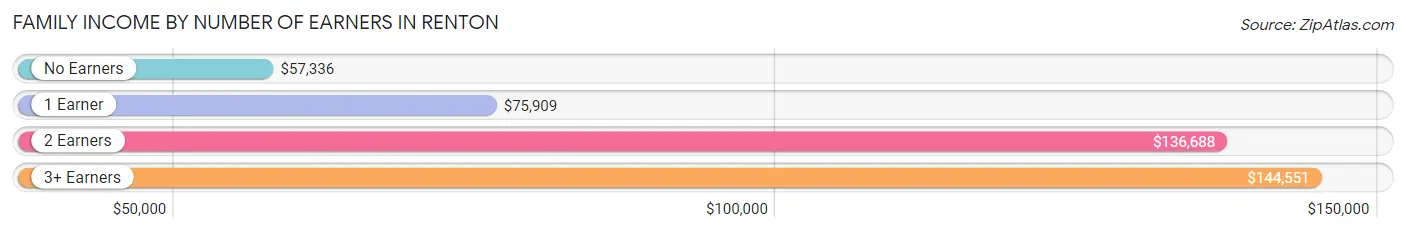
| Number of Earners | # Families | Median Income |
| No Earners | 2,333 (9.4%) | $57,336 |
| 1 Earner | 7,480 (30.3%) | $75,909 |
| 2 Earners | 11,286 (45.7%) | $136,688 |
| 3+ Earners | 3,605 (14.6%) | $144,551 |
| Total | 24,704 (100.0%) | $109,054 |
Household Income in Renton
Household Income Brackets in Renton
With 8,380 households falling in the category, the $100,000 to $149,999 income range is the most frequent in Renton, accounting for 20.6% of all households. In contrast, only 1,220 households (3.0%) fall into the $10,000 to $14,999 income bracket, making it the least populous group.
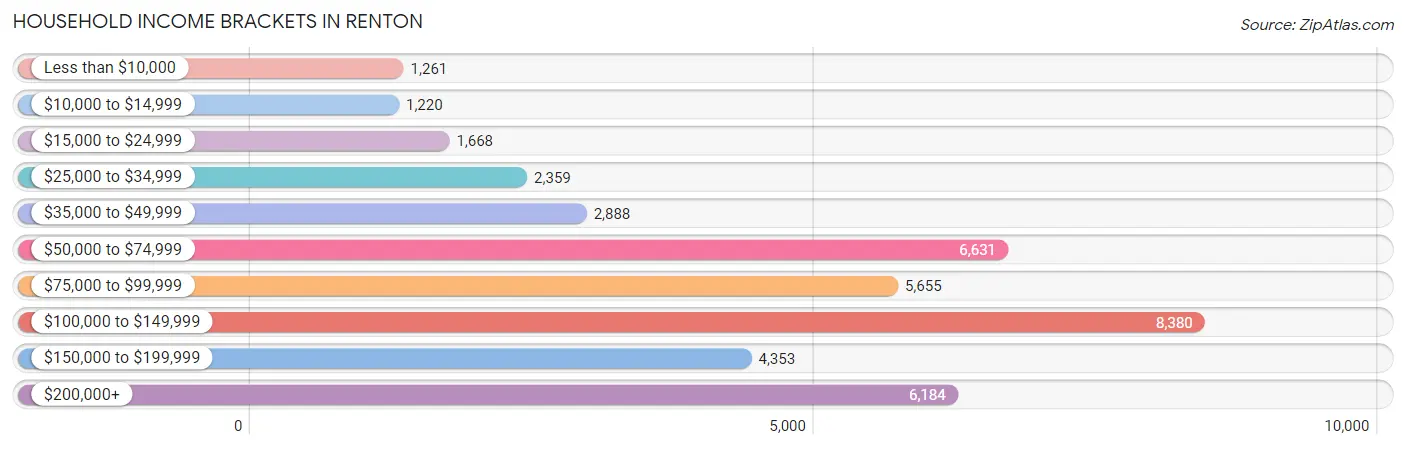
| Income Bracket | # Households | % Households |
| Less than $10,000 | 1,261 | 3.1% |
| $10,000 to $14,999 | 1,220 | 3.0% |
| $15,000 to $24,999 | 1,668 | 4.1% |
| $25,000 to $34,999 | 2,359 | 5.8% |
| $35,000 to $49,999 | 2,888 | 7.1% |
| $50,000 to $74,999 | 6,631 | 16.3% |
| $75,000 to $99,999 | 5,655 | 13.9% |
| $100,000 to $149,999 | 8,380 | 20.6% |
| $150,000 to $199,999 | 4,353 | 10.7% |
| $200,000+ | 6,184 | 15.2% |
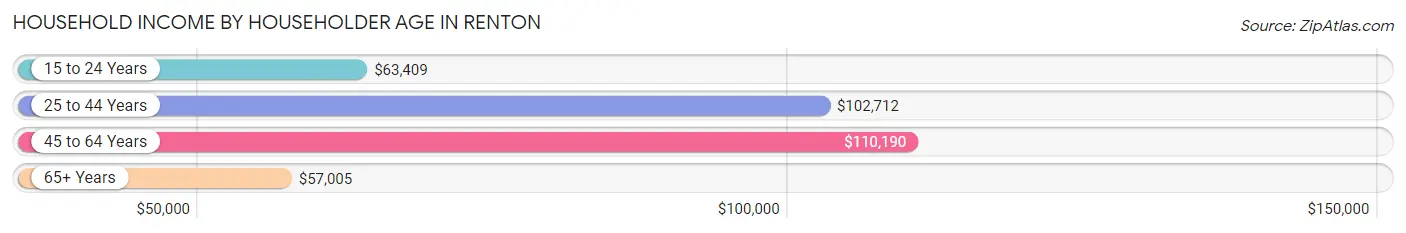
Household Income by Householder Age in Renton
The median household income in Renton is $92,292, with the highest median household income of $110,190 found in the 45 to 64 years age bracket for the primary householder. A total of 14,722 households (36.2%) fall into this category. Meanwhile, the 65+ years age bracket for the primary householder has the lowest median household income of $57,005, with 7,226 households (17.8%) in this group.
| Income Bracket | # Households | Median Income |
| 15 to 24 Years | 1,866 (4.6%) | $63,409 |
| 25 to 44 Years | 16,867 (41.5%) | $102,712 |
| 45 to 64 Years | 14,722 (36.2%) | $110,190 |
| 65+ Years | 7,226 (17.8%) | $57,005 |
| Total | 40,681 (100.0%) | $92,292 |
Poverty in Renton
Income Below Poverty by Sex and Age in Renton
With 7.2% poverty level for males and 8.6% for females among the residents of Renton, 18 to 24 year old males and 25 to 34 year old females are the most vulnerable to poverty, with 566 males (12.1%) and 1,005 females (10.3%) in their respective age groups living below the poverty level.
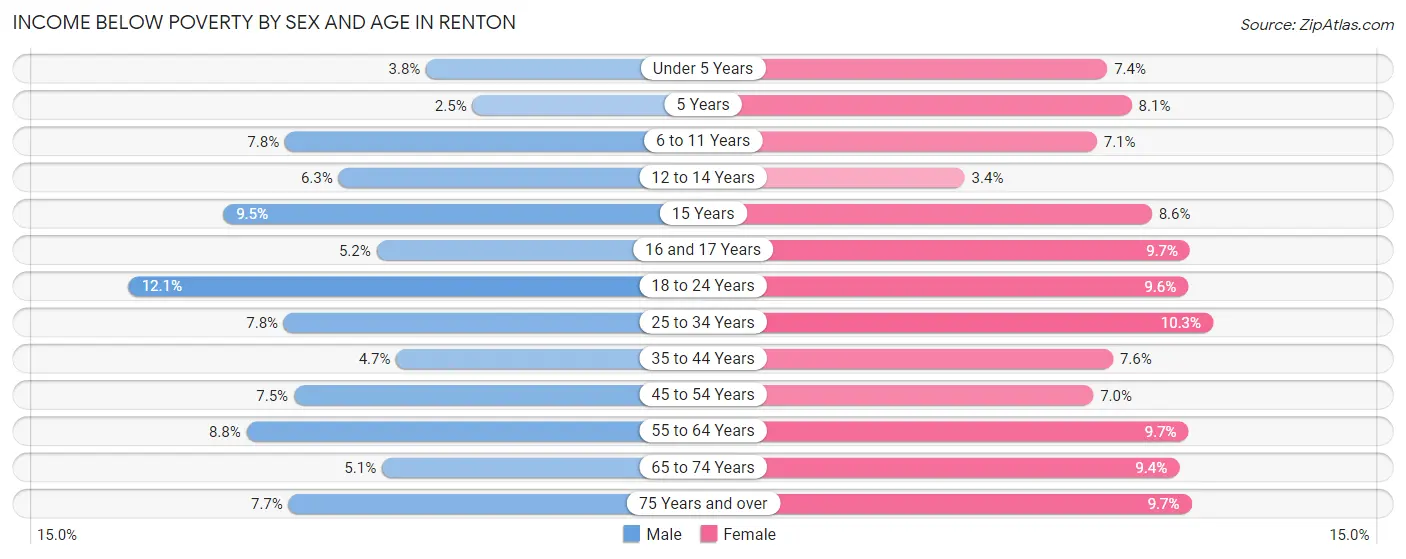
| Age Bracket | Male | Female |
| Under 5 Years | 139 (3.8%) | 232 (7.4%) |
| 5 Years | 11 (2.5%) | 68 (8.1%) |
| 6 to 11 Years | 286 (7.7%) | 219 (7.1%) |
| 12 to 14 Years | 91 (6.3%) | 66 (3.4%) |
| 15 Years | 50 (9.5%) | 43 (8.6%) |
| 16 and 17 Years | 55 (5.2%) | 106 (9.7%) |
| 18 to 24 Years | 566 (12.1%) | 405 (9.6%) |
| 25 to 34 Years | 789 (7.8%) | 1,005 (10.3%) |
| 35 to 44 Years | 374 (4.6%) | 570 (7.5%) |
| 45 to 54 Years | 567 (7.5%) | 472 (7.0%) |
| 55 to 64 Years | 540 (8.8%) | 550 (9.7%) |
| 65 to 74 Years | 157 (5.1%) | 401 (9.4%) |
| 75 Years and over | 168 (7.6%) | 321 (9.7%) |
| Total | 3,793 (7.2%) | 4,458 (8.6%) |
Income Above Poverty by Sex and Age in Renton
According to the poverty statistics in Renton, males aged 5 years and females aged 12 to 14 years are the age groups that are most secure financially, with 97.5% of males and 96.6% of females in these age groups living above the poverty line.
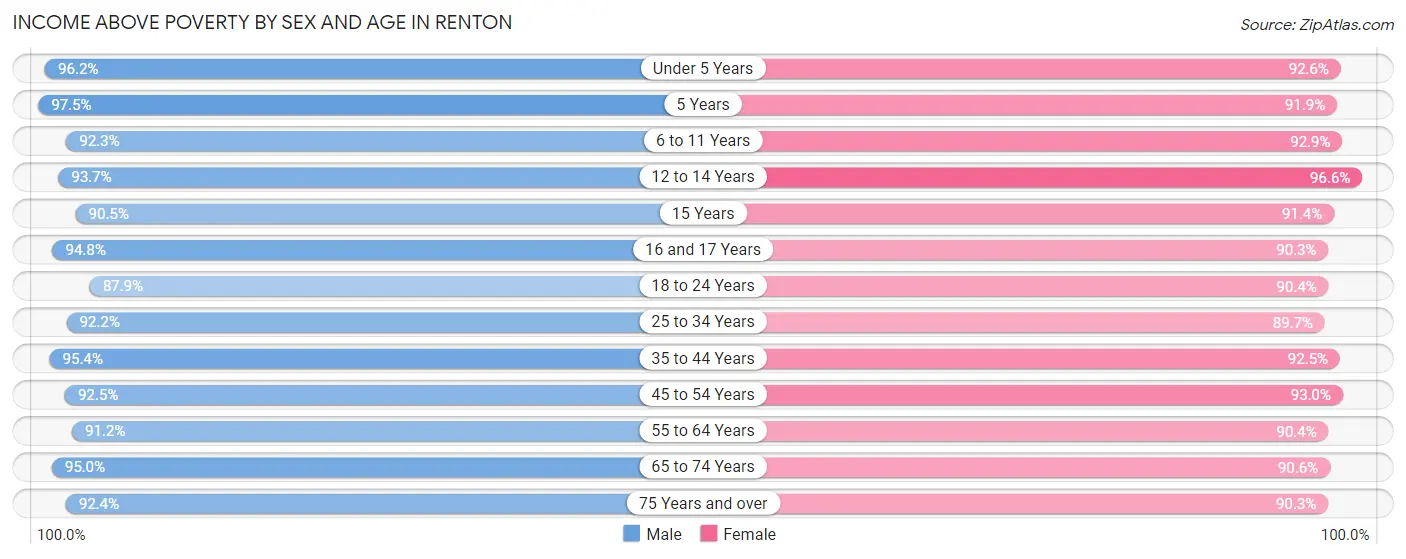
| Age Bracket | Male | Female |
| Under 5 Years | 3,504 (96.2%) | 2,906 (92.6%) |
| 5 Years | 423 (97.5%) | 775 (91.9%) |
| 6 to 11 Years | 3,405 (92.2%) | 2,865 (92.9%) |
| 12 to 14 Years | 1,362 (93.7%) | 1,865 (96.6%) |
| 15 Years | 478 (90.5%) | 455 (91.4%) |
| 16 and 17 Years | 1,002 (94.8%) | 988 (90.3%) |
| 18 to 24 Years | 4,113 (87.9%) | 3,798 (90.4%) |
| 25 to 34 Years | 9,346 (92.2%) | 8,720 (89.7%) |
| 35 to 44 Years | 7,675 (95.4%) | 6,978 (92.4%) |
| 45 to 54 Years | 6,994 (92.5%) | 6,275 (93.0%) |
| 55 to 64 Years | 5,582 (91.2%) | 5,149 (90.3%) |
| 65 to 74 Years | 2,950 (95.0%) | 3,868 (90.6%) |
| 75 Years and over | 2,027 (92.3%) | 2,978 (90.3%) |
| Total | 48,861 (92.8%) | 47,620 (91.4%) |
Income Below Poverty Among Married-Couple Families in Renton
The poverty statistics for married-couple families in Renton show that 2.7% or 486 of the total 17,760 families live below the poverty line. Families with 3 or 4 children have the highest poverty rate of 5.0%, comprising of 60 families. On the other hand, families with 5 or more children have the lowest poverty rate of 0.0%, which includes 0 families.
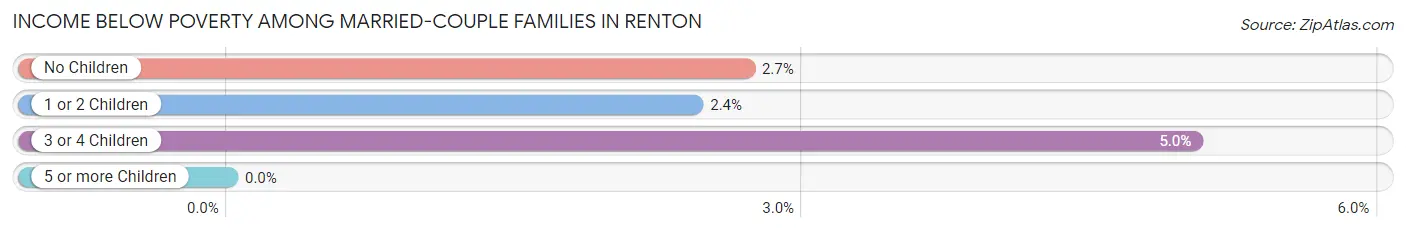
| Children | Above Poverty | Below Poverty |
| No Children | 9,074 (97.3%) | 252 (2.7%) |
| 1 or 2 Children | 6,980 (97.6%) | 174 (2.4%) |
| 3 or 4 Children | 1,130 (95.0%) | 60 (5.0%) |
| 5 or more Children | 90 (100.0%) | 0 (0.0%) |
| Total | 17,274 (97.3%) | 486 (2.7%) |
Income Below Poverty Among Single-Parent Households in Renton
According to the poverty data in Renton, 6.2% or 171 single-father households and 16.4% or 686 single-mother households are living below the poverty line. Among single-father households, those with 1 or 2 children have the highest poverty rate, with 76 households (6.7%) experiencing poverty. Likewise, among single-mother households, those with 5 or more children have the highest poverty rate, with 4 households (100.0%) falling below the poverty line.
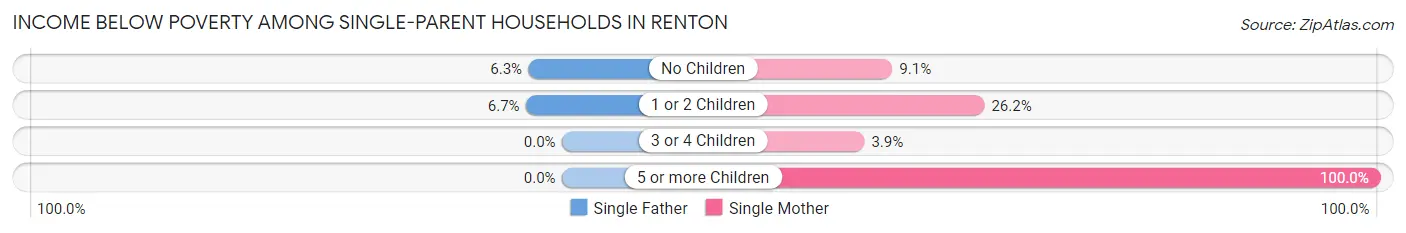
| Children | Single Father | Single Mother |
| No Children | 95 (6.2%) | 157 (9.1%) |
| 1 or 2 Children | 76 (6.7%) | 505 (26.2%) |
| 3 or 4 Children | 0 (0.0%) | 20 (3.9%) |
| 5 or more Children | 0 (0.0%) | 4 (100.0%) |
| Total | 171 (6.2%) | 686 (16.4%) |
Income Below Poverty Among Married-Couple vs Single-Parent Households in Renton
The poverty data for Renton shows that 486 of the married-couple family households (2.7%) and 857 of the single-parent households (12.3%) are living below the poverty level. Within the married-couple family households, those with 3 or 4 children have the highest poverty rate, with 60 households (5.0%) falling below the poverty line. Among the single-parent households, those with 5 or more children have the highest poverty rate, with 4 household (100.0%) living below poverty.
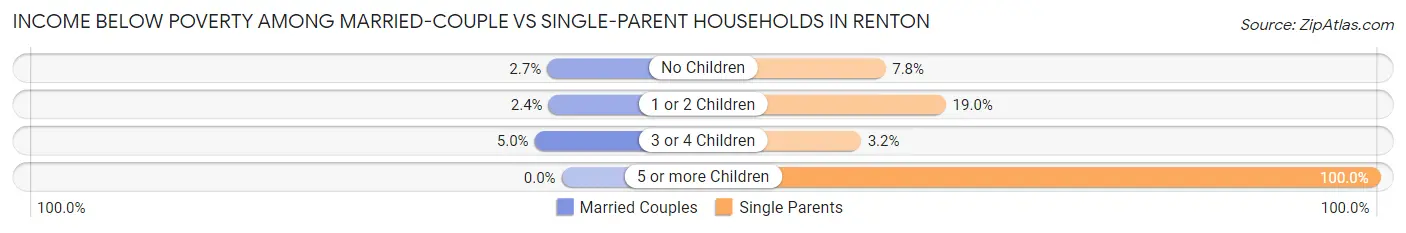
| Children | Married-Couple Families | Single-Parent Households |
| No Children | 252 (2.7%) | 252 (7.7%) |
| 1 or 2 Children | 174 (2.4%) | 581 (19.0%) |
| 3 or 4 Children | 60 (5.0%) | 20 (3.2%) |
| 5 or more Children | 0 (0.0%) | 4 (100.0%) |
| Total | 486 (2.7%) | 857 (12.3%) |
Race in Renton
The most populous races in Renton are White / Caucasian (48,024 | 45.6%), Asian (27,628 | 26.2%), and Hispanic or Latino (15,564 | 14.8%).
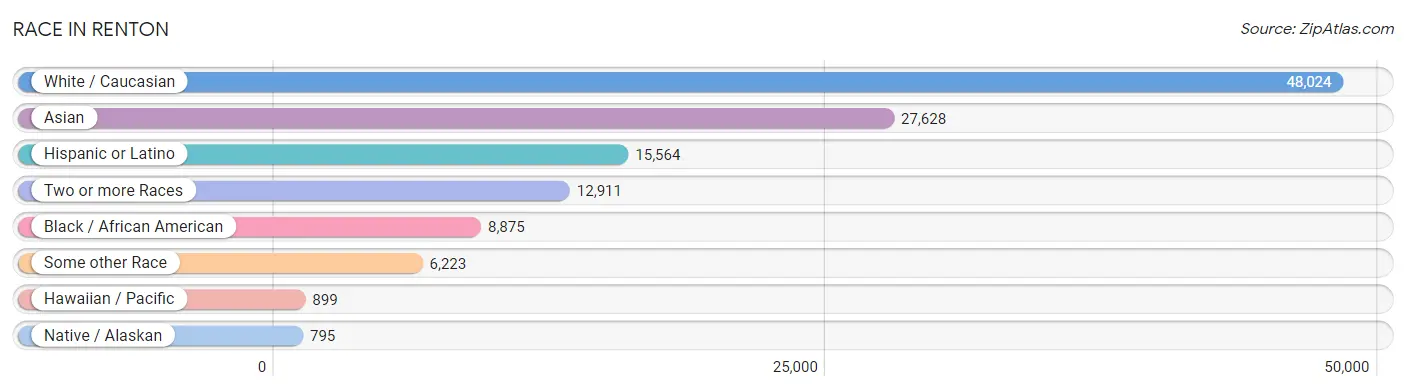
| Race | # Population | % Population |
| Asian | 27,628 | 26.2% |
| Black / African American | 8,875 | 8.4% |
| Hawaiian / Pacific | 899 | 0.9% |
| Hispanic or Latino | 15,564 | 14.8% |
| Native / Alaskan | 795 | 0.7% |
| White / Caucasian | 48,024 | 45.6% |
| Two or more Races | 12,911 | 12.2% |
| Some other Race | 6,223 | 5.9% |
| Total | 105,355 | 100.0% |
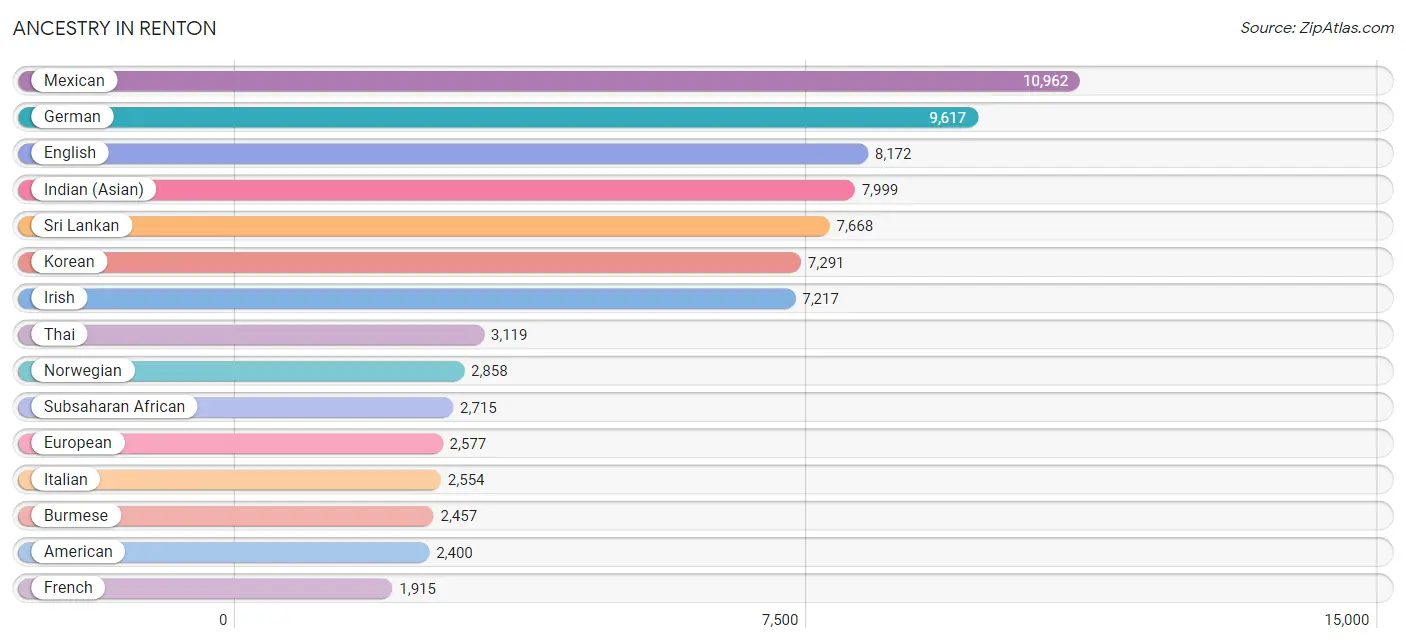
Ancestry in Renton
The most populous ancestries reported in Renton are Mexican (10,962 | 10.4%), German (9,617 | 9.1%), English (8,172 | 7.8%), Indian (Asian) (7,999 | 7.6%), and Sri Lankan (7,668 | 7.3%), together accounting for 42.2% of all Renton residents.
| Ancestry | # Population | % Population |
| African | 260 | 0.3% |
| Alaskan Athabascan | 75 | 0.1% |
| Aleut | 21 | 0.0% |
| American | 2,400 | 2.3% |
| Apache | 56 | 0.1% |
| Arab | 573 | 0.5% |
| Argentinean | 27 | 0.0% |
| Armenian | 349 | 0.3% |
| Australian | 28 | 0.0% |
| Austrian | 146 | 0.1% |
| Bangladeshi | 160 | 0.2% |
| Basque | 20 | 0.0% |
| Belgian | 41 | 0.0% |
| Belizean | 87 | 0.1% |
| Bhutanese | 1,699 | 1.6% |
| Blackfeet | 204 | 0.2% |
| Brazilian | 612 | 0.6% |
| British | 770 | 0.7% |
| British West Indian | 16 | 0.0% |
| Bulgarian | 121 | 0.1% |
| Burmese | 2,457 | 2.3% |
| Cajun | 12 | 0.0% |
| Cambodian | 32 | 0.0% |
| Canadian | 240 | 0.2% |
| Central American | 1,427 | 1.3% |
| Central American Indian | 246 | 0.2% |
| Cherokee | 808 | 0.8% |
| Chilean | 346 | 0.3% |
| Chinese | 11 | 0.0% |
| Chippewa | 195 | 0.2% |
| Choctaw | 173 | 0.2% |
| Colombian | 320 | 0.3% |
| Colville | 13 | 0.0% |
| Comanche | 20 | 0.0% |
| Costa Rican | 80 | 0.1% |
| Cree | 61 | 0.1% |
| Croatian | 114 | 0.1% |
| Cuban | 96 | 0.1% |
| Czech | 282 | 0.3% |
| Czechoslovakian | 17 | 0.0% |
| Danish | 379 | 0.4% |
| Dominican | 77 | 0.1% |
| Dutch | 1,001 | 0.9% |
| Eastern European | 455 | 0.4% |
| Ecuadorian | 47 | 0.0% |
| Egyptian | 149 | 0.1% |
| English | 8,172 | 7.8% |
| Ethiopian | 548 | 0.5% |
| European | 2,577 | 2.5% |
| Fijian | 22 | 0.0% |
| Filipino | 543 | 0.5% |
| Finnish | 372 | 0.4% |
| French | 1,915 | 1.8% |
| French American Indian | 23 | 0.0% |
| French Canadian | 256 | 0.2% |
| German | 9,617 | 9.1% |
| German Russian | 11 | 0.0% |
| Ghanaian | 76 | 0.1% |
| Greek | 192 | 0.2% |
| Guamanian / Chamorro | 286 | 0.3% |
| Guatemalan | 616 | 0.6% |
| Haitian | 99 | 0.1% |
| Honduran | 99 | 0.1% |
| Hungarian | 135 | 0.1% |
| Icelander | 149 | 0.1% |
| Indian (Asian) | 7,999 | 7.6% |
| Indonesian | 17 | 0.0% |
| Inupiat | 10 | 0.0% |
| Iranian | 161 | 0.2% |
| Iraqi | 48 | 0.1% |
| Irish | 7,217 | 6.9% |
| Iroquois | 20 | 0.0% |
| Israeli | 28 | 0.0% |
| Italian | 2,554 | 2.4% |
| Jamaican | 89 | 0.1% |
| Japanese | 1,696 | 1.6% |
| Kenyan | 88 | 0.1% |
| Kiowa | 10 | 0.0% |
| Korean | 7,291 | 6.9% |
| Laotian | 25 | 0.0% |
| Latvian | 144 | 0.1% |
| Lebanese | 83 | 0.1% |
| Liberian | 10 | 0.0% |
| Lithuanian | 98 | 0.1% |
| Lumbee | 9 | 0.0% |
| Luxembourger | 18 | 0.0% |
| Macedonian | 45 | 0.0% |
| Malaysian | 944 | 0.9% |
| Mexican | 10,962 | 10.4% |
| Mexican American Indian | 421 | 0.4% |
| Mongolian | 29 | 0.0% |
| Moroccan | 103 | 0.1% |
| Native Hawaiian | 308 | 0.3% |
| Nepalese | 156 | 0.2% |
| New Zealander | 6 | 0.0% |
| Nicaraguan | 44 | 0.0% |
| Nigerian | 68 | 0.1% |
| Northern European | 471 | 0.4% |
| Norwegian | 2,858 | 2.7% |
| Pakistani | 241 | 0.2% |
| Palestinian | 49 | 0.1% |
| Panamanian | 96 | 0.1% |
| Paraguayan | 46 | 0.0% |
| Peruvian | 80 | 0.1% |
| Polish | 1,312 | 1.3% |
| Portuguese | 251 | 0.2% |
| Puerto Rican | 996 | 0.9% |
| Puget Sound Salish | 39 | 0.0% |
| Romanian | 388 | 0.4% |
| Russian | 1,054 | 1.0% |
| Salvadoran | 492 | 0.5% |
| Samoan | 840 | 0.8% |
| Scandinavian | 632 | 0.6% |
| Scotch-Irish | 619 | 0.6% |
| Scottish | 1,692 | 1.6% |
| Serbian | 9 | 0.0% |
| Sioux | 21 | 0.0% |
| Slavic | 61 | 0.1% |
| Slovak | 137 | 0.1% |
| Slovene | 101 | 0.1% |
| Somali | 599 | 0.6% |
| South African | 97 | 0.1% |
| South American | 941 | 0.9% |
| Spaniard | 565 | 0.5% |
| Spanish | 123 | 0.1% |
| Sri Lankan | 7,668 | 7.3% |
| Subsaharan African | 2,715 | 2.6% |
| Sudanese | 91 | 0.1% |
| Swedish | 1,401 | 1.3% |
| Swiss | 195 | 0.2% |
| Syrian | 16 | 0.0% |
| Thai | 3,119 | 3.0% |
| Tlingit-Haida | 25 | 0.0% |
| Tongan | 224 | 0.2% |
| Trinidadian and Tobagonian | 50 | 0.1% |
| Tsimshian | 4 | 0.0% |
| Turkish | 123 | 0.1% |
| Ukrainian | 746 | 0.7% |
| Uruguayan | 21 | 0.0% |
| Venezuelan | 54 | 0.1% |
| Welsh | 704 | 0.7% |
| West Indian | 174 | 0.2% |
| Yaqui | 58 | 0.1% |
| Yugoslavian | 35 | 0.0% | View All 144 Rows |
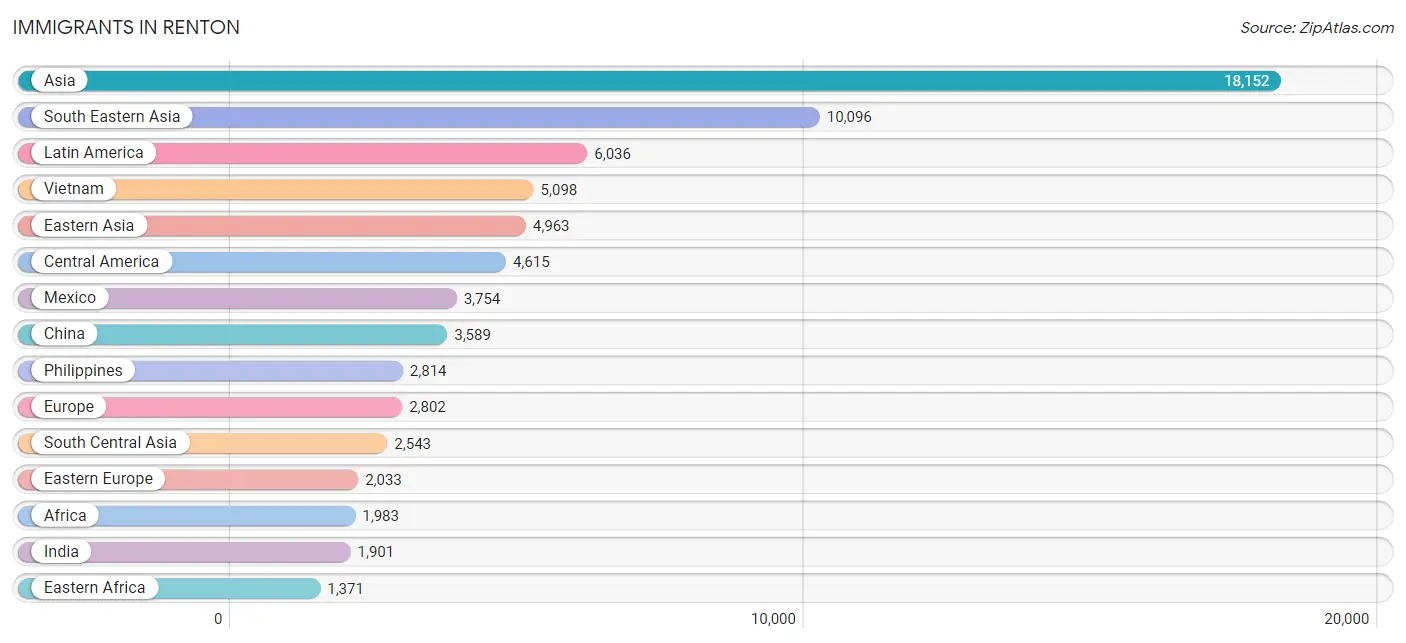
Immigrants in Renton
The most numerous immigrant groups reported in Renton came from Asia (18,152 | 17.2%), South Eastern Asia (10,096 | 9.6%), Latin America (6,036 | 5.7%), Vietnam (5,098 | 4.8%), and Eastern Asia (4,963 | 4.7%), together accounting for 42.1% of all Renton residents.
| Immigration Origin | # Population | % Population |
| Africa | 1,983 | 1.9% |
| Armenia | 32 | 0.0% |
| Asia | 18,152 | 17.2% |
| Australia | 78 | 0.1% |
| Austria | 3 | 0.0% |
| Belarus | 101 | 0.1% |
| Belgium | 11 | 0.0% |
| Bosnia and Herzegovina | 23 | 0.0% |
| Brazil | 612 | 0.6% |
| Bulgaria | 25 | 0.0% |
| Cambodia | 754 | 0.7% |
| Cameroon | 53 | 0.1% |
| Canada | 471 | 0.4% |
| Caribbean | 172 | 0.2% |
| Central America | 4,615 | 4.4% |
| Chile | 331 | 0.3% |
| China | 3,589 | 3.4% |
| Colombia | 84 | 0.1% |
| Cuba | 8 | 0.0% |
| Czechoslovakia | 31 | 0.0% |
| Dominican Republic | 77 | 0.1% |
| Eastern Africa | 1,371 | 1.3% |
| Eastern Asia | 4,963 | 4.7% |
| Eastern Europe | 2,033 | 1.9% |
| Ecuador | 24 | 0.0% |
| Egypt | 117 | 0.1% |
| El Salvador | 417 | 0.4% |
| England | 138 | 0.1% |
| Eritrea | 277 | 0.3% |
| Ethiopia | 476 | 0.4% |
| Europe | 2,802 | 2.7% |
| Fiji | 16 | 0.0% |
| France | 40 | 0.0% |
| Germany | 98 | 0.1% |
| Ghana | 76 | 0.1% |
| Grenada | 8 | 0.0% |
| Guatemala | 316 | 0.3% |
| Guyana | 40 | 0.0% |
| Haiti | 25 | 0.0% |
| Honduras | 88 | 0.1% |
| Hong Kong | 502 | 0.5% |
| Hungary | 26 | 0.0% |
| India | 1,901 | 1.8% |
| Indonesia | 291 | 0.3% |
| Iran | 171 | 0.2% |
| Iraq | 67 | 0.1% |
| Ireland | 185 | 0.2% |
| Israel | 13 | 0.0% |
| Jamaica | 54 | 0.1% |
| Japan | 268 | 0.3% |
| Jordan | 22 | 0.0% |
| Kazakhstan | 44 | 0.0% |
| Kenya | 227 | 0.2% |
| Korea | 1,063 | 1.0% |
| Kuwait | 10 | 0.0% |
| Laos | 483 | 0.5% |
| Latin America | 6,036 | 5.7% |
| Liberia | 10 | 0.0% |
| Lithuania | 19 | 0.0% |
| Malaysia | 38 | 0.0% |
| Mexico | 3,754 | 3.6% |
| Middle Africa | 53 | 0.1% |
| Moldova | 296 | 0.3% |
| Morocco | 106 | 0.1% |
| Nepal | 20 | 0.0% |
| Netherlands | 38 | 0.0% |
| Nicaragua | 18 | 0.0% |
| North Macedonia | 46 | 0.0% |
| Northern Africa | 223 | 0.2% |
| Northern Europe | 439 | 0.4% |
| Oceania | 360 | 0.3% |
| Pakistan | 41 | 0.0% |
| Panama | 22 | 0.0% |
| Peru | 80 | 0.1% |
| Philippines | 2,814 | 2.7% |
| Poland | 26 | 0.0% |
| Romania | 160 | 0.2% |
| Russia | 567 | 0.5% |
| Saudi Arabia | 54 | 0.1% |
| Serbia | 9 | 0.0% |
| Singapore | 200 | 0.2% |
| Somalia | 284 | 0.3% |
| South Africa | 22 | 0.0% |
| South America | 1,249 | 1.2% |
| South Central Asia | 2,543 | 2.4% |
| South Eastern Asia | 10,096 | 9.6% |
| Southern Europe | 140 | 0.1% |
| Spain | 140 | 0.1% |
| Sri Lanka | 84 | 0.1% |
| Sweden | 20 | 0.0% |
| Syria | 46 | 0.0% |
| Taiwan | 522 | 0.5% |
| Thailand | 406 | 0.4% |
| Turkey | 123 | 0.1% |
| Ukraine | 562 | 0.5% |
| Uzbekistan | 226 | 0.2% |
| Venezuela | 54 | 0.1% |
| Vietnam | 5,098 | 4.8% |
| Western Africa | 258 | 0.2% |
| Western Asia | 544 | 0.5% |
| Western Europe | 190 | 0.2% |
| Zimbabwe | 58 | 0.1% | View All 102 Rows |
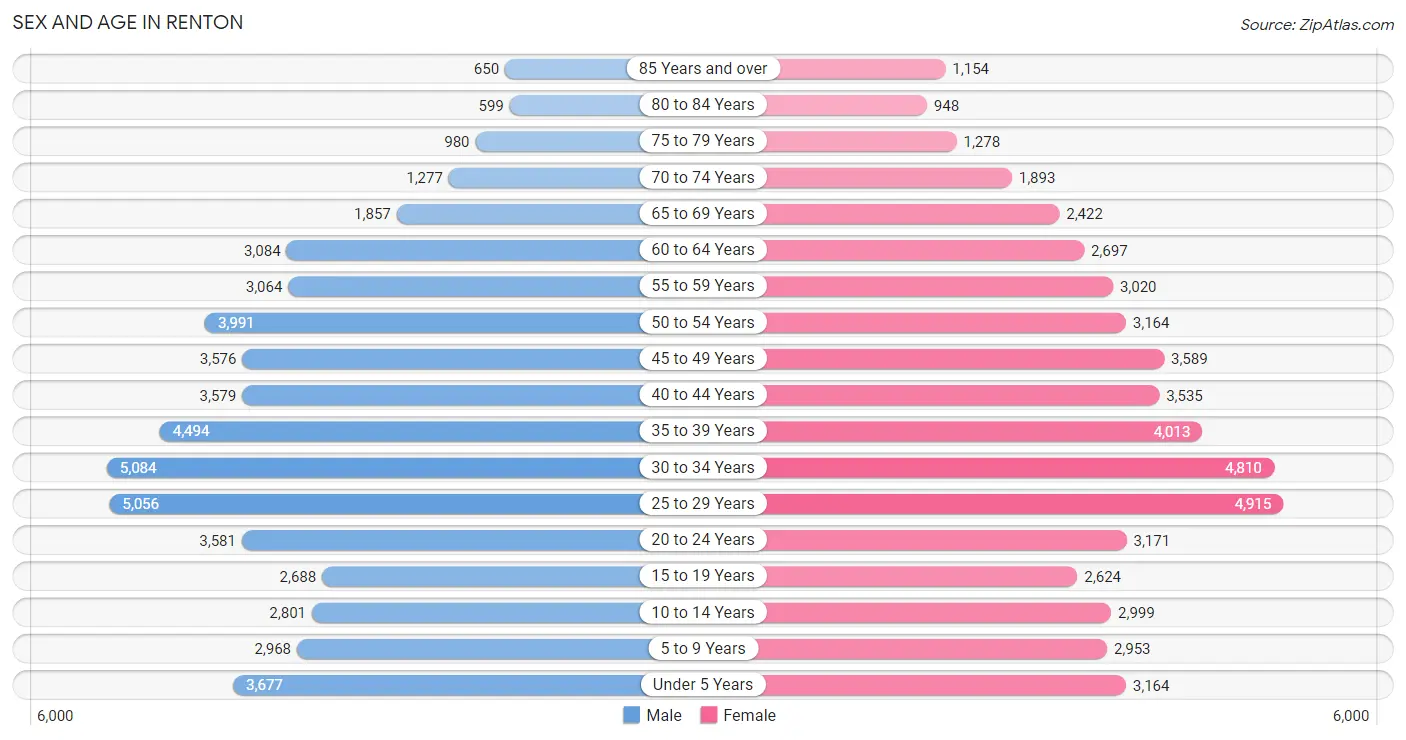
Sex and Age in Renton
Sex and Age in Renton
The most populous age groups in Renton are 30 to 34 Years (5,084 | 9.6%) for men and 25 to 29 Years (4,915 | 9.4%) for women.
| Age Bracket | Male | Female |
| Under 5 Years | 3,677 (6.9%) | 3,164 (6.0%) |
| 5 to 9 Years | 2,968 (5.6%) | 2,953 (5.6%) |
| 10 to 14 Years | 2,801 (5.3%) | 2,999 (5.7%) |
| 15 to 19 Years | 2,688 (5.1%) | 2,624 (5.0%) |
| 20 to 24 Years | 3,581 (6.8%) | 3,171 (6.1%) |
| 25 to 29 Years | 5,056 (9.5%) | 4,915 (9.4%) |
| 30 to 34 Years | 5,084 (9.6%) | 4,810 (9.2%) |
| 35 to 39 Years | 4,494 (8.5%) | 4,013 (7.7%) |
| 40 to 44 Years | 3,579 (6.8%) | 3,535 (6.8%) |
| 45 to 49 Years | 3,576 (6.8%) | 3,589 (6.9%) |
| 50 to 54 Years | 3,991 (7.5%) | 3,164 (6.0%) |
| 55 to 59 Years | 3,064 (5.8%) | 3,020 (5.8%) |
| 60 to 64 Years | 3,084 (5.8%) | 2,697 (5.1%) |
| 65 to 69 Years | 1,857 (3.5%) | 2,422 (4.6%) |
| 70 to 74 Years | 1,277 (2.4%) | 1,893 (3.6%) |
| 75 to 79 Years | 980 (1.8%) | 1,278 (2.4%) |
| 80 to 84 Years | 599 (1.1%) | 948 (1.8%) |
| 85 Years and over | 650 (1.2%) | 1,154 (2.2%) |
| Total | 53,006 (100.0%) | 52,349 (100.0%) |
Families and Households in Renton
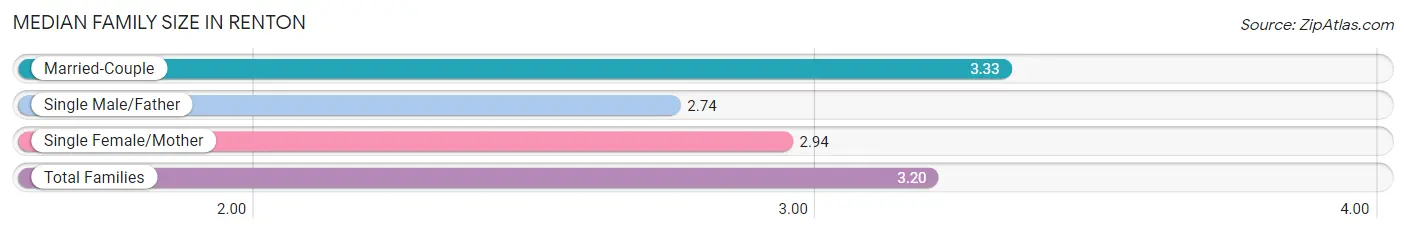
Median Family Size in Renton
The median family size in Renton is 3.20 persons per family, with married-couple families (17,760 | 71.9%) accounting for the largest median family size of 3.33 persons per family. On the other hand, single male/father families (2,770 | 11.2%) represent the smallest median family size with 2.74 persons per family.
| Family Type | # Families | Family Size |
| Married-Couple | 17,760 (71.9%) | 3.33 |
| Single Male/Father | 2,770 (11.2%) | 2.74 |
| Single Female/Mother | 4,174 (16.9%) | 2.94 |
| Total Families | 24,704 (100.0%) | 3.20 |
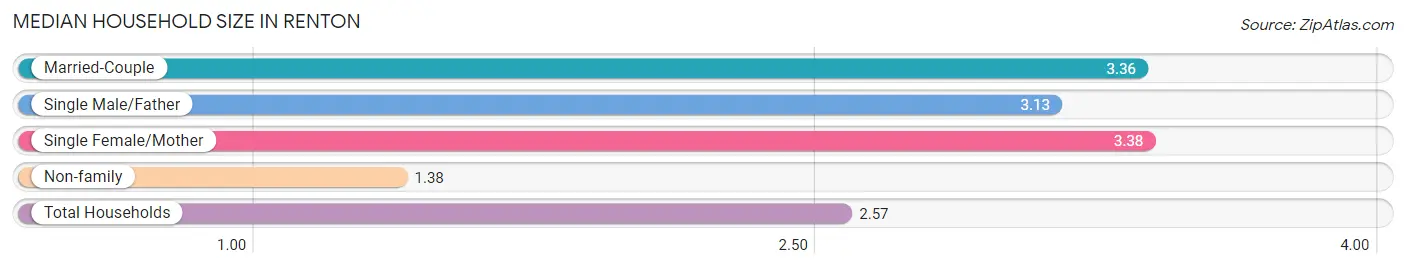
Median Household Size in Renton
The median household size in Renton is 2.57 persons per household, with single female/mother households (4,174 | 10.3%) accounting for the largest median household size of 3.38 persons per household. non-family households (15,977 | 39.3%) represent the smallest median household size with 1.38 persons per household.
| Household Type | # Households | Household Size |
| Married-Couple | 17,760 (43.7%) | 3.36 |
| Single Male/Father | 2,770 (6.8%) | 3.13 |
| Single Female/Mother | 4,174 (10.3%) | 3.38 |
| Non-family | 15,977 (39.3%) | 1.38 |
| Total Households | 40,681 (100.0%) | 2.57 |
Household Size by Marriage Status in Renton
Out of a total of 40,681 households in Renton, 24,704 (60.7%) are family households, while 15,977 (39.3%) are nonfamily households. The most numerous type of family households are 2-person households, comprising 9,568, and the most common type of nonfamily households are 1-person households, comprising 11,372.
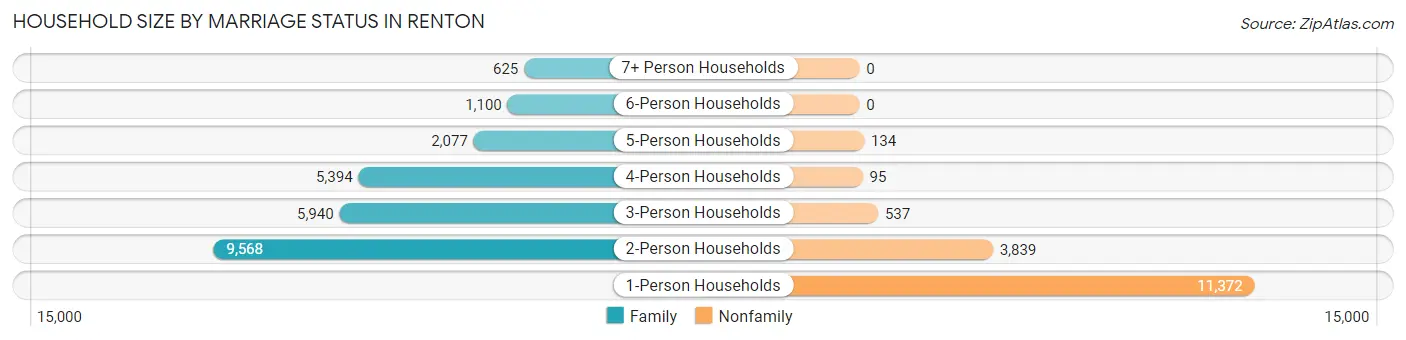
| Household Size | Family Households | Nonfamily Households |
| 1-Person Households | - | 11,372 (28.0%) |
| 2-Person Households | 9,568 (23.5%) | 3,839 (9.4%) |
| 3-Person Households | 5,940 (14.6%) | 537 (1.3%) |
| 4-Person Households | 5,394 (13.3%) | 95 (0.2%) |
| 5-Person Households | 2,077 (5.1%) | 134 (0.3%) |
| 6-Person Households | 1,100 (2.7%) | 0 (0.0%) |
| 7+ Person Households | 625 (1.5%) | 0 (0.0%) |
| Total | 24,704 (60.7%) | 15,977 (39.3%) |
Female Fertility in Renton
Fertility by Age in Renton
Average fertility rate in Renton is 62.0 births per 1,000 women. Women in the age bracket of 20 to 34 years have the highest fertility rate with 88.0 births per 1,000 women. Women in the age bracket of 20 to 34 years acount for 66.9% of all women with births.
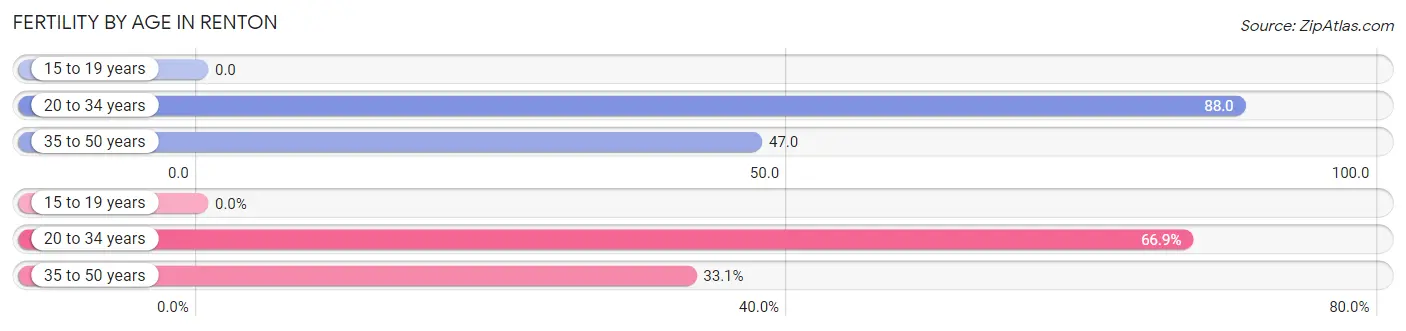
| Age Bracket | Women with Births | Births / 1,000 Women |
| 15 to 19 years | 0 (0.0%) | 0.0 |
| 20 to 34 years | 1,134 (66.9%) | 88.0 |
| 35 to 50 years | 562 (33.1%) | 47.0 |
| Total | 1,696 (100.0%) | 62.0 |
Fertility by Age by Marriage Status in Renton
69.7% of women with births (1,696) in Renton are married. The highest percentage of unmarried women with births falls into 20 to 34 years age bracket with 31.2% of them unmarried at the time of birth, while the lowest percentage of unmarried women with births belong to 35 to 50 years age bracket with 28.5% of them unmarried.
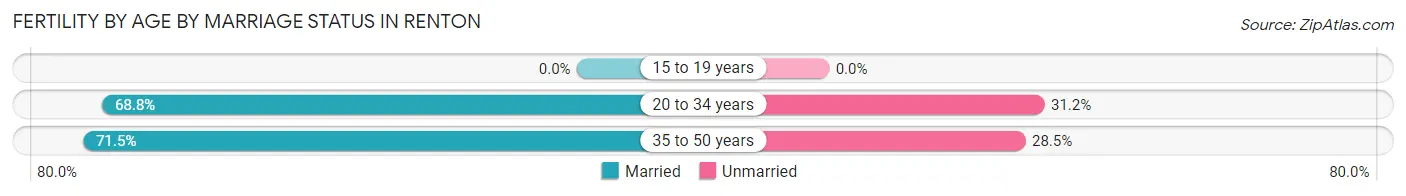
| Age Bracket | Married | Unmarried |
| 15 to 19 years | 0 (0.0%) | 0 (0.0%) |
| 20 to 34 years | 780 (68.8%) | 354 (31.2%) |
| 35 to 50 years | 402 (71.5%) | 160 (28.5%) |
| Total | 1,182 (69.7%) | 514 (30.3%) |
Fertility by Education in Renton
Average fertility rate in Renton is 62.0 births per 1,000 women. Women with the education attainment of high school diploma have the highest fertility rate of 94.0 births per 1,000 women, while women with the education attainment of less than high school have the lowest fertility at 35.0 births per 1,000 women. Women with the education attainment of high school diploma represent 28.9% of all women with births.
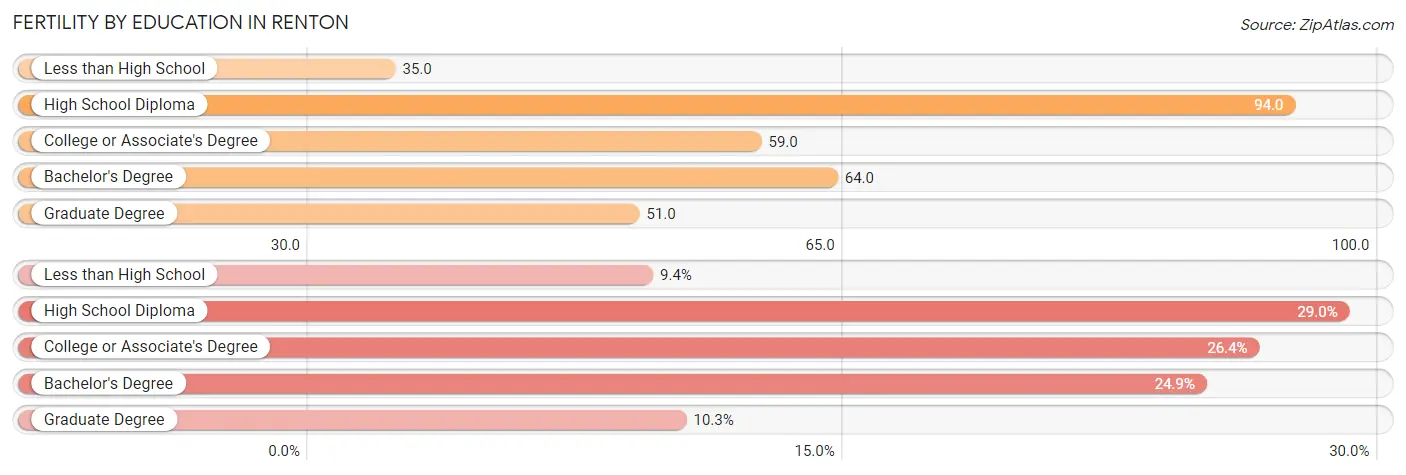
| Educational Attainment | Women with Births | Births / 1,000 Women |
| Less than High School | 159 (9.4%) | 35.0 |
| High School Diploma | 491 (28.9%) | 94.0 |
| College or Associate's Degree | 448 (26.4%) | 59.0 |
| Bachelor's Degree | 423 (24.9%) | 64.0 |
| Graduate Degree | 175 (10.3%) | 51.0 |
| Total | 1,696 (100.0%) | 62.0 |
Fertility by Education by Marriage Status in Renton
30.3% of women with births in Renton are unmarried. Women with the educational attainment of less than high school are most likely to be married with 100.0% of them married at childbirth, while women with the educational attainment of high school diploma are least likely to be married with 52.3% of them unmarried at childbirth.
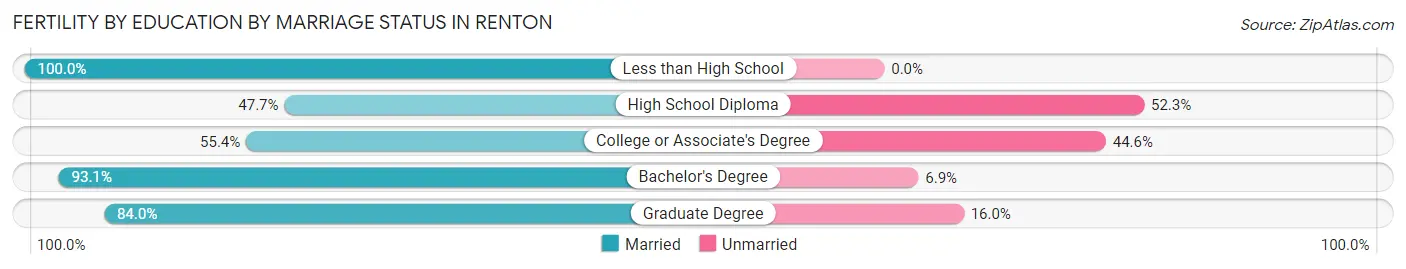
| Educational Attainment | Married | Unmarried |
| Less than High School | 159 (100.0%) | 0 (0.0%) |
| High School Diploma | 234 (47.7%) | 257 (52.3%) |
| College or Associate's Degree | 248 (55.4%) | 200 (44.6%) |
| Bachelor's Degree | 394 (93.1%) | 29 (6.9%) |
| Graduate Degree | 147 (84.0%) | 28 (16.0%) |
| Total | 1,182 (69.7%) | 514 (30.3%) |
Employment Characteristics in Renton
Employment by Class of Employer in Renton
Among the 56,488 employed individuals in Renton, private company employees (39,909 | 70.7%), not-for-profit organizations (5,189 | 9.2%), and local government employees (3,461 | 6.1%) make up the most common classes of employment.
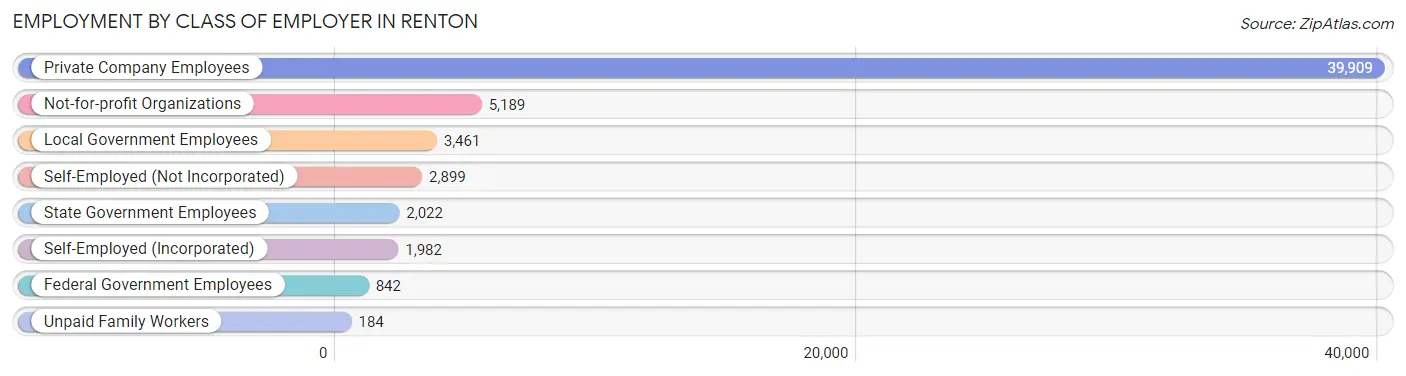
| Employer Class | # Employees | % Employees |
| Private Company Employees | 39,909 | 70.7% |
| Self-Employed (Incorporated) | 1,982 | 3.5% |
| Self-Employed (Not Incorporated) | 2,899 | 5.1% |
| Not-for-profit Organizations | 5,189 | 9.2% |
| Local Government Employees | 3,461 | 6.1% |
| State Government Employees | 2,022 | 3.6% |
| Federal Government Employees | 842 | 1.5% |
| Unpaid Family Workers | 184 | 0.3% |
| Total | 56,488 | 100.0% |
Employment Status by Age in Renton
According to the labor force statistics for Renton, out of the total population over 16 years of age (85,767), 70.7% or 60,637 individuals are in the labor force, with 4.2% or 2,547 of them unemployed. The age group with the highest labor force participation rate is 25 to 29 years, with 89.2% or 8,894 individuals in the labor force. Within the labor force, the 16 to 19 years age range has the highest percentage of unemployed individuals, with 16.5% or 286 of them being unemployed.
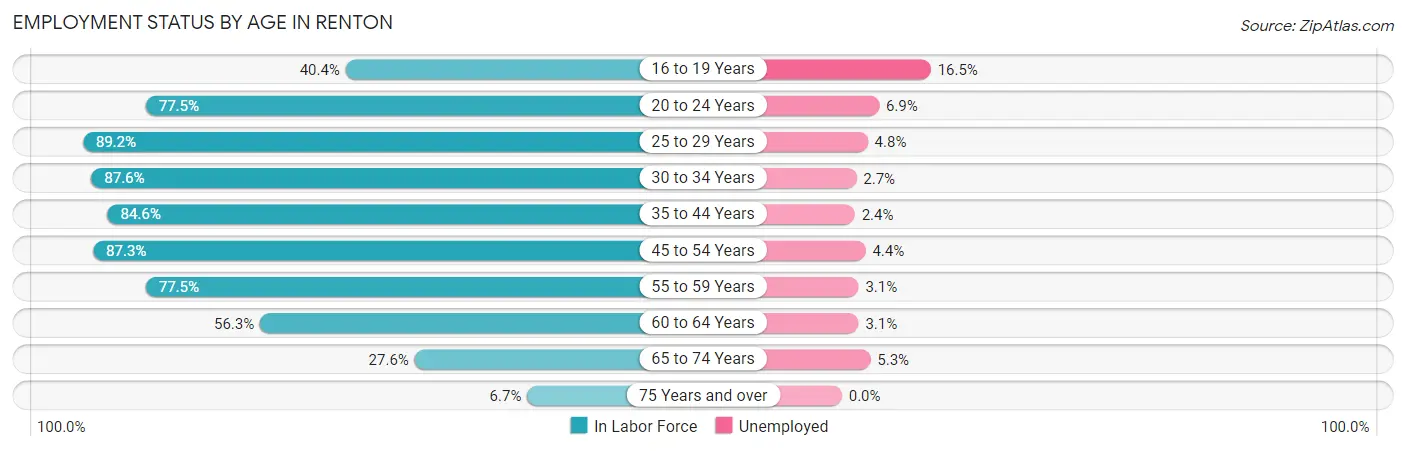
| Age Bracket | In Labor Force | Unemployed |
| 16 to 19 Years | 1,732 (40.4%) | 286 (16.5%) |
| 20 to 24 Years | 5,233 (77.5%) | 361 (6.9%) |
| 25 to 29 Years | 8,894 (89.2%) | 427 (4.8%) |
| 30 to 34 Years | 8,667 (87.6%) | 234 (2.7%) |
| 35 to 44 Years | 13,215 (84.6%) | 317 (2.4%) |
| 45 to 54 Years | 12,501 (87.3%) | 550 (4.4%) |
| 55 to 59 Years | 4,715 (77.5%) | 146 (3.1%) |
| 60 to 64 Years | 3,255 (56.3%) | 101 (3.1%) |
| 65 to 74 Years | 2,056 (27.6%) | 109 (5.3%) |
| 75 Years and over | 376 (6.7%) | 0 (0.0%) |
| Total | 60,637 (70.7%) | 2,547 (4.2%) |
Employment Status by Educational Attainment in Renton
According to labor force statistics for Renton, 83.1% of individuals (51,249) out of the total population between 25 and 64 years of age (61,671) are in the labor force, with 3.5% or 1,794 of them being unemployed. The group with the highest labor force participation rate are those with the educational attainment of bachelor's degree or higher, with 87.9% or 20,983 individuals in the labor force. Within the labor force, individuals with college / associate degree education have the highest percentage of unemployment, with 4.3% or 725 of them being unemployed.
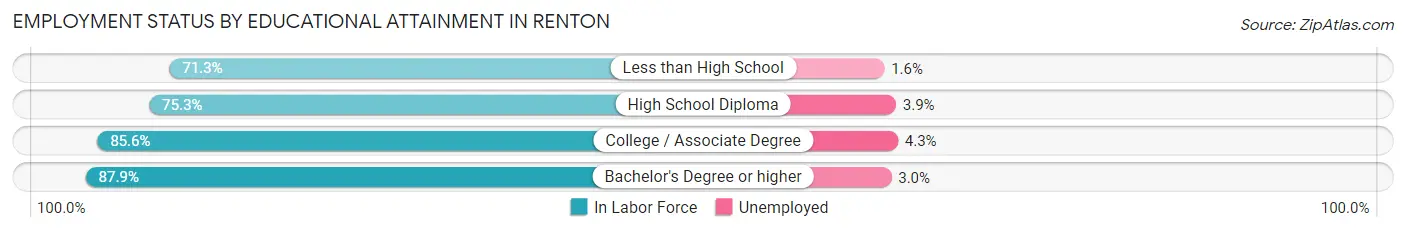
| Educational Attainment | In Labor Force | Unemployed |
| Less than High School | 4,145 (71.3%) | 93 (1.6%) |
| High School Diploma | 9,247 (75.3%) | 479 (3.9%) |
| College / Associate Degree | 16,868 (85.6%) | 847 (4.3%) |
| Bachelor's Degree or higher | 20,983 (87.9%) | 716 (3.0%) |
| Total | 51,249 (83.1%) | 2,158 (3.5%) |
Employment Occupations by Sex in Renton
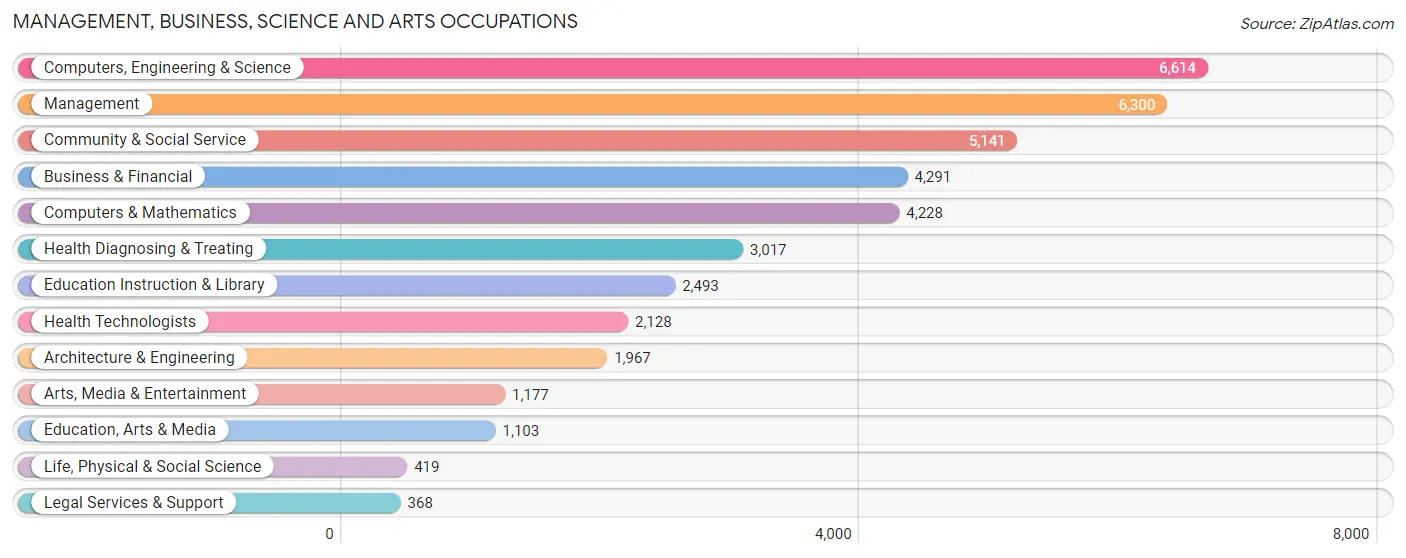
Management, Business, Science and Arts Occupations
The most common Management, Business, Science and Arts occupations in Renton are Computers, Engineering & Science (6,614 | 11.4%), Management (6,300 | 10.8%), Community & Social Service (5,141 | 8.8%), Business & Financial (4,291 | 7.4%), and Computers & Mathematics (4,228 | 7.3%).
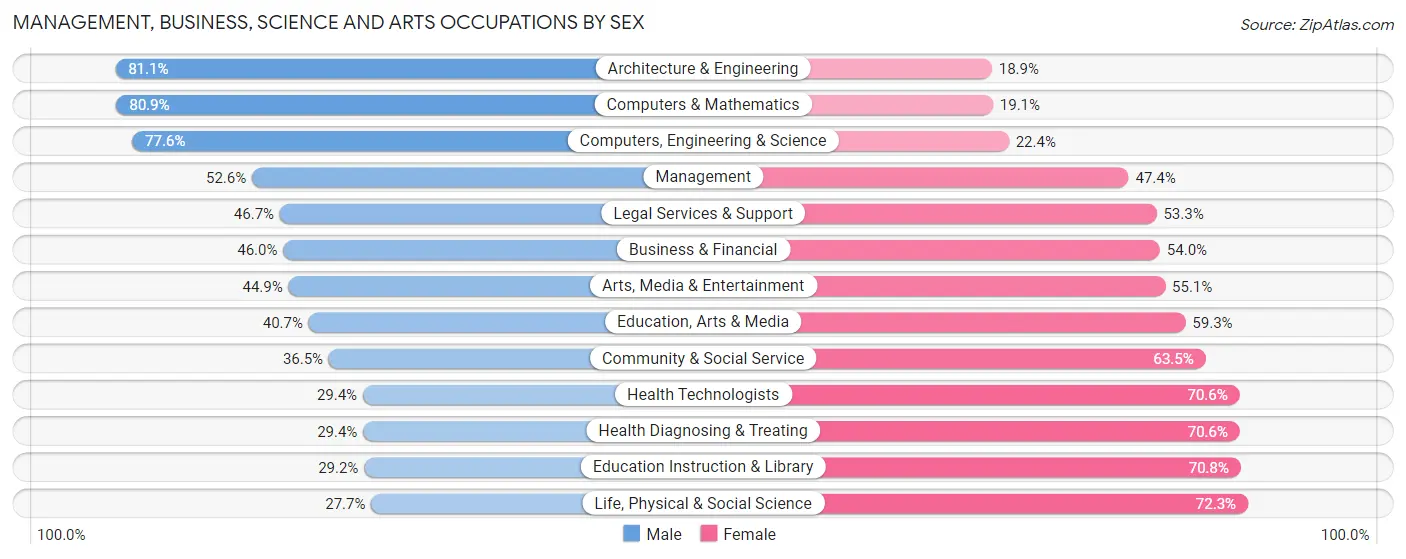
Management, Business, Science and Arts Occupations by Sex
Within the Management, Business, Science and Arts occupations in Renton, the most male-oriented occupations are Architecture & Engineering (81.1%), Computers & Mathematics (80.9%), and Computers, Engineering & Science (77.6%), while the most female-oriented occupations are Life, Physical & Social Science (72.3%), Education Instruction & Library (70.8%), and Health Diagnosing & Treating (70.6%).
| Occupation | Male | Female |
| Management | 3,311 (52.6%) | 2,989 (47.4%) |
| Business & Financial | 1,975 (46.0%) | 2,316 (54.0%) |
| Computers, Engineering & Science | 5,130 (77.6%) | 1,484 (22.4%) |
| Computers & Mathematics | 3,419 (80.9%) | 809 (19.1%) |
| Architecture & Engineering | 1,595 (81.1%) | 372 (18.9%) |
| Life, Physical & Social Science | 116 (27.7%) | 303 (72.3%) |
| Community & Social Service | 1,877 (36.5%) | 3,264 (63.5%) |
| Education, Arts & Media | 449 (40.7%) | 654 (59.3%) |
| Legal Services & Support | 172 (46.7%) | 196 (53.3%) |
| Education Instruction & Library | 727 (29.2%) | 1,766 (70.8%) |
| Arts, Media & Entertainment | 529 (44.9%) | 648 (55.1%) |
| Health Diagnosing & Treating | 886 (29.4%) | 2,131 (70.6%) |
| Health Technologists | 626 (29.4%) | 1,502 (70.6%) |
| Total (Category) | 13,179 (52.0%) | 12,184 (48.0%) |
| Total (Overall) | 31,532 (54.3%) | 26,549 (45.7%) |
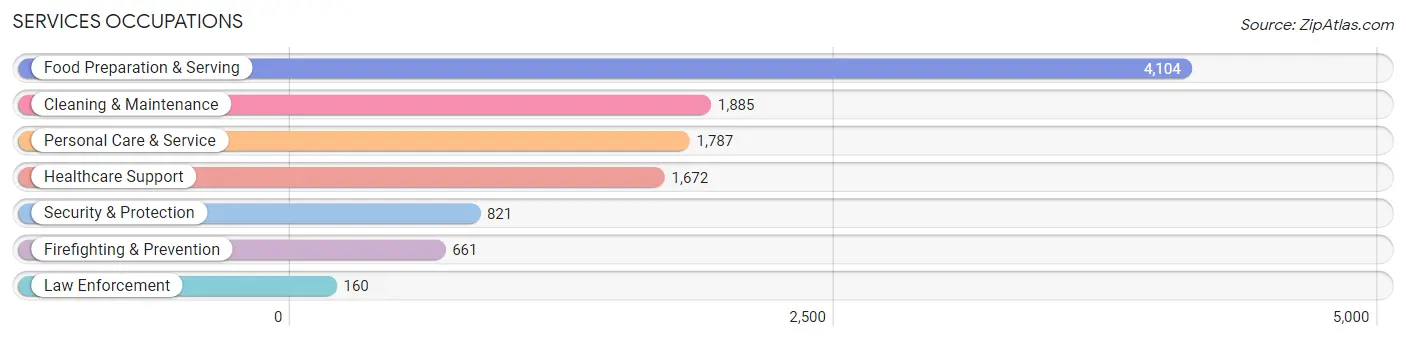
Services Occupations
The most common Services occupations in Renton are Food Preparation & Serving (4,104 | 7.1%), Cleaning & Maintenance (1,885 | 3.3%), Personal Care & Service (1,787 | 3.1%), Healthcare Support (1,672 | 2.9%), and Security & Protection (821 | 1.4%).
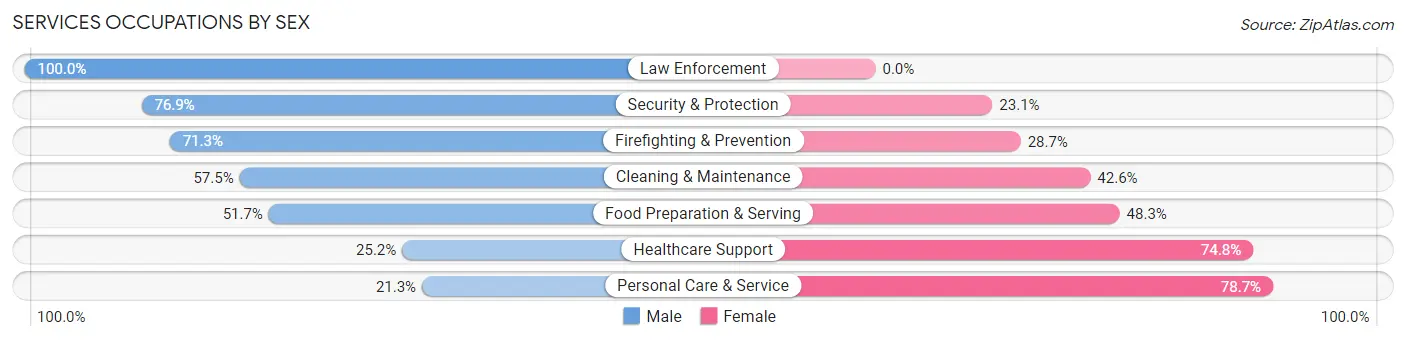
Services Occupations by Sex
Within the Services occupations in Renton, the most male-oriented occupations are Law Enforcement (100.0%), Security & Protection (76.9%), and Firefighting & Prevention (71.3%), while the most female-oriented occupations are Personal Care & Service (78.7%), Healthcare Support (74.8%), and Food Preparation & Serving (48.3%).
| Occupation | Male | Female |
| Healthcare Support | 422 (25.2%) | 1,250 (74.8%) |
| Security & Protection | 631 (76.9%) | 190 (23.1%) |
| Firefighting & Prevention | 471 (71.3%) | 190 (28.7%) |
| Law Enforcement | 160 (100.0%) | 0 (0.0%) |
| Food Preparation & Serving | 2,120 (51.7%) | 1,984 (48.3%) |
| Cleaning & Maintenance | 1,083 (57.5%) | 802 (42.5%) |
| Personal Care & Service | 381 (21.3%) | 1,406 (78.7%) |
| Total (Category) | 4,637 (45.2%) | 5,632 (54.8%) |
| Total (Overall) | 31,532 (54.3%) | 26,549 (45.7%) |
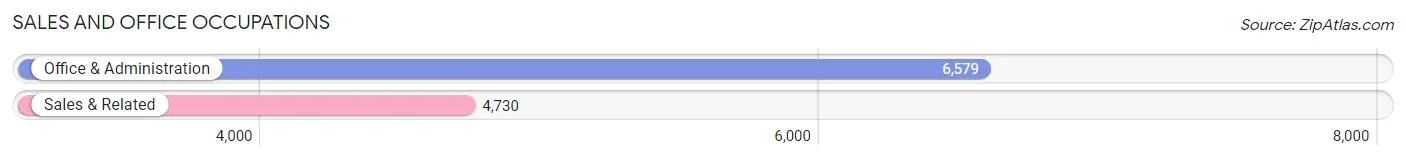
Sales and Office Occupations
The most common Sales and Office occupations in Renton are Office & Administration (6,579 | 11.3%), and Sales & Related (4,730 | 8.1%).
Sales and Office Occupations by Sex
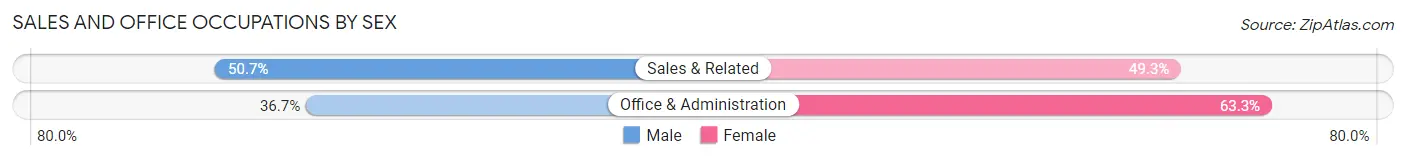
| Occupation | Male | Female |
| Sales & Related | 2,397 (50.7%) | 2,333 (49.3%) |
| Office & Administration | 2,415 (36.7%) | 4,164 (63.3%) |
| Total (Category) | 4,812 (42.5%) | 6,497 (57.5%) |
| Total (Overall) | 31,532 (54.3%) | 26,549 (45.7%) |
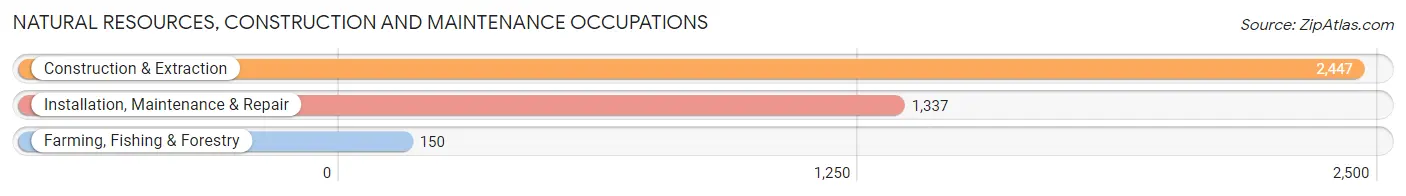
Natural Resources, Construction and Maintenance Occupations
The most common Natural Resources, Construction and Maintenance occupations in Renton are Construction & Extraction (2,447 | 4.2%), Installation, Maintenance & Repair (1,337 | 2.3%), and Farming, Fishing & Forestry (150 | 0.3%).
Natural Resources, Construction and Maintenance Occupations by Sex
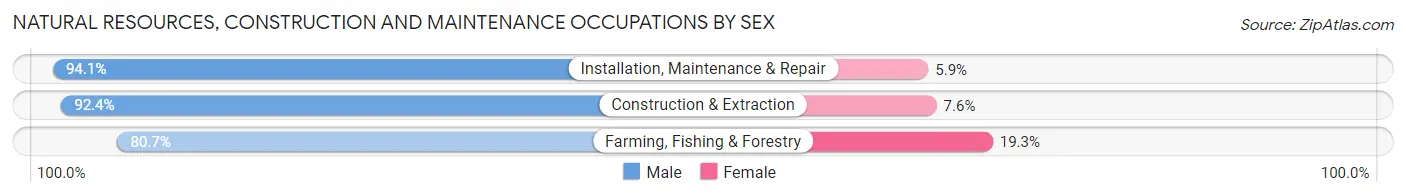
| Occupation | Male | Female |
| Farming, Fishing & Forestry | 121 (80.7%) | 29 (19.3%) |
| Construction & Extraction | 2,260 (92.4%) | 187 (7.6%) |
| Installation, Maintenance & Repair | 1,258 (94.1%) | 79 (5.9%) |
| Total (Category) | 3,639 (92.5%) | 295 (7.5%) |
| Total (Overall) | 31,532 (54.3%) | 26,549 (45.7%) |
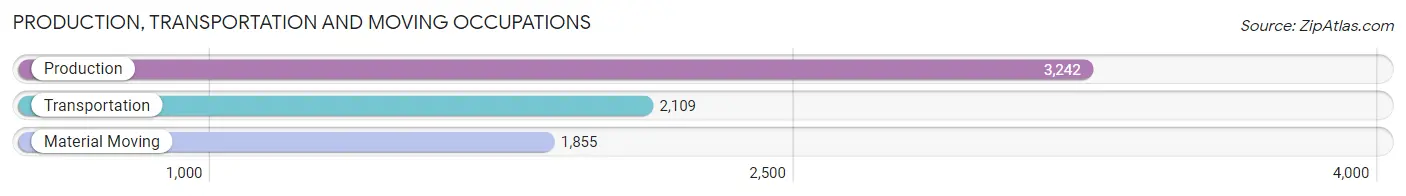
Production, Transportation and Moving Occupations
The most common Production, Transportation and Moving occupations in Renton are Production (3,242 | 5.6%), Transportation (2,109 | 3.6%), and Material Moving (1,855 | 3.2%).
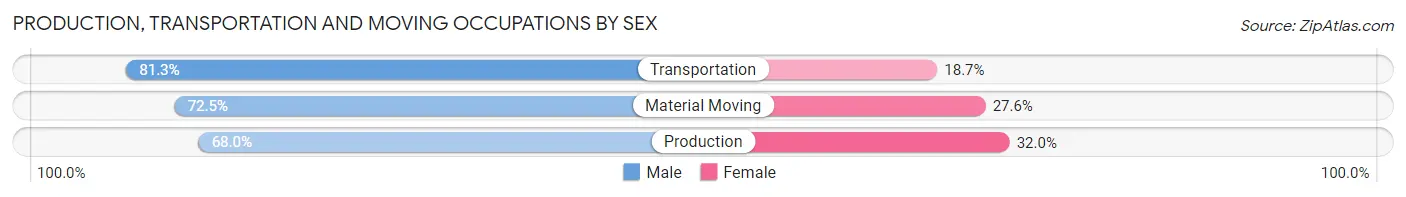
Production, Transportation and Moving Occupations by Sex
| Occupation | Male | Female |
| Production | 2,206 (68.0%) | 1,036 (32.0%) |
| Transportation | 1,715 (81.3%) | 394 (18.7%) |
| Material Moving | 1,344 (72.5%) | 511 (27.6%) |
| Total (Category) | 5,265 (73.1%) | 1,941 (26.9%) |
| Total (Overall) | 31,532 (54.3%) | 26,549 (45.7%) |
Employment Industries by Sex in Renton
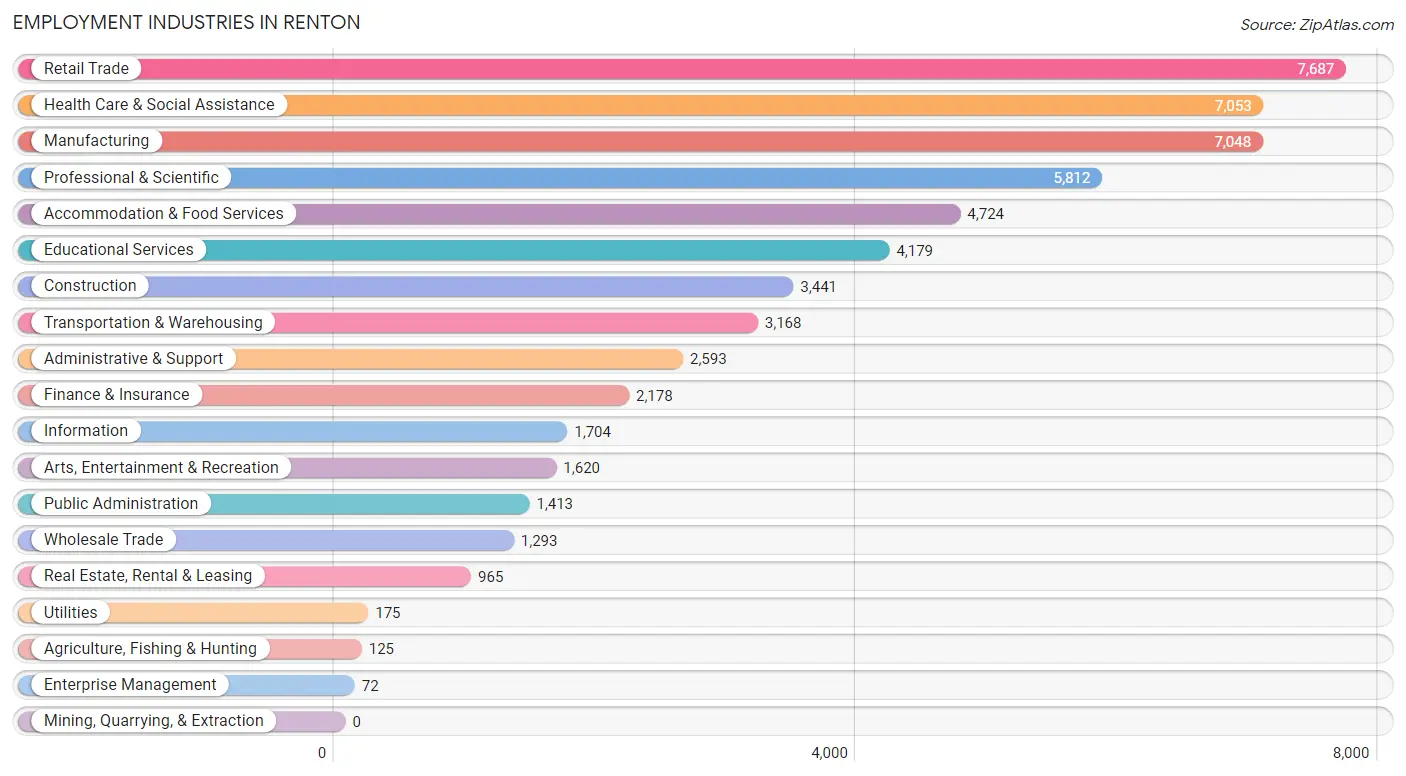
Employment Industries in Renton
The major employment industries in Renton include Retail Trade (7,687 | 13.2%), Health Care & Social Assistance (7,053 | 12.1%), Manufacturing (7,048 | 12.1%), Professional & Scientific (5,812 | 10.0%), and Accommodation & Food Services (4,724 | 8.1%).
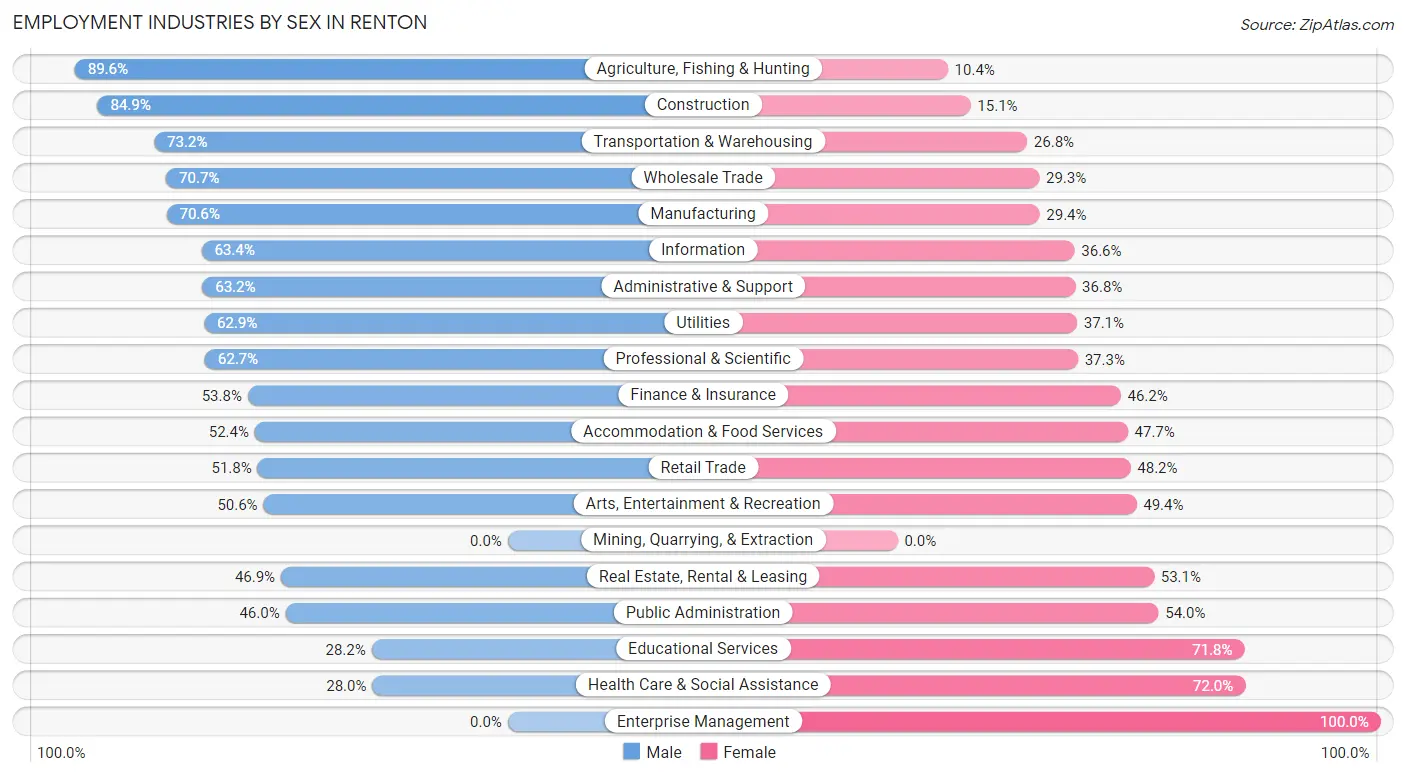
Employment Industries by Sex in Renton
The Renton industries that see more men than women are Agriculture, Fishing & Hunting (89.6%), Construction (84.9%), and Transportation & Warehousing (73.2%), whereas the industries that tend to have a higher number of women are Enterprise Management (100.0%), Health Care & Social Assistance (72.0%), and Educational Services (71.8%).
| Industry | Male | Female |
| Agriculture, Fishing & Hunting | 112 (89.6%) | 13 (10.4%) |
| Mining, Quarrying, & Extraction | 0 (0.0%) | 0 (0.0%) |
| Construction | 2,921 (84.9%) | 520 (15.1%) |
| Manufacturing | 4,977 (70.6%) | 2,071 (29.4%) |
| Wholesale Trade | 914 (70.7%) | 379 (29.3%) |
| Retail Trade | 3,980 (51.8%) | 3,707 (48.2%) |
| Transportation & Warehousing | 2,319 (73.2%) | 849 (26.8%) |
| Utilities | 110 (62.9%) | 65 (37.1%) |
| Information | 1,080 (63.4%) | 624 (36.6%) |
| Finance & Insurance | 1,172 (53.8%) | 1,006 (46.2%) |
| Real Estate, Rental & Leasing | 453 (46.9%) | 512 (53.1%) |
| Professional & Scientific | 3,643 (62.7%) | 2,169 (37.3%) |
| Enterprise Management | 0 (0.0%) | 72 (100.0%) |
| Administrative & Support | 1,639 (63.2%) | 954 (36.8%) |
| Educational Services | 1,178 (28.2%) | 3,001 (71.8%) |
| Health Care & Social Assistance | 1,978 (28.0%) | 5,075 (72.0%) |
| Arts, Entertainment & Recreation | 819 (50.6%) | 801 (49.4%) |
| Accommodation & Food Services | 2,473 (52.3%) | 2,251 (47.6%) |
| Public Administration | 650 (46.0%) | 763 (54.0%) |
| Total | 31,532 (54.3%) | 26,549 (45.7%) |
Education in Renton
School Enrollment in Renton
The most common levels of schooling among the 23,042 students in Renton are college / undergraduate (5,533 | 24.0%), middle school (4,781 | 20.7%), and high school (4,232 | 18.4%).
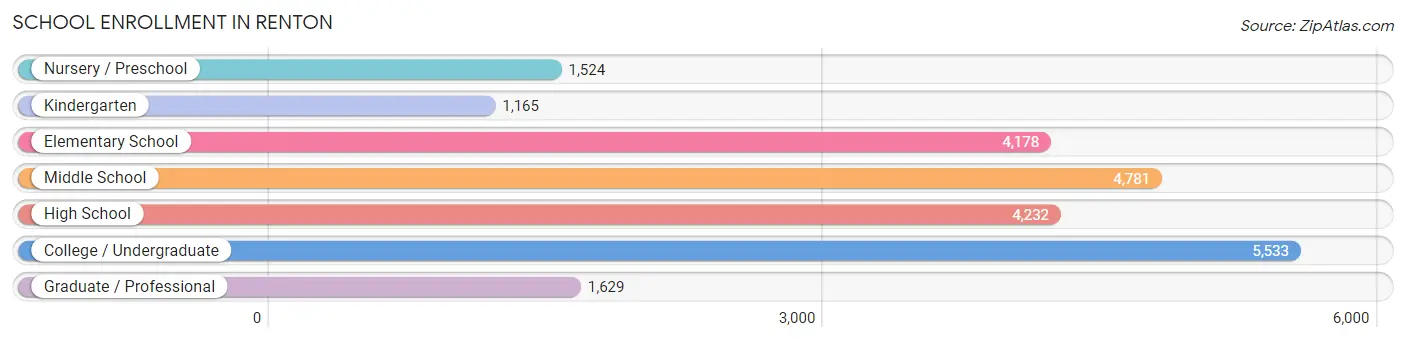
| School Level | # Students | % Students |
| Nursery / Preschool | 1,524 | 6.6% |
| Kindergarten | 1,165 | 5.1% |
| Elementary School | 4,178 | 18.1% |
| Middle School | 4,781 | 20.7% |
| High School | 4,232 | 18.4% |
| College / Undergraduate | 5,533 | 24.0% |
| Graduate / Professional | 1,629 | 7.1% |
| Total | 23,042 | 100.0% |
School Enrollment by Age by Funding Source in Renton
Out of a total of 23,042 students who are enrolled in schools in Renton, 3,479 (15.1%) attend a private institution, while the remaining 19,563 (84.9%) are enrolled in public schools. The age group of 3 to 4 year olds has the highest likelihood of being enrolled in private schools, with 486 (46.6% in the age bracket) enrolled. Conversely, the age group of 18 to 19 year olds has the lowest likelihood of being enrolled in a private school, with 1,557 (93.7% in the age bracket) attending a public institution.
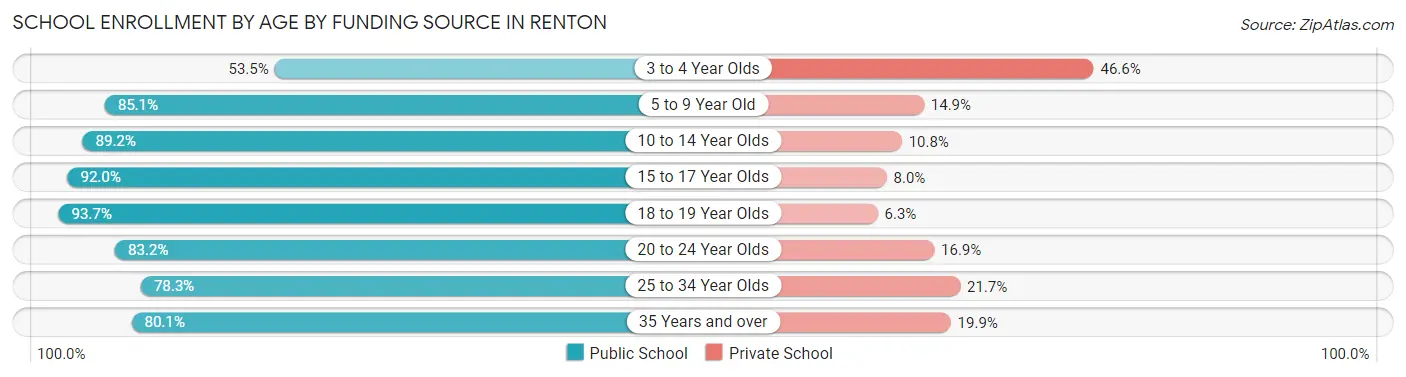
| Age Bracket | Public School | Private School |
| 3 to 4 Year Olds | 558 (53.4%) | 486 (46.6%) |
| 5 to 9 Year Old | 4,702 (85.1%) | 826 (14.9%) |
| 10 to 14 Year Olds | 4,827 (89.2%) | 585 (10.8%) |
| 15 to 17 Year Olds | 2,759 (92.0%) | 240 (8.0%) |
| 18 to 19 Year Olds | 1,557 (93.7%) | 105 (6.3%) |
| 20 to 24 Year Olds | 1,944 (83.2%) | 394 (16.9%) |
| 25 to 34 Year Olds | 1,709 (78.3%) | 473 (21.7%) |
| 35 Years and over | 1,503 (80.1%) | 374 (19.9%) |
| Total | 19,563 (84.9%) | 3,479 (15.1%) |
Educational Attainment by Field of Study in Renton
Business (5,530 | 18.4%), engineering (3,850 | 12.8%), science & technology (2,785 | 9.3%), computers & mathematics (2,654 | 8.8%), and social sciences (2,472 | 8.2%) are the most common fields of study among 30,036 individuals in Renton who have obtained a bachelor's degree or higher.
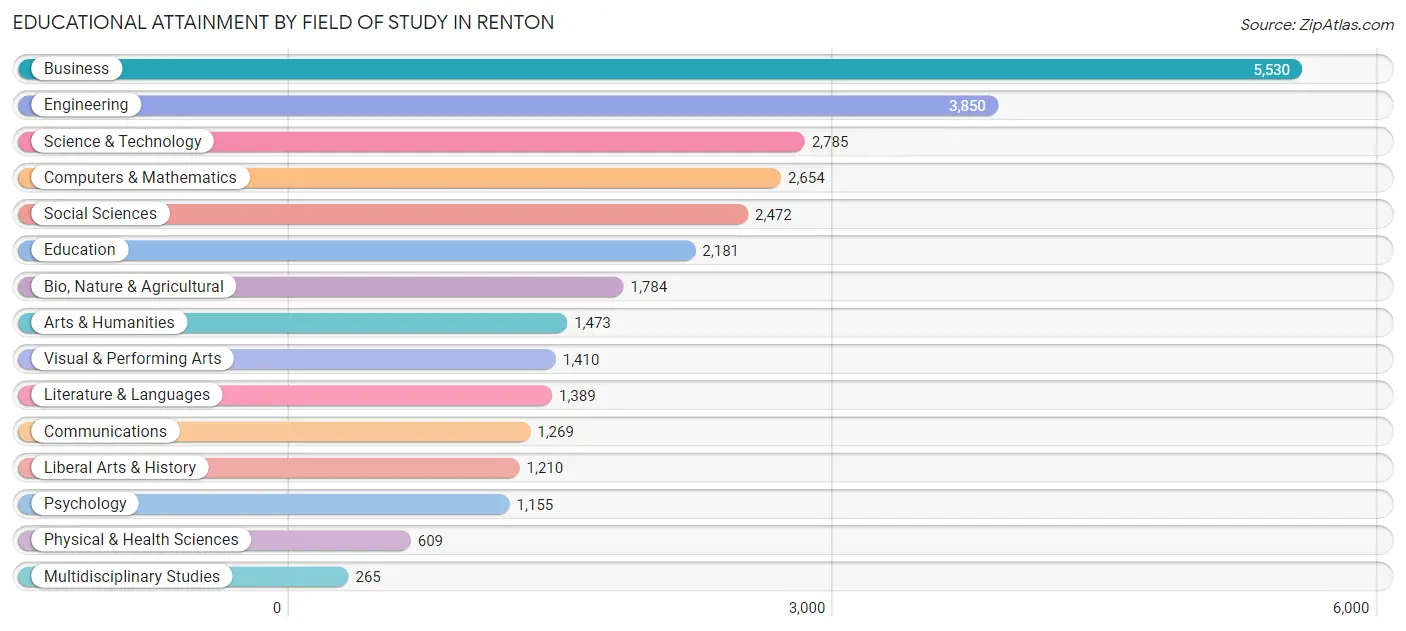
| Field of Study | # Graduates | % Graduates |
| Computers & Mathematics | 2,654 | 8.8% |
| Bio, Nature & Agricultural | 1,784 | 5.9% |
| Physical & Health Sciences | 609 | 2.0% |
| Psychology | 1,155 | 3.8% |
| Social Sciences | 2,472 | 8.2% |
| Engineering | 3,850 | 12.8% |
| Multidisciplinary Studies | 265 | 0.9% |
| Science & Technology | 2,785 | 9.3% |
| Business | 5,530 | 18.4% |
| Education | 2,181 | 7.3% |
| Literature & Languages | 1,389 | 4.6% |
| Liberal Arts & History | 1,210 | 4.0% |
| Visual & Performing Arts | 1,410 | 4.7% |
| Communications | 1,269 | 4.2% |
| Arts & Humanities | 1,473 | 4.9% |
| Total | 30,036 | 100.0% |
Transportation & Commute in Renton
Vehicle Availability by Sex in Renton
The most prevalent vehicle ownership categories in Renton are males with 2 vehicles (12,911, accounting for 41.8%) and females with 2 vehicles (10,897, making up 50.6%).
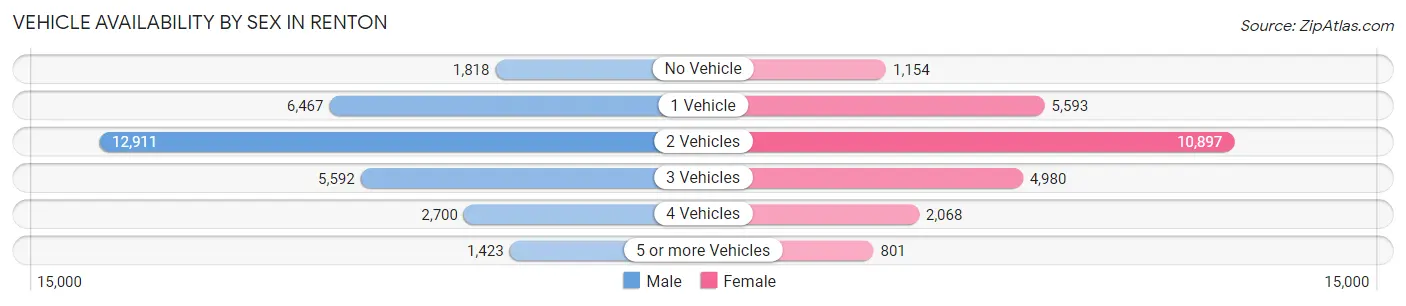
| Vehicles Available | Male | Female |
| No Vehicle | 1,818 (5.9%) | 1,154 (4.5%) |
| 1 Vehicle | 6,467 (20.9%) | 5,593 (21.9%) |
| 2 Vehicles | 12,911 (41.8%) | 10,897 (42.7%) |
| 3 Vehicles | 5,592 (18.1%) | 4,980 (19.5%) |
| 4 Vehicles | 2,700 (8.7%) | 2,068 (8.1%) |
| 5 or more Vehicles | 1,423 (4.6%) | 801 (3.1%) |
| Total | 30,911 (100.0%) | 25,493 (100.0%) |
Commute Time in Renton
The most frequently occuring commute durations in Renton are 30 to 34 minutes (9,204 commuters, 19.6%), 20 to 24 minutes (6,723 commuters, 14.3%), and 15 to 19 minutes (6,339 commuters, 13.5%).
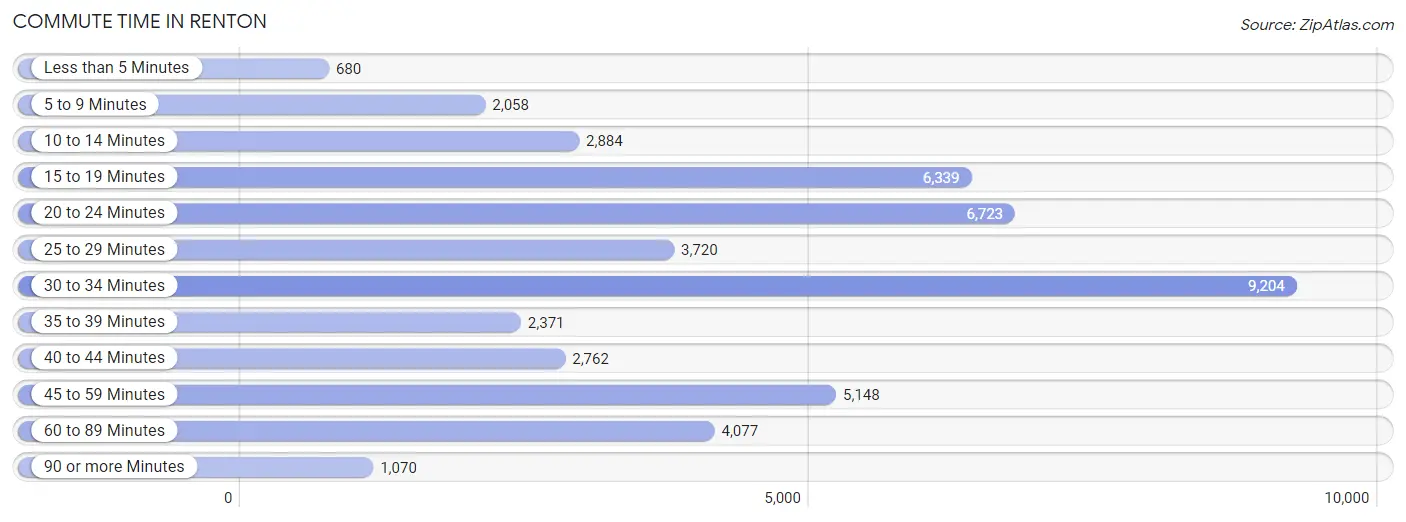
| Commute Time | # Commuters | % Commuters |
| Less than 5 Minutes | 680 | 1.5% |
| 5 to 9 Minutes | 2,058 | 4.4% |
| 10 to 14 Minutes | 2,884 | 6.1% |
| 15 to 19 Minutes | 6,339 | 13.5% |
| 20 to 24 Minutes | 6,723 | 14.3% |
| 25 to 29 Minutes | 3,720 | 7.9% |
| 30 to 34 Minutes | 9,204 | 19.6% |
| 35 to 39 Minutes | 2,371 | 5.0% |
| 40 to 44 Minutes | 2,762 | 5.9% |
| 45 to 59 Minutes | 5,148 | 10.9% |
| 60 to 89 Minutes | 4,077 | 8.7% |
| 90 or more Minutes | 1,070 | 2.3% |
Commute Time by Sex in Renton
The most common commute times in Renton are 30 to 34 minutes (5,102 commuters, 19.6%) for males and 30 to 34 minutes (4,102 commuters, 19.6%) for females.
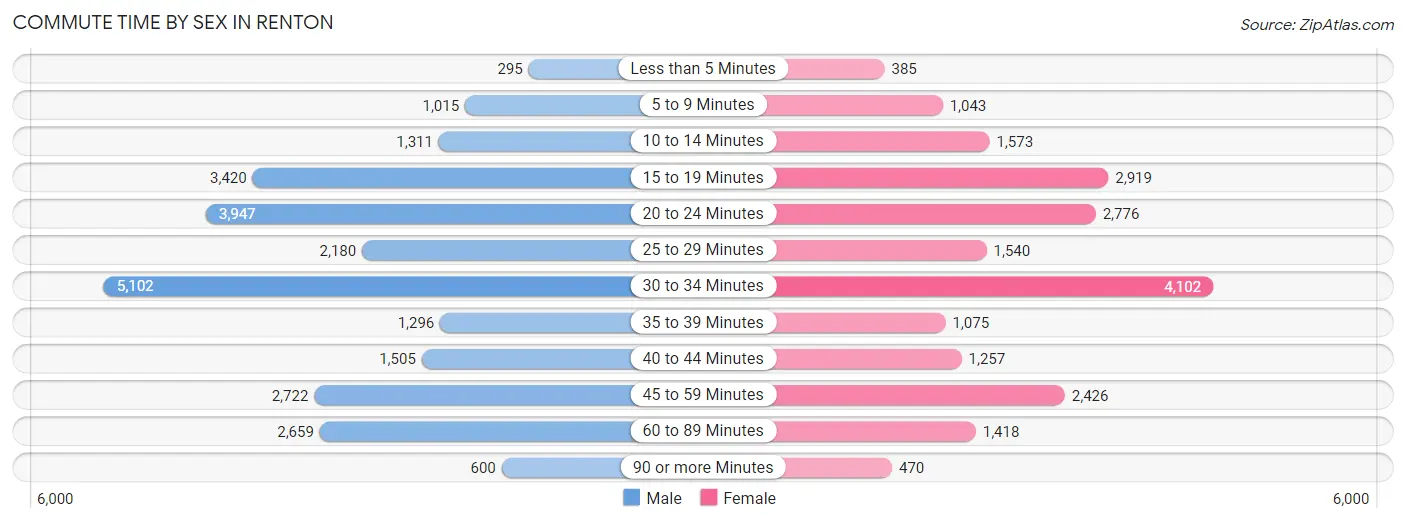
| Commute Time | Male | Female |
| Less than 5 Minutes | 295 (1.1%) | 385 (1.8%) |
| 5 to 9 Minutes | 1,015 (3.9%) | 1,043 (5.0%) |
| 10 to 14 Minutes | 1,311 (5.0%) | 1,573 (7.5%) |
| 15 to 19 Minutes | 3,420 (13.1%) | 2,919 (13.9%) |
| 20 to 24 Minutes | 3,947 (15.1%) | 2,776 (13.2%) |
| 25 to 29 Minutes | 2,180 (8.4%) | 1,540 (7.3%) |
| 30 to 34 Minutes | 5,102 (19.6%) | 4,102 (19.6%) |
| 35 to 39 Minutes | 1,296 (5.0%) | 1,075 (5.1%) |
| 40 to 44 Minutes | 1,505 (5.8%) | 1,257 (6.0%) |
| 45 to 59 Minutes | 2,722 (10.4%) | 2,426 (11.6%) |
| 60 to 89 Minutes | 2,659 (10.2%) | 1,418 (6.8%) |
| 90 or more Minutes | 600 (2.3%) | 470 (2.2%) |
Time of Departure to Work by Sex in Renton
The most frequent times of departure to work in Renton are 7:00 AM to 7:29 AM (3,552, 13.6%) for males and 7:00 AM to 7:29 AM (2,788, 13.3%) for females.
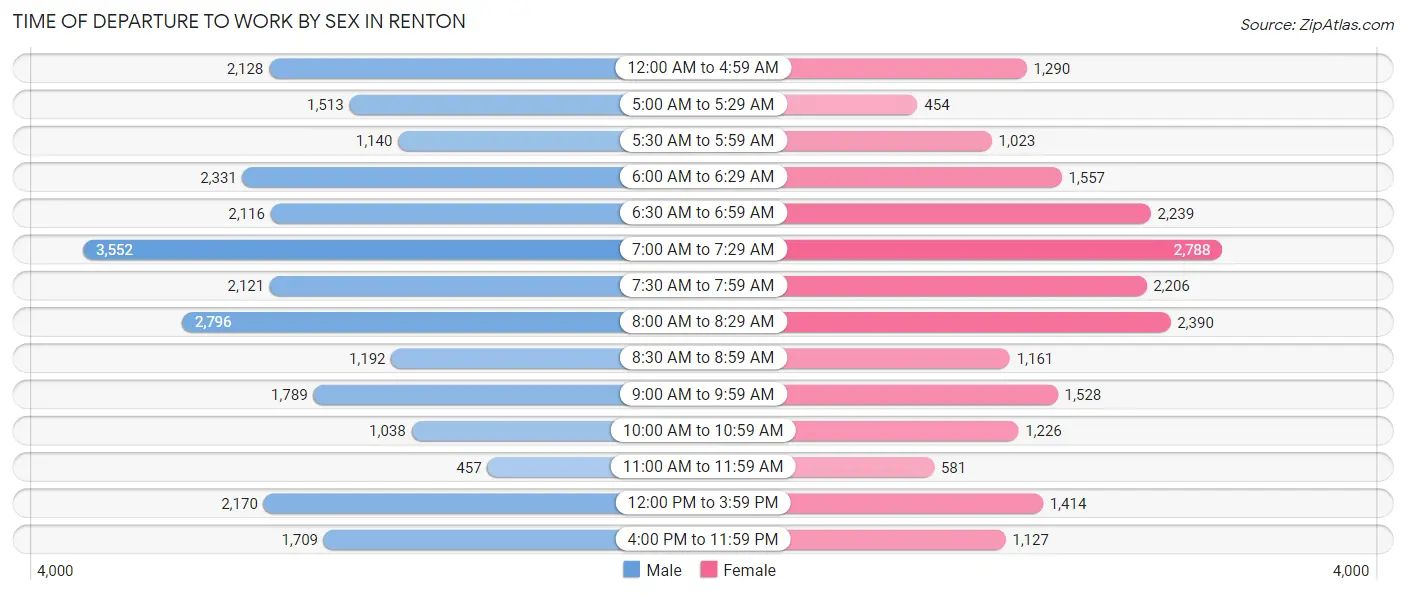
| Time of Departure | Male | Female |
| 12:00 AM to 4:59 AM | 2,128 (8.2%) | 1,290 (6.1%) |
| 5:00 AM to 5:29 AM | 1,513 (5.8%) | 454 (2.2%) |
| 5:30 AM to 5:59 AM | 1,140 (4.4%) | 1,023 (4.9%) |
| 6:00 AM to 6:29 AM | 2,331 (8.9%) | 1,557 (7.4%) |
| 6:30 AM to 6:59 AM | 2,116 (8.1%) | 2,239 (10.7%) |
| 7:00 AM to 7:29 AM | 3,552 (13.6%) | 2,788 (13.3%) |
| 7:30 AM to 7:59 AM | 2,121 (8.1%) | 2,206 (10.5%) |
| 8:00 AM to 8:29 AM | 2,796 (10.7%) | 2,390 (11.4%) |
| 8:30 AM to 8:59 AM | 1,192 (4.6%) | 1,161 (5.5%) |
| 9:00 AM to 9:59 AM | 1,789 (6.9%) | 1,528 (7.3%) |
| 10:00 AM to 10:59 AM | 1,038 (4.0%) | 1,226 (5.8%) |
| 11:00 AM to 11:59 AM | 457 (1.8%) | 581 (2.8%) |
| 12:00 PM to 3:59 PM | 2,170 (8.3%) | 1,414 (6.7%) |
| 4:00 PM to 11:59 PM | 1,709 (6.6%) | 1,127 (5.4%) |
| Total | 26,052 (100.0%) | 20,984 (100.0%) |
Housing Occupancy in Renton
Occupancy by Ownership in Renton
Of the total 40,681 dwellings in Renton, owner-occupied units account for 21,811 (53.6%), while renter-occupied units make up 18,870 (46.4%).
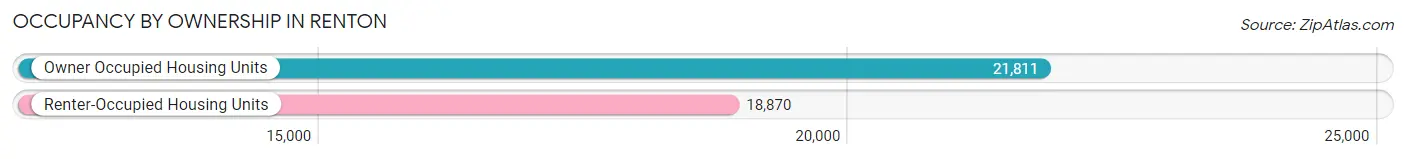
| Occupancy | # Housing Units | % Housing Units |
| Owner Occupied Housing Units | 21,811 | 53.6% |
| Renter-Occupied Housing Units | 18,870 | 46.4% |
| Total Occupied Housing Units | 40,681 | 100.0% |
Occupancy by Household Size in Renton
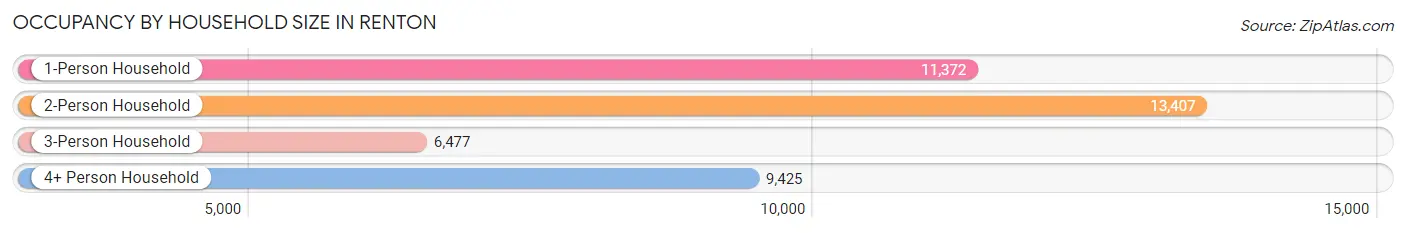
| Household Size | # Housing Units | % Housing Units |
| 1-Person Household | 11,372 | 28.0% |
| 2-Person Household | 13,407 | 33.0% |
| 3-Person Household | 6,477 | 15.9% |
| 4+ Person Household | 9,425 | 23.2% |
| Total Housing Units | 40,681 | 100.0% |
Occupancy by Ownership by Household Size in Renton
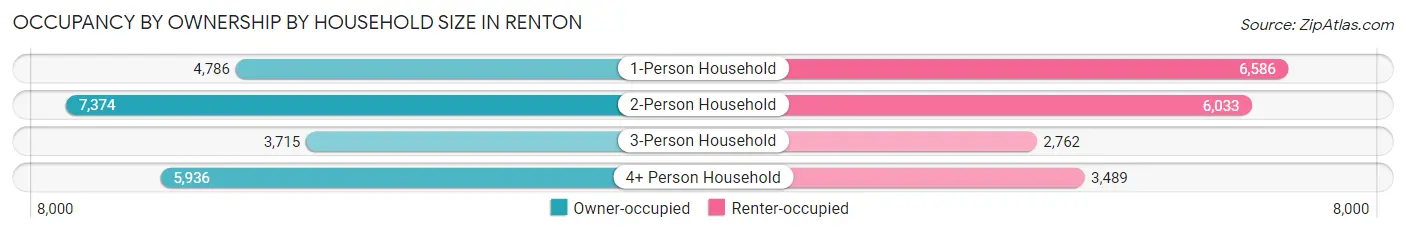
| Household Size | Owner-occupied | Renter-occupied |
| 1-Person Household | 4,786 (42.1%) | 6,586 (57.9%) |
| 2-Person Household | 7,374 (55.0%) | 6,033 (45.0%) |
| 3-Person Household | 3,715 (57.4%) | 2,762 (42.6%) |
| 4+ Person Household | 5,936 (63.0%) | 3,489 (37.0%) |
| Total Housing Units | 21,811 (53.6%) | 18,870 (46.4%) |
Occupancy by Educational Attainment in Renton
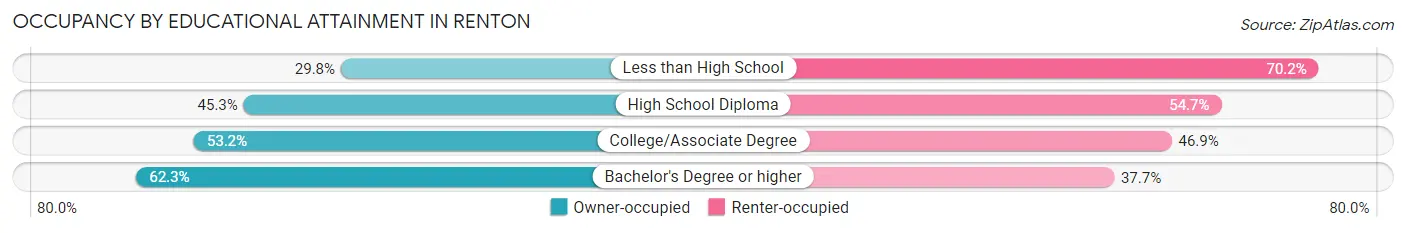
| Household Size | Owner-occupied | Renter-occupied |
| Less than High School | 927 (29.8%) | 2,180 (70.2%) |
| High School Diploma | 3,585 (45.3%) | 4,336 (54.7%) |
| College/Associate Degree | 6,809 (53.1%) | 6,001 (46.9%) |
| Bachelor's Degree or higher | 10,490 (62.3%) | 6,353 (37.7%) |
Occupancy by Age of Householder in Renton
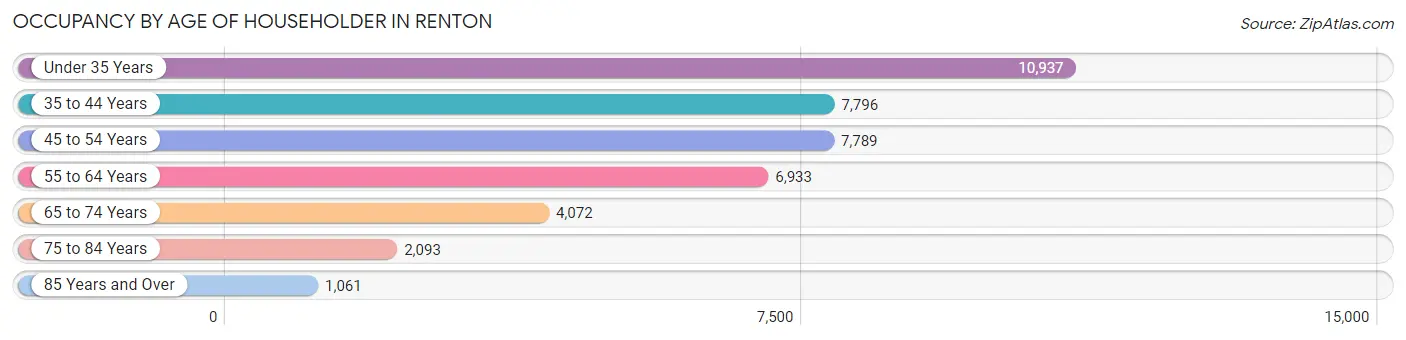
| Age Bracket | # Households | % Households |
| Under 35 Years | 10,937 | 26.9% |
| 35 to 44 Years | 7,796 | 19.2% |
| 45 to 54 Years | 7,789 | 19.2% |
| 55 to 64 Years | 6,933 | 17.0% |
| 65 to 74 Years | 4,072 | 10.0% |
| 75 to 84 Years | 2,093 | 5.1% |
| 85 Years and Over | 1,061 | 2.6% |
| Total | 40,681 | 100.0% |
Housing Finances in Renton
Median Income by Occupancy in Renton
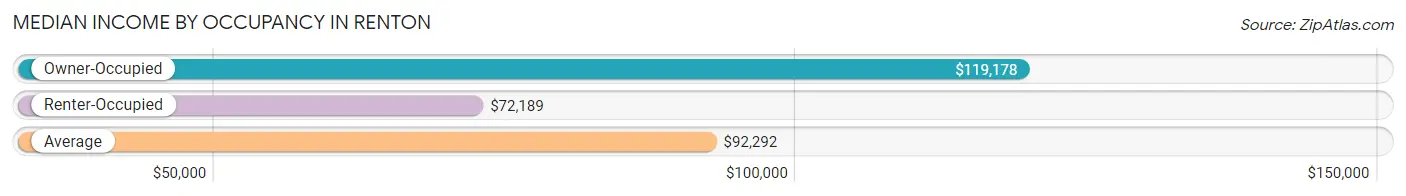
| Occupancy Type | # Households | Median Income |
| Owner-Occupied | 21,811 (53.6%) | $119,178 |
| Renter-Occupied | 18,870 (46.4%) | $72,189 |
| Average | 40,681 (100.0%) | $92,292 |
Occupancy by Householder Income Bracket in Renton
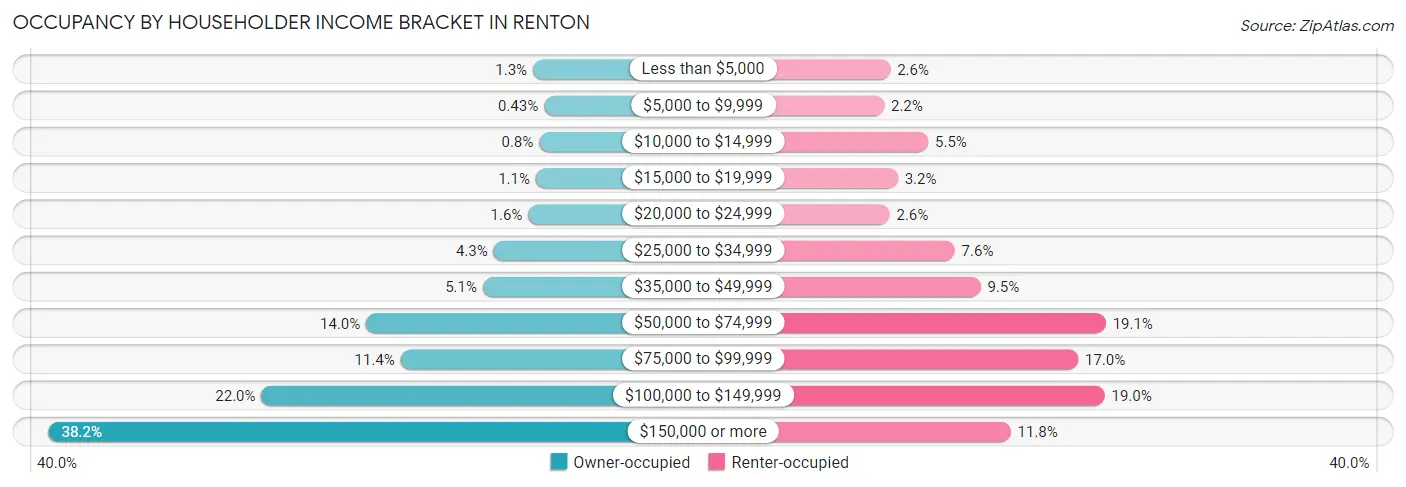
| Income Bracket | Owner-occupied | Renter-occupied |
| Less than $5,000 | 278 (1.3%) | 499 (2.6%) |
| $5,000 to $9,999 | 94 (0.4%) | 410 (2.2%) |
| $10,000 to $14,999 | 174 (0.8%) | 1,044 (5.5%) |
| $15,000 to $19,999 | 228 (1.1%) | 605 (3.2%) |
| $20,000 to $24,999 | 356 (1.6%) | 489 (2.6%) |
| $25,000 to $34,999 | 931 (4.3%) | 1,424 (7.5%) |
| $35,000 to $49,999 | 1,110 (5.1%) | 1,797 (9.5%) |
| $50,000 to $74,999 | 3,050 (14.0%) | 3,596 (19.1%) |
| $75,000 to $99,999 | 2,475 (11.4%) | 3,198 (17.0%) |
| $100,000 to $149,999 | 4,790 (22.0%) | 3,579 (19.0%) |
| $150,000 or more | 8,325 (38.2%) | 2,229 (11.8%) |
| Total | 21,811 (100.0%) | 18,870 (100.0%) |
Monthly Housing Cost Tiers in Renton
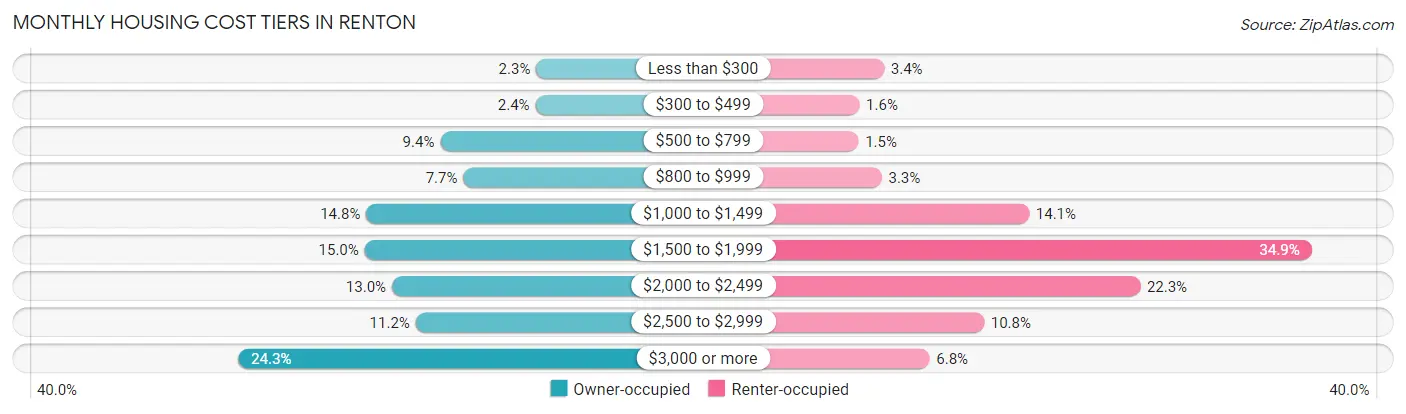
| Monthly Cost | Owner-occupied | Renter-occupied |
| Less than $300 | 507 (2.3%) | 646 (3.4%) |
| $300 to $499 | 520 (2.4%) | 301 (1.6%) |
| $500 to $799 | 2,047 (9.4%) | 289 (1.5%) |
| $800 to $999 | 1,677 (7.7%) | 614 (3.3%) |
| $1,000 to $1,499 | 3,236 (14.8%) | 2,661 (14.1%) |
| $1,500 to $1,999 | 3,264 (15.0%) | 6,590 (34.9%) |
| $2,000 to $2,499 | 2,825 (13.0%) | 4,204 (22.3%) |
| $2,500 to $2,999 | 2,442 (11.2%) | 2,034 (10.8%) |
| $3,000 or more | 5,293 (24.3%) | 1,277 (6.8%) |
| Total | 21,811 (100.0%) | 18,870 (100.0%) |
Physical Housing Characteristics in Renton
Housing Structures in Renton
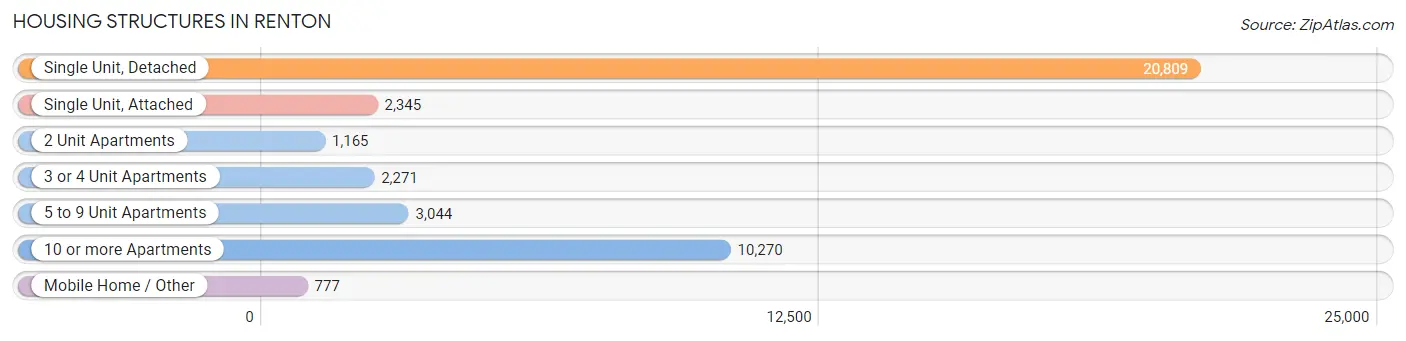
| Structure Type | # Housing Units | % Housing Units |
| Single Unit, Detached | 20,809 | 51.1% |
| Single Unit, Attached | 2,345 | 5.8% |
| 2 Unit Apartments | 1,165 | 2.9% |
| 3 or 4 Unit Apartments | 2,271 | 5.6% |
| 5 to 9 Unit Apartments | 3,044 | 7.5% |
| 10 or more Apartments | 10,270 | 25.3% |
| Mobile Home / Other | 777 | 1.9% |
| Total | 40,681 | 100.0% |
Housing Structures by Occupancy in Renton
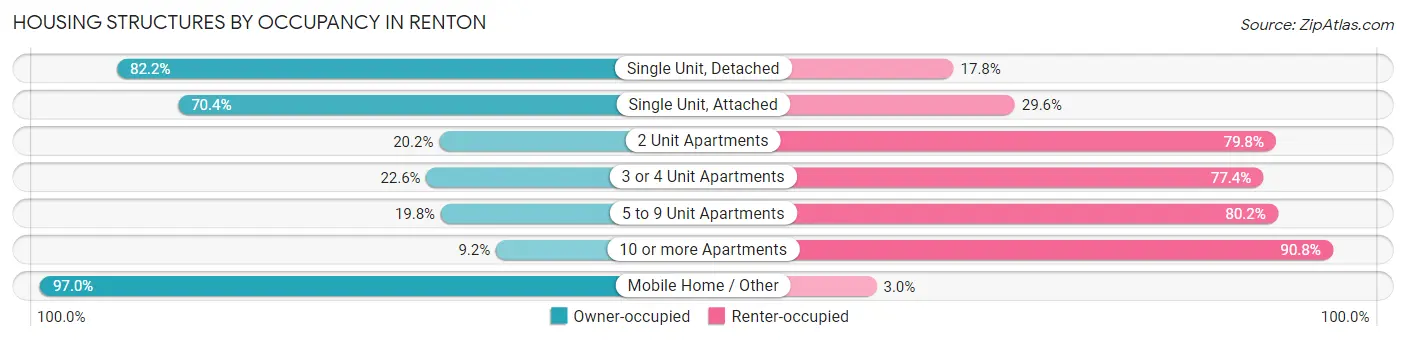
| Structure Type | Owner-occupied | Renter-occupied |
| Single Unit, Detached | 17,105 (82.2%) | 3,704 (17.8%) |
| Single Unit, Attached | 1,651 (70.4%) | 694 (29.6%) |
| 2 Unit Apartments | 235 (20.2%) | 930 (79.8%) |
| 3 or 4 Unit Apartments | 514 (22.6%) | 1,757 (77.4%) |
| 5 to 9 Unit Apartments | 604 (19.8%) | 2,440 (80.2%) |
| 10 or more Apartments | 948 (9.2%) | 9,322 (90.8%) |
| Mobile Home / Other | 754 (97.0%) | 23 (3.0%) |
| Total | 21,811 (53.6%) | 18,870 (46.4%) |
Housing Structures by Number of Rooms in Renton
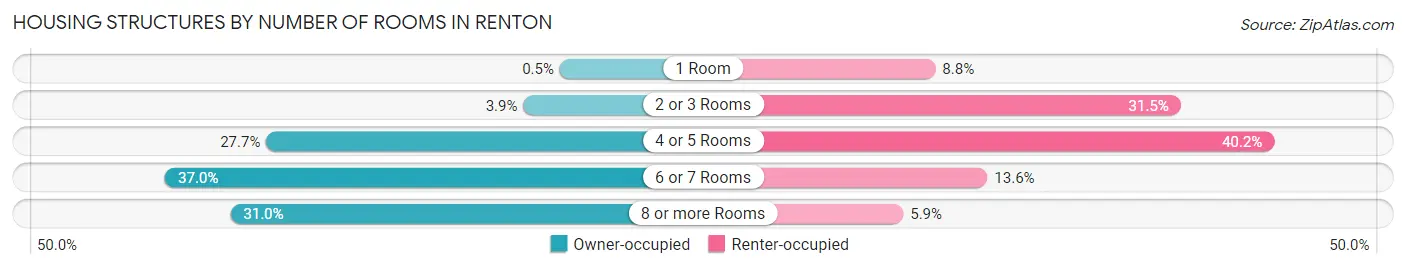
| Number of Rooms | Owner-occupied | Renter-occupied |
| 1 Room | 109 (0.5%) | 1,666 (8.8%) |
| 2 or 3 Rooms | 847 (3.9%) | 5,945 (31.5%) |
| 4 or 5 Rooms | 6,031 (27.7%) | 7,579 (40.2%) |
| 6 or 7 Rooms | 8,070 (37.0%) | 2,574 (13.6%) |
| 8 or more Rooms | 6,754 (31.0%) | 1,106 (5.9%) |
| Total | 21,811 (100.0%) | 18,870 (100.0%) |
Housing Structure by Heating Type in Renton
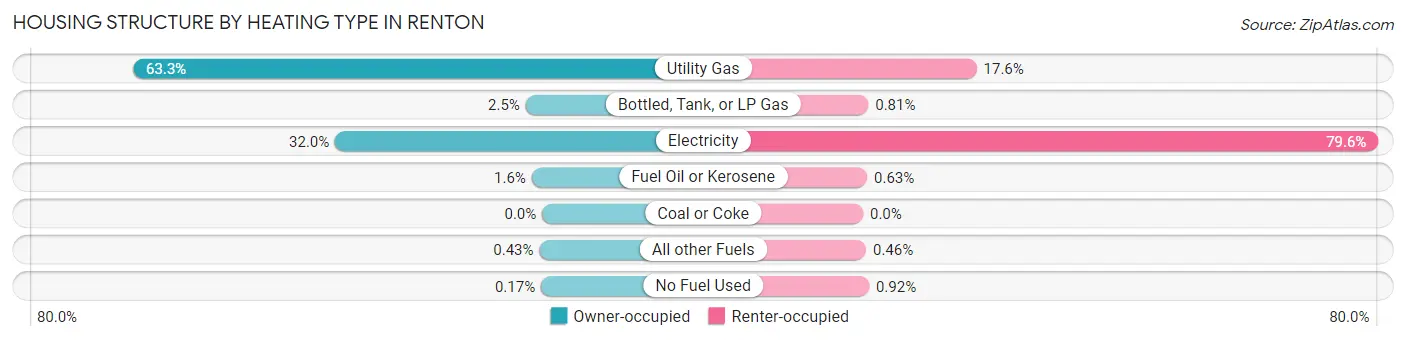
| Heating Type | Owner-occupied | Renter-occupied |
| Utility Gas | 13,795 (63.2%) | 3,313 (17.6%) |
| Bottled, Tank, or LP Gas | 555 (2.5%) | 153 (0.8%) |
| Electricity | 6,979 (32.0%) | 15,026 (79.6%) |
| Fuel Oil or Kerosene | 352 (1.6%) | 118 (0.6%) |
| Coal or Coke | 0 (0.0%) | 0 (0.0%) |
| All other Fuels | 94 (0.4%) | 86 (0.5%) |
| No Fuel Used | 36 (0.2%) | 174 (0.9%) |
| Total | 21,811 (100.0%) | 18,870 (100.0%) |
Household Vehicle Usage in Renton
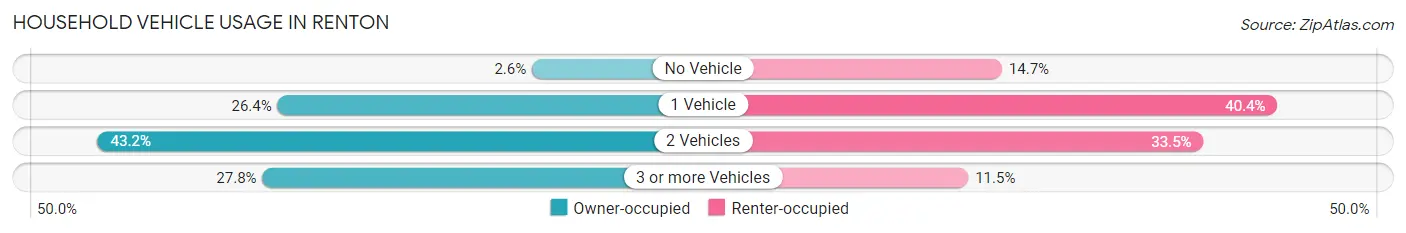
| Vehicles per Household | Owner-occupied | Renter-occupied |
| No Vehicle | 574 (2.6%) | 2,766 (14.7%) |
| 1 Vehicle | 5,755 (26.4%) | 7,618 (40.4%) |
| 2 Vehicles | 9,418 (43.2%) | 6,314 (33.5%) |
| 3 or more Vehicles | 6,064 (27.8%) | 2,172 (11.5%) |
| Total | 21,811 (100.0%) | 18,870 (100.0%) |
Real Estate & Mortgages in Renton
Real Estate and Mortgage Overview in Renton
| Characteristic | Without Mortgage | With Mortgage |
| Housing Units | 6,759 | 15,052 |
| Median Property Value | $519,000 | $601,100 |
| Median Household Income | $89,569 | $6,762 |
| Monthly Housing Costs | $855 | $5,293 |
| Real Estate Taxes | $5,269 | $371 |
Property Value by Mortgage Status in Renton
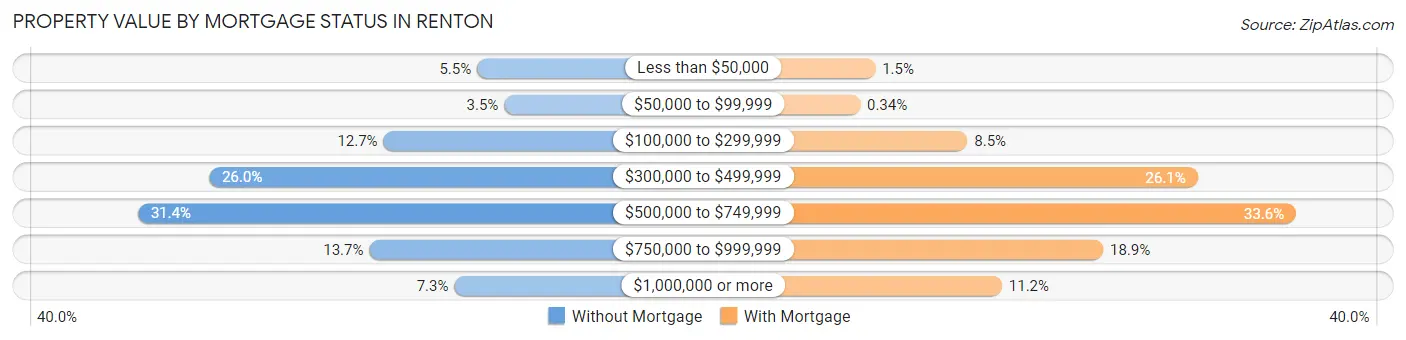
| Property Value | Without Mortgage | With Mortgage |
| Less than $50,000 | 374 (5.5%) | 226 (1.5%) |
| $50,000 to $99,999 | 234 (3.5%) | 51 (0.3%) |
| $100,000 to $299,999 | 856 (12.7%) | 1,283 (8.5%) |
| $300,000 to $499,999 | 1,754 (26.0%) | 3,923 (26.1%) |
| $500,000 to $749,999 | 2,121 (31.4%) | 5,052 (33.6%) |
| $750,000 to $999,999 | 929 (13.7%) | 2,839 (18.9%) |
| $1,000,000 or more | 491 (7.3%) | 1,678 (11.2%) |
| Total | 6,759 (100.0%) | 15,052 (100.0%) |
Household Income by Mortgage Status in Renton
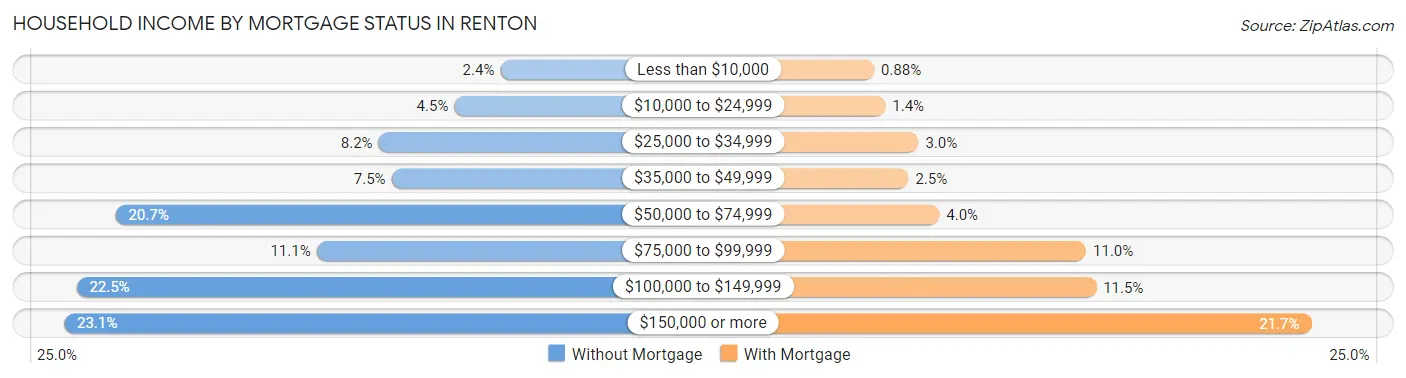
| Household Income | Without Mortgage | With Mortgage |
| Less than $10,000 | 159 (2.4%) | 133 (0.9%) |
| $10,000 to $24,999 | 307 (4.5%) | 213 (1.4%) |
| $25,000 to $34,999 | 551 (8.2%) | 451 (3.0%) |
| $35,000 to $49,999 | 509 (7.5%) | 380 (2.5%) |
| $50,000 to $74,999 | 1,397 (20.7%) | 601 (4.0%) |
| $75,000 to $99,999 | 750 (11.1%) | 1,653 (11.0%) |
| $100,000 to $149,999 | 1,523 (22.5%) | 1,725 (11.5%) |
| $150,000 or more | 1,563 (23.1%) | 3,267 (21.7%) |
| Total | 6,759 (100.0%) | 15,052 (100.0%) |
Property Value to Household Income Ratio in Renton
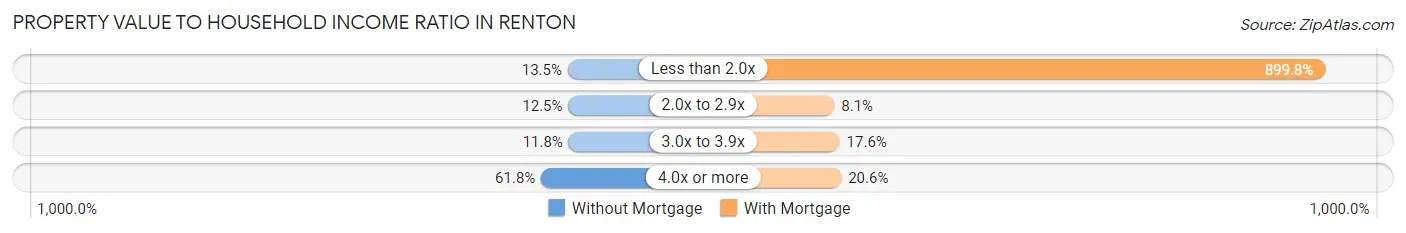
| Value-to-Income Ratio | Without Mortgage | With Mortgage |
| Less than 2.0x | 909 (13.5%) | 135,431 (899.8%) |
| 2.0x to 2.9x | 843 (12.5%) | 1,214 (8.1%) |
| 3.0x to 3.9x | 800 (11.8%) | 2,655 (17.6%) |
| 4.0x or more | 4,180 (61.8%) | 3,094 (20.6%) |
| Total | 6,759 (100.0%) | 15,052 (100.0%) |
Real Estate Taxes by Mortgage Status in Renton
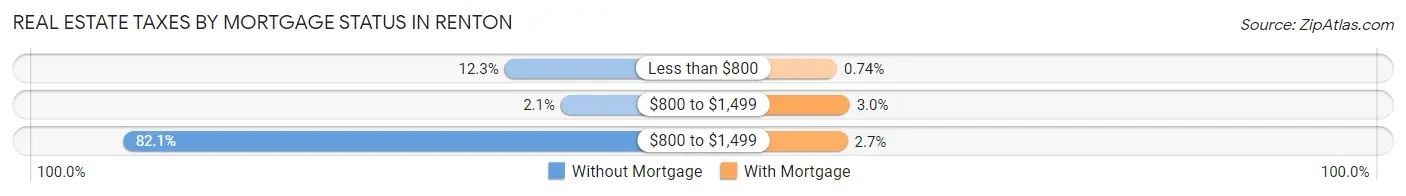
| Property Taxes | Without Mortgage | With Mortgage |
| Less than $800 | 834 (12.3%) | 112 (0.7%) |
| $800 to $1,499 | 140 (2.1%) | 457 (3.0%) |
| $800 to $1,499 | 5,548 (82.1%) | 401 (2.7%) |
| Total | 6,759 (100.0%) | 15,052 (100.0%) |
Health & Disability in Renton
Health Insurance Coverage by Age in Renton
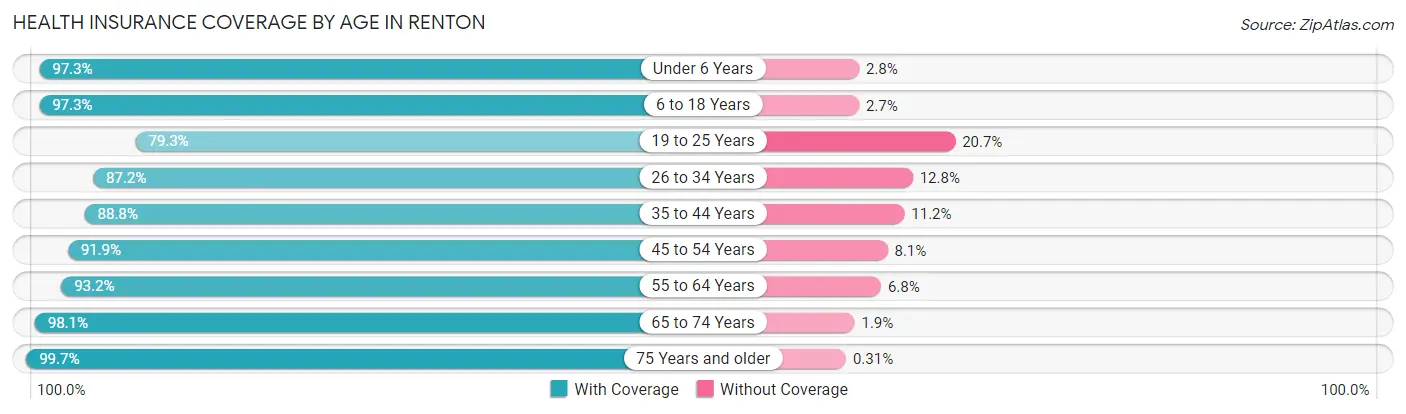
| Age Bracket | With Coverage | Without Coverage |
| Under 6 Years | 7,888 (97.3%) | 223 (2.8%) |
| 6 to 18 Years | 14,521 (97.3%) | 408 (2.7%) |
| 19 to 25 Years | 7,433 (79.3%) | 1,938 (20.7%) |
| 26 to 34 Years | 15,752 (87.2%) | 2,304 (12.8%) |
| 35 to 44 Years | 13,833 (88.8%) | 1,744 (11.2%) |
| 45 to 54 Years | 13,144 (91.9%) | 1,152 (8.1%) |
| 55 to 64 Years | 11,013 (93.2%) | 808 (6.8%) |
| 65 to 74 Years | 7,235 (98.1%) | 141 (1.9%) |
| 75 Years and older | 5,477 (99.7%) | 17 (0.3%) |
| Total | 96,296 (91.7%) | 8,735 (8.3%) |
Health Insurance Coverage by Citizenship Status in Renton
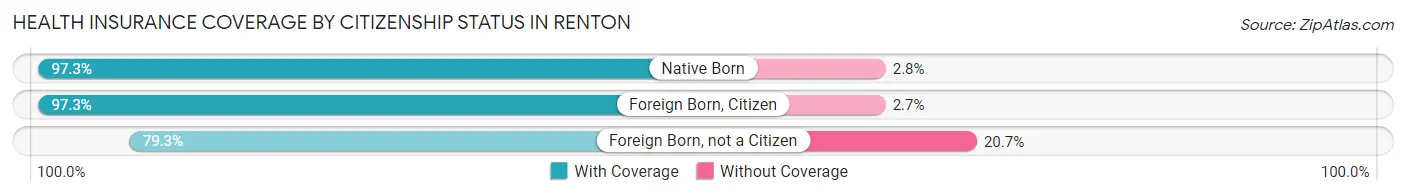
| Citizenship Status | With Coverage | Without Coverage |
| Native Born | 7,888 (97.3%) | 223 (2.8%) |
| Foreign Born, Citizen | 14,521 (97.3%) | 408 (2.7%) |
| Foreign Born, not a Citizen | 7,433 (79.3%) | 1,938 (20.7%) |
Health Insurance Coverage by Household Income in Renton
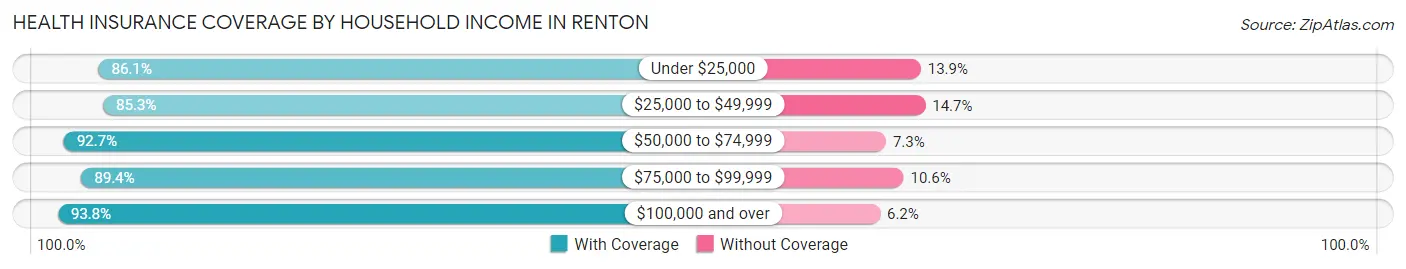
| Household Income | With Coverage | Without Coverage |
| Under $25,000 | 5,401 (86.1%) | 869 (13.9%) |
| $25,000 to $49,999 | 9,094 (85.3%) | 1,569 (14.7%) |
| $50,000 to $74,999 | 14,231 (92.7%) | 1,127 (7.3%) |
| $75,000 to $99,999 | 12,688 (89.4%) | 1,510 (10.6%) |
| $100,000 and over | 54,393 (93.8%) | 3,612 (6.2%) |
Public vs Private Health Insurance Coverage by Age in Renton
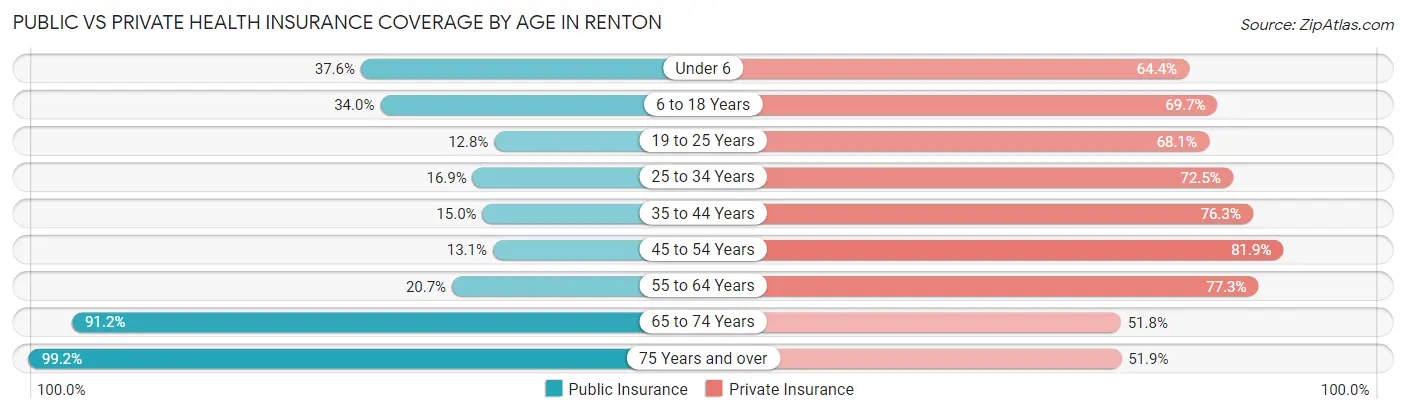
| Age Bracket | Public Insurance | Private Insurance |
| Under 6 | 3,050 (37.6%) | 5,225 (64.4%) |
| 6 to 18 Years | 5,074 (34.0%) | 10,409 (69.7%) |
| 19 to 25 Years | 1,203 (12.8%) | 6,382 (68.1%) |
| 25 to 34 Years | 3,044 (16.9%) | 13,098 (72.5%) |
| 35 to 44 Years | 2,340 (15.0%) | 11,880 (76.3%) |
| 45 to 54 Years | 1,871 (13.1%) | 11,712 (81.9%) |
| 55 to 64 Years | 2,444 (20.7%) | 9,139 (77.3%) |
| 65 to 74 Years | 6,727 (91.2%) | 3,819 (51.8%) |
| 75 Years and over | 5,450 (99.2%) | 2,850 (51.9%) |
| Total | 31,203 (29.7%) | 74,514 (70.9%) |
Disability Status by Sex by Age in Renton
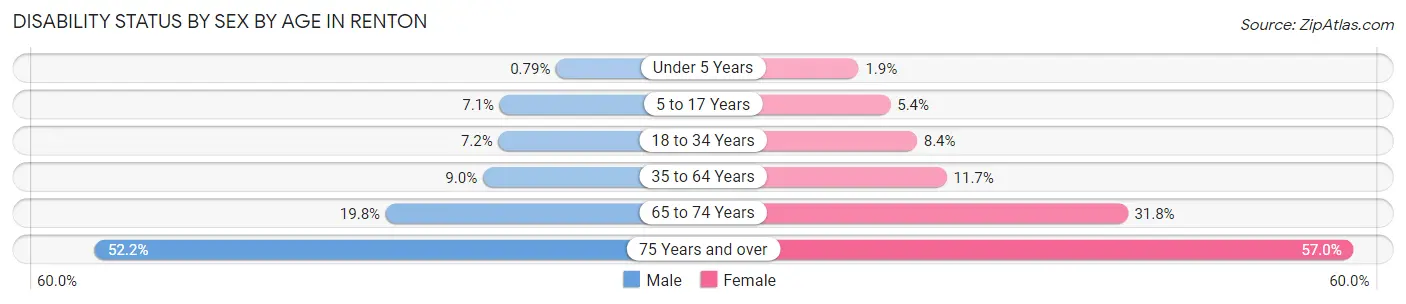
| Age Bracket | Male | Female |
| Under 5 Years | 29 (0.8%) | 59 (1.9%) |
| 5 to 17 Years | 519 (7.1%) | 407 (5.4%) |
| 18 to 34 Years | 1,069 (7.2%) | 1,163 (8.4%) |
| 35 to 64 Years | 1,943 (8.9%) | 2,331 (11.7%) |
| 65 to 74 Years | 614 (19.8%) | 1,358 (31.8%) |
| 75 Years and over | 1,145 (52.2%) | 1,880 (57.0%) |
Disability Class by Sex by Age in Renton
Disability Class: Hearing Difficulty
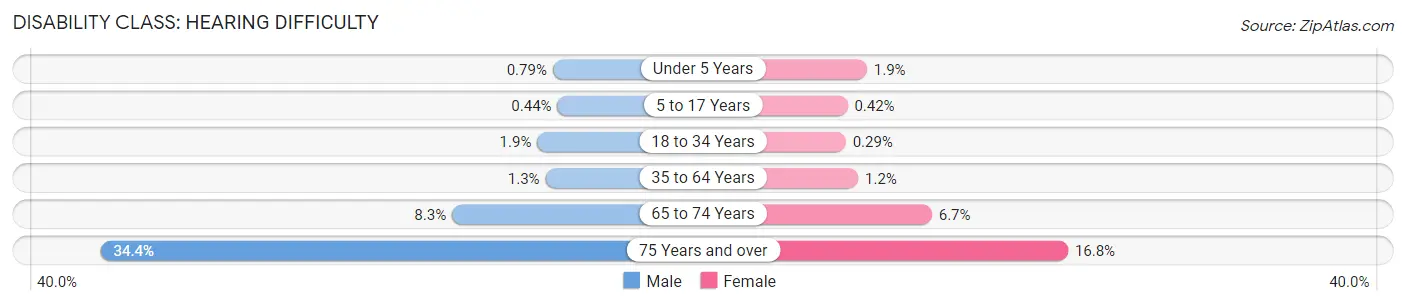
| Age Bracket | Male | Female |
| Under 5 Years | 29 (0.8%) | 59 (1.9%) |
| 5 to 17 Years | 32 (0.4%) | 32 (0.4%) |
| 18 to 34 Years | 287 (1.9%) | 40 (0.3%) |
| 35 to 64 Years | 289 (1.3%) | 242 (1.2%) |
| 65 to 74 Years | 257 (8.3%) | 285 (6.7%) |
| 75 Years and over | 754 (34.4%) | 554 (16.8%) |
Disability Class: Vision Difficulty
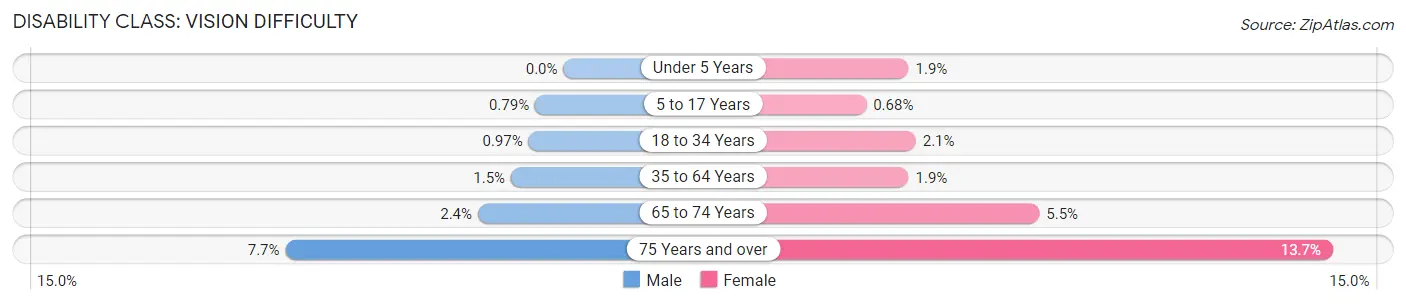
| Age Bracket | Male | Female |
| Under 5 Years | 0 (0.0%) | 59 (1.9%) |
| 5 to 17 Years | 58 (0.8%) | 51 (0.7%) |
| 18 to 34 Years | 143 (1.0%) | 287 (2.1%) |
| 35 to 64 Years | 316 (1.5%) | 372 (1.9%) |
| 65 to 74 Years | 74 (2.4%) | 235 (5.5%) |
| 75 Years and over | 170 (7.7%) | 451 (13.7%) |
Disability Class: Cognitive Difficulty
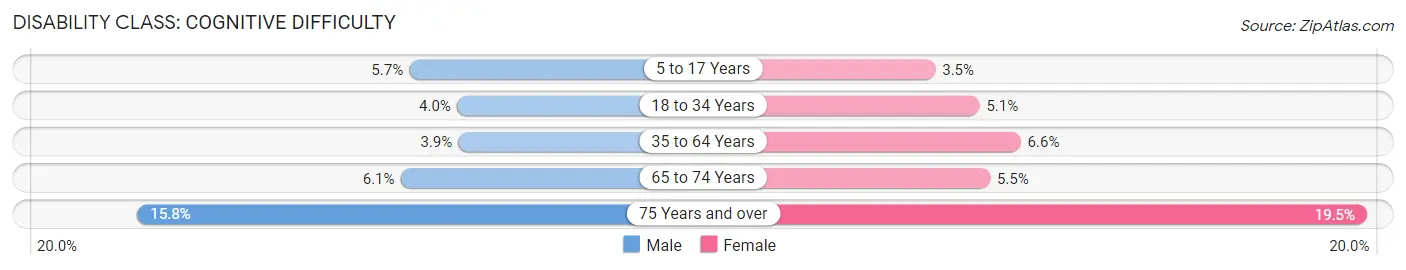
| Age Bracket | Male | Female |
| 5 to 17 Years | 421 (5.7%) | 262 (3.5%) |
| 18 to 34 Years | 587 (4.0%) | 712 (5.1%) |
| 35 to 64 Years | 850 (3.9%) | 1,326 (6.6%) |
| 65 to 74 Years | 188 (6.0%) | 235 (5.5%) |
| 75 Years and over | 347 (15.8%) | 643 (19.5%) |
Disability Class: Ambulatory Difficulty
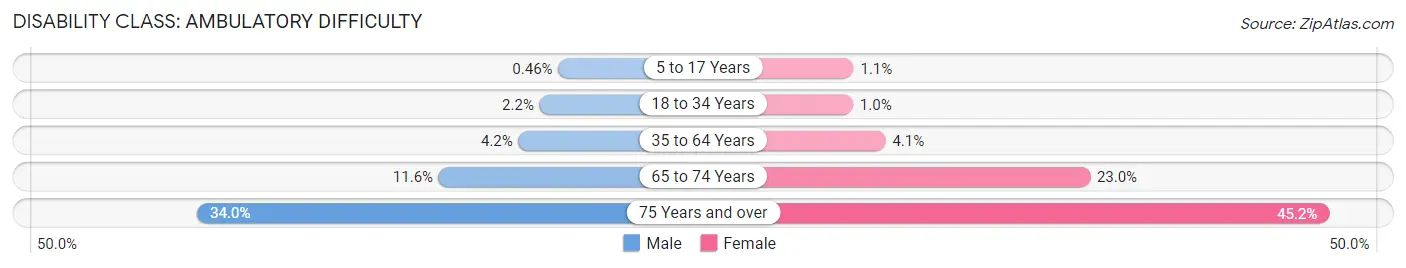
| Age Bracket | Male | Female |
| 5 to 17 Years | 34 (0.5%) | 82 (1.1%) |
| 18 to 34 Years | 325 (2.2%) | 144 (1.0%) |
| 35 to 64 Years | 900 (4.2%) | 809 (4.1%) |
| 65 to 74 Years | 359 (11.6%) | 983 (23.0%) |
| 75 Years and over | 746 (34.0%) | 1,492 (45.2%) |
Disability Class: Self-Care Difficulty
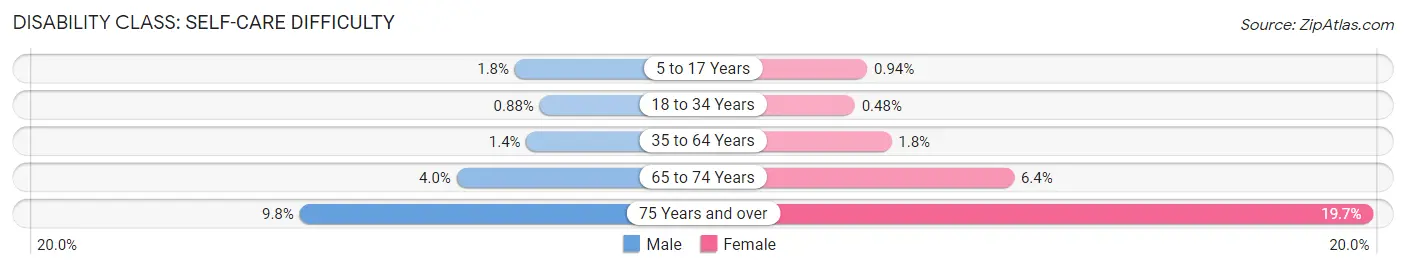
| Age Bracket | Male | Female |
| 5 to 17 Years | 132 (1.8%) | 71 (0.9%) |
| 18 to 34 Years | 130 (0.9%) | 67 (0.5%) |
| 35 to 64 Years | 297 (1.4%) | 367 (1.8%) |
| 65 to 74 Years | 123 (4.0%) | 273 (6.4%) |
| 75 Years and over | 215 (9.8%) | 651 (19.7%) |
Technology Access in Renton
Computing Device Access in Renton
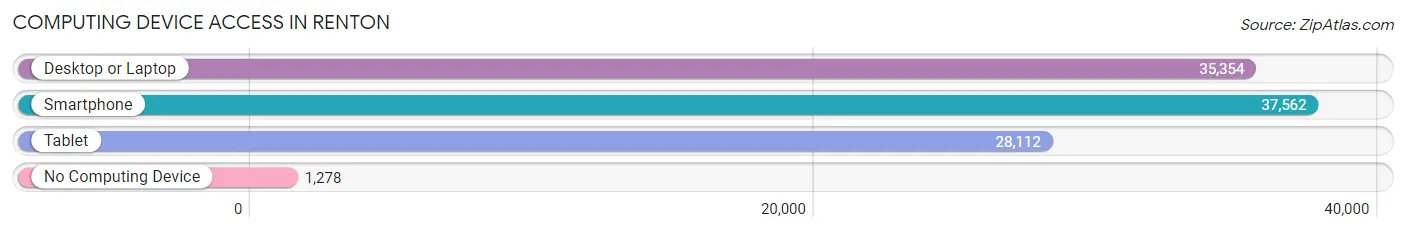
| Device Type | # Households | % Households |
| Desktop or Laptop | 35,354 | 86.9% |
| Smartphone | 37,562 | 92.3% |
| Tablet | 28,112 | 69.1% |
| No Computing Device | 1,278 | 3.1% |
| Total | 40,681 | 100.0% |
Internet Access in Renton
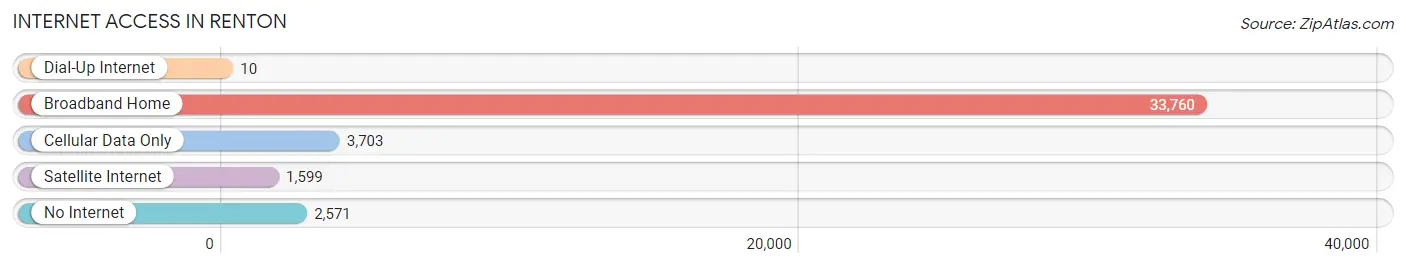
| Internet Type | # Households | % Households |
| Dial-Up Internet | 10 | 0.0% |
| Broadband Home | 33,760 | 83.0% |
| Cellular Data Only | 3,703 | 9.1% |
| Satellite Internet | 1,599 | 3.9% |
| No Internet | 2,571 | 6.3% |
| Total | 40,681 | 100.0% |
Renton Summary
Renton, Washington is a city located in King County, Washington, United States. It is situated 11 miles (18 km) southeast of Seattle and is part of the Seattle metropolitan area. The population was 90,927 at the 2010 census. Renton is the 8th largest city in Washington and the fourth largest in King County.
History
Renton was first settled in the late 1800s by settlers from the East Coast. The first settler was William Renton, who arrived in 1853 and established a homestead on the Cedar River. The town was officially incorporated in 1901 and was named after William Renton.
Renton experienced rapid growth in the early 20th century, due to the construction of the Cedar River Dam and the development of the Boeing Company. The city was also home to the Renton Airfield, which was used by the US Army Air Corps during World War II.
Geography
Renton is located in King County, Washington, at the confluence of the Cedar and Black Rivers. It is situated 11 miles (18 km) southeast of Seattle and is part of the Seattle metropolitan area. The city covers an area of 24.3 square miles (62.8 km2).
The city is located in the Puget Sound lowlands, and is surrounded by several lakes, including Lake Washington, Lake Sammamish, and Lake Youngs. The city is also home to several parks, including Coulon Park, Gene Coulon Memorial Beach Park, and Liberty Park.
Economy
Renton is home to several major employers, including Boeing, Providence Health & Services, and the Valley Medical Center. The city is also home to several shopping centers, including The Landing, Southcenter Mall, and the Renton Village Shopping Center.
The city is also home to several technology companies, including Microsoft, Nintendo, and T-Mobile. The city is also home to several manufacturing companies, including Boeing, PACCAR, and Paccar Parts.
Demographics
As of the 2010 census, the population of Renton was 90,927. The racial makeup of the city was 57.2% White, 16.3% Asian, 14.2% African American, 0.7% Native American, 0.3% Pacific Islander, and 11.5% from other races. The median household income was $63,837, and the median family income was $71,837.
Conclusion
Renton, Washington is a city located in King County, Washington, United States. It is situated 11 miles (18 km) southeast of Seattle and is part of the Seattle metropolitan area. The population was 90,927 at the 2010 census. Renton is the 8th largest city in Washington and the fourth largest in King County. The city is home to several major employers, including Boeing, Providence Health & Services, and the Valley Medical Center. The city is also home to several technology companies, including Microsoft, Nintendo, and T-Mobile. The city is also home to several manufacturing companies, including Boeing, PACCAR, and Paccar Parts. The racial makeup of the city was 57.2% White, 16.3% Asian, 14.2% African American, 0.7% Native American, 0.3% Pacific Islander, and 11.5% from other races. The median household income was $63,837, and the median family income was $71,837.
Common Questions
What is Per Capita Income in Renton?
Per Capita income in Renton is $47,060.
What is the Median Family Income in Renton?
Median Family Income in Renton is $109,054.
What is the Median Household income in Renton?
Median Household Income in Renton is $92,292.
What is Income or Wage Gap in Renton?
Income or Wage Gap in Renton is 23.7%.
Women in Renton earn 76.3 cents for every dollar earned by a man.
What is Family Income Deficit in Renton?
Family Income Deficit in Renton is $9,812.
Families that are below poverty line in Renton earn $9,812 less on average than the poverty threshold level.
What is Inequality or Gini Index in Renton?
Inequality or Gini Index in Renton is 0.42.
What is the Total Population of Renton?
Total Population of Renton is 105,355.
What is the Total Male Population of Renton?
Total Male Population of Renton is 53,006.
What is the Total Female Population of Renton?
Total Female Population of Renton is 52,349.
What is the Ratio of Males per 100 Females in Renton?
There are 101.26 Males per 100 Females in Renton.
What is the Ratio of Females per 100 Males in Renton?
There are 98.76 Females per 100 Males in Renton.
What is the Median Population Age in Renton?
Median Population Age in Renton is 36.1 Years.
What is the Average Family Size in Renton
Average Family Size in Renton is 3.2 People.
What is the Average Household Size in Renton
Average Household Size in Renton is 2.6 People.
How Large is the Labor Force in Renton?
There are 60,637 People in the Labor Forcein in Renton.
What is the Percentage of People in the Labor Force in Renton?
70.7% of People are in the Labor Force in Renton.
What is the Unemployment Rate in Renton?
Unemployment Rate in Renton is 4.2%.