Cities with the Most Immigrants from Philippines in Minnesota
RELATED REPORTS & OPTIONS
Philippines
Minnesota
Compare Cities
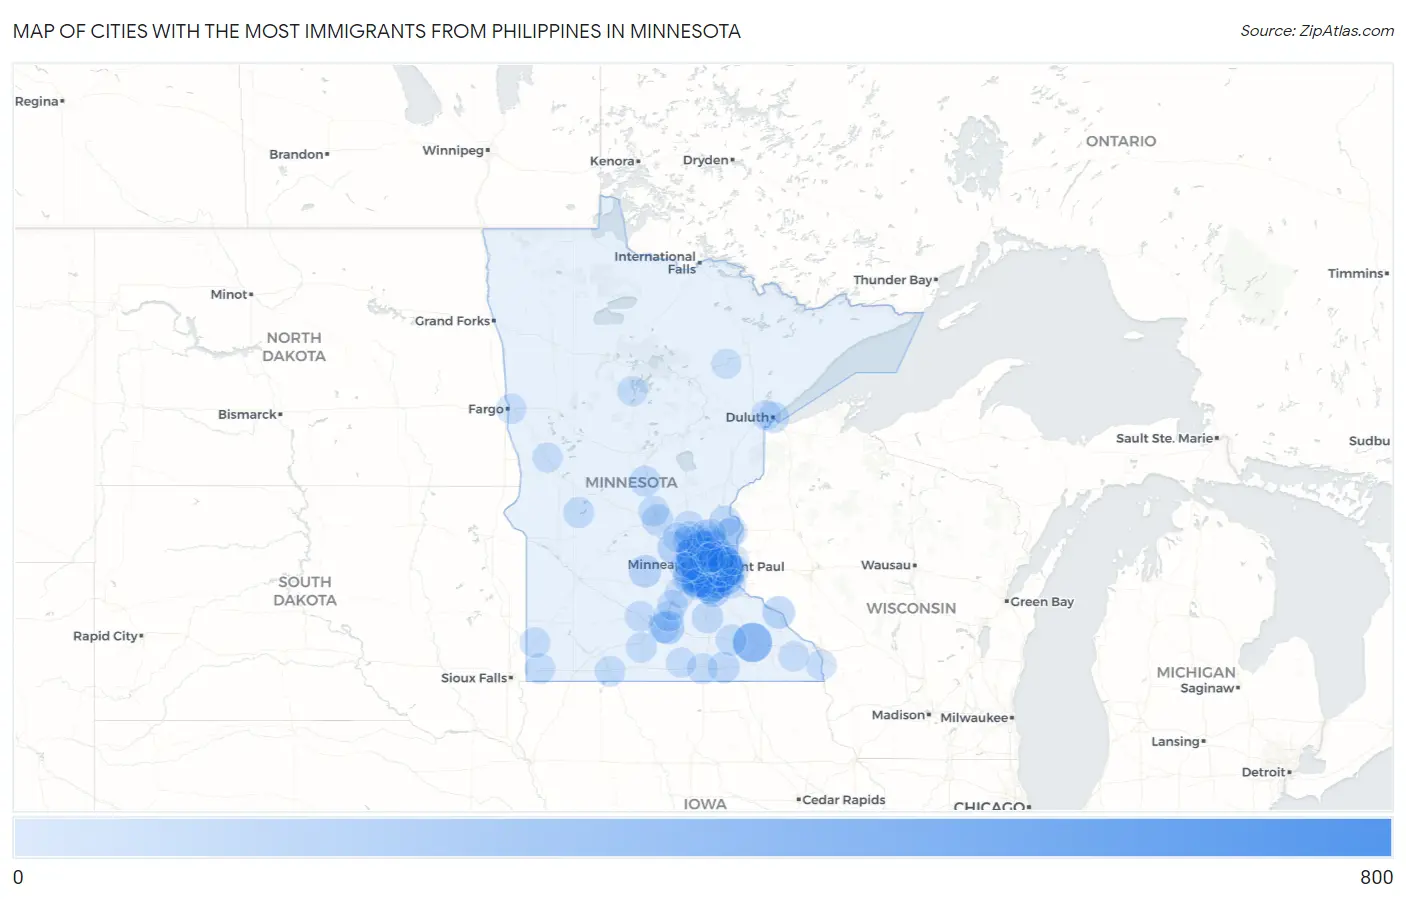
Map of Cities with the Most Immigrants from Philippines in Minnesota
0
800
Cities with the Most Immigrants from Philippines in Minnesota
| City | Philippines | vs State | vs National | |
| 1. | St Paul | 649 | 9,850(6.59%)#1 | 1,985,710(0.03%)#440 |
| 2. | Minneapolis | 638 | 9,850(6.48%)#2 | 1,985,710(0.03%)#450 |
| 3. | Rochester | 305 | 9,850(3.10%)#3 | 1,985,710(0.02%)#808 |
| 4. | Maple Grove | 287 | 9,850(2.91%)#4 | 1,985,710(0.01%)#855 |
| 5. | Apple Valley | 287 | 9,850(2.91%)#5 | 1,985,710(0.01%)#856 |
| 6. | Plymouth | 282 | 9,850(2.86%)#6 | 1,985,710(0.01%)#868 |
| 7. | Burnsville | 246 | 9,850(2.50%)#7 | 1,985,710(0.01%)#976 |
| 8. | Maplewood | 246 | 9,850(2.50%)#8 | 1,985,710(0.01%)#977 |
| 9. | Eagan | 245 | 9,850(2.49%)#9 | 1,985,710(0.01%)#979 |
| 10. | Blaine | 235 | 9,850(2.39%)#10 | 1,985,710(0.01%)#1,009 |
| 11. | Coon Rapids | 202 | 9,850(2.05%)#11 | 1,985,710(0.01%)#1,143 |
| 12. | Bloomington | 192 | 9,850(1.95%)#12 | 1,985,710(0.01%)#1,204 |
| 13. | St Louis Park | 178 | 9,850(1.81%)#13 | 1,985,710(0.01%)#1,285 |
| 14. | Eden Prairie | 163 | 9,850(1.65%)#14 | 1,985,710(0.01%)#1,366 |
| 15. | Woodbury | 155 | 9,850(1.57%)#15 | 1,985,710(0.01%)#1,411 |
| 16. | Cottage Grove | 145 | 9,850(1.47%)#16 | 1,985,710(0.01%)#1,476 |
| 17. | Brooklyn Park | 138 | 9,850(1.40%)#17 | 1,985,710(0.01%)#1,532 |
| 18. | Mounds View | 135 | 9,850(1.37%)#18 | 1,985,710(0.01%)#1,557 |
| 19. | Mankato | 127 | 9,850(1.29%)#19 | 1,985,710(0.01%)#1,635 |
| 20. | Farmington | 126 | 9,850(1.28%)#20 | 1,985,710(0.01%)#1,646 |
| 21. | Crystal | 112 | 9,850(1.14%)#21 | 1,985,710(0.01%)#1,769 |
| 22. | Buffalo | 102 | 9,850(1.04%)#22 | 1,985,710(0.01%)#1,891 |
| 23. | Rosemount | 101 | 9,850(1.03%)#23 | 1,985,710(0.01%)#1,901 |
| 24. | New Hope | 100 | 9,850(1.02%)#24 | 1,985,710(0.01%)#1,915 |
| 25. | Savage | 99 | 9,850(1.01%)#25 | 1,985,710(0.00%)#1,923 |
| 26. | West St Paul | 99 | 9,850(1.01%)#26 | 1,985,710(0.00%)#1,925 |
| 27. | Richfield | 96 | 9,850(0.97%)#27 | 1,985,710(0.00%)#1,968 |
| 28. | Chanhassen | 95 | 9,850(0.96%)#28 | 1,985,710(0.00%)#1,983 |
| 29. | Inver Grove Heights | 93 | 9,850(0.94%)#29 | 1,985,710(0.00%)#2,016 |
| 30. | Wabasha | 92 | 9,850(0.93%)#30 | 1,985,710(0.00%)#2,046 |
| 31. | Hutchinson | 89 | 9,850(0.90%)#31 | 1,985,710(0.00%)#2,076 |
| 32. | Chaska | 84 | 9,850(0.85%)#32 | 1,985,710(0.00%)#2,143 |
| 33. | St Anthony City Hennepin And Ramsey Counties | 76 | 9,850(0.77%)#33 | 1,985,710(0.00%)#2,292 |
| 34. | Shoreview | 72 | 9,850(0.73%)#34 | 1,985,710(0.00%)#2,358 |
| 35. | Shakopee | 71 | 9,850(0.72%)#35 | 1,985,710(0.00%)#2,386 |
| 36. | Oakdale | 66 | 9,850(0.67%)#36 | 1,985,710(0.00%)#2,476 |
| 37. | Mendota Heights | 66 | 9,850(0.67%)#37 | 1,985,710(0.00%)#2,483 |
| 38. | Golden Valley | 64 | 9,850(0.65%)#38 | 1,985,710(0.00%)#2,518 |
| 39. | Wayzata | 59 | 9,850(0.60%)#39 | 1,985,710(0.00%)#2,649 |
| 40. | Ramsey | 58 | 9,850(0.59%)#40 | 1,985,710(0.00%)#2,658 |
| 41. | Faribault | 57 | 9,850(0.58%)#41 | 1,985,710(0.00%)#2,683 |
| 42. | St Cloud | 55 | 9,850(0.56%)#42 | 1,985,710(0.00%)#2,722 |
| 43. | Austin | 55 | 9,850(0.56%)#43 | 1,985,710(0.00%)#2,726 |
| 44. | Edina | 54 | 9,850(0.55%)#44 | 1,985,710(0.00%)#2,748 |
| 45. | Lakeville | 53 | 9,850(0.54%)#45 | 1,985,710(0.00%)#2,780 |
| 46. | Minnetonka | 53 | 9,850(0.54%)#46 | 1,985,710(0.00%)#2,782 |
| 47. | Robbinsdale | 50 | 9,850(0.51%)#47 | 1,985,710(0.00%)#2,882 |
| 48. | North Branch | 50 | 9,850(0.51%)#48 | 1,985,710(0.00%)#2,886 |
| 49. | North Mankato | 49 | 9,850(0.50%)#49 | 1,985,710(0.00%)#2,919 |
| 50. | Vadnais Heights | 49 | 9,850(0.50%)#50 | 1,985,710(0.00%)#2,921 |
| 51. | Dodge Center | 48 | 9,850(0.49%)#51 | 1,985,710(0.00%)#2,962 |
| 52. | Prior Lake | 47 | 9,850(0.48%)#52 | 1,985,710(0.00%)#2,971 |
| 53. | Duluth | 42 | 9,850(0.43%)#53 | 1,985,710(0.00%)#3,140 |
| 54. | Starbuck | 42 | 9,850(0.43%)#54 | 1,985,710(0.00%)#3,184 |
| 55. | Arden Hills | 40 | 9,850(0.41%)#55 | 1,985,710(0.00%)#3,250 |
| 56. | Little Falls | 39 | 9,850(0.40%)#56 | 1,985,710(0.00%)#3,296 |
| 57. | Zimmerman | 38 | 9,850(0.39%)#57 | 1,985,710(0.00%)#3,356 |
| 58. | Sartell | 36 | 9,850(0.37%)#58 | 1,985,710(0.00%)#3,422 |
| 59. | Albert Lea | 36 | 9,850(0.37%)#59 | 1,985,710(0.00%)#3,423 |
| 60. | South St Paul | 35 | 9,850(0.36%)#60 | 1,985,710(0.00%)#3,462 |
| 61. | Ham Lake | 35 | 9,850(0.36%)#61 | 1,985,710(0.00%)#3,471 |
| 62. | Orono | 34 | 9,850(0.35%)#62 | 1,985,710(0.00%)#3,535 |
| 63. | Chisago City | 33 | 9,850(0.34%)#63 | 1,985,710(0.00%)#3,587 |
| 64. | Elk River | 31 | 9,850(0.31%)#64 | 1,985,710(0.00%)#3,666 |
| 65. | New Ulm | 31 | 9,850(0.31%)#65 | 1,985,710(0.00%)#3,671 |
| 66. | Brooklyn Center | 30 | 9,850(0.30%)#66 | 1,985,710(0.00%)#3,717 |
| 67. | White Bear Lake | 30 | 9,850(0.30%)#67 | 1,985,710(0.00%)#3,720 |
| 68. | Jackson | 30 | 9,850(0.30%)#68 | 1,985,710(0.00%)#3,764 |
| 69. | Luverne | 29 | 9,850(0.29%)#69 | 1,985,710(0.00%)#3,824 |
| 70. | St Peter | 28 | 9,850(0.28%)#70 | 1,985,710(0.00%)#3,862 |
| 71. | Pipestone | 28 | 9,850(0.28%)#71 | 1,985,710(0.00%)#3,884 |
| 72. | Lewisville | 28 | 9,850(0.28%)#72 | 1,985,710(0.00%)#3,897 |
| 73. | Little Canada | 27 | 9,850(0.27%)#73 | 1,985,710(0.00%)#3,926 |
| 74. | Spring Lake Park | 27 | 9,850(0.27%)#74 | 1,985,710(0.00%)#3,941 |
| 75. | Corcoran | 27 | 9,850(0.27%)#75 | 1,985,710(0.00%)#3,943 |
| 76. | Landfall | 27 | 9,850(0.27%)#76 | 1,985,710(0.00%)#3,970 |
| 77. | Anoka | 26 | 9,850(0.26%)#77 | 1,985,710(0.00%)#3,985 |
| 78. | Rushford | 26 | 9,850(0.26%)#78 | 1,985,710(0.00%)#4,032 |
| 79. | Roseville | 24 | 9,850(0.24%)#79 | 1,985,710(0.00%)#4,096 |
| 80. | Oak Grove | 24 | 9,850(0.24%)#80 | 1,985,710(0.00%)#4,123 |
| 81. | Belle Plaine | 24 | 9,850(0.24%)#81 | 1,985,710(0.00%)#4,132 |
| 82. | Brownsville | 24 | 9,850(0.24%)#82 | 1,985,710(0.00%)#4,154 |
| 83. | Columbia Heights | 21 | 9,850(0.21%)#83 | 1,985,710(0.00%)#4,297 |
| 84. | Otsego | 21 | 9,850(0.21%)#84 | 1,985,710(0.00%)#4,300 |
| 85. | Le Sueur | 21 | 9,850(0.21%)#85 | 1,985,710(0.00%)#4,348 |
| 86. | Fergus Falls | 20 | 9,850(0.20%)#86 | 1,985,710(0.00%)#4,385 |
| 87. | Afton | 19 | 9,850(0.19%)#87 | 1,985,710(0.00%)#4,503 |
| 88. | Moorhead | 18 | 9,850(0.18%)#88 | 1,985,710(0.00%)#4,535 |
| 89. | North St Paul | 18 | 9,850(0.18%)#89 | 1,985,710(0.00%)#4,555 |
| 90. | Hermantown | 18 | 9,850(0.18%)#90 | 1,985,710(0.00%)#4,560 |
| 91. | Lindstrom | 18 | 9,850(0.18%)#91 | 1,985,710(0.00%)#4,576 |
| 92. | Walker | 18 | 9,850(0.18%)#92 | 1,985,710(0.00%)#4,599 |
| 93. | Wells | 17 | 9,850(0.17%)#93 | 1,985,710(0.00%)#4,680 |
| 94. | Hastings | 16 | 9,850(0.16%)#94 | 1,985,710(0.00%)#4,713 |
| 95. | East Bethel | 16 | 9,850(0.16%)#95 | 1,985,710(0.00%)#4,733 |
| 96. | Mound | 16 | 9,850(0.16%)#96 | 1,985,710(0.00%)#4,741 |
| 97. | Oak Park Heights | 16 | 9,850(0.16%)#97 | 1,985,710(0.00%)#4,765 |
| 98. | New Brighton | 15 | 9,850(0.15%)#98 | 1,985,710(0.00%)#4,816 |
| 99. | Hibbing | 15 | 9,850(0.15%)#99 | 1,985,710(0.00%)#4,826 |
| 100. | Monticello | 15 | 9,850(0.15%)#100 | 1,985,710(0.00%)#4,829 |
Common Questions
What are the Top 10 Cities with the Most Immigrants from Philippines in Minnesota?
Top 10 Cities with the Most Immigrants from Philippines in Minnesota are:
#1
649
#2
638
#3
305
#4
287
#5
287
#6
282
#7
246
#8
246
#9
245
#10
235
What city has the Most Immigrants from Philippines in Minnesota?
St Paul has the Most Immigrants from Philippines in Minnesota with 649.
What is the Total Immigrants from Philippines in the State of Minnesota?
Total Immigrants from Philippines in Minnesota is 9,850.
What is the Total Immigrants from Philippines in the United States?
Total Immigrants from Philippines in the United States is 1,985,710.