Cities with the Most Immigrants from Philippines in Tennessee
RELATED REPORTS & OPTIONS
Philippines
Tennessee
Compare Cities
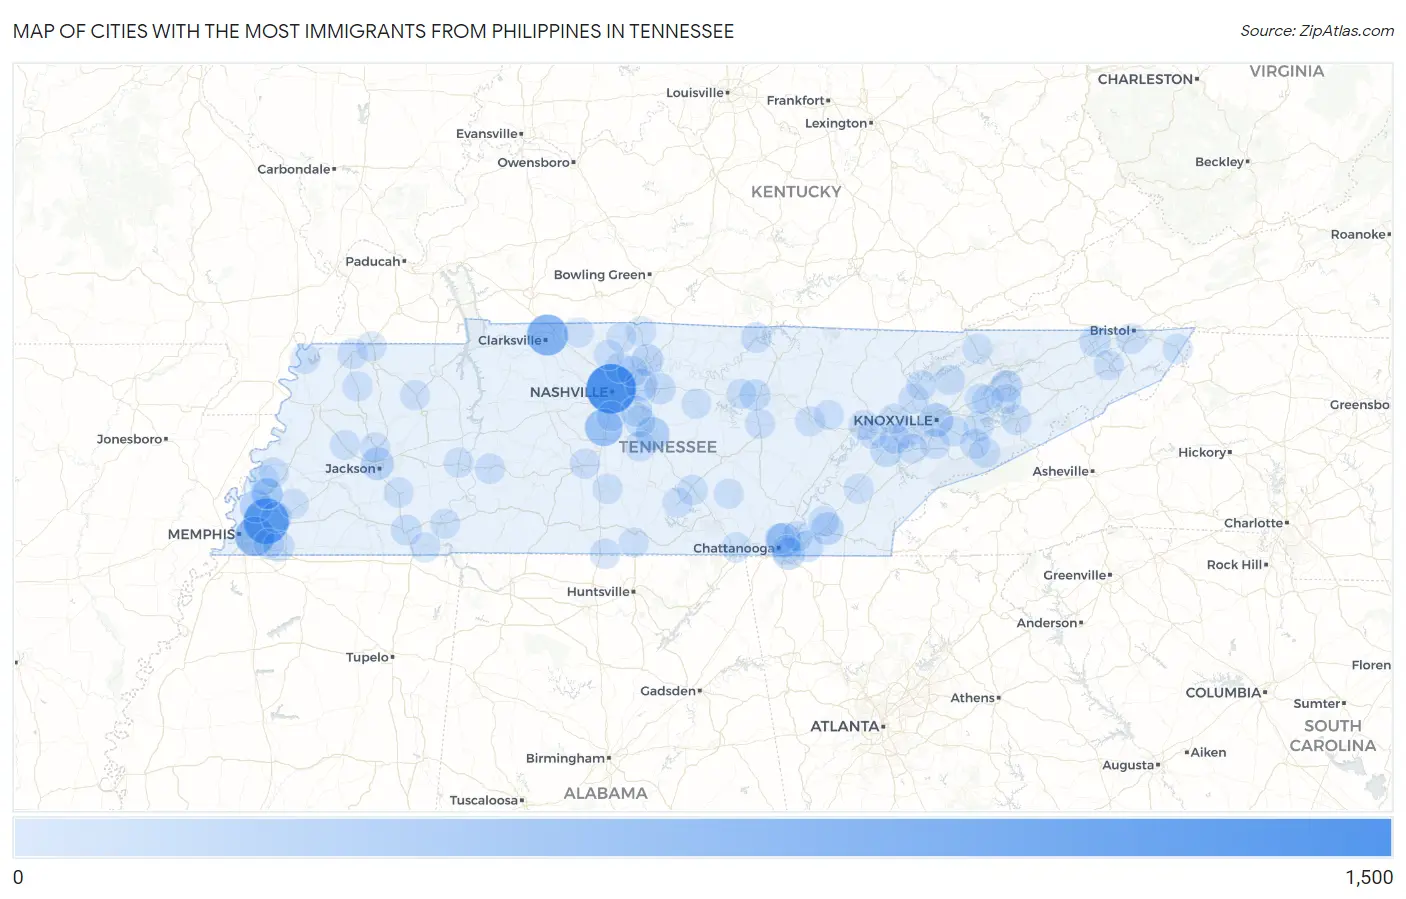
Map of Cities with the Most Immigrants from Philippines in Tennessee
0
1,500
Cities with the Most Immigrants from Philippines in Tennessee
| City | Philippines | vs State | vs National | |
| 1. | Nashville | 1,447 | 11,640(12.43%)#1 | 1,985,710(0.07%)#199 |
| 2. | Bartlett | 1,130 | 11,640(9.71%)#2 | 1,985,710(0.06%)#263 |
| 3. | Clarksville | 807 | 11,640(6.93%)#3 | 1,985,710(0.04%)#366 |
| 4. | Memphis | 675 | 11,640(5.80%)#4 | 1,985,710(0.03%)#425 |
| 5. | Franklin | 525 | 11,640(4.51%)#5 | 1,985,710(0.03%)#532 |
| 6. | Chattanooga | 314 | 11,640(2.70%)#6 | 1,985,710(0.02%)#790 |
| 7. | Knoxville | 260 | 11,640(2.23%)#7 | 1,985,710(0.01%)#933 |
| 8. | Murfreesboro | 259 | 11,640(2.23%)#8 | 1,985,710(0.01%)#934 |
| 9. | Jackson | 184 | 11,640(1.58%)#9 | 1,985,710(0.01%)#1,251 |
| 10. | Millington | 184 | 11,640(1.58%)#10 | 1,985,710(0.01%)#1,253 |
| 11. | Cleveland | 173 | 11,640(1.49%)#11 | 1,985,710(0.01%)#1,305 |
| 12. | Mount Juliet | 148 | 11,640(1.27%)#12 | 1,985,710(0.01%)#1,459 |
| 13. | Gallatin | 140 | 11,640(1.20%)#13 | 1,985,710(0.01%)#1,515 |
| 14. | East Ridge | 138 | 11,640(1.19%)#14 | 1,985,710(0.01%)#1,536 |
| 15. | Morristown | 133 | 11,640(1.14%)#15 | 1,985,710(0.01%)#1,576 |
| 16. | Munford | 112 | 11,640(0.96%)#16 | 1,985,710(0.01%)#1,774 |
| 17. | Loudon | 100 | 11,640(0.86%)#17 | 1,985,710(0.01%)#1,919 |
| 18. | Smyrna | 96 | 11,640(0.82%)#18 | 1,985,710(0.00%)#1,965 |
| 19. | Cookeville | 86 | 11,640(0.74%)#19 | 1,985,710(0.00%)#2,102 |
| 20. | Collegedale | 86 | 11,640(0.74%)#20 | 1,985,710(0.00%)#2,108 |
| 21. | Kingsport | 83 | 11,640(0.71%)#21 | 1,985,710(0.00%)#2,155 |
| 22. | Lebanon | 83 | 11,640(0.71%)#22 | 1,985,710(0.00%)#2,157 |
| 23. | Collierville | 73 | 11,640(0.63%)#23 | 1,985,710(0.00%)#2,331 |
| 24. | La Vergne | 67 | 11,640(0.58%)#24 | 1,985,710(0.00%)#2,456 |
| 25. | Lakeland | 65 | 11,640(0.56%)#25 | 1,985,710(0.00%)#2,500 |
| 26. | Lynchburg | 60 | 11,640(0.52%)#26 | 1,985,710(0.00%)#2,619 |
| 27. | Hendersonville | 59 | 11,640(0.51%)#27 | 1,985,710(0.00%)#2,626 |
| 28. | Selmer | 50 | 11,640(0.43%)#28 | 1,985,710(0.00%)#2,898 |
| 29. | Celina | 39 | 11,640(0.34%)#29 | 1,985,710(0.00%)#3,314 |
| 30. | Harrison | 35 | 11,640(0.30%)#30 | 1,985,710(0.00%)#3,486 |
| 31. | Hopewell | 34 | 11,640(0.29%)#31 | 1,985,710(0.00%)#3,552 |
| 32. | Red Bank | 33 | 11,640(0.28%)#32 | 1,985,710(0.00%)#3,575 |
| 33. | Atoka | 31 | 11,640(0.27%)#33 | 1,985,710(0.00%)#3,680 |
| 34. | Gatlinburg | 31 | 11,640(0.27%)#34 | 1,985,710(0.00%)#3,699 |
| 35. | Jefferson City | 30 | 11,640(0.26%)#35 | 1,985,710(0.00%)#3,744 |
| 36. | Rockvale | 29 | 11,640(0.25%)#36 | 1,985,710(0.00%)#3,835 |
| 37. | Clinton | 27 | 11,640(0.23%)#37 | 1,985,710(0.00%)#3,931 |
| 38. | Union City | 26 | 11,640(0.22%)#38 | 1,985,710(0.00%)#3,993 |
| 39. | Manchester | 25 | 11,640(0.21%)#39 | 1,985,710(0.00%)#4,053 |
| 40. | Goodlettsville | 24 | 11,640(0.21%)#40 | 1,985,710(0.00%)#4,110 |
| 41. | Johnson City | 23 | 11,640(0.20%)#41 | 1,985,710(0.00%)#4,157 |
| 42. | Bristol | 23 | 11,640(0.20%)#42 | 1,985,710(0.00%)#4,160 |
| 43. | Linden | 23 | 11,640(0.20%)#43 | 1,985,710(0.00%)#4,214 |
| 44. | Farragut | 19 | 11,640(0.16%)#44 | 1,985,710(0.00%)#4,451 |
| 45. | Newport | 19 | 11,640(0.16%)#45 | 1,985,710(0.00%)#4,483 |
| 46. | Oak Ridge | 17 | 11,640(0.15%)#46 | 1,985,710(0.00%)#4,609 |
| 47. | Sparta | 17 | 11,640(0.15%)#47 | 1,985,710(0.00%)#4,659 |
| 48. | Columbia | 16 | 11,640(0.14%)#48 | 1,985,710(0.00%)#4,706 |
| 49. | Harriman | 16 | 11,640(0.14%)#49 | 1,985,710(0.00%)#4,752 |
| 50. | Germantown | 15 | 11,640(0.13%)#50 | 1,985,710(0.00%)#4,809 |
| 51. | Sevierville | 15 | 11,640(0.13%)#51 | 1,985,710(0.00%)#4,823 |
| 52. | Seymour | 15 | 11,640(0.13%)#52 | 1,985,710(0.00%)#4,827 |
| 53. | Lenoir City | 15 | 11,640(0.13%)#53 | 1,985,710(0.00%)#4,836 |
| 54. | Ardmore | 15 | 11,640(0.13%)#54 | 1,985,710(0.00%)#4,891 |
| 55. | Eagleton Village | 14 | 11,640(0.12%)#55 | 1,985,710(0.00%)#4,957 |
| 56. | Pigeon Forge | 13 | 11,640(0.11%)#56 | 1,985,710(0.00%)#5,090 |
| 57. | Maynardville | 13 | 11,640(0.11%)#57 | 1,985,710(0.00%)#5,125 |
| 58. | Crossville | 11 | 11,640(0.09%)#58 | 1,985,710(0.00%)#5,323 |
| 59. | Mckenzie | 11 | 11,640(0.09%)#59 | 1,985,710(0.00%)#5,353 |
| 60. | Portland | 10 | 11,640(0.09%)#60 | 1,985,710(0.00%)#5,464 |
| 61. | Kingston | 10 | 11,640(0.09%)#61 | 1,985,710(0.00%)#5,499 |
| 62. | Fairfield Glade | 9 | 11,640(0.08%)#62 | 1,985,710(0.00%)#5,627 |
| 63. | Savannah | 9 | 11,640(0.08%)#63 | 1,985,710(0.00%)#5,638 |
| 64. | Mountain City | 9 | 11,640(0.08%)#64 | 1,985,710(0.00%)#5,701 |
| 65. | Tazewell | 9 | 11,640(0.08%)#65 | 1,985,710(0.00%)#5,705 |
| 66. | Tullahoma | 8 | 11,640(0.07%)#66 | 1,985,710(0.00%)#5,774 |
| 67. | Athens | 8 | 11,640(0.07%)#67 | 1,985,710(0.00%)#5,786 |
| 68. | Tiptonville | 8 | 11,640(0.07%)#68 | 1,985,710(0.00%)#5,836 |
| 69. | Three Way | 8 | 11,640(0.07%)#69 | 1,985,710(0.00%)#5,877 |
| 70. | Norris | 8 | 11,640(0.07%)#70 | 1,985,710(0.00%)#5,884 |
| 71. | Alexandria | 8 | 11,640(0.07%)#71 | 1,985,710(0.00%)#5,898 |
| 72. | Lewisburg | 7 | 11,640(0.06%)#72 | 1,985,710(0.00%)#5,944 |
| 73. | Michie | 7 | 11,640(0.06%)#73 | 1,985,710(0.00%)#6,090 |
| 74. | Greenbrier | 6 | 11,640(0.05%)#74 | 1,985,710(0.00%)#6,147 |
| 75. | Parsons | 6 | 11,640(0.05%)#75 | 1,985,710(0.00%)#6,204 |
| 76. | Henderson | 5 | 11,640(0.04%)#76 | 1,985,710(0.00%)#6,357 |
| 77. | Park City | 4 | 11,640(0.03%)#77 | 1,985,710(0.00%)#6,562 |
| 78. | White Pine | 4 | 11,640(0.03%)#78 | 1,985,710(0.00%)#6,581 |
| 79. | New Market | 4 | 11,640(0.03%)#79 | 1,985,710(0.00%)#6,610 |
| 80. | Alamo | 3 | 11,640(0.03%)#80 | 1,985,710(0.00%)#6,822 |
| 81. | South Fulton | 3 | 11,640(0.03%)#81 | 1,985,710(0.00%)#6,829 |
| 82. | Cross Plains | 3 | 11,640(0.03%)#82 | 1,985,710(0.00%)#6,860 |
| 83. | Kimball | 3 | 11,640(0.03%)#83 | 1,985,710(0.00%)#6,892 |
| 84. | Brentwood | 2 | 11,640(0.02%)#84 | 1,985,710(0.00%)#7,033 |
| 85. | Friendsville | 2 | 11,640(0.02%)#85 | 1,985,710(0.00%)#7,163 |
| 86. | Ridgeside | 2 | 11,640(0.02%)#86 | 1,985,710(0.00%)#7,174 |
| 87. | Adams | 2 | 11,640(0.02%)#87 | 1,985,710(0.00%)#7,219 |
| 88. | Powell | 1 | 11,640(0.01%)#88 | 1,985,710(0.00%)#7,339 |
| 89. | Baxter | 1 | 11,640(0.01%)#89 | 1,985,710(0.00%)#7,402 |
| 90. | Kenton | 1 | 11,640(0.01%)#90 | 1,985,710(0.00%)#7,407 |
| 91. | Altamont | 1 | 11,640(0.01%)#91 | 1,985,710(0.00%)#7,434 |
| 92. | Gilt Edge | 1 | 11,640(0.01%)#92 | 1,985,710(0.00%)#7,465 |
| 93. | Braden | 1 | 11,640(0.01%)#93 | 1,985,710(0.00%)#7,513 |
| 94. | Garland | 1 | 11,640(0.01%)#94 | 1,985,710(0.00%)#7,518 |
Common Questions
What are the Top 10 Cities with the Most Immigrants from Philippines in Tennessee?
Top 10 Cities with the Most Immigrants from Philippines in Tennessee are:
#1
1,447
#2
1,130
#3
807
#4
675
#5
525
#6
314
#7
260
#8
259
#9
184
#10
184
What city has the Most Immigrants from Philippines in Tennessee?
Nashville has the Most Immigrants from Philippines in Tennessee with 1,447.
What is the Total Immigrants from Philippines in the State of Tennessee?
Total Immigrants from Philippines in Tennessee is 11,640.
What is the Total Immigrants from Philippines in the United States?
Total Immigrants from Philippines in the United States is 1,985,710.