Delano, CA Map & Demographics
Delano Map
Delano Overview
$17,517
PER CAPITA INCOME
$57,625
AVG FAMILY INCOME
$53,639
AVG HOUSEHOLD INCOME
29.1%
WAGE / INCOME GAP [ % ]
70.9¢/ $1
WAGE / INCOME GAP [ $ ]
$8,654
FAMILY INCOME DEFICIT
0.44
INEQUALITY / GINI INDEX
50,498
TOTAL POPULATION
28,855
MALE POPULATION
21,643
FEMALE POPULATION
133.32
MALES / 100 FEMALES
75.01
FEMALES / 100 MALES
33.3
MEDIAN AGE
4.1
AVG FAMILY SIZE
3.8
AVG HOUSEHOLD SIZE
20,545
LABOR FORCE [ PEOPLE ]
51.3%
PERCENT IN LABOR FORCE
9.8%
UNEMPLOYMENT RATE
Delano Zip Codes
Delano Area Codes
Income in Delano
Income Overview in Delano
Per Capita Income in Delano is $17,517, while median incomes of families and households are $57,625 and $53,639 respectively.
| Characteristic | Number | Measure |
| Per Capita Income | 50,498 | $17,517 |
| Median Family Income | 9,772 | $57,625 |
| Mean Family Income | 9,772 | $74,461 |
| Median Household Income | 11,500 | $53,639 |
| Mean Household Income | 11,500 | $71,551 |
| Income Deficit | 9,772 | $8,654 |
| Wage / Income Gap (%) | 50,498 | 29.13% |
| Wage / Income Gap ($) | 50,498 | 70.87¢ per $1 |
| Gini / Inequality Index | 50,498 | 0.44 |
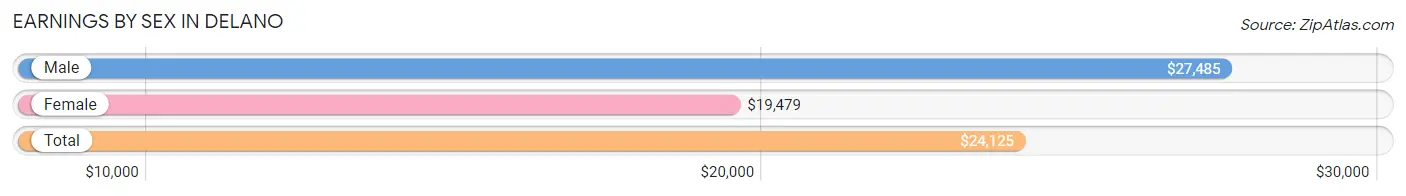
Earnings by Sex in Delano
Average Earnings in Delano are $24,125, $27,485 for men and $19,479 for women, a difference of 29.1%.
| Sex | Number | Average Earnings |
| Male | 11,879 (54.6%) | $27,485 |
| Female | 9,864 (45.4%) | $19,479 |
| Total | 21,743 (100.0%) | $24,125 |
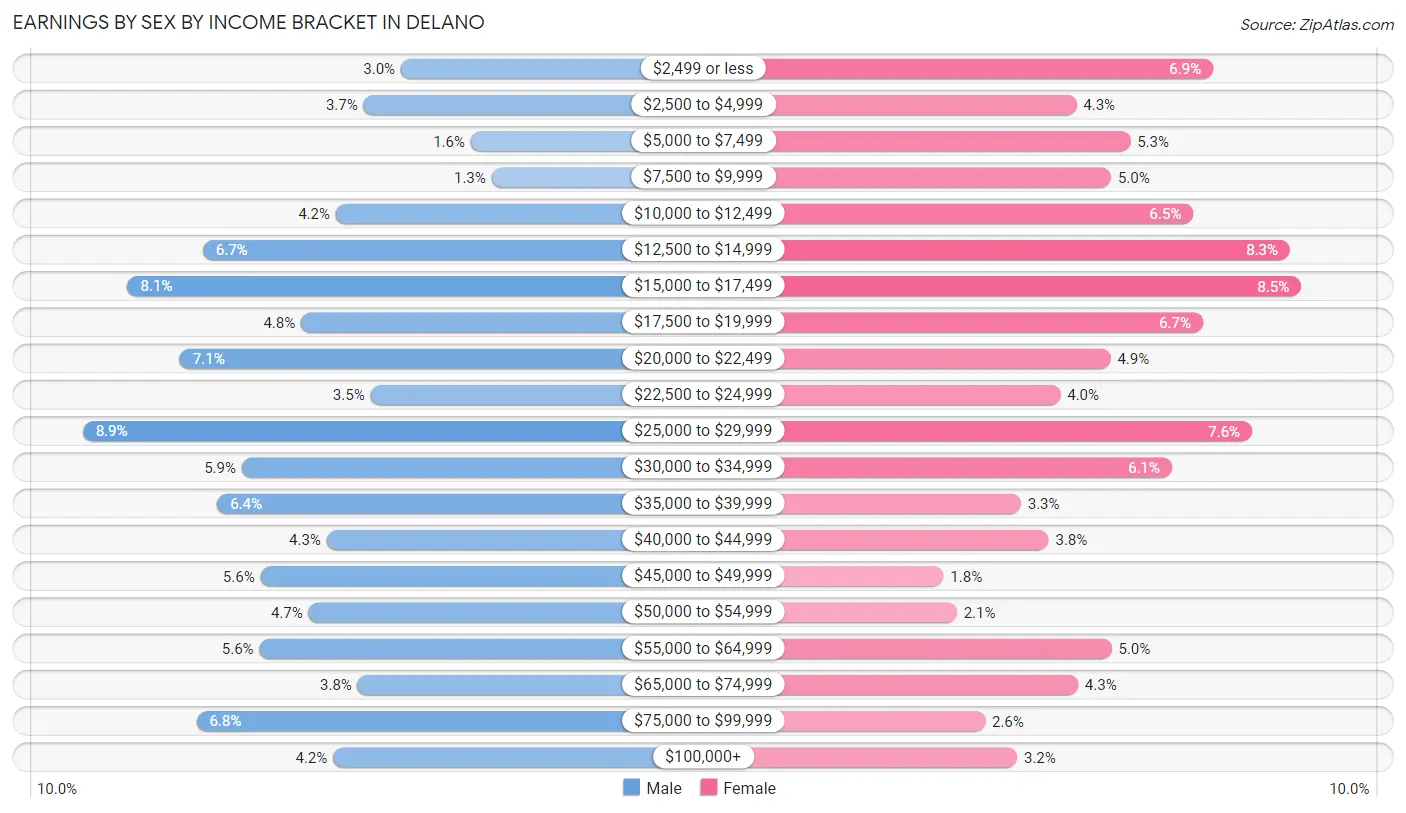
Earnings by Sex by Income Bracket in Delano
The most common earnings brackets in Delano are $25,000 to $29,999 for men (1,058 | 8.9%) and $15,000 to $17,499 for women (839 | 8.5%).
| Income | Male | Female |
| $2,499 or less | 351 (2.9%) | 677 (6.9%) |
| $2,500 to $4,999 | 434 (3.6%) | 424 (4.3%) |
| $5,000 to $7,499 | 195 (1.6%) | 524 (5.3%) |
| $7,500 to $9,999 | 148 (1.3%) | 488 (5.0%) |
| $10,000 to $12,499 | 495 (4.2%) | 640 (6.5%) |
| $12,500 to $14,999 | 791 (6.7%) | 819 (8.3%) |
| $15,000 to $17,499 | 959 (8.1%) | 839 (8.5%) |
| $17,500 to $19,999 | 572 (4.8%) | 658 (6.7%) |
| $20,000 to $22,499 | 842 (7.1%) | 487 (4.9%) |
| $22,500 to $24,999 | 418 (3.5%) | 395 (4.0%) |
| $25,000 to $29,999 | 1,058 (8.9%) | 749 (7.6%) |
| $30,000 to $34,999 | 704 (5.9%) | 601 (6.1%) |
| $35,000 to $39,999 | 759 (6.4%) | 322 (3.3%) |
| $40,000 to $44,999 | 516 (4.3%) | 373 (3.8%) |
| $45,000 to $49,999 | 663 (5.6%) | 179 (1.8%) |
| $50,000 to $54,999 | 556 (4.7%) | 203 (2.1%) |
| $55,000 to $64,999 | 665 (5.6%) | 489 (5.0%) |
| $65,000 to $74,999 | 447 (3.8%) | 427 (4.3%) |
| $75,000 to $99,999 | 805 (6.8%) | 255 (2.6%) |
| $100,000+ | 501 (4.2%) | 315 (3.2%) |
| Total | 11,879 (100.0%) | 9,864 (100.0%) |
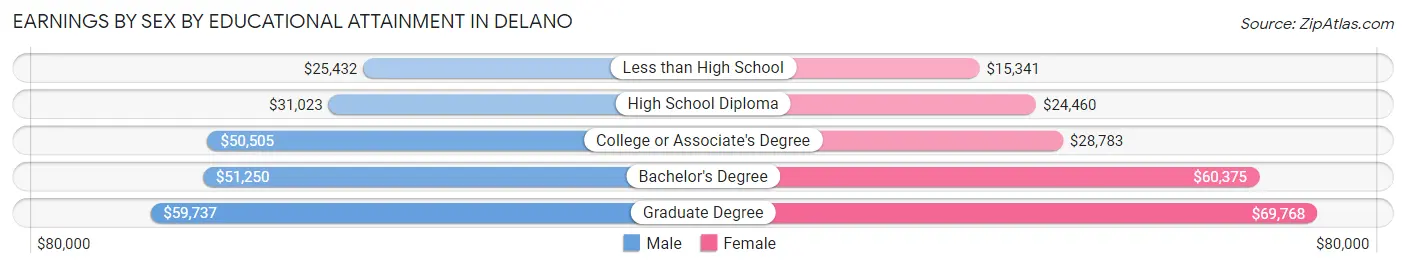
Earnings by Sex by Educational Attainment in Delano
Average earnings in Delano are $32,492 for men and $22,591 for women, a difference of 30.5%. Men with an educational attainment of graduate degree enjoy the highest average annual earnings of $59,737, while those with less than high school education earn the least with $25,432. Women with an educational attainment of graduate degree earn the most with the average annual earnings of $69,768, while those with less than high school education have the smallest earnings of $15,341.
| Educational Attainment | Male Income | Female Income |
| Less than High School | $25,432 | $15,341 |
| High School Diploma | $31,023 | $24,460 |
| College or Associate's Degree | $50,505 | $28,783 |
| Bachelor's Degree | $51,250 | $60,375 |
| Graduate Degree | $59,737 | $69,768 |
| Total | $32,492 | $22,591 |
Family Income in Delano
Family Income Brackets in Delano
According to the Delano family income data, there are 1,700 families falling into the $50,000 to $74,999 income range, which is the most common income bracket and makes up 17.4% of all families. Conversely, the less than $10,000 income bracket is the least frequent group with only 303 families (3.1%) belonging to this category.
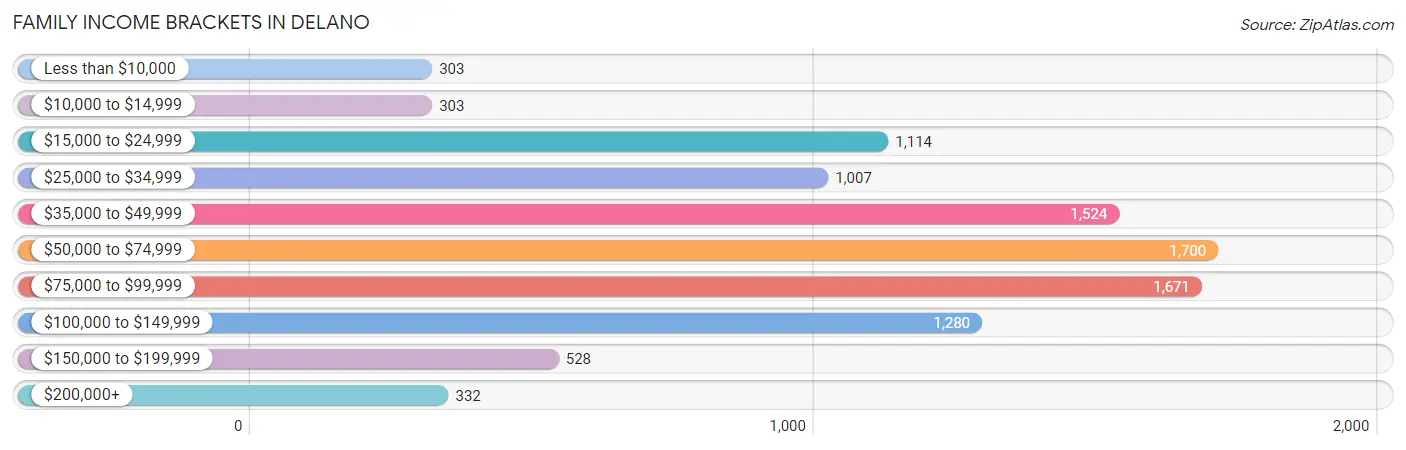
| Income Bracket | # Families | % Families |
| Less than $10,000 | 303 | 3.1% |
| $10,000 to $14,999 | 303 | 3.1% |
| $15,000 to $24,999 | 1,114 | 11.4% |
| $25,000 to $34,999 | 1,007 | 10.3% |
| $35,000 to $49,999 | 1,524 | 15.6% |
| $50,000 to $74,999 | 1,700 | 17.4% |
| $75,000 to $99,999 | 1,671 | 17.1% |
| $100,000 to $149,999 | 1,280 | 13.1% |
| $150,000 to $199,999 | 528 | 5.4% |
| $200,000+ | 332 | 3.4% |
Family Income by Famaliy Size in Delano
7+ person families (564 | 5.8%) account for the highest median family income in Delano with $141,250 per family, while 7+ person families (564 | 5.8%) have the highest median income of $20,179 per family member.
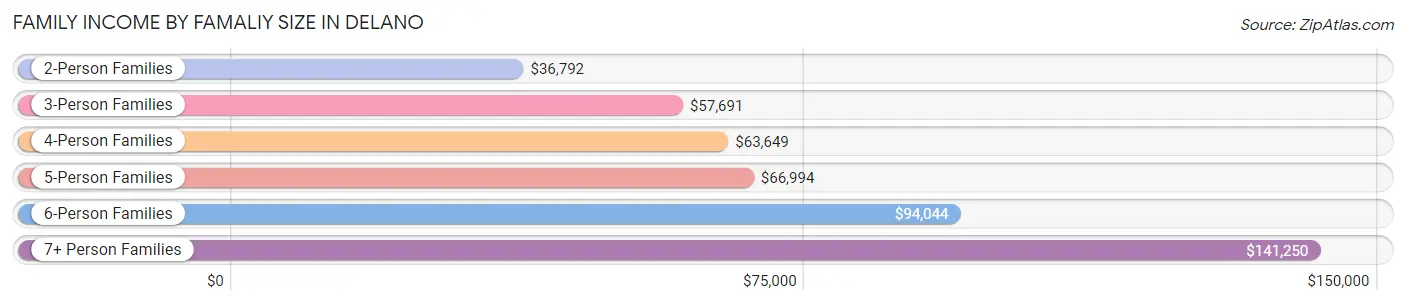
| Income Bracket | # Families | Median Income |
| 2-Person Families | 2,556 (26.2%) | $36,792 |
| 3-Person Families | 1,815 (18.6%) | $57,691 |
| 4-Person Families | 2,560 (26.2%) | $63,649 |
| 5-Person Families | 1,661 (17.0%) | $66,994 |
| 6-Person Families | 616 (6.3%) | $94,044 |
| 7+ Person Families | 564 (5.8%) | $141,250 |
| Total | 9,772 (100.0%) | $57,625 |
Family Income by Number of Earners in Delano
The median family income in Delano is $57,625, with families comprising 3+ earners (2,140) having the highest median family income of $98,786, while families with no earners (1,006) have the lowest median family income of $27,159, accounting for 21.9% and 10.3% of families, respectively.
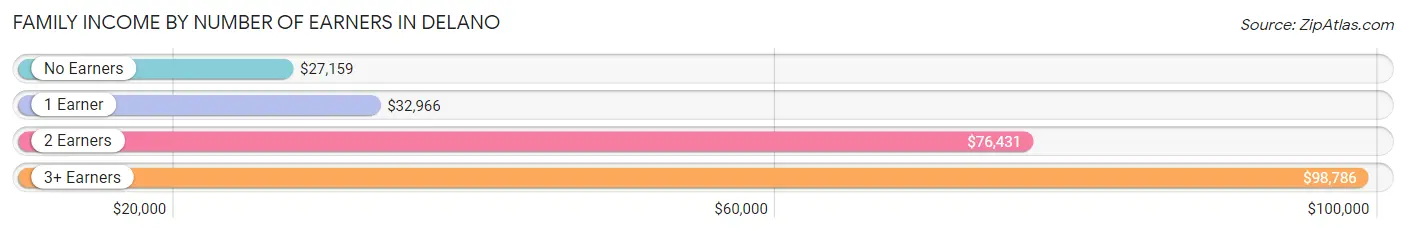
| Number of Earners | # Families | Median Income |
| No Earners | 1,006 (10.3%) | $27,159 |
| 1 Earner | 2,956 (30.2%) | $32,966 |
| 2 Earners | 3,670 (37.6%) | $76,431 |
| 3+ Earners | 2,140 (21.9%) | $98,786 |
| Total | 9,772 (100.0%) | $57,625 |
Household Income in Delano
Household Income Brackets in Delano
With 1,920 households falling in the category, the $75,000 to $99,999 income range is the most frequent in Delano, accounting for 16.7% of all households. In contrast, only 403 households (3.5%) fall into the $200,000+ income bracket, making it the least populous group.
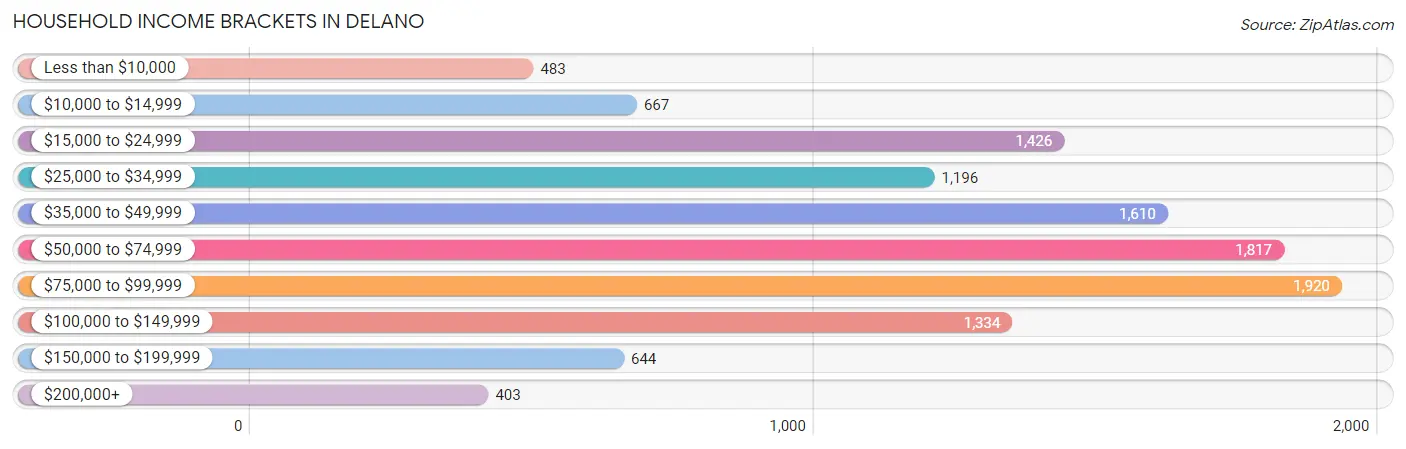
| Income Bracket | # Households | % Households |
| Less than $10,000 | 483 | 4.2% |
| $10,000 to $14,999 | 667 | 5.8% |
| $15,000 to $24,999 | 1,426 | 12.4% |
| $25,000 to $34,999 | 1,196 | 10.4% |
| $35,000 to $49,999 | 1,610 | 14.0% |
| $50,000 to $74,999 | 1,817 | 15.8% |
| $75,000 to $99,999 | 1,920 | 16.7% |
| $100,000 to $149,999 | 1,334 | 11.6% |
| $150,000 to $199,999 | 644 | 5.6% |
| $200,000+ | 403 | 3.5% |
Household Income by Householder Age in Delano
The median household income in Delano is $53,639, with the highest median household income of $68,701 found in the 45 to 64 years age bracket for the primary householder. A total of 4,807 households (41.8%) fall into this category. Meanwhile, the 65+ years age bracket for the primary householder has the lowest median household income of $34,744, with 2,218 households (19.3%) in this group.
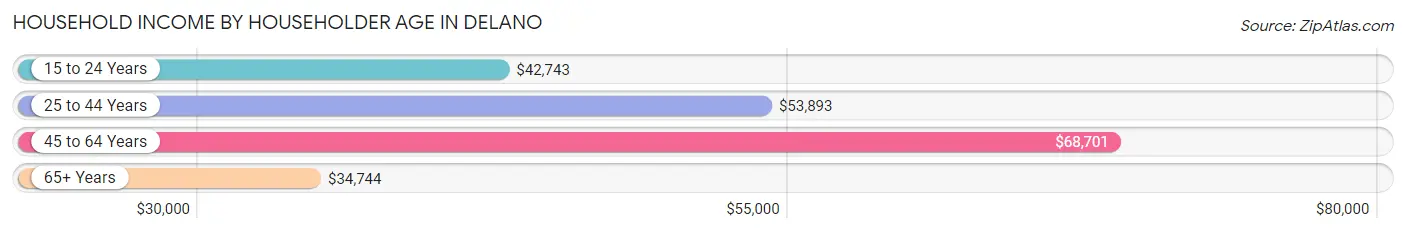
| Income Bracket | # Households | Median Income |
| 15 to 24 Years | 287 (2.5%) | $42,743 |
| 25 to 44 Years | 4,188 (36.4%) | $53,893 |
| 45 to 64 Years | 4,807 (41.8%) | $68,701 |
| 65+ Years | 2,218 (19.3%) | $34,744 |
| Total | 11,500 (100.0%) | $53,639 |
Poverty in Delano
Income Below Poverty by Sex and Age in Delano
With 16.9% poverty level for males and 22.4% for females among the residents of Delano, 5 year old males and 5 year old females are the most vulnerable to poverty, with 196 males (74.2%) and 115 females (52.7%) in their respective age groups living below the poverty level.
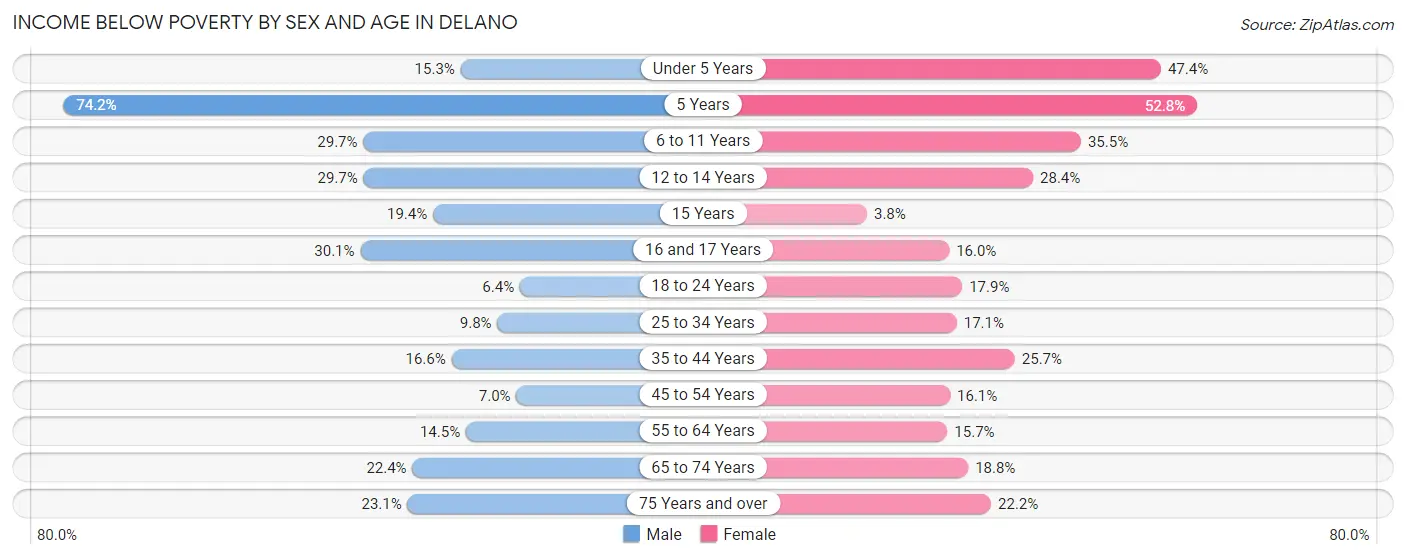
| Age Bracket | Male | Female |
| Under 5 Years | 226 (15.2%) | 703 (47.4%) |
| 5 Years | 196 (74.2%) | 115 (52.7%) |
| 6 to 11 Years | 713 (29.7%) | 579 (35.5%) |
| 12 to 14 Years | 337 (29.7%) | 250 (28.4%) |
| 15 Years | 101 (19.4%) | 12 (3.7%) |
| 16 and 17 Years | 286 (30.1%) | 123 (16.0%) |
| 18 to 24 Years | 188 (6.4%) | 458 (17.9%) |
| 25 to 34 Years | 283 (9.8%) | 497 (17.1%) |
| 35 to 44 Years | 449 (16.6%) | 721 (25.7%) |
| 45 to 54 Years | 189 (7.0%) | 479 (16.1%) |
| 55 to 64 Years | 312 (14.5%) | 388 (15.7%) |
| 65 to 74 Years | 286 (22.4%) | 281 (18.8%) |
| 75 Years and over | 158 (23.1%) | 204 (22.2%) |
| Total | 3,724 (16.9%) | 4,810 (22.4%) |
Income Above Poverty by Sex and Age in Delano
According to the poverty statistics in Delano, males aged 18 to 24 years and females aged 15 years are the age groups that are most secure financially, with 93.6% of males and 96.3% of females in these age groups living above the poverty line.
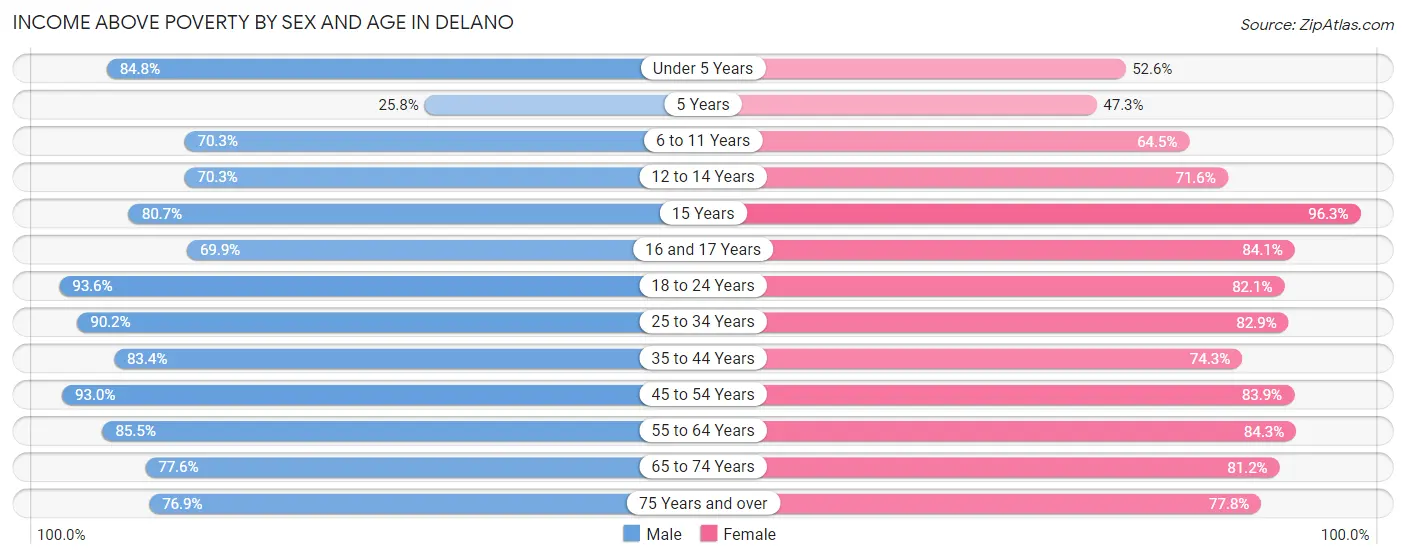
| Age Bracket | Male | Female |
| Under 5 Years | 1,256 (84.8%) | 780 (52.6%) |
| 5 Years | 68 (25.8%) | 103 (47.2%) |
| 6 to 11 Years | 1,688 (70.3%) | 1,051 (64.5%) |
| 12 to 14 Years | 799 (70.3%) | 630 (71.6%) |
| 15 Years | 421 (80.6%) | 308 (96.3%) |
| 16 and 17 Years | 663 (69.9%) | 648 (84.1%) |
| 18 to 24 Years | 2,731 (93.6%) | 2,104 (82.1%) |
| 25 to 34 Years | 2,609 (90.2%) | 2,413 (82.9%) |
| 35 to 44 Years | 2,256 (83.4%) | 2,084 (74.3%) |
| 45 to 54 Years | 2,522 (93.0%) | 2,499 (83.9%) |
| 55 to 64 Years | 1,845 (85.5%) | 2,086 (84.3%) |
| 65 to 74 Years | 990 (77.6%) | 1,216 (81.2%) |
| 75 Years and over | 525 (76.9%) | 716 (77.8%) |
| Total | 18,373 (83.2%) | 16,638 (77.6%) |
Income Below Poverty Among Married-Couple Families in Delano
The poverty statistics for married-couple families in Delano show that 10.8% or 752 of the total 6,941 families live below the poverty line. Families with 5 or more children have the highest poverty rate of 67.9%, comprising of 95 families. On the other hand, families with 1 or 2 children have the lowest poverty rate of 5.1%, which includes 143 families.
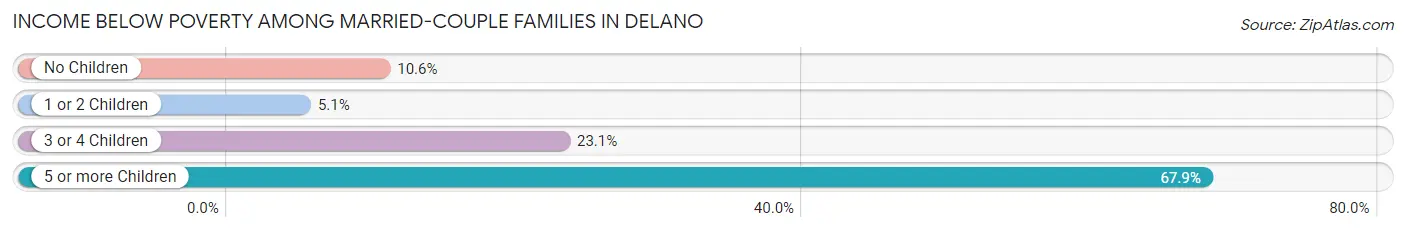
| Children | Above Poverty | Below Poverty |
| No Children | 2,909 (89.4%) | 345 (10.6%) |
| 1 or 2 Children | 2,673 (94.9%) | 143 (5.1%) |
| 3 or 4 Children | 562 (76.9%) | 169 (23.1%) |
| 5 or more Children | 45 (32.1%) | 95 (67.9%) |
| Total | 6,189 (89.2%) | 752 (10.8%) |
Income Below Poverty Among Single-Parent Households in Delano
According to the poverty data in Delano, 23.6% or 185 single-father households and 40.2% or 822 single-mother households are living below the poverty line. Among single-father households, those with 3 or 4 children have the highest poverty rate, with 108 households (61.0%) experiencing poverty. Likewise, among single-mother households, those with 3 or 4 children have the highest poverty rate, with 308 households (81.7%) falling below the poverty line.
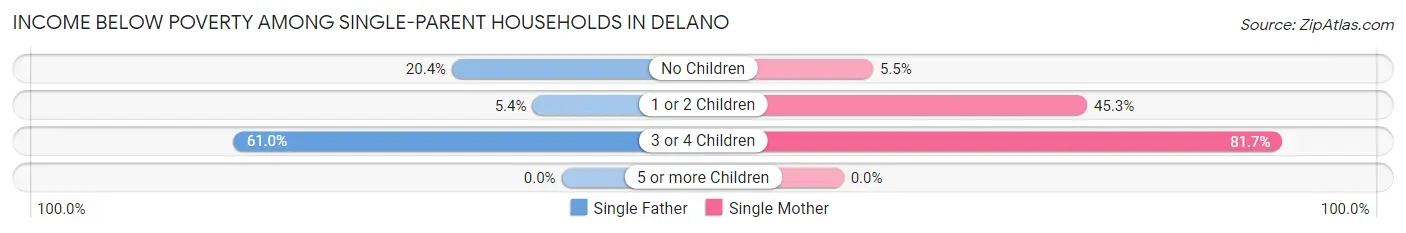
| Children | Single Father | Single Mother |
| No Children | 60 (20.4%) | 33 (5.4%) |
| 1 or 2 Children | 17 (5.4%) | 481 (45.3%) |
| 3 or 4 Children | 108 (61.0%) | 308 (81.7%) |
| 5 or more Children | 0 (0.0%) | 0 (0.0%) |
| Total | 185 (23.6%) | 822 (40.2%) |
Income Below Poverty Among Married-Couple vs Single-Parent Households in Delano
The poverty data for Delano shows that 752 of the married-couple family households (10.8%) and 1,007 of the single-parent households (35.6%) are living below the poverty level. Within the married-couple family households, those with 5 or more children have the highest poverty rate, with 95 households (67.9%) falling below the poverty line. Among the single-parent households, those with 3 or 4 children have the highest poverty rate, with 416 household (75.1%) living below poverty.
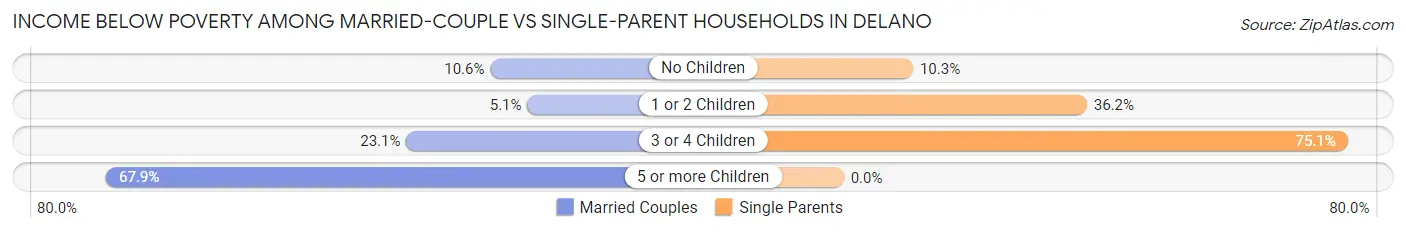
| Children | Married-Couple Families | Single-Parent Households |
| No Children | 345 (10.6%) | 93 (10.3%) |
| 1 or 2 Children | 143 (5.1%) | 498 (36.2%) |
| 3 or 4 Children | 169 (23.1%) | 416 (75.1%) |
| 5 or more Children | 95 (67.9%) | 0 (0.0%) |
| Total | 752 (10.8%) | 1,007 (35.6%) |
Race in Delano
The most populous races in Delano are Hispanic or Latino (38,241 | 75.7%), White / Caucasian (17,145 | 34.0%), and Two or more Races (13,743 | 27.2%).
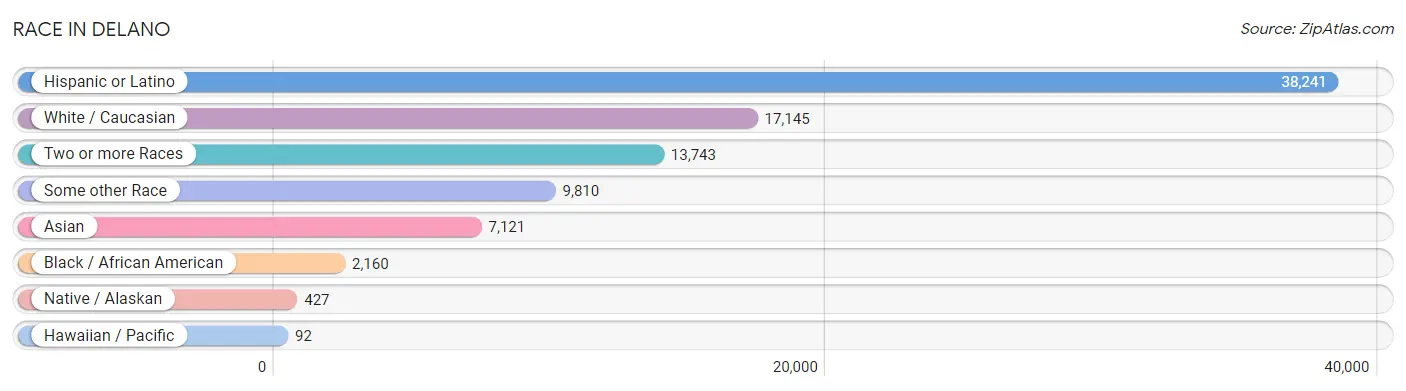
| Race | # Population | % Population |
| Asian | 7,121 | 14.1% |
| Black / African American | 2,160 | 4.3% |
| Hawaiian / Pacific | 92 | 0.2% |
| Hispanic or Latino | 38,241 | 75.7% |
| Native / Alaskan | 427 | 0.9% |
| White / Caucasian | 17,145 | 34.0% |
| Two or more Races | 13,743 | 27.2% |
| Some other Race | 9,810 | 19.4% |
| Total | 50,498 | 100.0% |
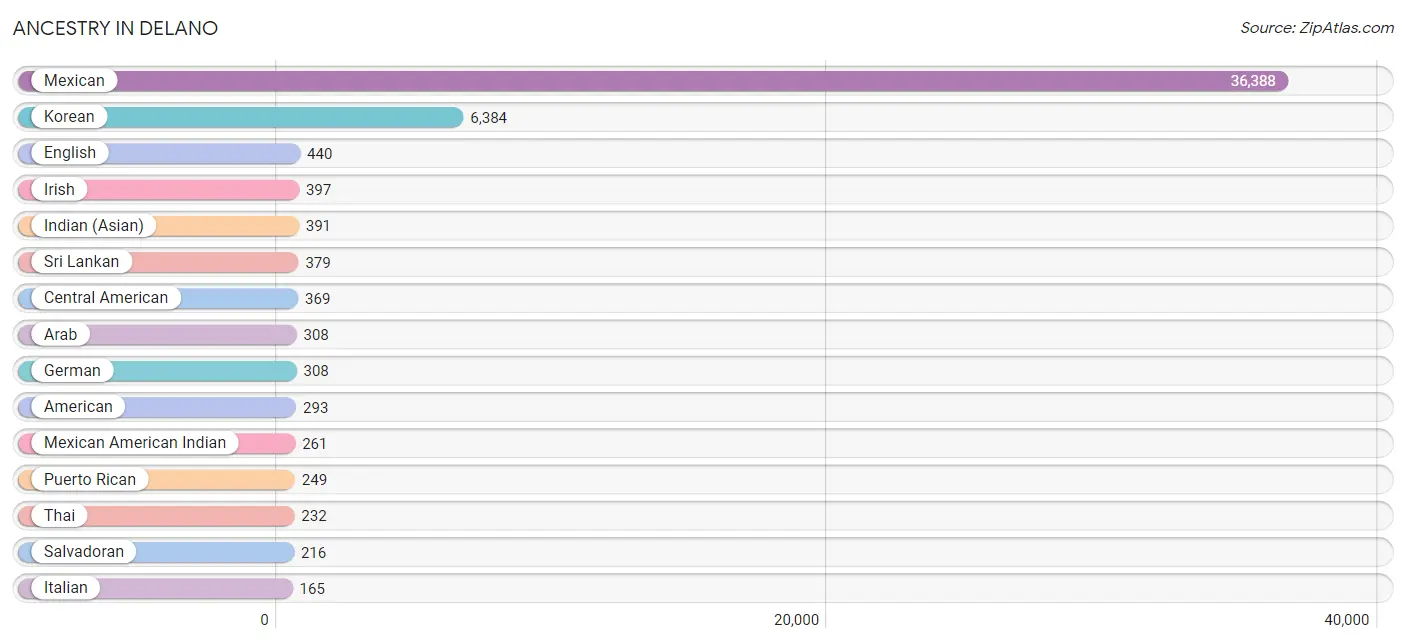
Ancestry in Delano
The most populous ancestries reported in Delano are Mexican (36,388 | 72.1%), Korean (6,384 | 12.6%), English (440 | 0.9%), Irish (397 | 0.8%), and Indian (Asian) (391 | 0.8%), together accounting for 87.1% of all Delano residents.
| Ancestry | # Population | % Population |
| Afghan | 3 | 0.0% |
| African | 9 | 0.0% |
| American | 293 | 0.6% |
| Apache | 5 | 0.0% |
| Arab | 308 | 0.6% |
| Argentinean | 48 | 0.1% |
| Armenian | 24 | 0.1% |
| Australian | 30 | 0.1% |
| Belizean | 16 | 0.0% |
| Blackfeet | 20 | 0.0% |
| British | 8 | 0.0% |
| Bulgarian | 9 | 0.0% |
| Burmese | 30 | 0.1% |
| Central American | 369 | 0.7% |
| Central American Indian | 16 | 0.0% |
| Cherokee | 78 | 0.2% |
| Chilean | 49 | 0.1% |
| Choctaw | 21 | 0.0% |
| Colombian | 14 | 0.0% |
| Creek | 8 | 0.0% |
| Croatian | 28 | 0.1% |
| Crow | 12 | 0.0% |
| Cuban | 13 | 0.0% |
| Czech | 2 | 0.0% |
| Czechoslovakian | 41 | 0.1% |
| Danish | 41 | 0.1% |
| Dominican | 4 | 0.0% |
| Dutch | 27 | 0.1% |
| Ecuadorian | 5 | 0.0% |
| Egyptian | 16 | 0.0% |
| English | 440 | 0.9% |
| Ethiopian | 9 | 0.0% |
| European | 145 | 0.3% |
| Finnish | 3 | 0.0% |
| French | 48 | 0.1% |
| French Canadian | 9 | 0.0% |
| German | 308 | 0.6% |
| Greek | 29 | 0.1% |
| Guamanian / Chamorro | 86 | 0.2% |
| Guatemalan | 110 | 0.2% |
| Guyanese | 7 | 0.0% |
| Haitian | 7 | 0.0% |
| Honduran | 32 | 0.1% |
| Icelander | 7 | 0.0% |
| Indian (Asian) | 391 | 0.8% |
| Irish | 397 | 0.8% |
| Italian | 165 | 0.3% |
| Jamaican | 12 | 0.0% |
| Japanese | 21 | 0.0% |
| Korean | 6,384 | 12.6% |
| Malaysian | 50 | 0.1% |
| Maltese | 8 | 0.0% |
| Mexican | 36,388 | 72.1% |
| Mexican American Indian | 261 | 0.5% |
| Native Hawaiian | 32 | 0.1% |
| Navajo | 27 | 0.1% |
| Nicaraguan | 11 | 0.0% |
| Nigerian | 2 | 0.0% |
| Norwegian | 17 | 0.0% |
| Paiute | 7 | 0.0% |
| Polish | 60 | 0.1% |
| Portuguese | 40 | 0.1% |
| Pueblo | 12 | 0.0% |
| Puerto Rican | 249 | 0.5% |
| Puget Sound Salish | 3 | 0.0% |
| Romanian | 7 | 0.0% |
| Russian | 20 | 0.0% |
| Salvadoran | 216 | 0.4% |
| Samoan | 48 | 0.1% |
| Scandinavian | 5 | 0.0% |
| Scotch-Irish | 47 | 0.1% |
| Scottish | 95 | 0.2% |
| Serbian | 3 | 0.0% |
| Shoshone | 4 | 0.0% |
| South American | 116 | 0.2% |
| Spaniard | 32 | 0.1% |
| Sri Lankan | 379 | 0.7% |
| Subsaharan African | 20 | 0.0% |
| Swedish | 29 | 0.1% |
| Swiss | 19 | 0.0% |
| Thai | 232 | 0.5% |
| Welsh | 12 | 0.0% |
| Yaqui | 28 | 0.1% | View All 83 Rows |
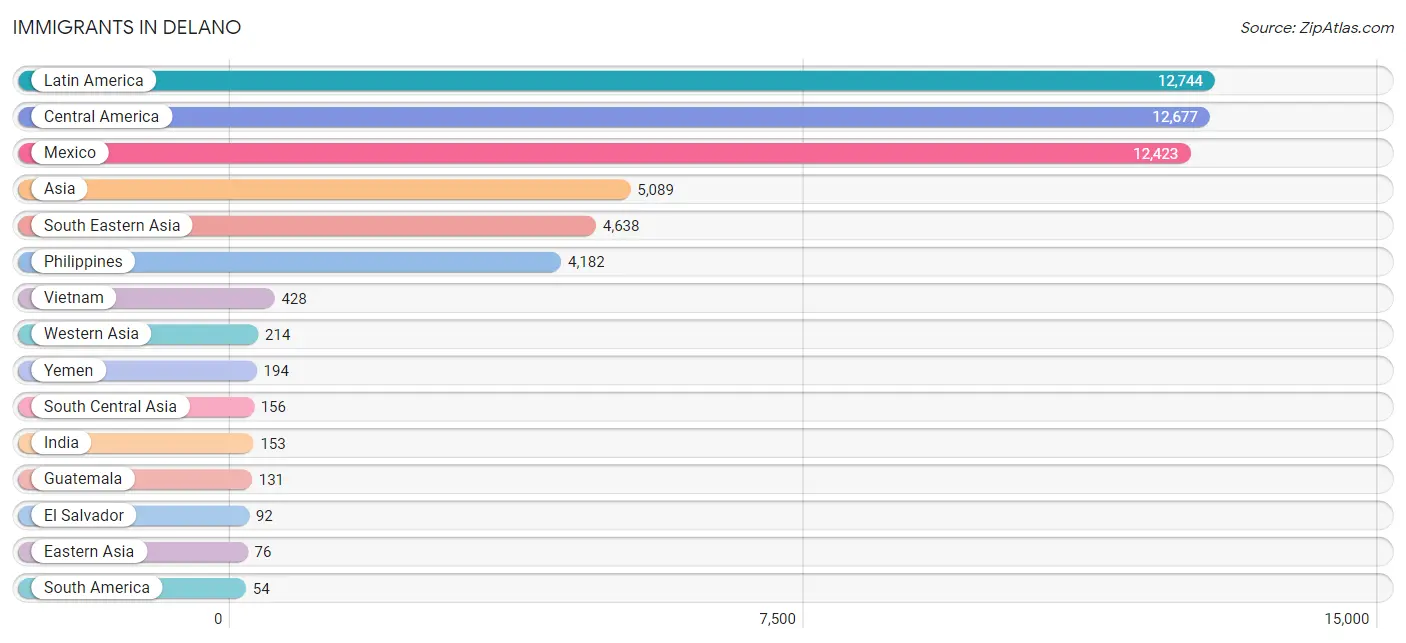
Immigrants in Delano
The most numerous immigrant groups reported in Delano came from Latin America (12,744 | 25.2%), Central America (12,677 | 25.1%), Mexico (12,423 | 24.6%), Asia (5,089 | 10.1%), and South Eastern Asia (4,638 | 9.2%), together accounting for 94.2% of all Delano residents.
| Immigration Origin | # Population | % Population |
| Afghanistan | 3 | 0.0% |
| Africa | 7 | 0.0% |
| Armenia | 16 | 0.0% |
| Asia | 5,089 | 10.1% |
| Belarus | 7 | 0.0% |
| Cambodia | 17 | 0.0% |
| Canada | 20 | 0.0% |
| Caribbean | 13 | 0.0% |
| Central America | 12,677 | 25.1% |
| Chile | 7 | 0.0% |
| China | 35 | 0.1% |
| Colombia | 47 | 0.1% |
| Eastern Africa | 7 | 0.0% |
| Eastern Asia | 76 | 0.2% |
| Eastern Europe | 7 | 0.0% |
| El Salvador | 92 | 0.2% |
| Europe | 7 | 0.0% |
| Guatemala | 131 | 0.3% |
| Honduras | 27 | 0.1% |
| Hong Kong | 7 | 0.0% |
| India | 153 | 0.3% |
| Korea | 41 | 0.1% |
| Laos | 5 | 0.0% |
| Latin America | 12,744 | 25.2% |
| Lebanon | 4 | 0.0% |
| Mexico | 12,423 | 24.6% |
| Philippines | 4,182 | 8.3% |
| South America | 54 | 0.1% |
| South Central Asia | 156 | 0.3% |
| South Eastern Asia | 4,638 | 9.2% |
| Thailand | 6 | 0.0% |
| Vietnam | 428 | 0.9% |
| Western Asia | 214 | 0.4% |
| Yemen | 194 | 0.4% |
| Zimbabwe | 7 | 0.0% | View All 35 Rows |
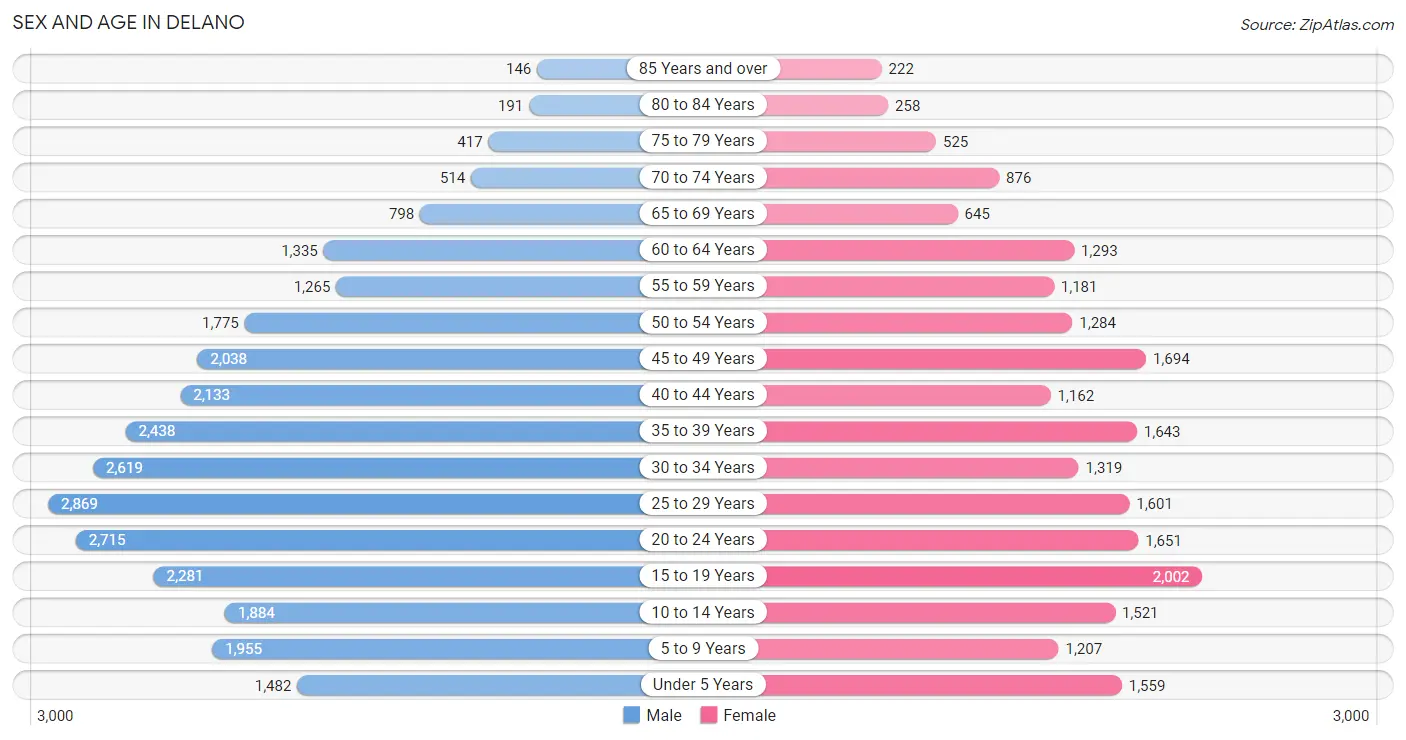
Sex and Age in Delano
Sex and Age in Delano
The most populous age groups in Delano are 25 to 29 Years (2,869 | 9.9%) for men and 15 to 19 Years (2,002 | 9.2%) for women.
| Age Bracket | Male | Female |
| Under 5 Years | 1,482 (5.1%) | 1,559 (7.2%) |
| 5 to 9 Years | 1,955 (6.8%) | 1,207 (5.6%) |
| 10 to 14 Years | 1,884 (6.5%) | 1,521 (7.0%) |
| 15 to 19 Years | 2,281 (7.9%) | 2,002 (9.2%) |
| 20 to 24 Years | 2,715 (9.4%) | 1,651 (7.6%) |
| 25 to 29 Years | 2,869 (9.9%) | 1,601 (7.4%) |
| 30 to 34 Years | 2,619 (9.1%) | 1,319 (6.1%) |
| 35 to 39 Years | 2,438 (8.5%) | 1,643 (7.6%) |
| 40 to 44 Years | 2,133 (7.4%) | 1,162 (5.4%) |
| 45 to 49 Years | 2,038 (7.1%) | 1,694 (7.8%) |
| 50 to 54 Years | 1,775 (6.1%) | 1,284 (5.9%) |
| 55 to 59 Years | 1,265 (4.4%) | 1,181 (5.5%) |
| 60 to 64 Years | 1,335 (4.6%) | 1,293 (6.0%) |
| 65 to 69 Years | 798 (2.8%) | 645 (3.0%) |
| 70 to 74 Years | 514 (1.8%) | 876 (4.1%) |
| 75 to 79 Years | 417 (1.5%) | 525 (2.4%) |
| 80 to 84 Years | 191 (0.7%) | 258 (1.2%) |
| 85 Years and over | 146 (0.5%) | 222 (1.0%) |
| Total | 28,855 (100.0%) | 21,643 (100.0%) |
Families and Households in Delano
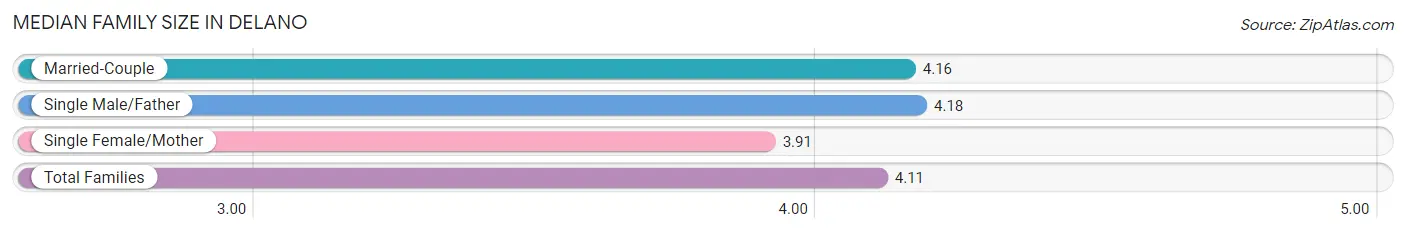
Median Family Size in Delano
The median family size in Delano is 4.11 persons per family, with single male/father families (784 | 8.0%) accounting for the largest median family size of 4.18 persons per family. On the other hand, single female/mother families (2,047 | 20.9%) represent the smallest median family size with 3.91 persons per family.
| Family Type | # Families | Family Size |
| Married-Couple | 6,941 (71.0%) | 4.16 |
| Single Male/Father | 784 (8.0%) | 4.18 |
| Single Female/Mother | 2,047 (20.9%) | 3.91 |
| Total Families | 9,772 (100.0%) | 4.11 |
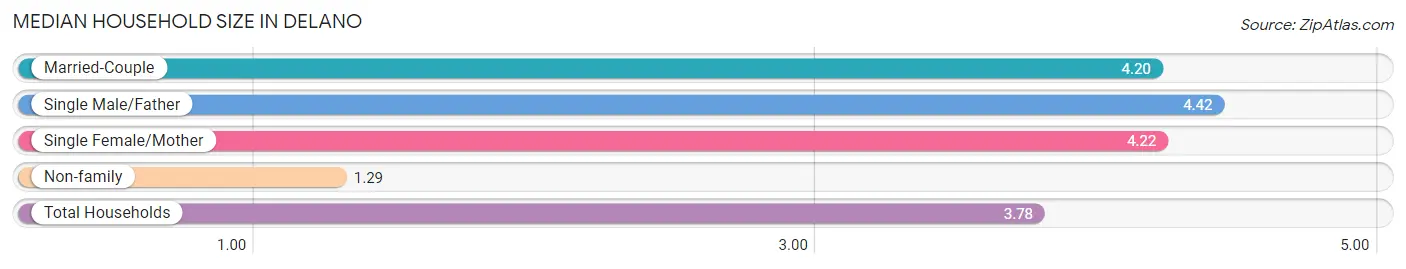
Median Household Size in Delano
The median household size in Delano is 3.78 persons per household, with single male/father households (784 | 6.8%) accounting for the largest median household size of 4.42 persons per household. non-family households (1,728 | 15.0%) represent the smallest median household size with 1.29 persons per household.
| Household Type | # Households | Household Size |
| Married-Couple | 6,941 (60.4%) | 4.20 |
| Single Male/Father | 784 (6.8%) | 4.42 |
| Single Female/Mother | 2,047 (17.8%) | 4.22 |
| Non-family | 1,728 (15.0%) | 1.29 |
| Total Households | 11,500 (100.0%) | 3.78 |
Household Size by Marriage Status in Delano
Out of a total of 11,500 households in Delano, 9,772 (85.0%) are family households, while 1,728 (15.0%) are nonfamily households. The most numerous type of family households are 4-person households, comprising 2,519, and the most common type of nonfamily households are 1-person households, comprising 1,408.
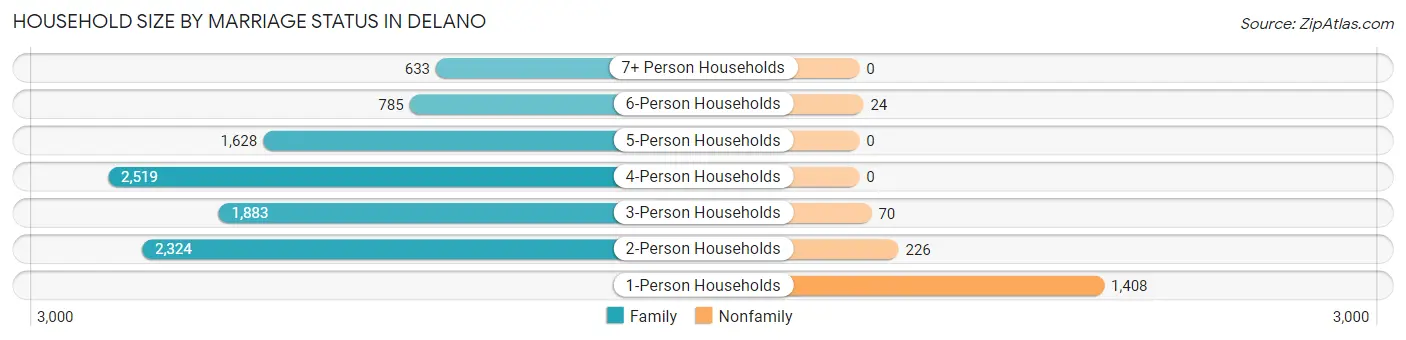
| Household Size | Family Households | Nonfamily Households |
| 1-Person Households | - | 1,408 (12.2%) |
| 2-Person Households | 2,324 (20.2%) | 226 (2.0%) |
| 3-Person Households | 1,883 (16.4%) | 70 (0.6%) |
| 4-Person Households | 2,519 (21.9%) | 0 (0.0%) |
| 5-Person Households | 1,628 (14.2%) | 0 (0.0%) |
| 6-Person Households | 785 (6.8%) | 24 (0.2%) |
| 7+ Person Households | 633 (5.5%) | 0 (0.0%) |
| Total | 9,772 (85.0%) | 1,728 (15.0%) |
Female Fertility in Delano
Fertility by Age in Delano
Average fertility rate in Delano is 39.0 births per 1,000 women. Women in the age bracket of 20 to 34 years have the highest fertility rate with 62.0 births per 1,000 women. Women in the age bracket of 20 to 34 years acount for 63.2% of all women with births.
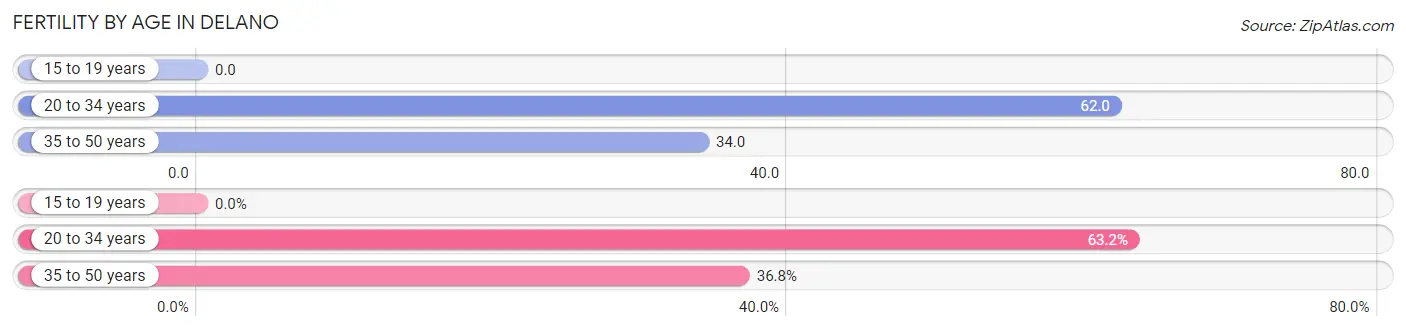
| Age Bracket | Women with Births | Births / 1,000 Women |
| 15 to 19 years | 0 (0.0%) | 0.0 |
| 20 to 34 years | 282 (63.2%) | 62.0 |
| 35 to 50 years | 164 (36.8%) | 34.0 |
| Total | 446 (100.0%) | 39.0 |
Fertility by Age by Marriage Status in Delano
16.6% of women with births (446) in Delano are married. The highest percentage of unmarried women with births falls into 35 to 50 years age bracket with 90.2% of them unmarried at the time of birth, while the lowest percentage of unmarried women with births belong to 20 to 34 years age bracket with 79.4% of them unmarried.
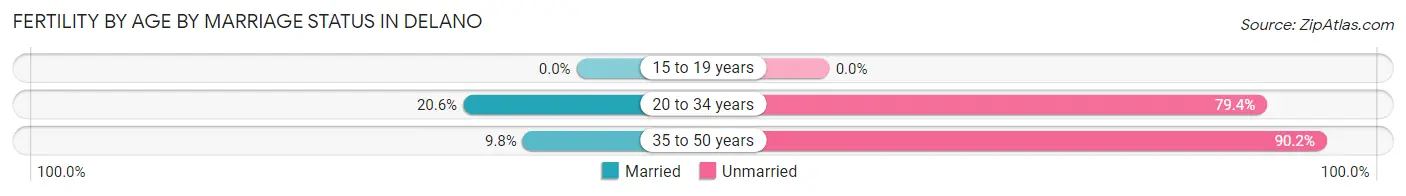
| Age Bracket | Married | Unmarried |
| 15 to 19 years | 0 (0.0%) | 0 (0.0%) |
| 20 to 34 years | 58 (20.6%) | 224 (79.4%) |
| 35 to 50 years | 16 (9.8%) | 148 (90.2%) |
| Total | 74 (16.6%) | 372 (83.4%) |
Fertility by Education in Delano
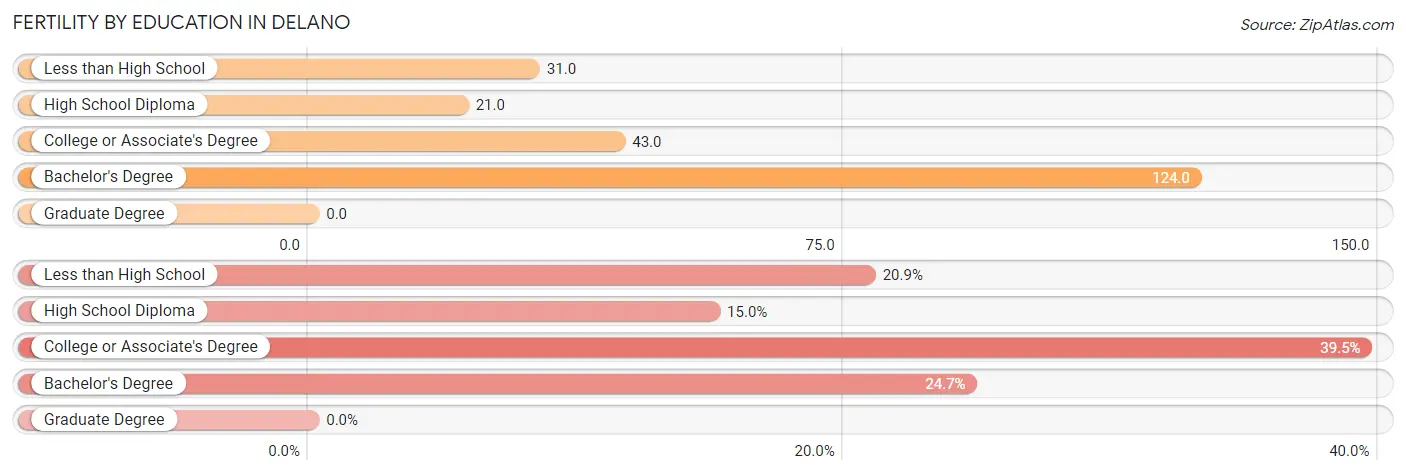
| Educational Attainment | Women with Births | Births / 1,000 Women |
| Less than High School | 93 (20.8%) | 31.0 |
| High School Diploma | 67 (15.0%) | 21.0 |
| College or Associate's Degree | 176 (39.5%) | 43.0 |
| Bachelor's Degree | 110 (24.7%) | 124.0 |
| Graduate Degree | 0 (0.0%) | 0.0 |
| Total | 446 (100.0%) | 39.0 |
Fertility by Education by Marriage Status in Delano
83.4% of women with births in Delano are unmarried. Women with the educational attainment of high school diploma are most likely to be married with 46.3% of them married at childbirth, while women with the educational attainment of college or associate's degree are least likely to be married with 90.9% of them unmarried at childbirth.
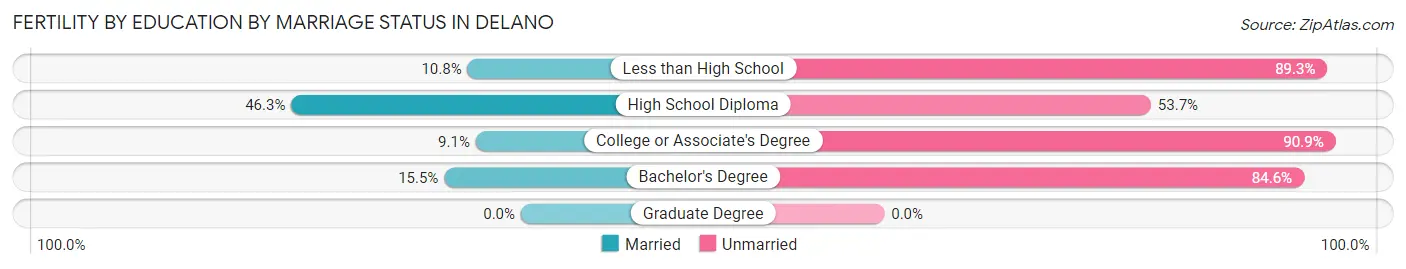
| Educational Attainment | Married | Unmarried |
| Less than High School | 10 (10.7%) | 83 (89.2%) |
| High School Diploma | 31 (46.3%) | 36 (53.7%) |
| College or Associate's Degree | 16 (9.1%) | 160 (90.9%) |
| Bachelor's Degree | 17 (15.4%) | 93 (84.6%) |
| Graduate Degree | 0 (0.0%) | 0 (0.0%) |
| Total | 74 (16.6%) | 372 (83.4%) |
Employment Characteristics in Delano
Employment by Class of Employer in Delano
Among the 18,144 employed individuals in Delano, private company employees (13,922 | 76.7%), local government employees (1,170 | 6.5%), and state government employees (897 | 4.9%) make up the most common classes of employment.
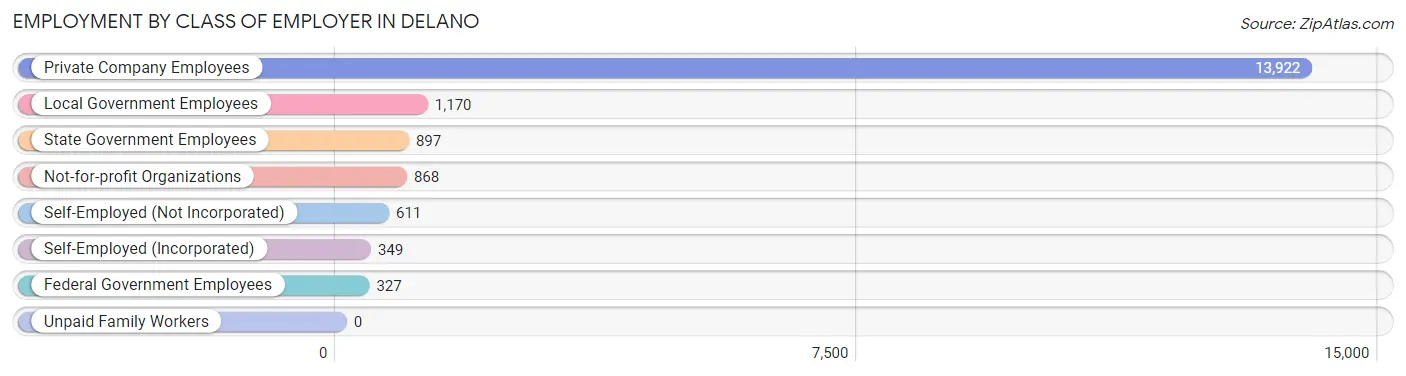
| Employer Class | # Employees | % Employees |
| Private Company Employees | 13,922 | 76.7% |
| Self-Employed (Incorporated) | 349 | 1.9% |
| Self-Employed (Not Incorporated) | 611 | 3.4% |
| Not-for-profit Organizations | 868 | 4.8% |
| Local Government Employees | 1,170 | 6.5% |
| State Government Employees | 897 | 4.9% |
| Federal Government Employees | 327 | 1.8% |
| Unpaid Family Workers | 0 | 0.0% |
| Total | 18,144 | 100.0% |
Employment Status by Age in Delano
According to the labor force statistics for Delano, out of the total population over 16 years of age (40,048), 51.3% or 20,545 individuals are in the labor force, with 9.8% or 2,013 of them unemployed. The age group with the highest labor force participation rate is 45 to 54 years, with 65.2% or 4,428 individuals in the labor force. Within the labor force, the 55 to 59 years age range has the highest percentage of unemployed individuals, with 18.4% or 271 of them being unemployed.
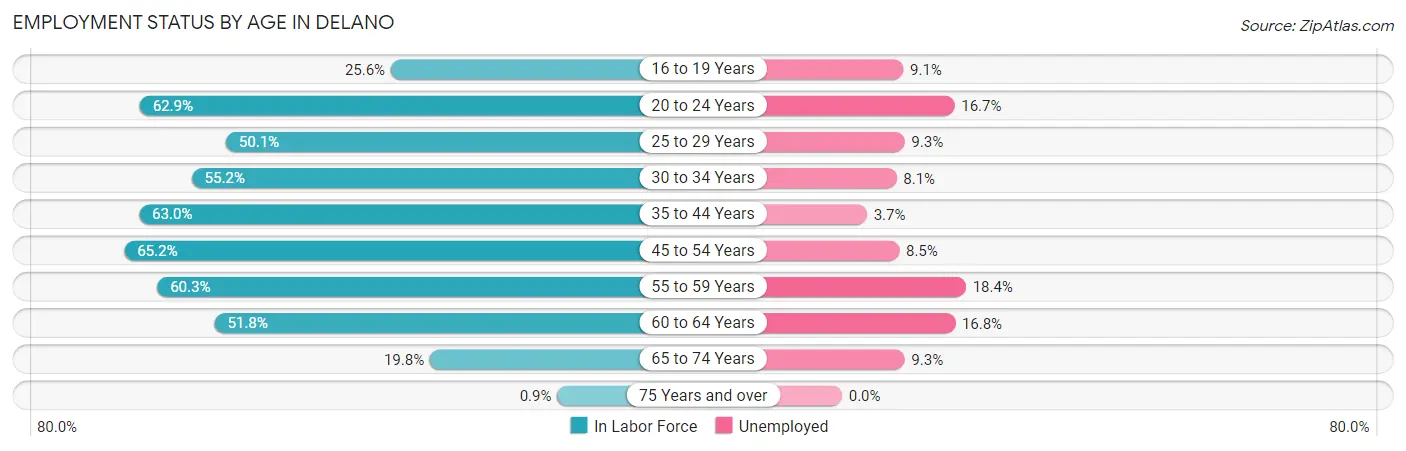
| Age Bracket | In Labor Force | Unemployed |
| 16 to 19 Years | 881 (25.6%) | 80 (9.1%) |
| 20 to 24 Years | 2,746 (62.9%) | 459 (16.7%) |
| 25 to 29 Years | 2,239 (50.1%) | 208 (9.3%) |
| 30 to 34 Years | 2,174 (55.2%) | 176 (8.1%) |
| 35 to 44 Years | 4,647 (63.0%) | 172 (3.7%) |
| 45 to 54 Years | 4,428 (65.2%) | 376 (8.5%) |
| 55 to 59 Years | 1,475 (60.3%) | 271 (18.4%) |
| 60 to 64 Years | 1,361 (51.8%) | 229 (16.8%) |
| 65 to 74 Years | 561 (19.8%) | 52 (9.3%) |
| 75 Years and over | 16 (0.9%) | 0 (0.0%) |
| Total | 20,545 (51.3%) | 2,013 (9.8%) |
Employment Status by Educational Attainment in Delano
According to labor force statistics for Delano, 59.1% of individuals (16,341) out of the total population between 25 and 64 years of age (27,649) are in the labor force, with 8.8% or 1,438 of them being unemployed. The group with the highest labor force participation rate are those with the educational attainment of bachelor's degree or higher, with 86.4% or 1,909 individuals in the labor force. Within the labor force, individuals with less than high school education have the highest percentage of unemployment, with 15.2% or 727 of them being unemployed.
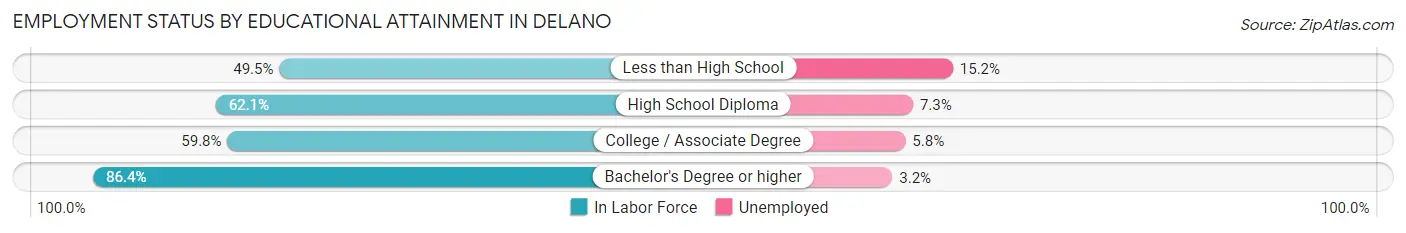
| Educational Attainment | In Labor Force | Unemployed |
| Less than High School | 4,782 (49.5%) | 1,468 (15.2%) |
| High School Diploma | 5,650 (62.1%) | 664 (7.3%) |
| College / Associate Degree | 3,995 (59.8%) | 387 (5.8%) |
| Bachelor's Degree or higher | 1,909 (86.4%) | 71 (3.2%) |
| Total | 16,341 (59.1%) | 2,433 (8.8%) |
Employment Occupations by Sex in Delano
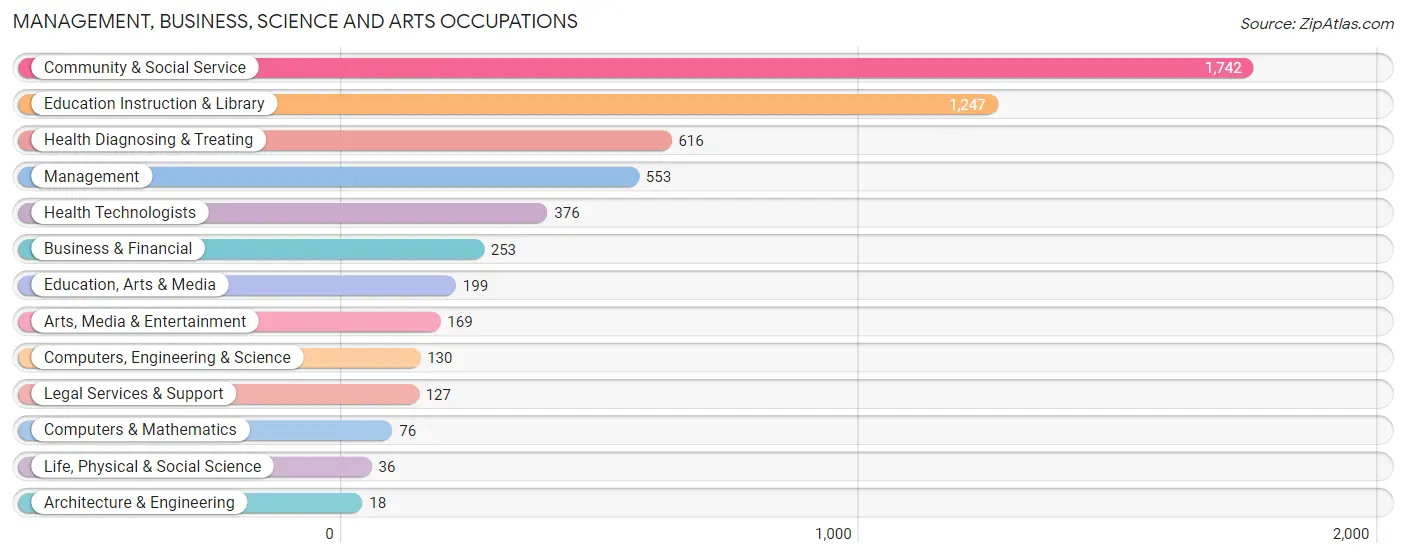
Management, Business, Science and Arts Occupations
The most common Management, Business, Science and Arts occupations in Delano are Community & Social Service (1,742 | 9.4%), Education Instruction & Library (1,247 | 6.7%), Health Diagnosing & Treating (616 | 3.3%), Management (553 | 3.0%), and Health Technologists (376 | 2.0%).
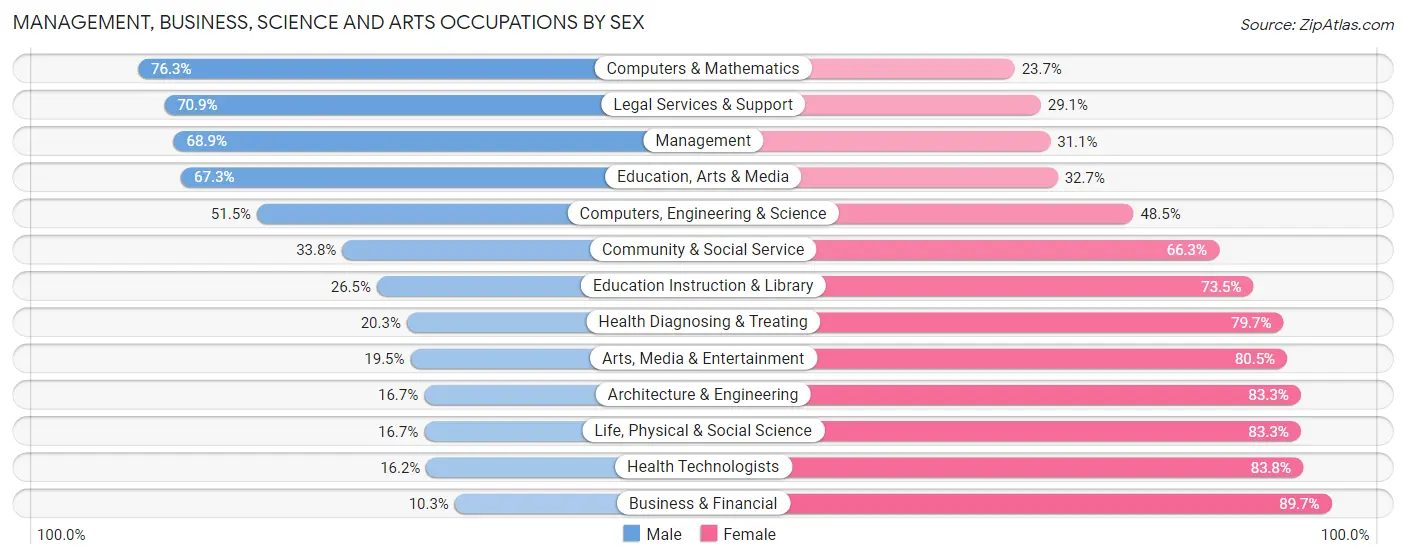
Management, Business, Science and Arts Occupations by Sex
Within the Management, Business, Science and Arts occupations in Delano, the most male-oriented occupations are Computers & Mathematics (76.3%), Legal Services & Support (70.9%), and Management (68.9%), while the most female-oriented occupations are Business & Financial (89.7%), Health Technologists (83.8%), and Architecture & Engineering (83.3%).
| Occupation | Male | Female |
| Management | 381 (68.9%) | 172 (31.1%) |
| Business & Financial | 26 (10.3%) | 227 (89.7%) |
| Computers, Engineering & Science | 67 (51.5%) | 63 (48.5%) |
| Computers & Mathematics | 58 (76.3%) | 18 (23.7%) |
| Architecture & Engineering | 3 (16.7%) | 15 (83.3%) |
| Life, Physical & Social Science | 6 (16.7%) | 30 (83.3%) |
| Community & Social Service | 588 (33.8%) | 1,154 (66.2%) |
| Education, Arts & Media | 134 (67.3%) | 65 (32.7%) |
| Legal Services & Support | 90 (70.9%) | 37 (29.1%) |
| Education Instruction & Library | 331 (26.5%) | 916 (73.5%) |
| Arts, Media & Entertainment | 33 (19.5%) | 136 (80.5%) |
| Health Diagnosing & Treating | 125 (20.3%) | 491 (79.7%) |
| Health Technologists | 61 (16.2%) | 315 (83.8%) |
| Total (Category) | 1,187 (36.0%) | 2,107 (64.0%) |
| Total (Overall) | 10,198 (55.1%) | 8,295 (44.9%) |
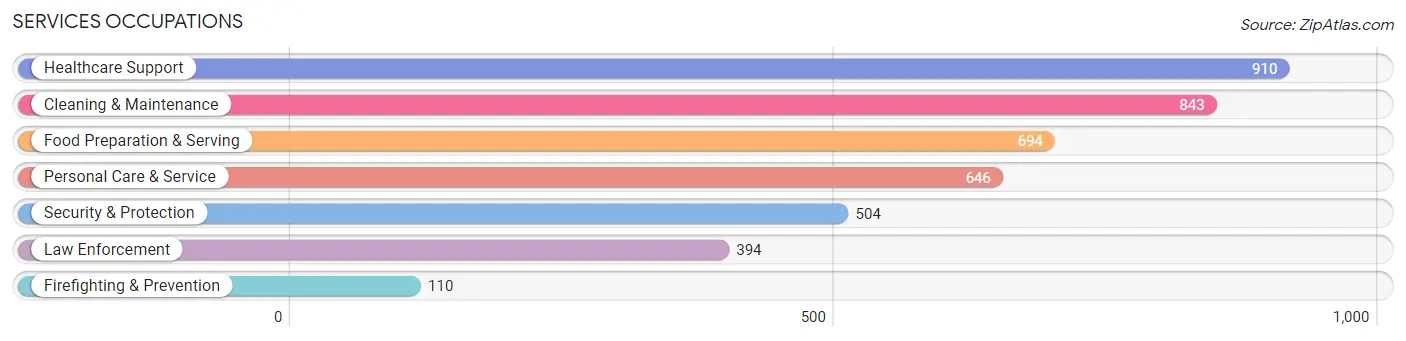
Services Occupations
The most common Services occupations in Delano are Healthcare Support (910 | 4.9%), Cleaning & Maintenance (843 | 4.6%), Food Preparation & Serving (694 | 3.7%), Personal Care & Service (646 | 3.5%), and Security & Protection (504 | 2.7%).
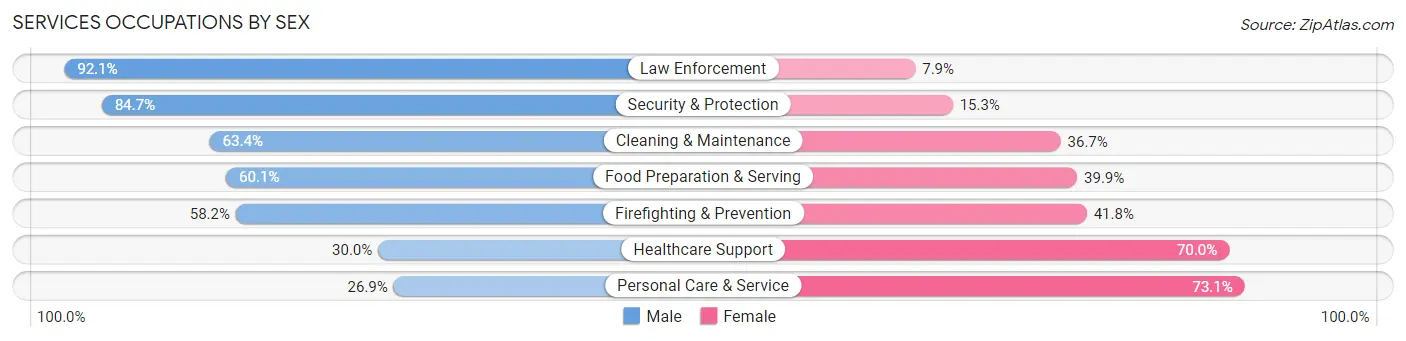
Services Occupations by Sex
Within the Services occupations in Delano, the most male-oriented occupations are Law Enforcement (92.1%), Security & Protection (84.7%), and Cleaning & Maintenance (63.3%), while the most female-oriented occupations are Personal Care & Service (73.1%), Healthcare Support (70.0%), and Firefighting & Prevention (41.8%).
| Occupation | Male | Female |
| Healthcare Support | 273 (30.0%) | 637 (70.0%) |
| Security & Protection | 427 (84.7%) | 77 (15.3%) |
| Firefighting & Prevention | 64 (58.2%) | 46 (41.8%) |
| Law Enforcement | 363 (92.1%) | 31 (7.9%) |
| Food Preparation & Serving | 417 (60.1%) | 277 (39.9%) |
| Cleaning & Maintenance | 534 (63.3%) | 309 (36.6%) |
| Personal Care & Service | 174 (26.9%) | 472 (73.1%) |
| Total (Category) | 1,825 (50.7%) | 1,772 (49.3%) |
| Total (Overall) | 10,198 (55.1%) | 8,295 (44.9%) |
Sales and Office Occupations
The most common Sales and Office occupations in Delano are Office & Administration (1,708 | 9.2%), and Sales & Related (1,134 | 6.1%).

Sales and Office Occupations by Sex

| Occupation | Male | Female |
| Sales & Related | 400 (35.3%) | 734 (64.7%) |
| Office & Administration | 282 (16.5%) | 1,426 (83.5%) |
| Total (Category) | 682 (24.0%) | 2,160 (76.0%) |
| Total (Overall) | 10,198 (55.1%) | 8,295 (44.9%) |
Natural Resources, Construction and Maintenance Occupations
The most common Natural Resources, Construction and Maintenance occupations in Delano are Farming, Fishing & Forestry (4,805 | 26.0%), Installation, Maintenance & Repair (566 | 3.1%), and Construction & Extraction (521 | 2.8%).
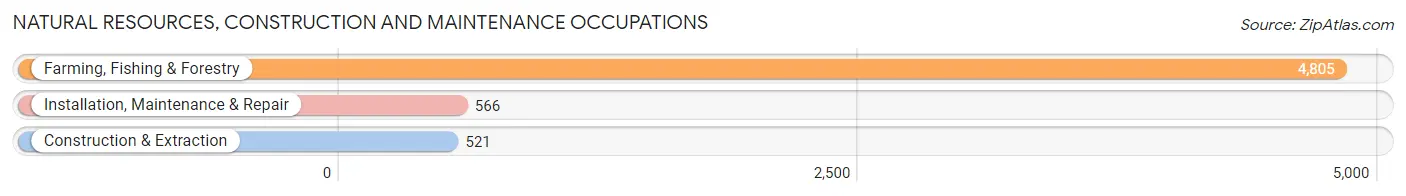
Natural Resources, Construction and Maintenance Occupations by Sex
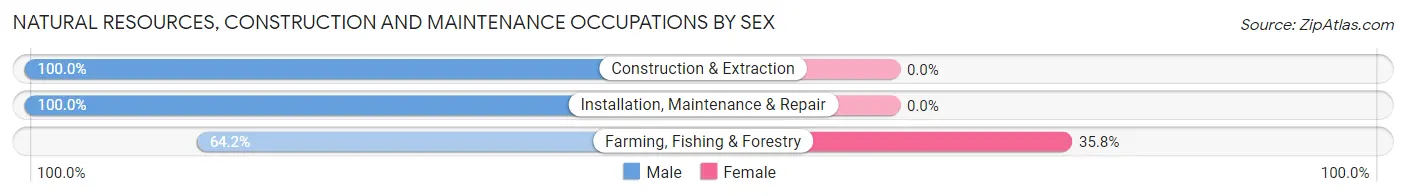
| Occupation | Male | Female |
| Farming, Fishing & Forestry | 3,084 (64.2%) | 1,721 (35.8%) |
| Construction & Extraction | 521 (100.0%) | 0 (0.0%) |
| Installation, Maintenance & Repair | 566 (100.0%) | 0 (0.0%) |
| Total (Category) | 4,171 (70.8%) | 1,721 (29.2%) |
| Total (Overall) | 10,198 (55.1%) | 8,295 (44.9%) |
Production, Transportation and Moving Occupations
The most common Production, Transportation and Moving occupations in Delano are Production (1,037 | 5.6%), Transportation (987 | 5.3%), and Material Moving (844 | 4.6%).
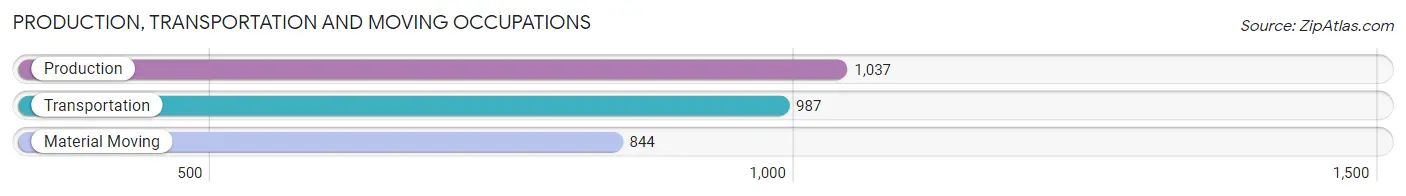
Production, Transportation and Moving Occupations by Sex
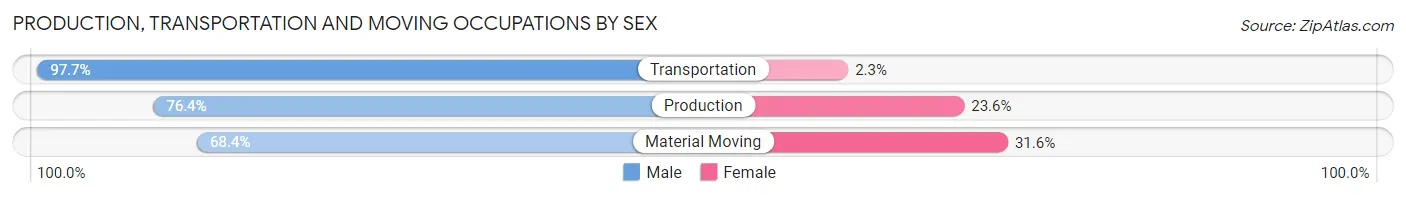
| Occupation | Male | Female |
| Production | 792 (76.4%) | 245 (23.6%) |
| Transportation | 964 (97.7%) | 23 (2.3%) |
| Material Moving | 577 (68.4%) | 267 (31.6%) |
| Total (Category) | 2,333 (81.4%) | 535 (18.6%) |
| Total (Overall) | 10,198 (55.1%) | 8,295 (44.9%) |
Employment Industries by Sex in Delano
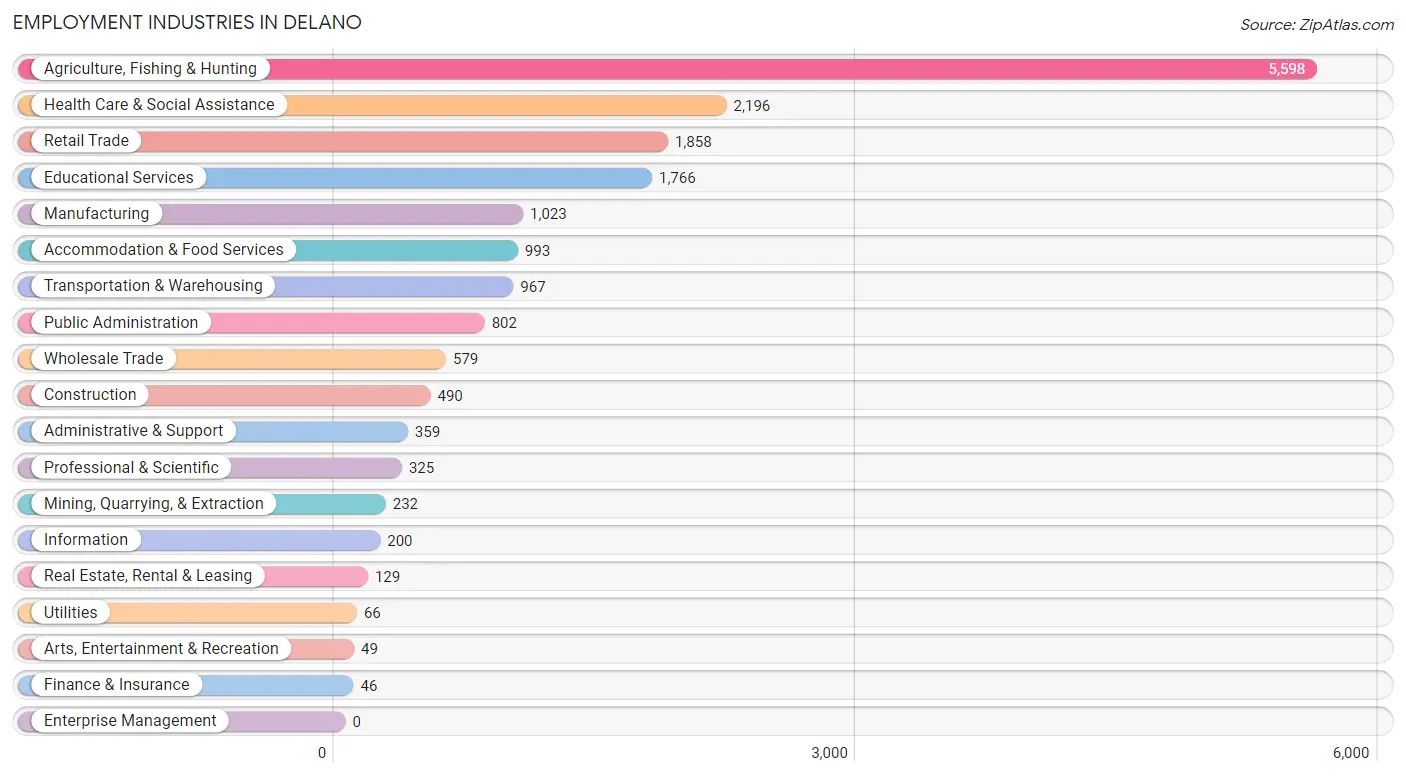
Employment Industries in Delano
The major employment industries in Delano include Agriculture, Fishing & Hunting (5,598 | 30.3%), Health Care & Social Assistance (2,196 | 11.9%), Retail Trade (1,858 | 10.1%), Educational Services (1,766 | 9.6%), and Manufacturing (1,023 | 5.5%).
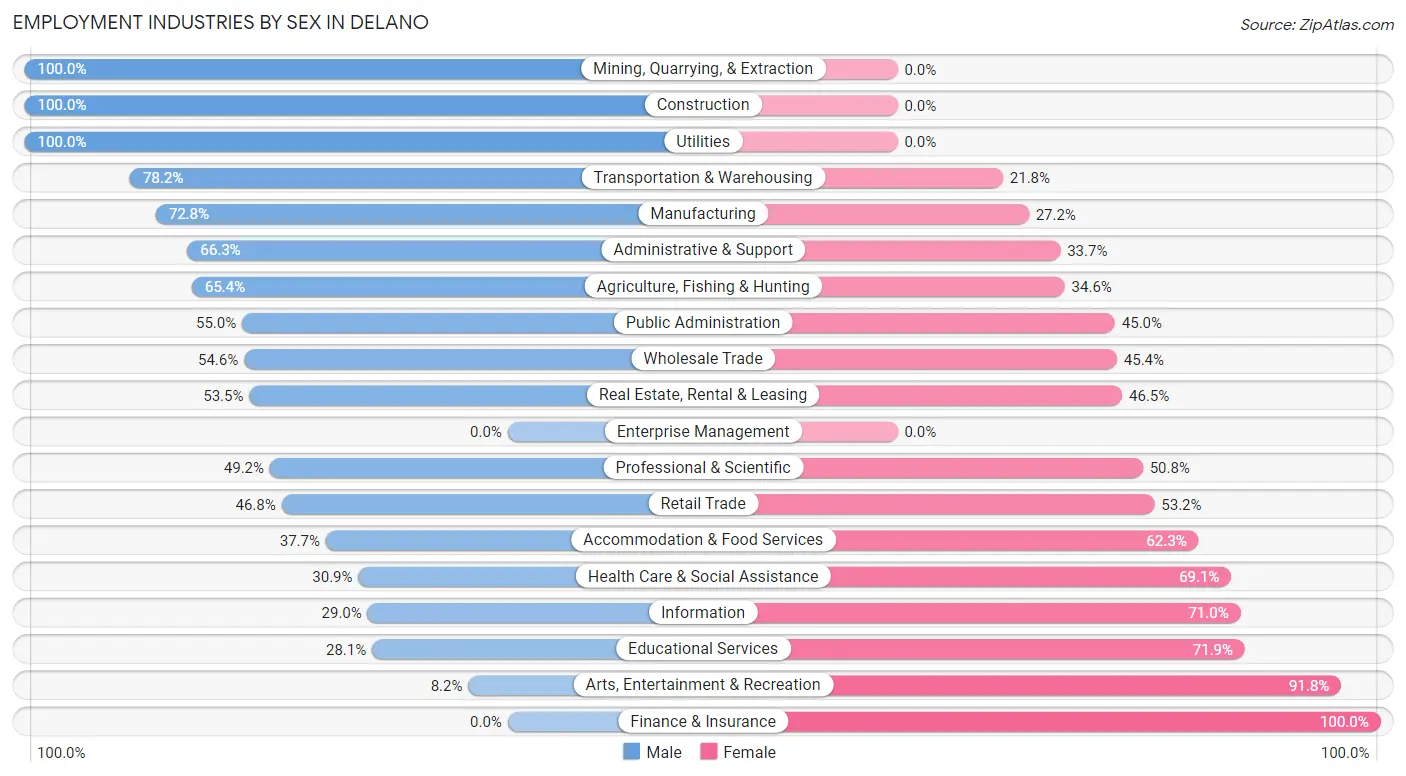
Employment Industries by Sex in Delano
The Delano industries that see more men than women are Mining, Quarrying, & Extraction (100.0%), Construction (100.0%), and Utilities (100.0%), whereas the industries that tend to have a higher number of women are Finance & Insurance (100.0%), Arts, Entertainment & Recreation (91.8%), and Educational Services (71.9%).
| Industry | Male | Female |
| Agriculture, Fishing & Hunting | 3,660 (65.4%) | 1,938 (34.6%) |
| Mining, Quarrying, & Extraction | 232 (100.0%) | 0 (0.0%) |
| Construction | 490 (100.0%) | 0 (0.0%) |
| Manufacturing | 745 (72.8%) | 278 (27.2%) |
| Wholesale Trade | 316 (54.6%) | 263 (45.4%) |
| Retail Trade | 870 (46.8%) | 988 (53.2%) |
| Transportation & Warehousing | 756 (78.2%) | 211 (21.8%) |
| Utilities | 66 (100.0%) | 0 (0.0%) |
| Information | 58 (29.0%) | 142 (71.0%) |
| Finance & Insurance | 0 (0.0%) | 46 (100.0%) |
| Real Estate, Rental & Leasing | 69 (53.5%) | 60 (46.5%) |
| Professional & Scientific | 160 (49.2%) | 165 (50.8%) |
| Enterprise Management | 0 (0.0%) | 0 (0.0%) |
| Administrative & Support | 238 (66.3%) | 121 (33.7%) |
| Educational Services | 496 (28.1%) | 1,270 (71.9%) |
| Health Care & Social Assistance | 679 (30.9%) | 1,517 (69.1%) |
| Arts, Entertainment & Recreation | 4 (8.2%) | 45 (91.8%) |
| Accommodation & Food Services | 374 (37.7%) | 619 (62.3%) |
| Public Administration | 441 (55.0%) | 361 (45.0%) |
| Total | 10,198 (55.1%) | 8,295 (44.9%) |
Education in Delano
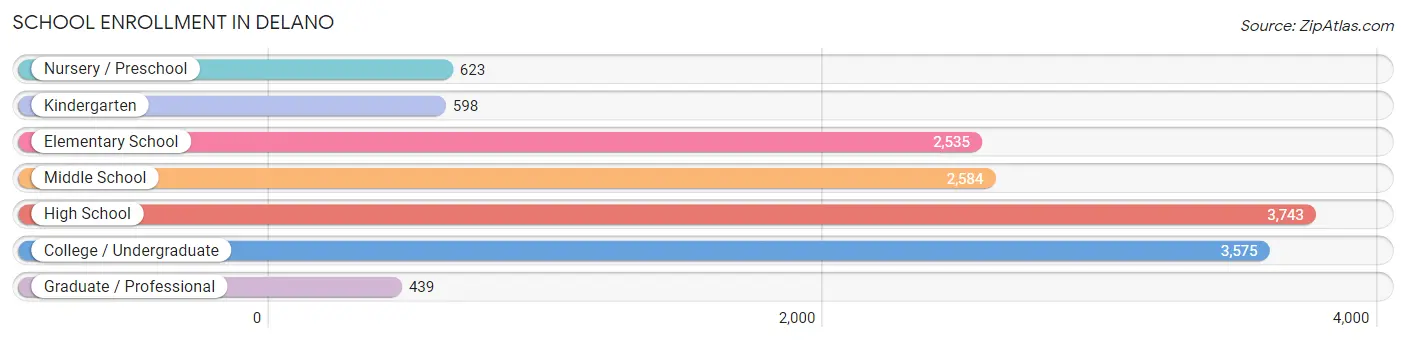
School Enrollment in Delano
The most common levels of schooling among the 14,097 students in Delano are high school (3,743 | 26.6%), college / undergraduate (3,575 | 25.4%), and middle school (2,584 | 18.3%).
| School Level | # Students | % Students |
| Nursery / Preschool | 623 | 4.4% |
| Kindergarten | 598 | 4.2% |
| Elementary School | 2,535 | 18.0% |
| Middle School | 2,584 | 18.3% |
| High School | 3,743 | 26.6% |
| College / Undergraduate | 3,575 | 25.4% |
| Graduate / Professional | 439 | 3.1% |
| Total | 14,097 | 100.0% |
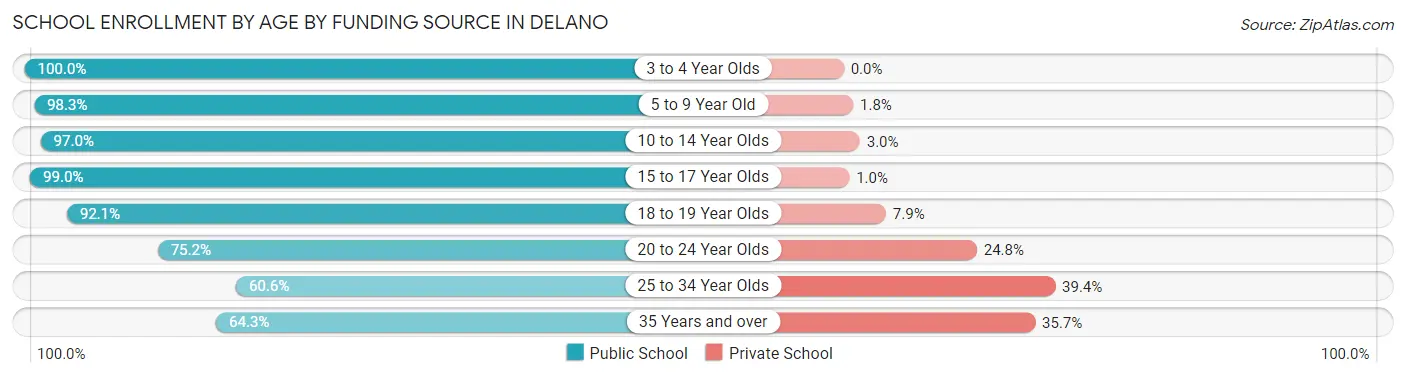
School Enrollment by Age by Funding Source in Delano
Out of a total of 14,097 students who are enrolled in schools in Delano, 1,494 (10.6%) attend a private institution, while the remaining 12,603 (89.4%) are enrolled in public schools. The age group of 25 to 34 year olds has the highest likelihood of being enrolled in private schools, with 547 (39.4% in the age bracket) enrolled. Conversely, the age group of 3 to 4 year olds has the lowest likelihood of being enrolled in a private school, with 457 (100.0% in the age bracket) attending a public institution.
| Age Bracket | Public School | Private School |
| 3 to 4 Year Olds | 457 (100.0%) | 0 (0.0%) |
| 5 to 9 Year Old | 3,033 (98.3%) | 54 (1.8%) |
| 10 to 14 Year Olds | 3,203 (97.0%) | 99 (3.0%) |
| 15 to 17 Year Olds | 2,275 (99.0%) | 24 (1.0%) |
| 18 to 19 Year Olds | 1,054 (92.1%) | 90 (7.9%) |
| 20 to 24 Year Olds | 1,216 (75.2%) | 401 (24.8%) |
| 25 to 34 Year Olds | 842 (60.6%) | 547 (39.4%) |
| 35 Years and over | 516 (64.3%) | 286 (35.7%) |
| Total | 12,603 (89.4%) | 1,494 (10.6%) |
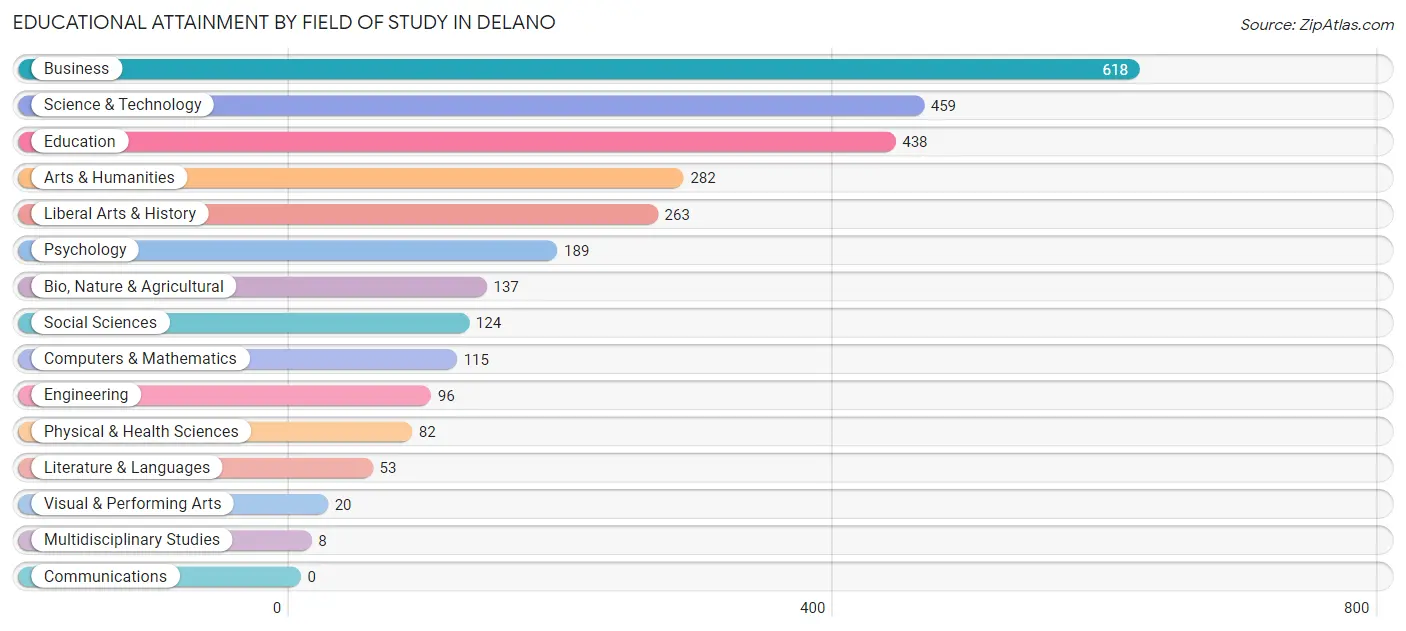
Educational Attainment by Field of Study in Delano
Business (618 | 21.4%), science & technology (459 | 15.9%), education (438 | 15.2%), arts & humanities (282 | 9.8%), and liberal arts & history (263 | 9.1%) are the most common fields of study among 2,884 individuals in Delano who have obtained a bachelor's degree or higher.
| Field of Study | # Graduates | % Graduates |
| Computers & Mathematics | 115 | 4.0% |
| Bio, Nature & Agricultural | 137 | 4.8% |
| Physical & Health Sciences | 82 | 2.8% |
| Psychology | 189 | 6.6% |
| Social Sciences | 124 | 4.3% |
| Engineering | 96 | 3.3% |
| Multidisciplinary Studies | 8 | 0.3% |
| Science & Technology | 459 | 15.9% |
| Business | 618 | 21.4% |
| Education | 438 | 15.2% |
| Literature & Languages | 53 | 1.8% |
| Liberal Arts & History | 263 | 9.1% |
| Visual & Performing Arts | 20 | 0.7% |
| Communications | 0 | 0.0% |
| Arts & Humanities | 282 | 9.8% |
| Total | 2,884 | 100.0% |
Transportation & Commute in Delano
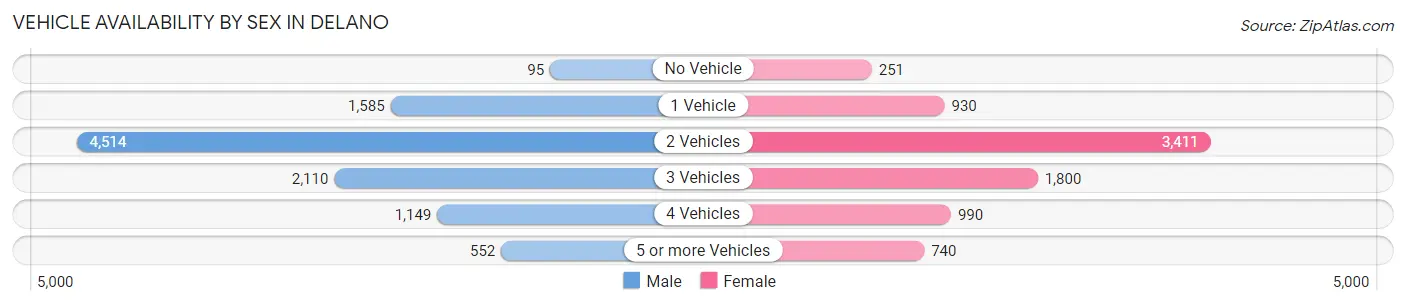
Vehicle Availability by Sex in Delano
The most prevalent vehicle ownership categories in Delano are males with 2 vehicles (4,514, accounting for 45.1%) and females with 2 vehicles (3,411, making up 55.6%).
| Vehicles Available | Male | Female |
| No Vehicle | 95 (0.9%) | 251 (3.1%) |
| 1 Vehicle | 1,585 (15.8%) | 930 (11.5%) |
| 2 Vehicles | 4,514 (45.1%) | 3,411 (42.0%) |
| 3 Vehicles | 2,110 (21.1%) | 1,800 (22.2%) |
| 4 Vehicles | 1,149 (11.5%) | 990 (12.2%) |
| 5 or more Vehicles | 552 (5.5%) | 740 (9.1%) |
| Total | 10,005 (100.0%) | 8,122 (100.0%) |
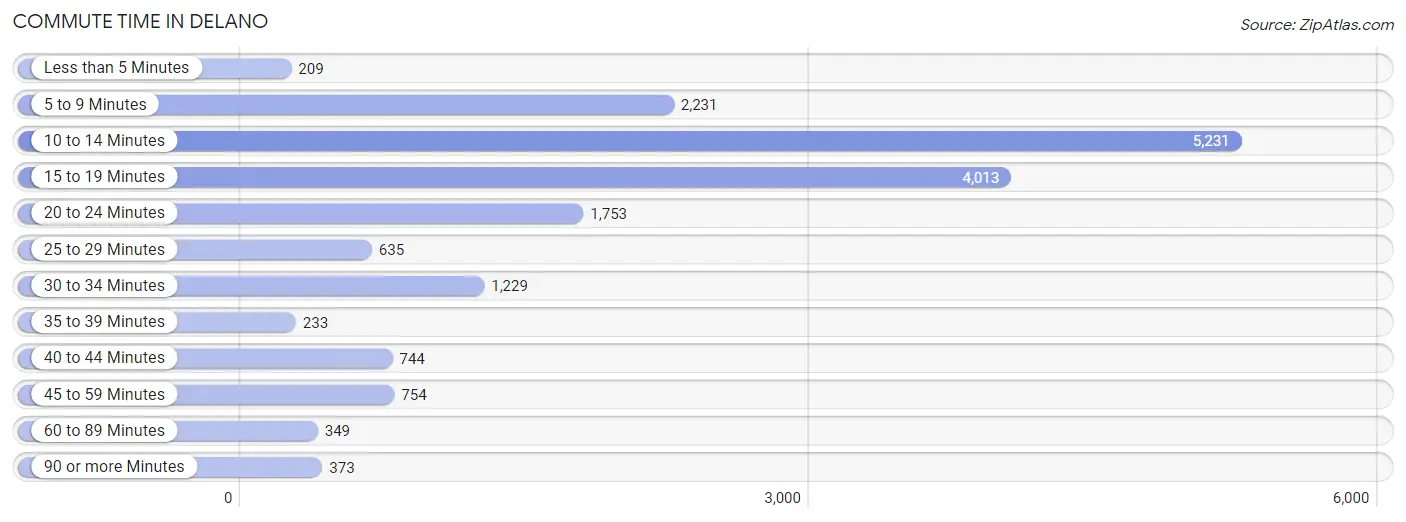
Commute Time in Delano
The most frequently occuring commute durations in Delano are 10 to 14 minutes (5,231 commuters, 29.5%), 15 to 19 minutes (4,013 commuters, 22.6%), and 5 to 9 minutes (2,231 commuters, 12.6%).
| Commute Time | # Commuters | % Commuters |
| Less than 5 Minutes | 209 | 1.2% |
| 5 to 9 Minutes | 2,231 | 12.6% |
| 10 to 14 Minutes | 5,231 | 29.5% |
| 15 to 19 Minutes | 4,013 | 22.6% |
| 20 to 24 Minutes | 1,753 | 9.9% |
| 25 to 29 Minutes | 635 | 3.6% |
| 30 to 34 Minutes | 1,229 | 6.9% |
| 35 to 39 Minutes | 233 | 1.3% |
| 40 to 44 Minutes | 744 | 4.2% |
| 45 to 59 Minutes | 754 | 4.3% |
| 60 to 89 Minutes | 349 | 2.0% |
| 90 or more Minutes | 373 | 2.1% |
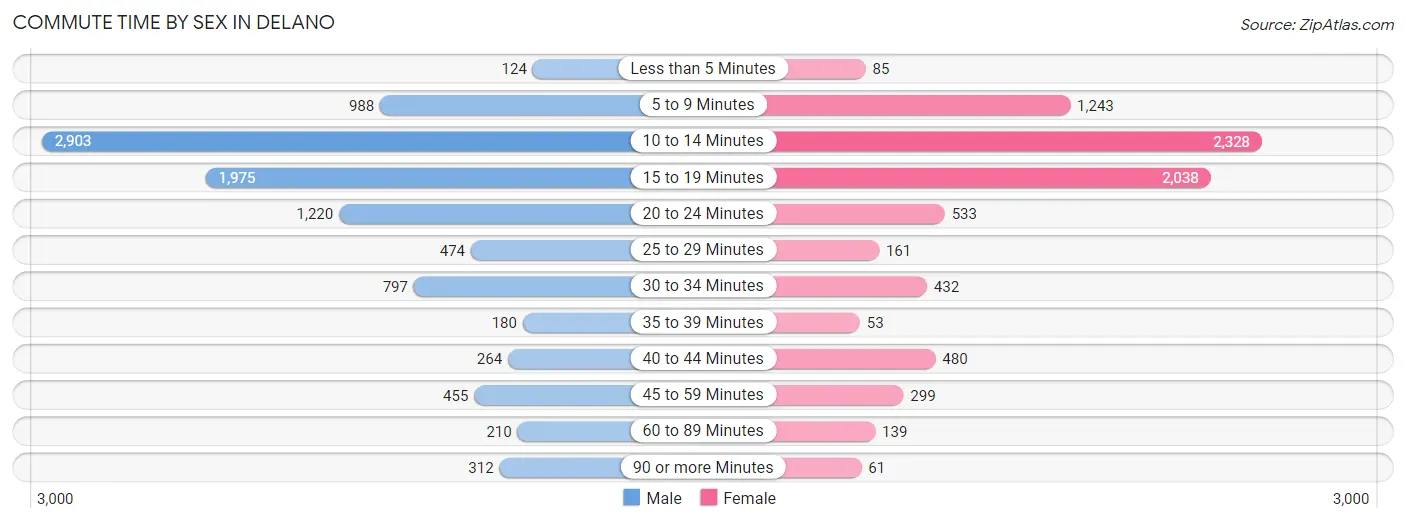
Commute Time by Sex in Delano
The most common commute times in Delano are 10 to 14 minutes (2,903 commuters, 29.3%) for males and 10 to 14 minutes (2,328 commuters, 29.6%) for females.
| Commute Time | Male | Female |
| Less than 5 Minutes | 124 (1.3%) | 85 (1.1%) |
| 5 to 9 Minutes | 988 (10.0%) | 1,243 (15.8%) |
| 10 to 14 Minutes | 2,903 (29.3%) | 2,328 (29.6%) |
| 15 to 19 Minutes | 1,975 (20.0%) | 2,038 (26.0%) |
| 20 to 24 Minutes | 1,220 (12.3%) | 533 (6.8%) |
| 25 to 29 Minutes | 474 (4.8%) | 161 (2.1%) |
| 30 to 34 Minutes | 797 (8.1%) | 432 (5.5%) |
| 35 to 39 Minutes | 180 (1.8%) | 53 (0.7%) |
| 40 to 44 Minutes | 264 (2.7%) | 480 (6.1%) |
| 45 to 59 Minutes | 455 (4.6%) | 299 (3.8%) |
| 60 to 89 Minutes | 210 (2.1%) | 139 (1.8%) |
| 90 or more Minutes | 312 (3.2%) | 61 (0.8%) |
Time of Departure to Work by Sex in Delano
The most frequent times of departure to work in Delano are 6:00 AM to 6:29 AM (3,734, 37.7%) for males and 6:00 AM to 6:29 AM (1,900, 24.2%) for females.
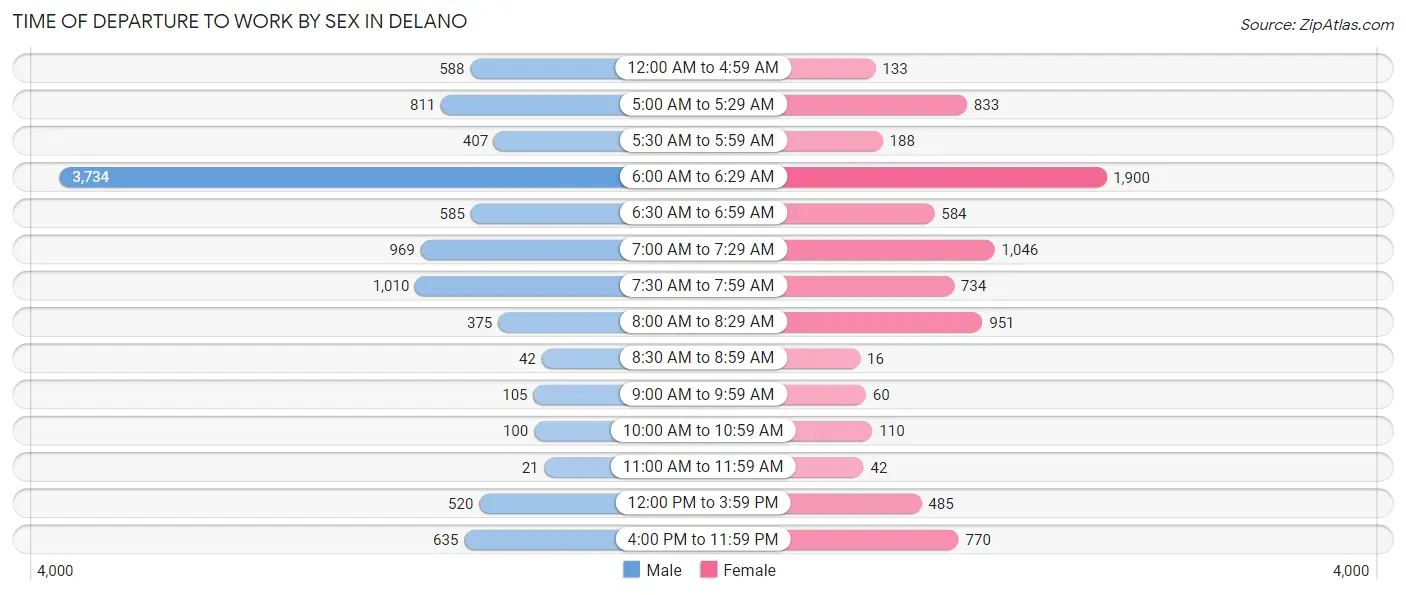
| Time of Departure | Male | Female |
| 12:00 AM to 4:59 AM | 588 (5.9%) | 133 (1.7%) |
| 5:00 AM to 5:29 AM | 811 (8.2%) | 833 (10.6%) |
| 5:30 AM to 5:59 AM | 407 (4.1%) | 188 (2.4%) |
| 6:00 AM to 6:29 AM | 3,734 (37.7%) | 1,900 (24.2%) |
| 6:30 AM to 6:59 AM | 585 (5.9%) | 584 (7.4%) |
| 7:00 AM to 7:29 AM | 969 (9.8%) | 1,046 (13.3%) |
| 7:30 AM to 7:59 AM | 1,010 (10.2%) | 734 (9.3%) |
| 8:00 AM to 8:29 AM | 375 (3.8%) | 951 (12.1%) |
| 8:30 AM to 8:59 AM | 42 (0.4%) | 16 (0.2%) |
| 9:00 AM to 9:59 AM | 105 (1.1%) | 60 (0.8%) |
| 10:00 AM to 10:59 AM | 100 (1.0%) | 110 (1.4%) |
| 11:00 AM to 11:59 AM | 21 (0.2%) | 42 (0.5%) |
| 12:00 PM to 3:59 PM | 520 (5.2%) | 485 (6.2%) |
| 4:00 PM to 11:59 PM | 635 (6.4%) | 770 (9.8%) |
| Total | 9,902 (100.0%) | 7,852 (100.0%) |
Housing Occupancy in Delano
Occupancy by Ownership in Delano
Of the total 11,500 dwellings in Delano, owner-occupied units account for 7,089 (61.6%), while renter-occupied units make up 4,411 (38.4%).
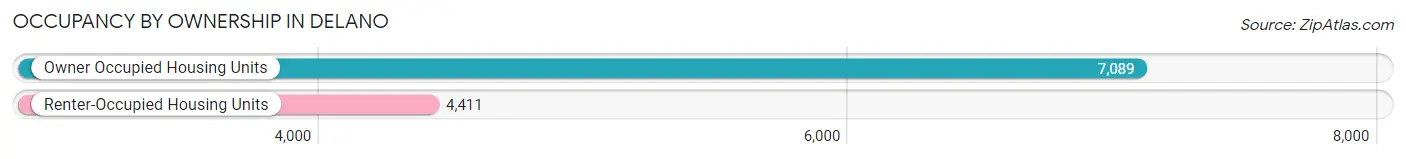
| Occupancy | # Housing Units | % Housing Units |
| Owner Occupied Housing Units | 7,089 | 61.6% |
| Renter-Occupied Housing Units | 4,411 | 38.4% |
| Total Occupied Housing Units | 11,500 | 100.0% |
Occupancy by Household Size in Delano
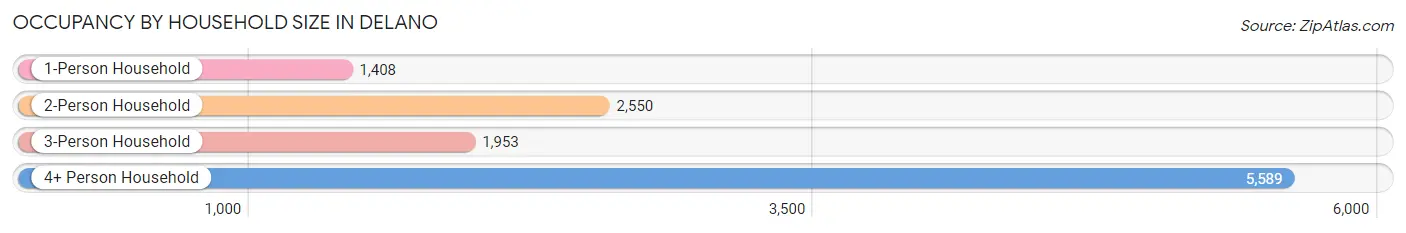
| Household Size | # Housing Units | % Housing Units |
| 1-Person Household | 1,408 | 12.2% |
| 2-Person Household | 2,550 | 22.2% |
| 3-Person Household | 1,953 | 17.0% |
| 4+ Person Household | 5,589 | 48.6% |
| Total Housing Units | 11,500 | 100.0% |
Occupancy by Ownership by Household Size in Delano
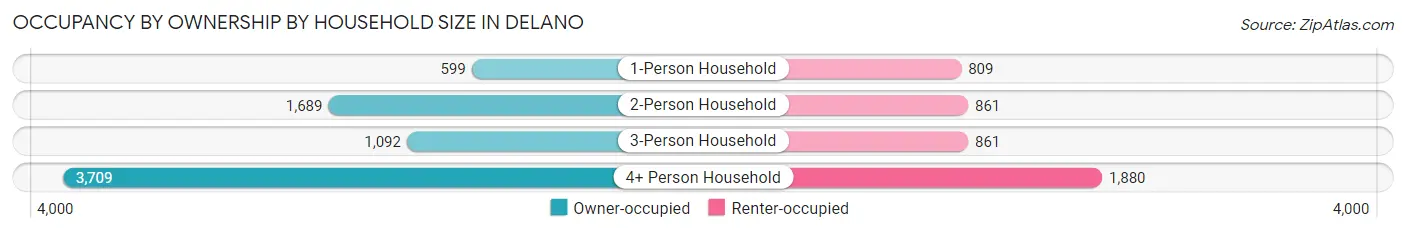
| Household Size | Owner-occupied | Renter-occupied |
| 1-Person Household | 599 (42.5%) | 809 (57.5%) |
| 2-Person Household | 1,689 (66.2%) | 861 (33.8%) |
| 3-Person Household | 1,092 (55.9%) | 861 (44.1%) |
| 4+ Person Household | 3,709 (66.4%) | 1,880 (33.6%) |
| Total Housing Units | 7,089 (61.6%) | 4,411 (38.4%) |
Occupancy by Educational Attainment in Delano
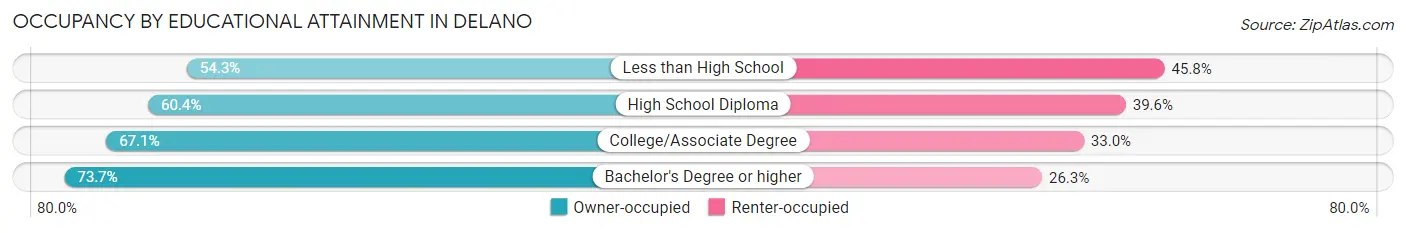
| Household Size | Owner-occupied | Renter-occupied |
| Less than High School | 2,041 (54.2%) | 1,721 (45.8%) |
| High School Diploma | 2,040 (60.4%) | 1,337 (39.6%) |
| College/Associate Degree | 2,078 (67.0%) | 1,021 (33.0%) |
| Bachelor's Degree or higher | 930 (73.7%) | 332 (26.3%) |
Occupancy by Age of Householder in Delano
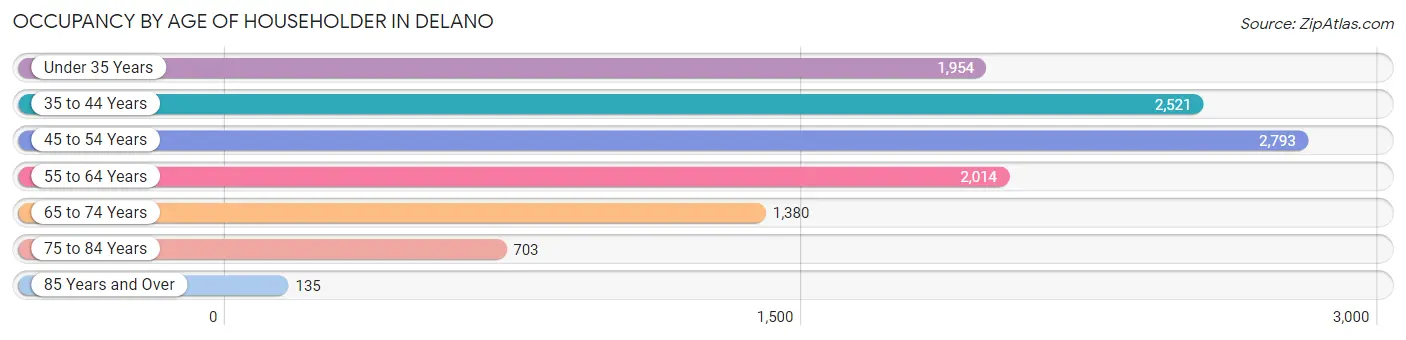
| Age Bracket | # Households | % Households |
| Under 35 Years | 1,954 | 17.0% |
| 35 to 44 Years | 2,521 | 21.9% |
| 45 to 54 Years | 2,793 | 24.3% |
| 55 to 64 Years | 2,014 | 17.5% |
| 65 to 74 Years | 1,380 | 12.0% |
| 75 to 84 Years | 703 | 6.1% |
| 85 Years and Over | 135 | 1.2% |
| Total | 11,500 | 100.0% |
Housing Finances in Delano
Median Income by Occupancy in Delano
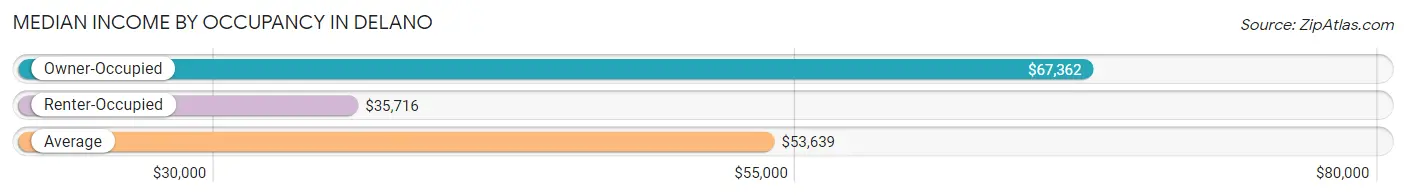
| Occupancy Type | # Households | Median Income |
| Owner-Occupied | 7,089 (61.6%) | $67,362 |
| Renter-Occupied | 4,411 (38.4%) | $35,716 |
| Average | 11,500 (100.0%) | $53,639 |
Occupancy by Householder Income Bracket in Delano
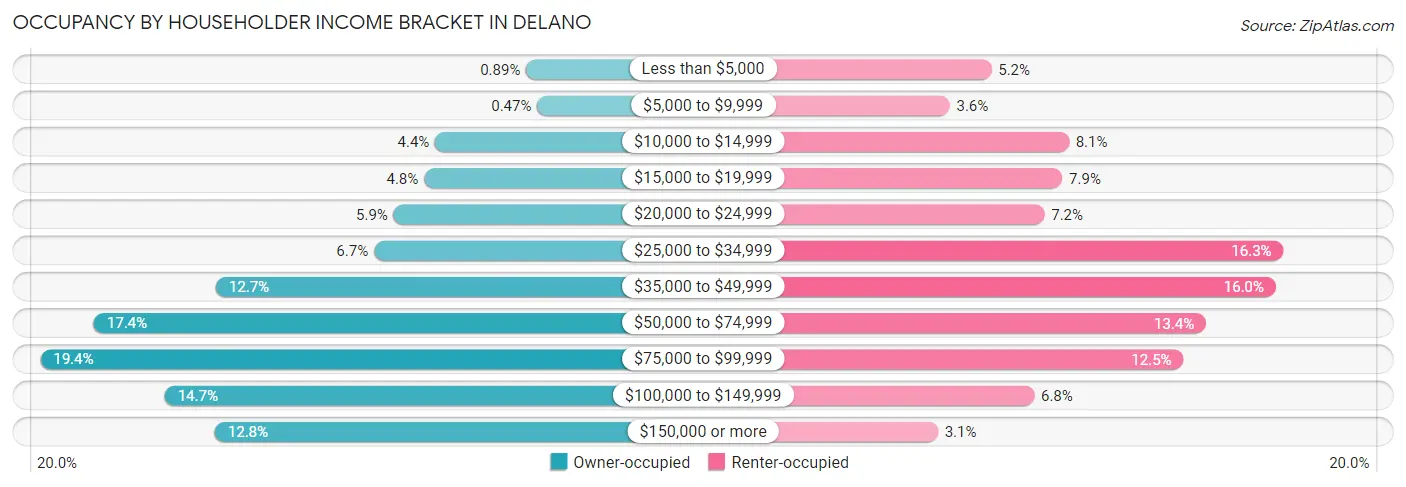
| Income Bracket | Owner-occupied | Renter-occupied |
| Less than $5,000 | 63 (0.9%) | 228 (5.2%) |
| $5,000 to $9,999 | 33 (0.5%) | 158 (3.6%) |
| $10,000 to $14,999 | 309 (4.4%) | 358 (8.1%) |
| $15,000 to $19,999 | 339 (4.8%) | 347 (7.9%) |
| $20,000 to $24,999 | 421 (5.9%) | 317 (7.2%) |
| $25,000 to $34,999 | 474 (6.7%) | 719 (16.3%) |
| $35,000 to $49,999 | 901 (12.7%) | 706 (16.0%) |
| $50,000 to $74,999 | 1,231 (17.4%) | 589 (13.4%) |
| $75,000 to $99,999 | 1,375 (19.4%) | 551 (12.5%) |
| $100,000 to $149,999 | 1,039 (14.7%) | 300 (6.8%) |
| $150,000 or more | 904 (12.8%) | 138 (3.1%) |
| Total | 7,089 (100.0%) | 4,411 (100.0%) |
Monthly Housing Cost Tiers in Delano
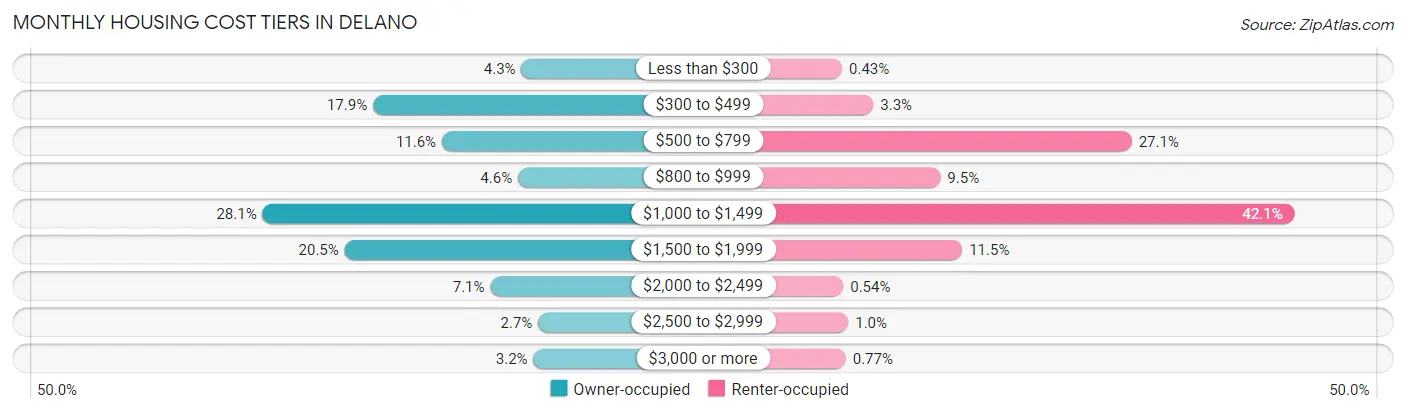
| Monthly Cost | Owner-occupied | Renter-occupied |
| Less than $300 | 302 (4.3%) | 19 (0.4%) |
| $300 to $499 | 1,271 (17.9%) | 146 (3.3%) |
| $500 to $799 | 821 (11.6%) | 1,195 (27.1%) |
| $800 to $999 | 325 (4.6%) | 418 (9.5%) |
| $1,000 to $1,499 | 1,992 (28.1%) | 1,856 (42.1%) |
| $1,500 to $1,999 | 1,456 (20.5%) | 507 (11.5%) |
| $2,000 to $2,499 | 505 (7.1%) | 24 (0.5%) |
| $2,500 to $2,999 | 193 (2.7%) | 44 (1.0%) |
| $3,000 or more | 224 (3.2%) | 34 (0.8%) |
| Total | 7,089 (100.0%) | 4,411 (100.0%) |
Physical Housing Characteristics in Delano
Housing Structures in Delano
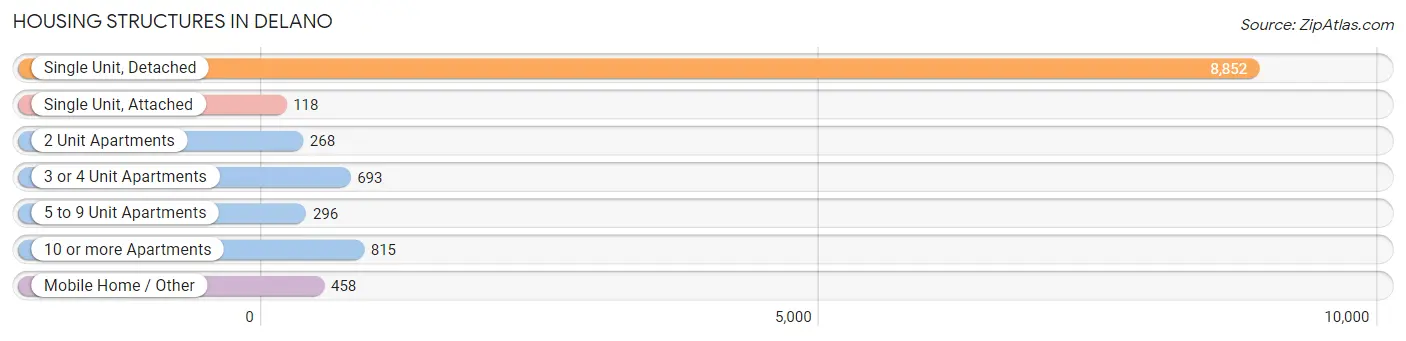
| Structure Type | # Housing Units | % Housing Units |
| Single Unit, Detached | 8,852 | 77.0% |
| Single Unit, Attached | 118 | 1.0% |
| 2 Unit Apartments | 268 | 2.3% |
| 3 or 4 Unit Apartments | 693 | 6.0% |
| 5 to 9 Unit Apartments | 296 | 2.6% |
| 10 or more Apartments | 815 | 7.1% |
| Mobile Home / Other | 458 | 4.0% |
| Total | 11,500 | 100.0% |
Housing Structures by Occupancy in Delano
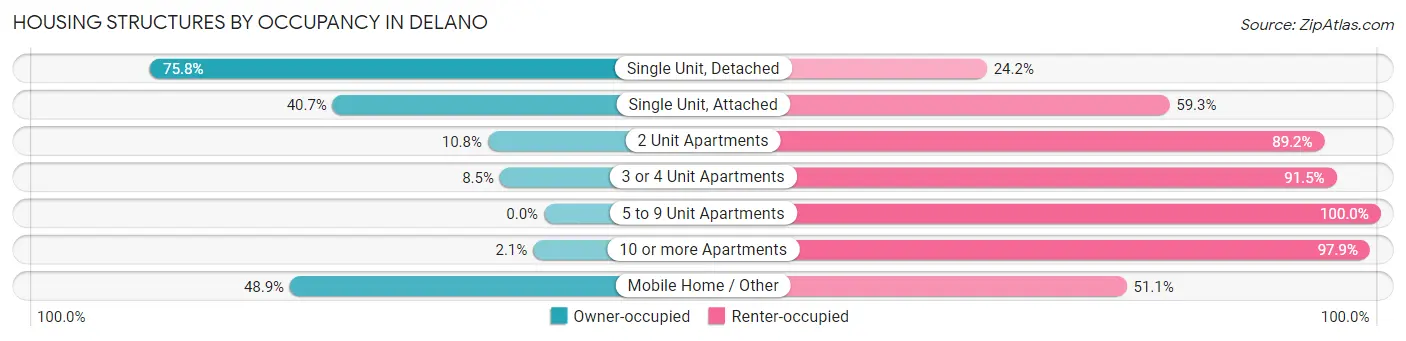
| Structure Type | Owner-occupied | Renter-occupied |
| Single Unit, Detached | 6,712 (75.8%) | 2,140 (24.2%) |
| Single Unit, Attached | 48 (40.7%) | 70 (59.3%) |
| 2 Unit Apartments | 29 (10.8%) | 239 (89.2%) |
| 3 or 4 Unit Apartments | 59 (8.5%) | 634 (91.5%) |
| 5 to 9 Unit Apartments | 0 (0.0%) | 296 (100.0%) |
| 10 or more Apartments | 17 (2.1%) | 798 (97.9%) |
| Mobile Home / Other | 224 (48.9%) | 234 (51.1%) |
| Total | 7,089 (61.6%) | 4,411 (38.4%) |
Housing Structures by Number of Rooms in Delano
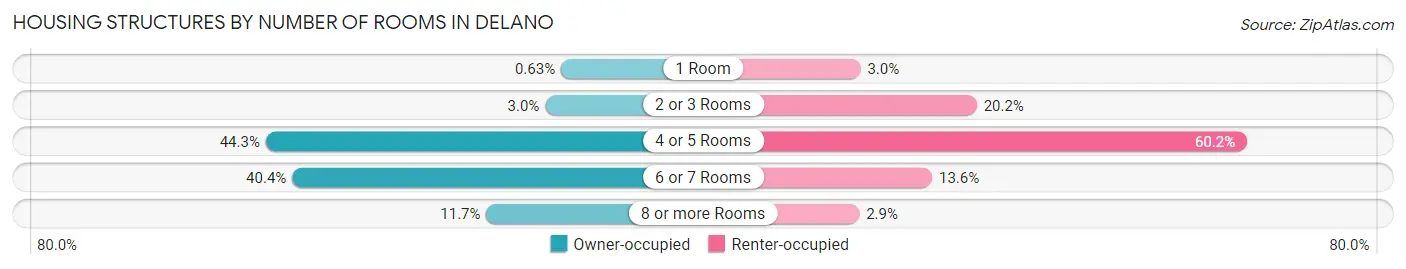
| Number of Rooms | Owner-occupied | Renter-occupied |
| 1 Room | 45 (0.6%) | 134 (3.0%) |
| 2 or 3 Rooms | 210 (3.0%) | 893 (20.2%) |
| 4 or 5 Rooms | 3,142 (44.3%) | 2,657 (60.2%) |
| 6 or 7 Rooms | 2,865 (40.4%) | 601 (13.6%) |
| 8 or more Rooms | 827 (11.7%) | 126 (2.9%) |
| Total | 7,089 (100.0%) | 4,411 (100.0%) |
Housing Structure by Heating Type in Delano
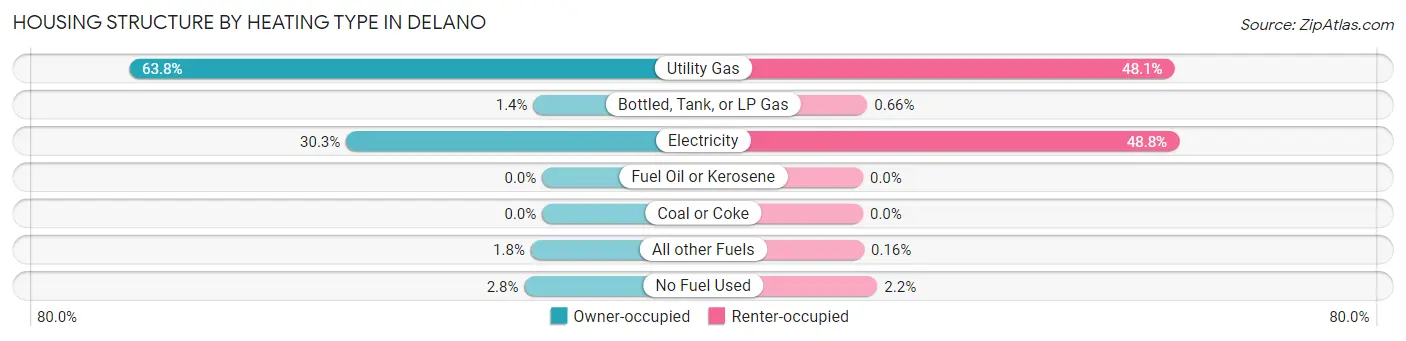
| Heating Type | Owner-occupied | Renter-occupied |
| Utility Gas | 4,525 (63.8%) | 2,123 (48.1%) |
| Bottled, Tank, or LP Gas | 96 (1.3%) | 29 (0.7%) |
| Electricity | 2,148 (30.3%) | 2,154 (48.8%) |
| Fuel Oil or Kerosene | 0 (0.0%) | 0 (0.0%) |
| Coal or Coke | 0 (0.0%) | 0 (0.0%) |
| All other Fuels | 125 (1.8%) | 7 (0.2%) |
| No Fuel Used | 195 (2.8%) | 98 (2.2%) |
| Total | 7,089 (100.0%) | 4,411 (100.0%) |
Household Vehicle Usage in Delano
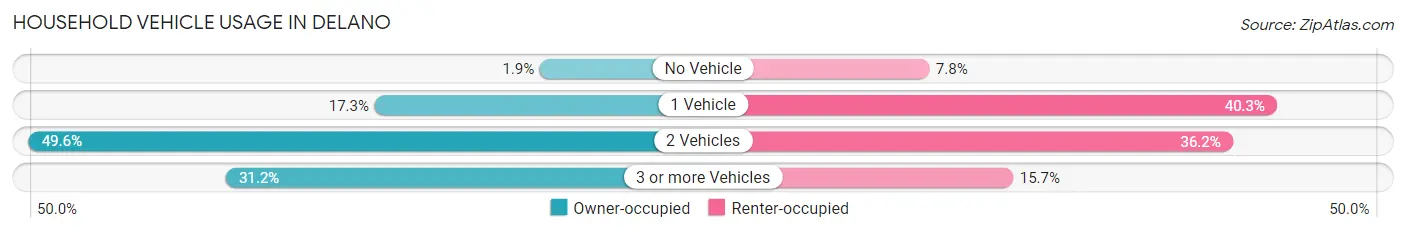
| Vehicles per Household | Owner-occupied | Renter-occupied |
| No Vehicle | 133 (1.9%) | 346 (7.8%) |
| 1 Vehicle | 1,227 (17.3%) | 1,778 (40.3%) |
| 2 Vehicles | 3,517 (49.6%) | 1,596 (36.2%) |
| 3 or more Vehicles | 2,212 (31.2%) | 691 (15.7%) |
| Total | 7,089 (100.0%) | 4,411 (100.0%) |
Real Estate & Mortgages in Delano
Real Estate and Mortgage Overview in Delano
| Characteristic | Without Mortgage | With Mortgage |
| Housing Units | 2,521 | 4,568 |
| Median Property Value | $208,500 | $261,900 |
| Median Household Income | $44,730 | $611 |
| Monthly Housing Costs | $452 | $224 |
| Real Estate Taxes | $1,378 | $170 |
Property Value by Mortgage Status in Delano
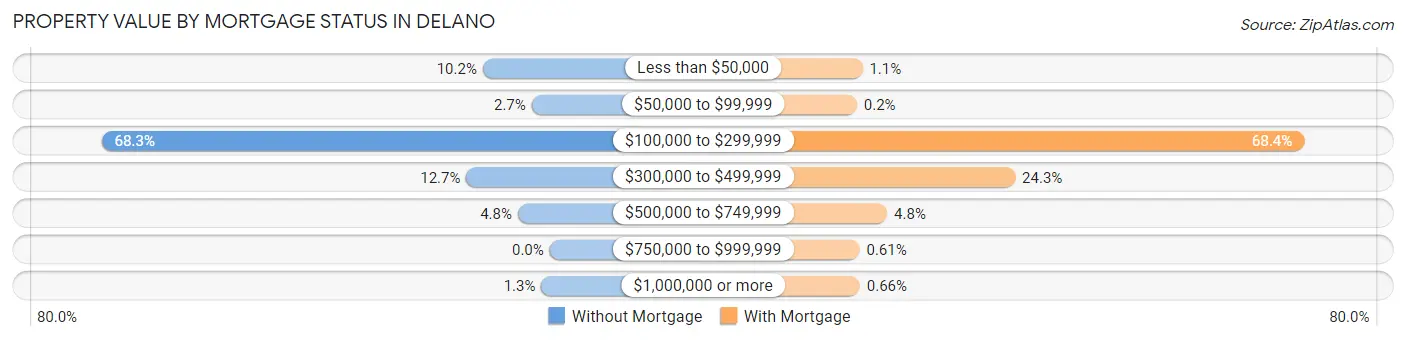
| Property Value | Without Mortgage | With Mortgage |
| Less than $50,000 | 257 (10.2%) | 48 (1.1%) |
| $50,000 to $99,999 | 69 (2.7%) | 9 (0.2%) |
| $100,000 to $299,999 | 1,721 (68.3%) | 3,122 (68.3%) |
| $300,000 to $499,999 | 320 (12.7%) | 1,111 (24.3%) |
| $500,000 to $749,999 | 122 (4.8%) | 220 (4.8%) |
| $750,000 to $999,999 | 0 (0.0%) | 28 (0.6%) |
| $1,000,000 or more | 32 (1.3%) | 30 (0.7%) |
| Total | 2,521 (100.0%) | 4,568 (100.0%) |
Household Income by Mortgage Status in Delano
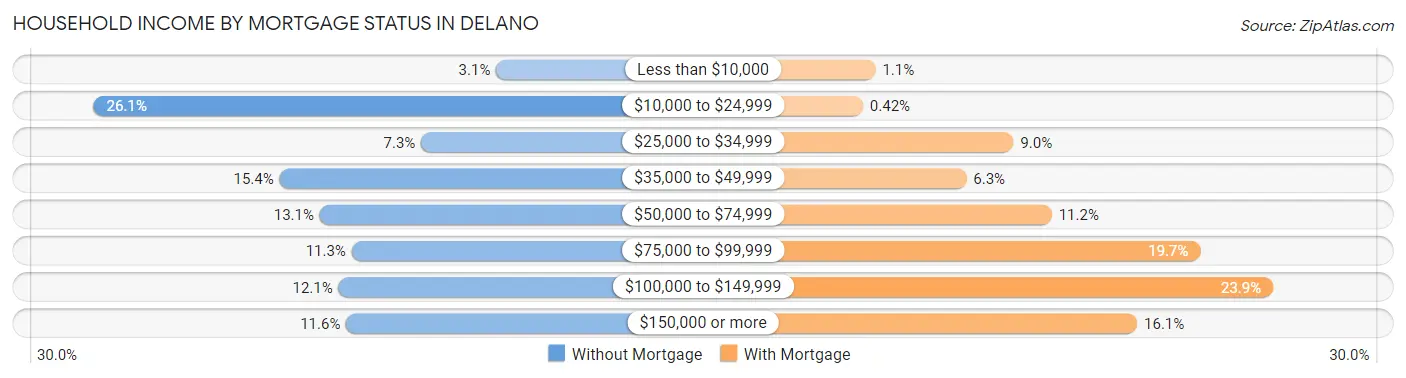
| Household Income | Without Mortgage | With Mortgage |
| Less than $10,000 | 77 (3.0%) | 52 (1.1%) |
| $10,000 to $24,999 | 657 (26.1%) | 19 (0.4%) |
| $25,000 to $34,999 | 185 (7.3%) | 412 (9.0%) |
| $35,000 to $49,999 | 389 (15.4%) | 289 (6.3%) |
| $50,000 to $74,999 | 331 (13.1%) | 512 (11.2%) |
| $75,000 to $99,999 | 285 (11.3%) | 900 (19.7%) |
| $100,000 to $149,999 | 304 (12.1%) | 1,090 (23.9%) |
| $150,000 or more | 293 (11.6%) | 735 (16.1%) |
| Total | 2,521 (100.0%) | 4,568 (100.0%) |
Property Value to Household Income Ratio in Delano
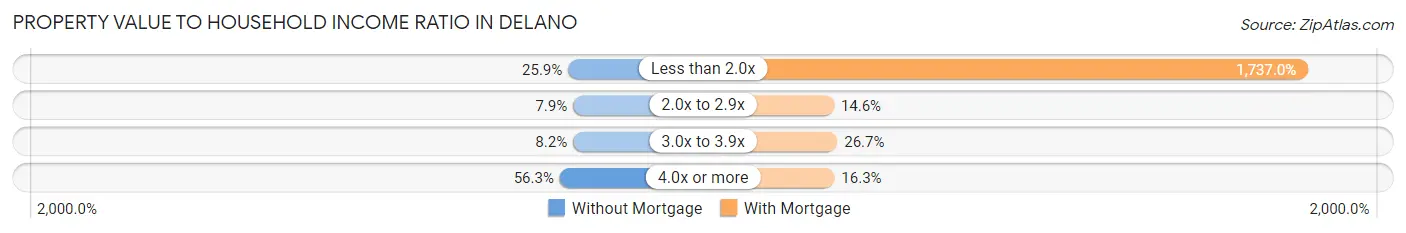
| Value-to-Income Ratio | Without Mortgage | With Mortgage |
| Less than 2.0x | 652 (25.9%) | 79,346 (1,737.0%) |
| 2.0x to 2.9x | 200 (7.9%) | 666 (14.6%) |
| 3.0x to 3.9x | 206 (8.2%) | 1,221 (26.7%) |
| 4.0x or more | 1,419 (56.3%) | 743 (16.3%) |
| Total | 2,521 (100.0%) | 4,568 (100.0%) |
Real Estate Taxes by Mortgage Status in Delano
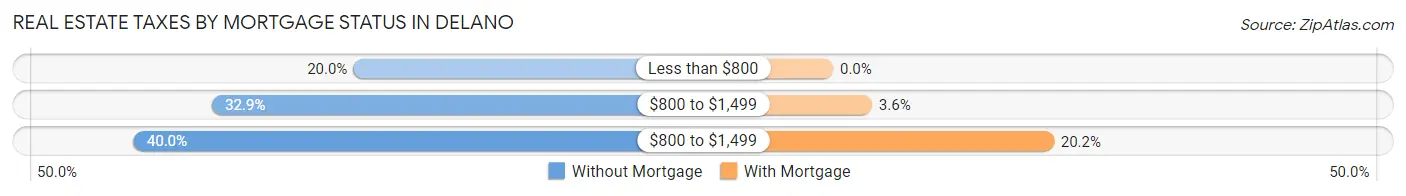
| Property Taxes | Without Mortgage | With Mortgage |
| Less than $800 | 504 (20.0%) | 0 (0.0%) |
| $800 to $1,499 | 829 (32.9%) | 162 (3.5%) |
| $800 to $1,499 | 1,009 (40.0%) | 921 (20.2%) |
| Total | 2,521 (100.0%) | 4,568 (100.0%) |
Health & Disability in Delano
Health Insurance Coverage by Age in Delano
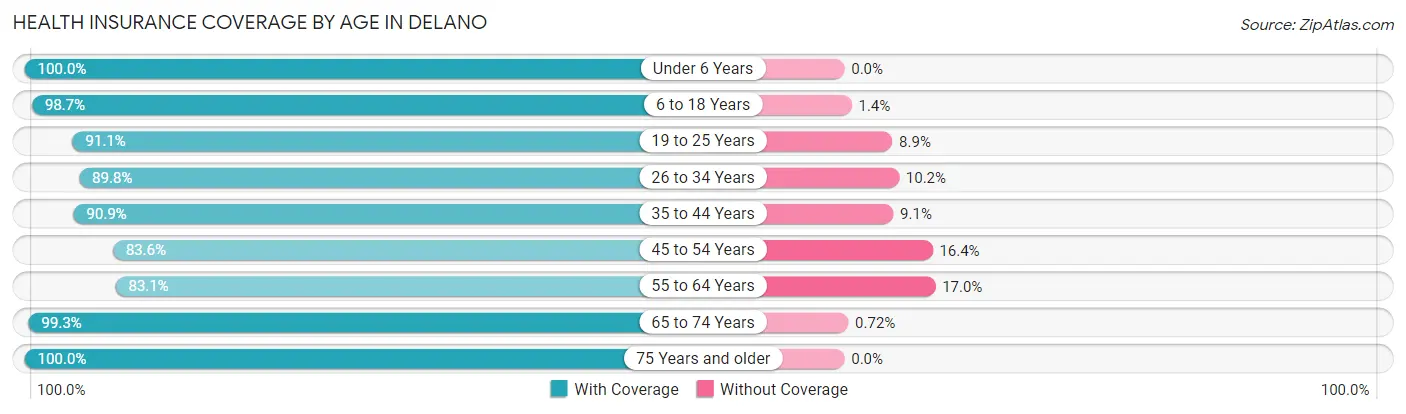
| Age Bracket | With Coverage | Without Coverage |
| Under 6 Years | 3,523 (100.0%) | 0 (0.0%) |
| 6 to 18 Years | 9,200 (98.7%) | 126 (1.3%) |
| 19 to 25 Years | 4,859 (91.1%) | 476 (8.9%) |
| 26 to 34 Years | 4,716 (89.8%) | 534 (10.2%) |
| 35 to 44 Years | 5,008 (90.9%) | 502 (9.1%) |
| 45 to 54 Years | 4,754 (83.6%) | 935 (16.4%) |
| 55 to 64 Years | 3,846 (83.1%) | 785 (17.0%) |
| 65 to 74 Years | 2,753 (99.3%) | 20 (0.7%) |
| 75 Years and older | 1,603 (100.0%) | 0 (0.0%) |
| Total | 40,262 (92.3%) | 3,378 (7.7%) |
Health Insurance Coverage by Citizenship Status in Delano

| Citizenship Status | With Coverage | Without Coverage |
| Native Born | 3,523 (100.0%) | 0 (0.0%) |
| Foreign Born, Citizen | 9,200 (98.7%) | 126 (1.3%) |
| Foreign Born, not a Citizen | 4,859 (91.1%) | 476 (8.9%) |
Health Insurance Coverage by Household Income in Delano
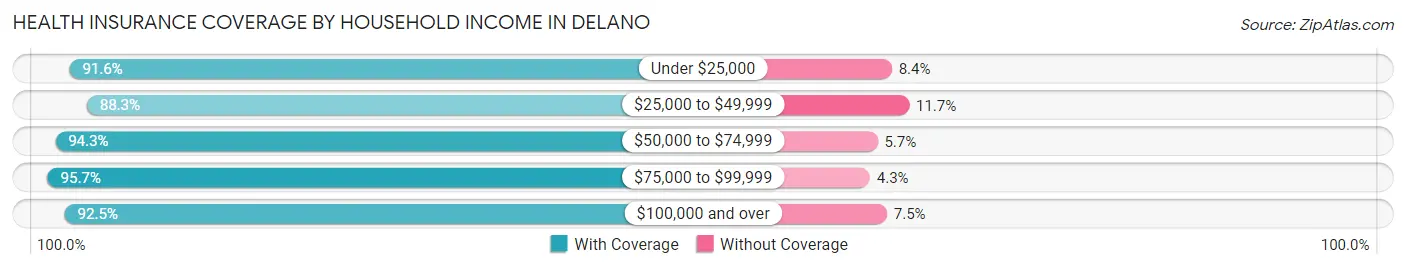
| Household Income | With Coverage | Without Coverage |
| Under $25,000 | 5,801 (91.6%) | 533 (8.4%) |
| $25,000 to $49,999 | 8,959 (88.3%) | 1,183 (11.7%) |
| $50,000 to $74,999 | 6,590 (94.3%) | 401 (5.7%) |
| $75,000 to $99,999 | 8,039 (95.7%) | 363 (4.3%) |
| $100,000 and over | 10,759 (92.5%) | 874 (7.5%) |
Public vs Private Health Insurance Coverage by Age in Delano
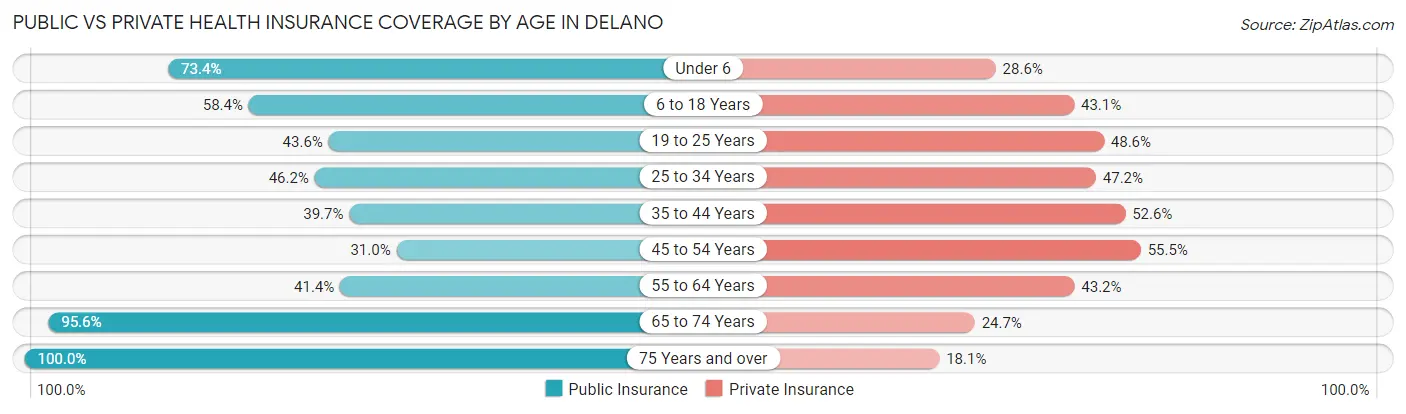
| Age Bracket | Public Insurance | Private Insurance |
| Under 6 | 2,584 (73.4%) | 1,006 (28.6%) |
| 6 to 18 Years | 5,445 (58.4%) | 4,020 (43.1%) |
| 19 to 25 Years | 2,324 (43.6%) | 2,595 (48.6%) |
| 25 to 34 Years | 2,423 (46.2%) | 2,476 (47.2%) |
| 35 to 44 Years | 2,189 (39.7%) | 2,898 (52.6%) |
| 45 to 54 Years | 1,762 (31.0%) | 3,156 (55.5%) |
| 55 to 64 Years | 1,919 (41.4%) | 1,999 (43.2%) |
| 65 to 74 Years | 2,651 (95.6%) | 684 (24.7%) |
| 75 Years and over | 1,603 (100.0%) | 290 (18.1%) |
| Total | 22,900 (52.5%) | 19,124 (43.8%) |
Disability Status by Sex by Age in Delano
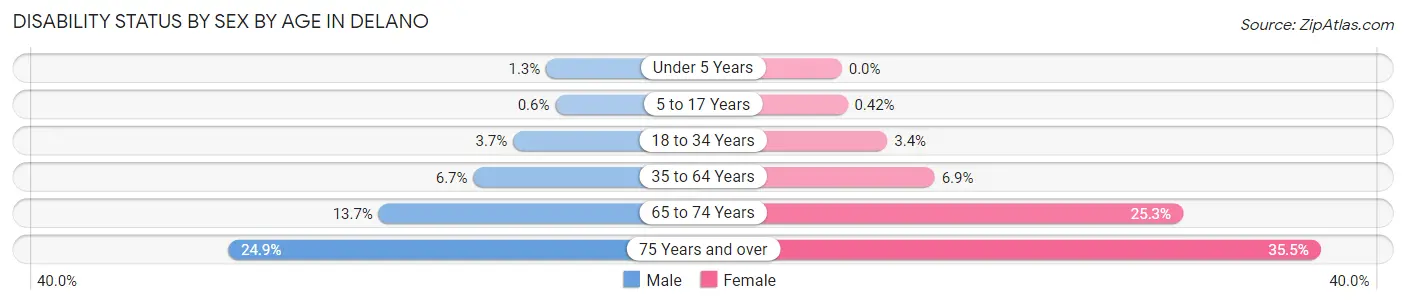
| Age Bracket | Male | Female |
| Under 5 Years | 19 (1.3%) | 0 (0.0%) |
| 5 to 17 Years | 32 (0.6%) | 16 (0.4%) |
| 18 to 34 Years | 216 (3.7%) | 185 (3.4%) |
| 35 to 64 Years | 506 (6.7%) | 570 (6.9%) |
| 65 to 74 Years | 175 (13.7%) | 379 (25.3%) |
| 75 Years and over | 170 (24.9%) | 327 (35.5%) |
Disability Class by Sex by Age in Delano
Disability Class: Hearing Difficulty
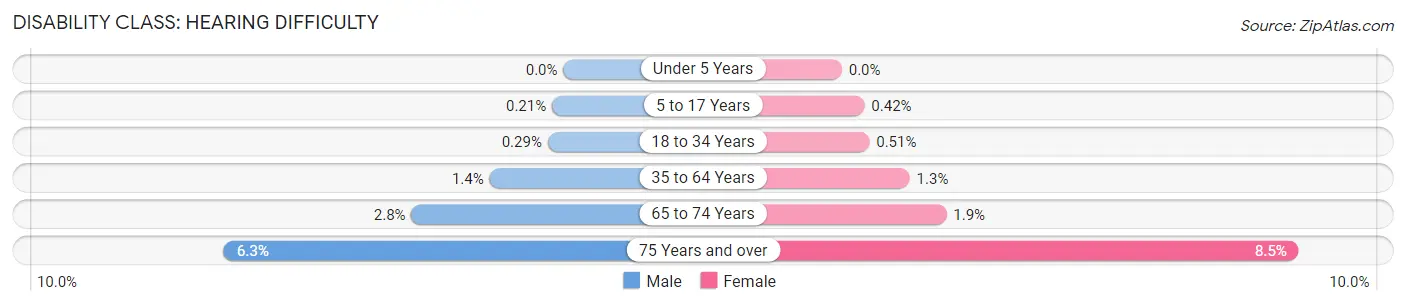
| Age Bracket | Male | Female |
| Under 5 Years | 0 (0.0%) | 0 (0.0%) |
| 5 to 17 Years | 11 (0.2%) | 16 (0.4%) |
| 18 to 34 Years | 17 (0.3%) | 28 (0.5%) |
| 35 to 64 Years | 104 (1.4%) | 104 (1.3%) |
| 65 to 74 Years | 36 (2.8%) | 29 (1.9%) |
| 75 Years and over | 43 (6.3%) | 78 (8.5%) |
Disability Class: Vision Difficulty
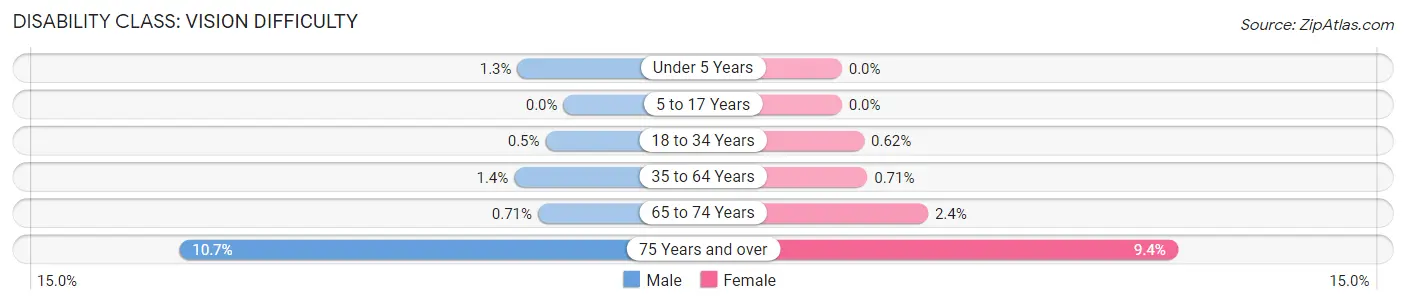
| Age Bracket | Male | Female |
| Under 5 Years | 19 (1.3%) | 0 (0.0%) |
| 5 to 17 Years | 0 (0.0%) | 0 (0.0%) |
| 18 to 34 Years | 29 (0.5%) | 34 (0.6%) |
| 35 to 64 Years | 104 (1.4%) | 59 (0.7%) |
| 65 to 74 Years | 9 (0.7%) | 36 (2.4%) |
| 75 Years and over | 73 (10.7%) | 86 (9.3%) |
Disability Class: Cognitive Difficulty
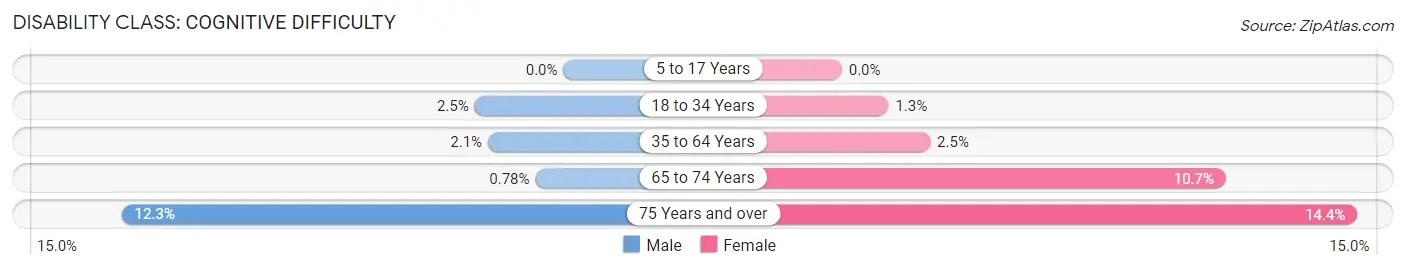
| Age Bracket | Male | Female |
| 5 to 17 Years | 0 (0.0%) | 0 (0.0%) |
| 18 to 34 Years | 143 (2.5%) | 71 (1.3%) |
| 35 to 64 Years | 159 (2.1%) | 203 (2.5%) |
| 65 to 74 Years | 10 (0.8%) | 160 (10.7%) |
| 75 Years and over | 84 (12.3%) | 132 (14.3%) |
Disability Class: Ambulatory Difficulty
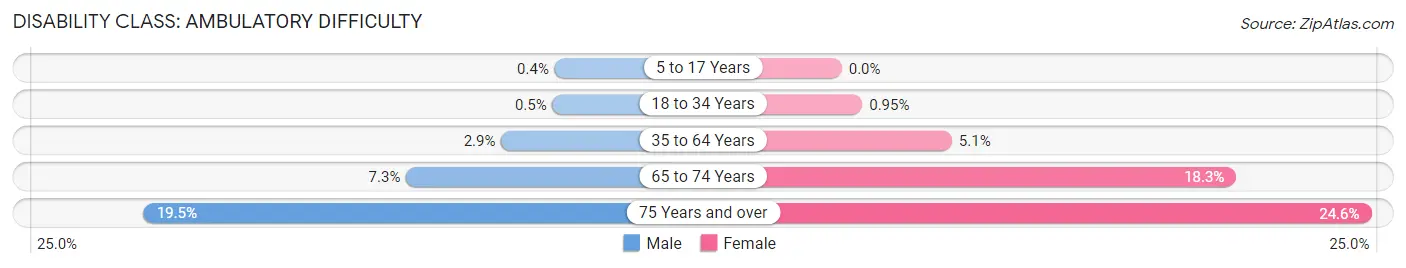
| Age Bracket | Male | Female |
| 5 to 17 Years | 21 (0.4%) | 0 (0.0%) |
| 18 to 34 Years | 29 (0.5%) | 52 (0.9%) |
| 35 to 64 Years | 218 (2.9%) | 422 (5.1%) |
| 65 to 74 Years | 93 (7.3%) | 274 (18.3%) |
| 75 Years and over | 133 (19.5%) | 226 (24.6%) |
Disability Class: Self-Care Difficulty
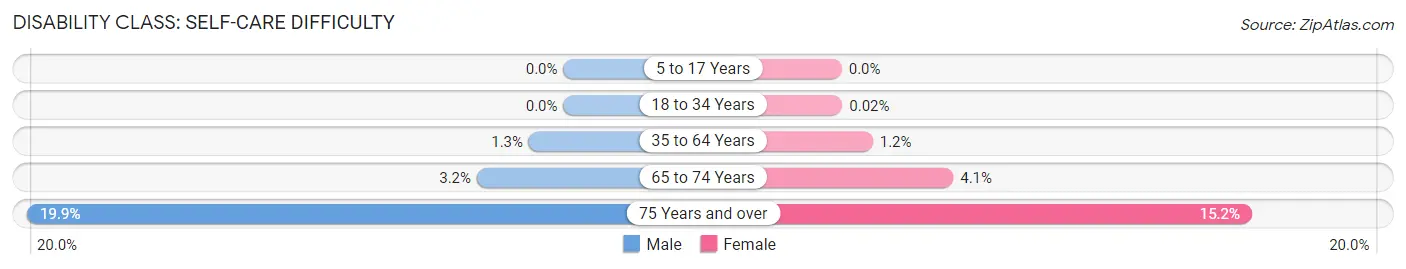
| Age Bracket | Male | Female |
| 5 to 17 Years | 0 (0.0%) | 0 (0.0%) |
| 18 to 34 Years | 0 (0.0%) | 1 (0.0%) |
| 35 to 64 Years | 97 (1.3%) | 95 (1.1%) |
| 65 to 74 Years | 41 (3.2%) | 62 (4.1%) |
| 75 Years and over | 136 (19.9%) | 140 (15.2%) |
Technology Access in Delano
Computing Device Access in Delano
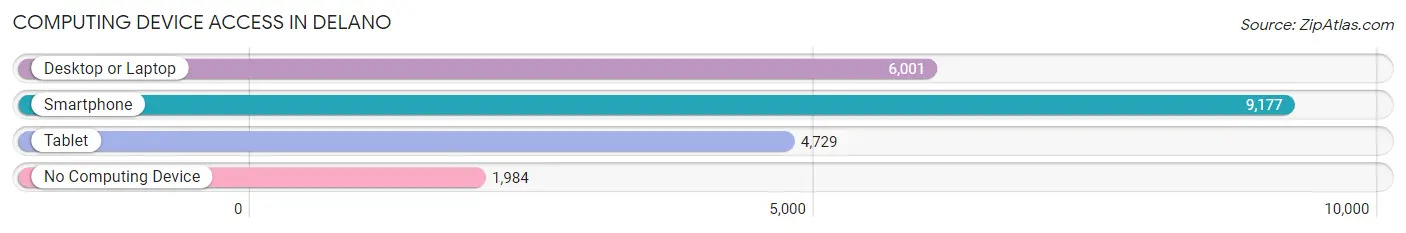
| Device Type | # Households | % Households |
| Desktop or Laptop | 6,001 | 52.2% |
| Smartphone | 9,177 | 79.8% |
| Tablet | 4,729 | 41.1% |
| No Computing Device | 1,984 | 17.2% |
| Total | 11,500 | 100.0% |
Internet Access in Delano
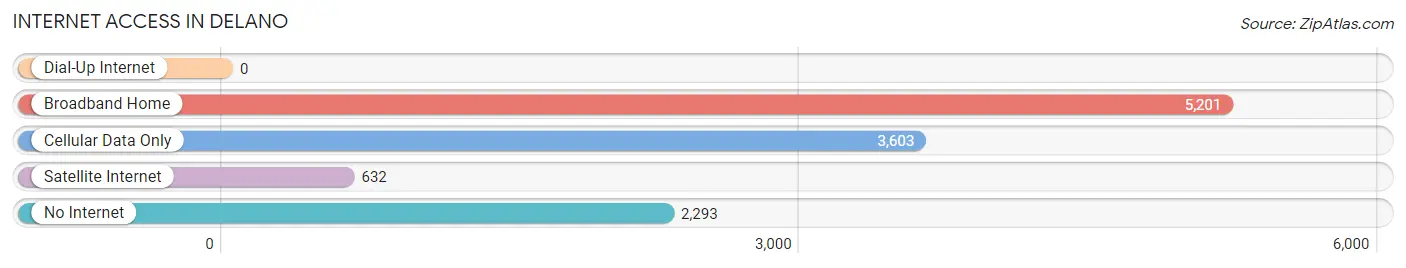
| Internet Type | # Households | % Households |
| Dial-Up Internet | 0 | 0.0% |
| Broadband Home | 5,201 | 45.2% |
| Cellular Data Only | 3,603 | 31.3% |
| Satellite Internet | 632 | 5.5% |
| No Internet | 2,293 | 19.9% |
| Total | 11,500 | 100.0% |
Delano Summary
Delano, California is a city located in Kern County, California, United States. It is located in the San Joaquin Valley, approximately 40 miles north of Bakersfield. The population of Delano was 53,041 at the 2010 census, up from 38,824 at the 2000 census. Delano is part of the Bakersfield metropolitan area, which has a population of approximately 839,631.
History
Delano was founded in 1869 by Colonel Charles M. McLane, who named the city after Columbus Delano, the Secretary of the Interior under President Ulysses S. Grant. The town was originally a railroad stop on the Southern Pacific Railroad. The town was incorporated in 1913.
During the Great Depression, Delano was the site of one of the largest labor strikes in the history of the United States. The strike, which lasted from September 8, 1965 to March 10, 1966, was led by Cesar Chavez and the National Farm Workers Association (NFWA). The strike was successful in gaining higher wages and better working conditions for the farm workers.
Geography
Delano is located at 35°45'59" North, 119°17'1" West (35.766389, -119.283611). It is situated in the San Joaquin Valley, approximately 40 miles north of Bakersfield. The city has a total area of 8.2 square miles, all of which is land.
Economy
Delano’s economy is largely based on agriculture. The city is home to a number of large farms, including the Delano Farms Company, which is one of the largest employers in the city. Other major employers include the Delano Regional Medical Center, the Delano Union School District, and the Delano Joint Union High School District.
The city also has a number of retail stores, restaurants, and other businesses. The Delano Marketplace is a popular shopping center located in the city.
Demographics
As of the 2010 census, there were 53,041 people, 15,845 households, and 12,845 families residing in the city. The population density was 6,457.2 people per square mile. The racial makeup of the city was 57.2% White, 2.3% African American, 1.2% Native American, 0.8% Asian, 0.1% Pacific Islander, 35.2% from other races, and 3.2% from two or more races. Hispanic or Latino of any race were 64.2% of the population.
The median income for a household in the city was $35,902, and the median income for a family was $41,845. Males had a median income of $31,945 versus $25,845 for females. The per capita income for the city was $14,945. About 17.2% of families and 20.7% of the population were below the poverty line, including 28.2% of those under age 18 and 11.2% of those age 65 or over.
Common Questions
What is Per Capita Income in Delano?
Per Capita income in Delano is $17,517.
What is the Median Family Income in Delano?
Median Family Income in Delano is $57,625.
What is the Median Household income in Delano?
Median Household Income in Delano is $53,639.
What is Income or Wage Gap in Delano?
Income or Wage Gap in Delano is 29.1%.
Women in Delano earn 70.9 cents for every dollar earned by a man.
What is Family Income Deficit in Delano?
Family Income Deficit in Delano is $8,654.
Families that are below poverty line in Delano earn $8,654 less on average than the poverty threshold level.
What is Inequality or Gini Index in Delano?
Inequality or Gini Index in Delano is 0.44.
What is the Total Population of Delano?
Total Population of Delano is 50,498.
What is the Total Male Population of Delano?
Total Male Population of Delano is 28,855.
What is the Total Female Population of Delano?
Total Female Population of Delano is 21,643.
What is the Ratio of Males per 100 Females in Delano?
There are 133.32 Males per 100 Females in Delano.
What is the Ratio of Females per 100 Males in Delano?
There are 75.01 Females per 100 Males in Delano.
What is the Median Population Age in Delano?
Median Population Age in Delano is 33.3 Years.
What is the Average Family Size in Delano
Average Family Size in Delano is 4.1 People.
What is the Average Household Size in Delano
Average Household Size in Delano is 3.8 People.
How Large is the Labor Force in Delano?
There are 20,545 People in the Labor Forcein in Delano.
What is the Percentage of People in the Labor Force in Delano?
51.3% of People are in the Labor Force in Delano.
What is the Unemployment Rate in Delano?
Unemployment Rate in Delano is 9.8%.