Buena Park, CA Map & Demographics
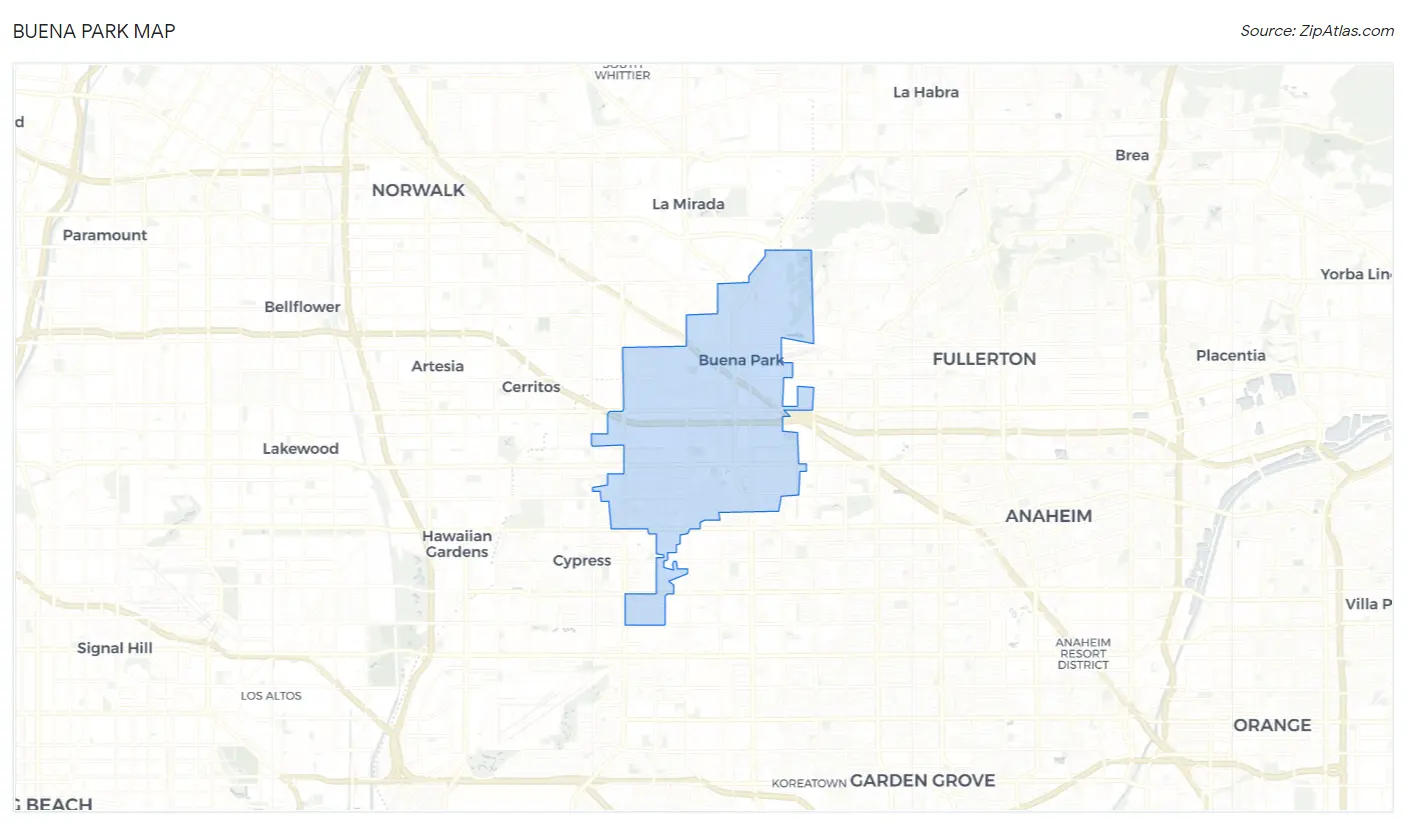
Buena Park Map
Buena Park Overview
$37,945
PER CAPITA INCOME
$101,722
AVG FAMILY INCOME
$101,586
AVG HOUSEHOLD INCOME
14.8%
WAGE / INCOME GAP [ % ]
85.2¢/ $1
WAGE / INCOME GAP [ $ ]
$11,935
FAMILY INCOME DEFICIT
0.41
INEQUALITY / GINI INDEX
83,542
TOTAL POPULATION
41,846
MALE POPULATION
41,696
FEMALE POPULATION
100.36
MALES / 100 FEMALES
99.64
FEMALES / 100 MALES
36.9
MEDIAN AGE
3.7
AVG FAMILY SIZE
3.4
AVG HOUSEHOLD SIZE
45,951
LABOR FORCE [ PEOPLE ]
69.0%
PERCENT IN LABOR FORCE
5.4%
UNEMPLOYMENT RATE
Income in Buena Park
Income Overview in Buena Park
Per Capita Income in Buena Park is $37,945, while median incomes of families and households are $101,722 and $101,586 respectively.
| Characteristic | Number | Measure |
| Per Capita Income | 83,542 | $37,945 |
| Median Family Income | 19,888 | $101,722 |
| Mean Family Income | 19,888 | $127,590 |
| Median Household Income | 24,283 | $101,586 |
| Mean Household Income | 24,283 | $124,195 |
| Income Deficit | 19,888 | $11,935 |
| Wage / Income Gap (%) | 83,542 | 14.84% |
| Wage / Income Gap ($) | 83,542 | 85.16¢ per $1 |
| Gini / Inequality Index | 83,542 | 0.41 |
Earnings by Sex in Buena Park
Average Earnings in Buena Park are $44,439, $46,971 for men and $40,000 for women, a difference of 14.8%.
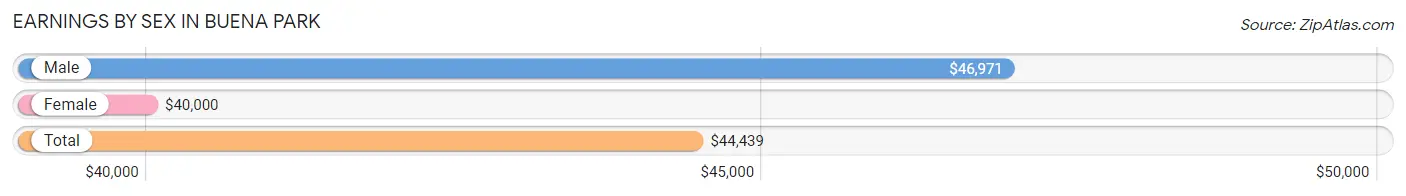
| Sex | Number | Average Earnings |
| Male | 25,346 (54.3%) | $46,971 |
| Female | 21,360 (45.7%) | $40,000 |
| Total | 46,706 (100.0%) | $44,439 |
Earnings by Sex by Income Bracket in Buena Park
The most common earnings brackets in Buena Park are $100,000+ for men (4,794 | 18.9%) and $100,000+ for women (2,764 | 12.9%).
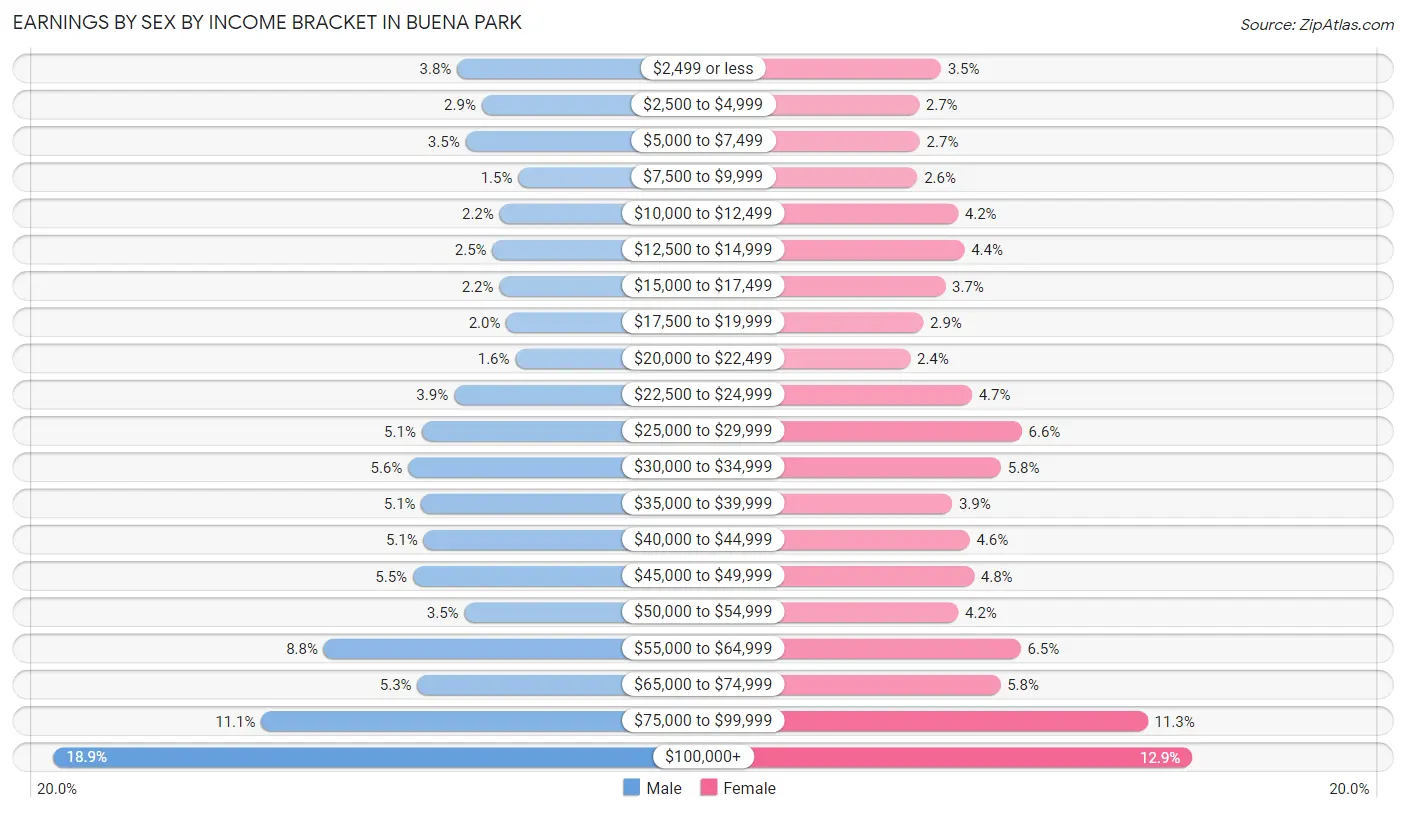
| Income | Male | Female |
| $2,499 or less | 960 (3.8%) | 751 (3.5%) |
| $2,500 to $4,999 | 727 (2.9%) | 576 (2.7%) |
| $5,000 to $7,499 | 883 (3.5%) | 584 (2.7%) |
| $7,500 to $9,999 | 380 (1.5%) | 564 (2.6%) |
| $10,000 to $12,499 | 558 (2.2%) | 888 (4.2%) |
| $12,500 to $14,999 | 626 (2.5%) | 940 (4.4%) |
| $15,000 to $17,499 | 560 (2.2%) | 785 (3.7%) |
| $17,500 to $19,999 | 494 (1.9%) | 610 (2.9%) |
| $20,000 to $22,499 | 407 (1.6%) | 507 (2.4%) |
| $22,500 to $24,999 | 990 (3.9%) | 1,000 (4.7%) |
| $25,000 to $29,999 | 1,297 (5.1%) | 1,400 (6.6%) |
| $30,000 to $34,999 | 1,428 (5.6%) | 1,233 (5.8%) |
| $35,000 to $39,999 | 1,300 (5.1%) | 842 (3.9%) |
| $40,000 to $44,999 | 1,281 (5.1%) | 982 (4.6%) |
| $45,000 to $49,999 | 1,382 (5.4%) | 1,017 (4.8%) |
| $50,000 to $54,999 | 891 (3.5%) | 891 (4.2%) |
| $55,000 to $64,999 | 2,229 (8.8%) | 1,390 (6.5%) |
| $65,000 to $74,999 | 1,339 (5.3%) | 1,228 (5.8%) |
| $75,000 to $99,999 | 2,820 (11.1%) | 2,408 (11.3%) |
| $100,000+ | 4,794 (18.9%) | 2,764 (12.9%) |
| Total | 25,346 (100.0%) | 21,360 (100.0%) |
Earnings by Sex by Educational Attainment in Buena Park
Average earnings in Buena Park are $54,704 for men and $45,140 for women, a difference of 17.5%. Men with an educational attainment of graduate degree enjoy the highest average annual earnings of $96,520, while those with less than high school education earn the least with $38,374. Women with an educational attainment of graduate degree earn the most with the average annual earnings of $85,118, while those with less than high school education have the smallest earnings of $27,414.
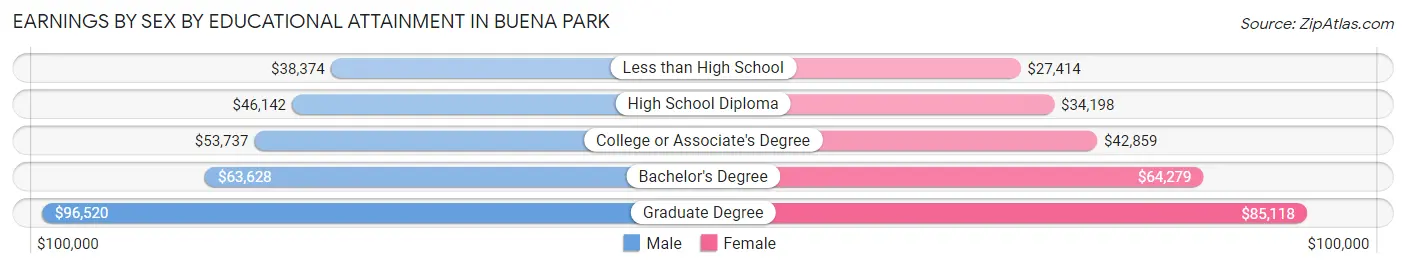
| Educational Attainment | Male Income | Female Income |
| Less than High School | $38,374 | $27,414 |
| High School Diploma | $46,142 | $34,198 |
| College or Associate's Degree | $53,737 | $42,859 |
| Bachelor's Degree | $63,628 | $64,279 |
| Graduate Degree | $96,520 | $85,118 |
| Total | $54,704 | $45,140 |
Family Income in Buena Park
Family Income Brackets in Buena Park
According to the Buena Park family income data, there are 3,997 families falling into the $100,000 to $149,999 income range, which is the most common income bracket and makes up 20.1% of all families. Conversely, the $10,000 to $14,999 income bracket is the least frequent group with only 259 families (1.3%) belonging to this category.
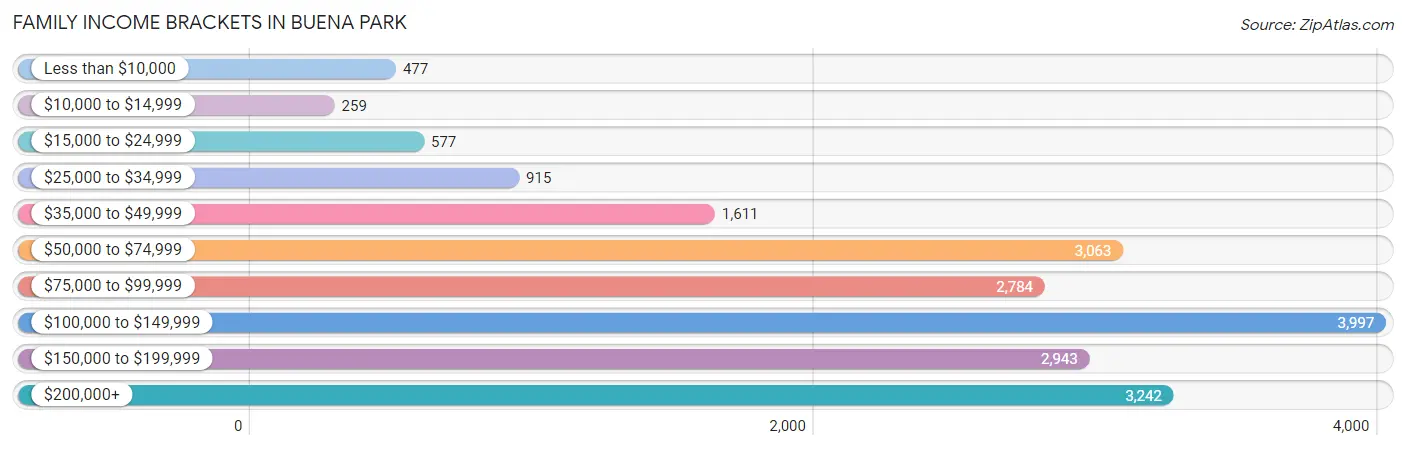
| Income Bracket | # Families | % Families |
| Less than $10,000 | 477 | 2.4% |
| $10,000 to $14,999 | 259 | 1.3% |
| $15,000 to $24,999 | 577 | 2.9% |
| $25,000 to $34,999 | 915 | 4.6% |
| $35,000 to $49,999 | 1,611 | 8.1% |
| $50,000 to $74,999 | 3,063 | 15.4% |
| $75,000 to $99,999 | 2,784 | 14.0% |
| $100,000 to $149,999 | 3,997 | 20.1% |
| $150,000 to $199,999 | 2,943 | 14.8% |
| $200,000+ | 3,242 | 16.3% |
Family Income by Famaliy Size in Buena Park
7+ person families (772 | 3.9%) account for the highest median family income in Buena Park with $180,523 per family, while 2-person families (6,646 | 33.4%) have the highest median income of $38,230 per family member.
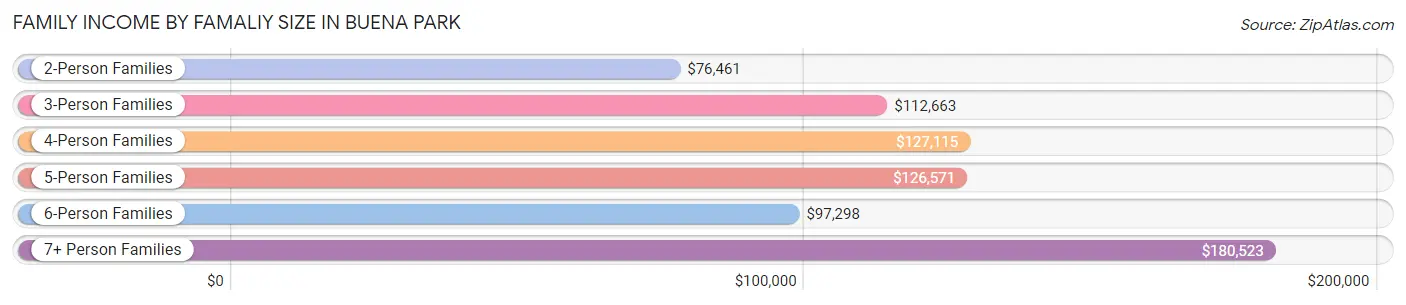
| Income Bracket | # Families | Median Income |
| 2-Person Families | 6,646 (33.4%) | $76,461 |
| 3-Person Families | 5,123 (25.8%) | $112,663 |
| 4-Person Families | 4,152 (20.9%) | $127,115 |
| 5-Person Families | 2,163 (10.9%) | $126,571 |
| 6-Person Families | 1,032 (5.2%) | $97,298 |
| 7+ Person Families | 772 (3.9%) | $180,523 |
| Total | 19,888 (100.0%) | $101,722 |
Family Income by Number of Earners in Buena Park
The median family income in Buena Park is $101,722, with families comprising 3+ earners (4,787) having the highest median family income of $152,600, while families with no earners (1,626) have the lowest median family income of $36,333, accounting for 24.1% and 8.2% of families, respectively.
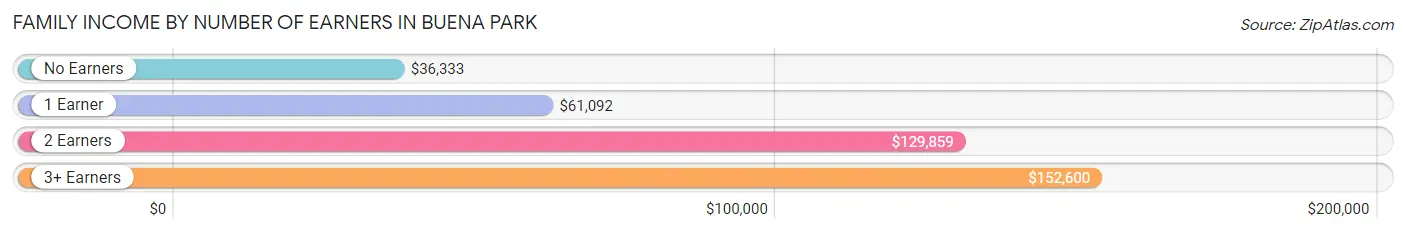
| Number of Earners | # Families | Median Income |
| No Earners | 1,626 (8.2%) | $36,333 |
| 1 Earner | 5,699 (28.7%) | $61,092 |
| 2 Earners | 7,776 (39.1%) | $129,859 |
| 3+ Earners | 4,787 (24.1%) | $152,600 |
| Total | 19,888 (100.0%) | $101,722 |
Household Income in Buena Park
Household Income Brackets in Buena Park
With 5,221 households falling in the category, the $100,000 to $149,999 income range is the most frequent in Buena Park, accounting for 21.5% of all households. In contrast, only 486 households (2.0%) fall into the $10,000 to $14,999 income bracket, making it the least populous group.
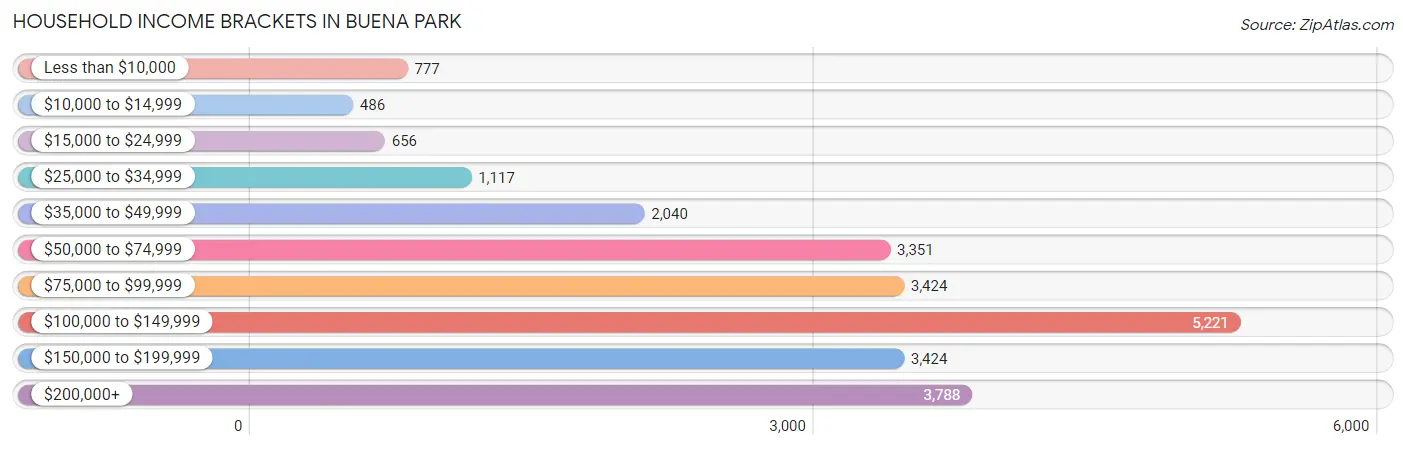
| Income Bracket | # Households | % Households |
| Less than $10,000 | 777 | 3.2% |
| $10,000 to $14,999 | 486 | 2.0% |
| $15,000 to $24,999 | 656 | 2.7% |
| $25,000 to $34,999 | 1,117 | 4.6% |
| $35,000 to $49,999 | 2,040 | 8.4% |
| $50,000 to $74,999 | 3,351 | 13.8% |
| $75,000 to $99,999 | 3,424 | 14.1% |
| $100,000 to $149,999 | 5,221 | 21.5% |
| $150,000 to $199,999 | 3,424 | 14.1% |
| $200,000+ | 3,788 | 15.6% |
Household Income by Householder Age in Buena Park
The median household income in Buena Park is $101,586, with the highest median household income of $113,366 found in the 45 to 64 years age bracket for the primary householder. A total of 10,155 households (41.8%) fall into this category. Meanwhile, the 15 to 24 years age bracket for the primary householder has the lowest median household income of $68,750, with 444 households (1.8%) in this group.
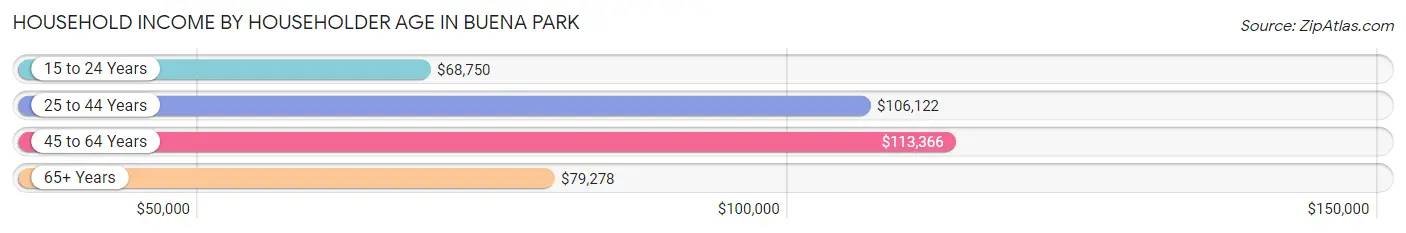
| Income Bracket | # Households | Median Income |
| 15 to 24 Years | 444 (1.8%) | $68,750 |
| 25 to 44 Years | 8,179 (33.7%) | $106,122 |
| 45 to 64 Years | 10,155 (41.8%) | $113,366 |
| 65+ Years | 5,505 (22.7%) | $79,278 |
| Total | 24,283 (100.0%) | $101,586 |
Poverty in Buena Park
Income Below Poverty by Sex and Age in Buena Park
With 8.1% poverty level for males and 9.5% for females among the residents of Buena Park, 5 year old males and 15 year old females are the most vulnerable to poverty, with 118 males (25.8%) and 66 females (17.5%) in their respective age groups living below the poverty level.
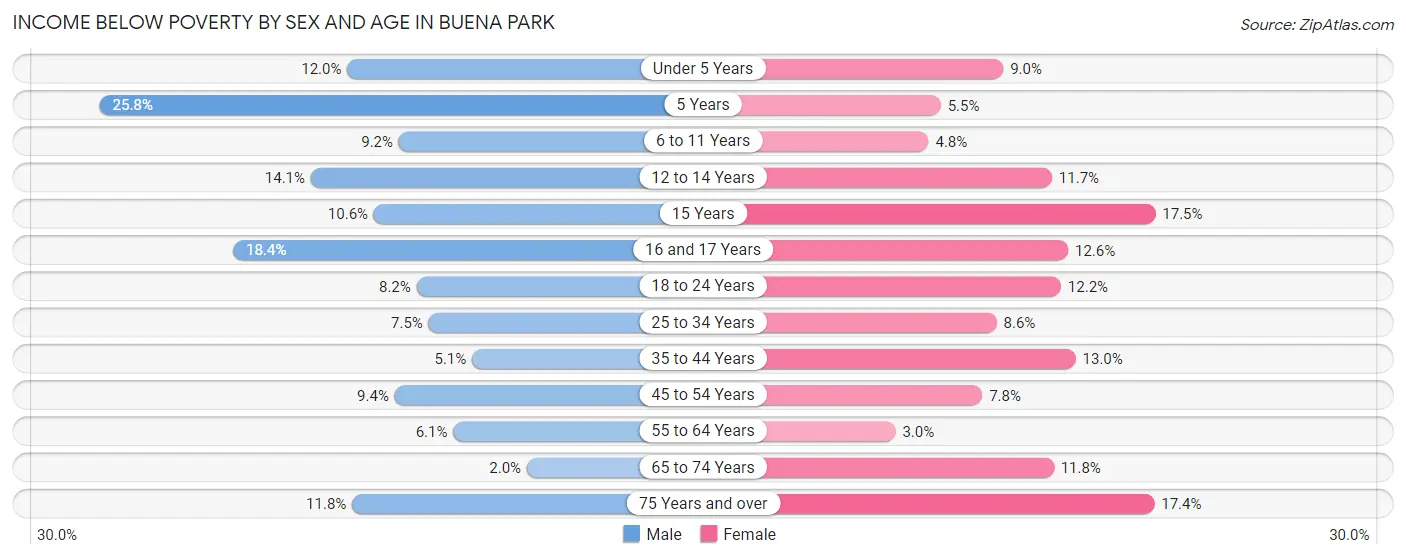
| Age Bracket | Male | Female |
| Under 5 Years | 292 (12.0%) | 214 (9.0%) |
| 5 Years | 118 (25.8%) | 36 (5.5%) |
| 6 to 11 Years | 294 (9.2%) | 139 (4.8%) |
| 12 to 14 Years | 242 (14.1%) | 241 (11.7%) |
| 15 Years | 61 (10.5%) | 66 (17.5%) |
| 16 and 17 Years | 160 (18.4%) | 76 (12.6%) |
| 18 to 24 Years | 347 (8.2%) | 443 (12.2%) |
| 25 to 34 Years | 502 (7.5%) | 554 (8.6%) |
| 35 to 44 Years | 308 (5.1%) | 723 (13.0%) |
| 45 to 54 Years | 440 (9.4%) | 391 (7.8%) |
| 55 to 64 Years | 342 (6.1%) | 171 (3.0%) |
| 65 to 74 Years | 67 (2.0%) | 418 (11.8%) |
| 75 Years and over | 216 (11.8%) | 452 (17.4%) |
| Total | 3,389 (8.1%) | 3,924 (9.5%) |
Income Above Poverty by Sex and Age in Buena Park
According to the poverty statistics in Buena Park, males aged 65 to 74 years and females aged 55 to 64 years are the age groups that are most secure financially, with 98.0% of males and 97.0% of females in these age groups living above the poverty line.
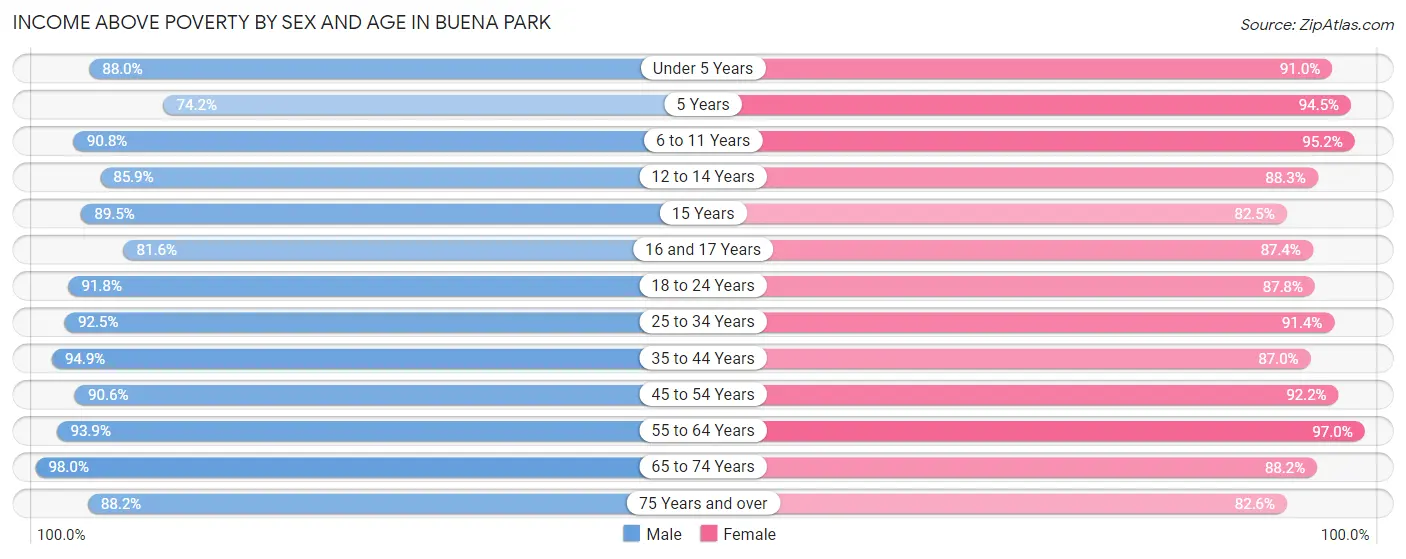
| Age Bracket | Male | Female |
| Under 5 Years | 2,135 (88.0%) | 2,166 (91.0%) |
| 5 Years | 339 (74.2%) | 617 (94.5%) |
| 6 to 11 Years | 2,917 (90.8%) | 2,737 (95.2%) |
| 12 to 14 Years | 1,479 (85.9%) | 1,818 (88.3%) |
| 15 Years | 517 (89.4%) | 312 (82.5%) |
| 16 and 17 Years | 710 (81.6%) | 527 (87.4%) |
| 18 to 24 Years | 3,901 (91.8%) | 3,189 (87.8%) |
| 25 to 34 Years | 6,188 (92.5%) | 5,873 (91.4%) |
| 35 to 44 Years | 5,757 (94.9%) | 4,829 (87.0%) |
| 45 to 54 Years | 4,245 (90.6%) | 4,609 (92.2%) |
| 55 to 64 Years | 5,238 (93.9%) | 5,544 (97.0%) |
| 65 to 74 Years | 3,236 (98.0%) | 3,123 (88.2%) |
| 75 Years and over | 1,620 (88.2%) | 2,146 (82.6%) |
| Total | 38,282 (91.9%) | 37,490 (90.5%) |
Income Below Poverty Among Married-Couple Families in Buena Park
The poverty statistics for married-couple families in Buena Park show that 5.0% or 721 of the total 14,333 families live below the poverty line. Families with 1 or 2 children have the highest poverty rate of 6.7%, comprising of 324 families. On the other hand, families with 5 or more children have the lowest poverty rate of 0.0%, which includes 0 families.
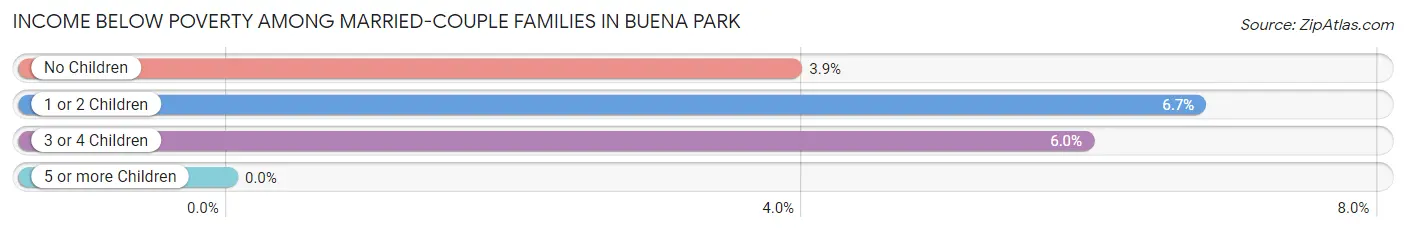
| Children | Above Poverty | Below Poverty |
| No Children | 7,925 (96.1%) | 324 (3.9%) |
| 1 or 2 Children | 4,480 (93.3%) | 324 (6.7%) |
| 3 or 4 Children | 1,151 (94.0%) | 73 (6.0%) |
| 5 or more Children | 56 (100.0%) | 0 (0.0%) |
| Total | 13,612 (95.0%) | 721 (5.0%) |
Income Below Poverty Among Single-Parent Households in Buena Park
According to the poverty data in Buena Park, 2.9% or 58 single-father households and 12.6% or 448 single-mother households are living below the poverty line. Among single-father households, those with 1 or 2 children have the highest poverty rate, with 28 households (3.7%) experiencing poverty. Likewise, among single-mother households, those with 3 or 4 children have the highest poverty rate, with 116 households (38.3%) falling below the poverty line.
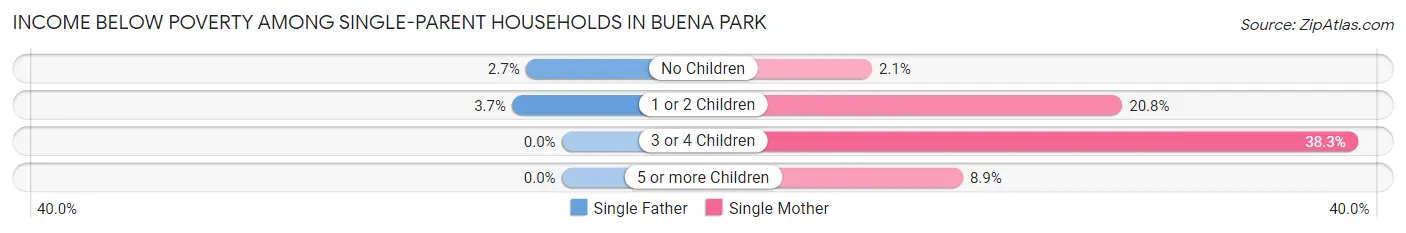
| Children | Single Father | Single Mother |
| No Children | 30 (2.7%) | 37 (2.1%) |
| 1 or 2 Children | 28 (3.7%) | 283 (20.8%) |
| 3 or 4 Children | 0 (0.0%) | 116 (38.3%) |
| 5 or more Children | 0 (0.0%) | 12 (8.9%) |
| Total | 58 (2.9%) | 448 (12.6%) |
Income Below Poverty Among Married-Couple vs Single-Parent Households in Buena Park
The poverty data for Buena Park shows that 721 of the married-couple family households (5.0%) and 506 of the single-parent households (9.1%) are living below the poverty level. Within the married-couple family households, those with 1 or 2 children have the highest poverty rate, with 324 households (6.7%) falling below the poverty line. Among the single-parent households, those with 3 or 4 children have the highest poverty rate, with 116 household (29.6%) living below poverty.
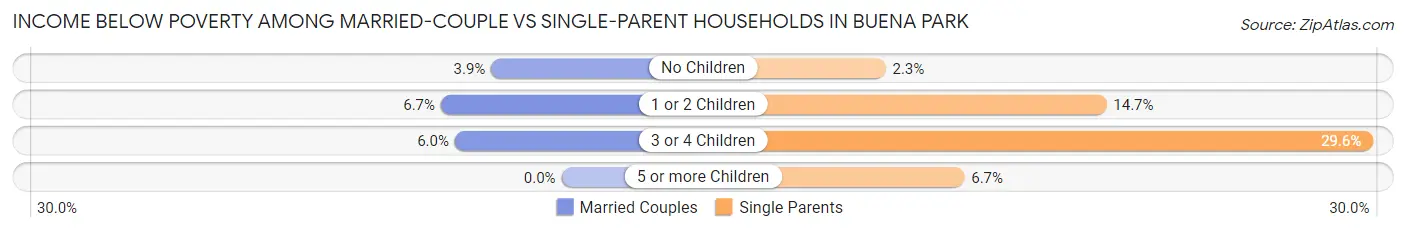
| Children | Married-Couple Families | Single-Parent Households |
| No Children | 324 (3.9%) | 67 (2.3%) |
| 1 or 2 Children | 324 (6.7%) | 311 (14.7%) |
| 3 or 4 Children | 73 (6.0%) | 116 (29.6%) |
| 5 or more Children | 0 (0.0%) | 12 (6.7%) |
| Total | 721 (5.0%) | 506 (9.1%) |
Race in Buena Park
The most populous races in Buena Park are Hispanic or Latino (33,448 | 40.0%), White / Caucasian (32,034 | 38.3%), and Asian (27,342 | 32.7%).
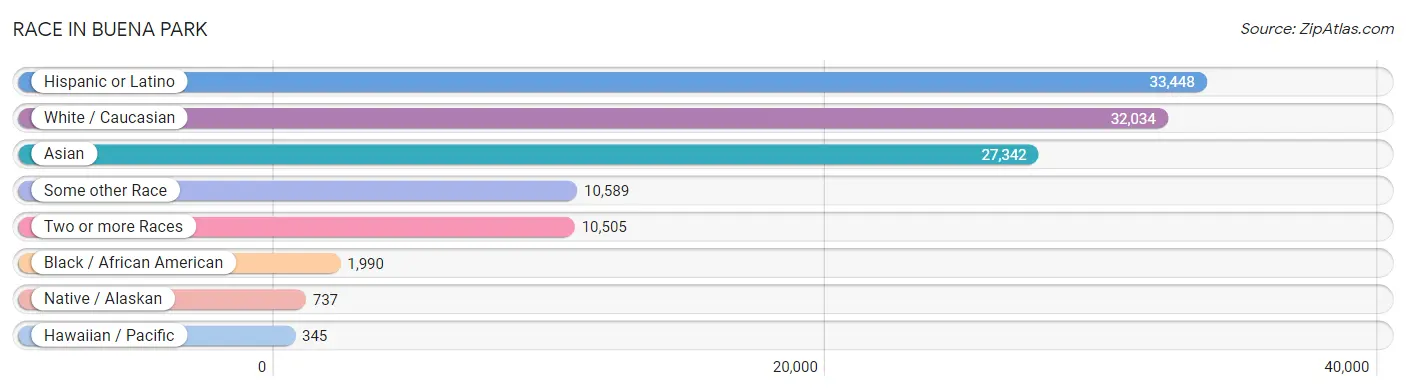
| Race | # Population | % Population |
| Asian | 27,342 | 32.7% |
| Black / African American | 1,990 | 2.4% |
| Hawaiian / Pacific | 345 | 0.4% |
| Hispanic or Latino | 33,448 | 40.0% |
| Native / Alaskan | 737 | 0.9% |
| White / Caucasian | 32,034 | 38.3% |
| Two or more Races | 10,505 | 12.6% |
| Some other Race | 10,589 | 12.7% |
| Total | 83,542 | 100.0% |
Ancestry in Buena Park
The most populous ancestries reported in Buena Park are Mexican (28,230 | 33.8%), Burmese (10,513 | 12.6%), Korean (8,354 | 10.0%), American (4,969 | 5.9%), and German (3,820 | 4.6%), together accounting for 66.9% of all Buena Park residents.
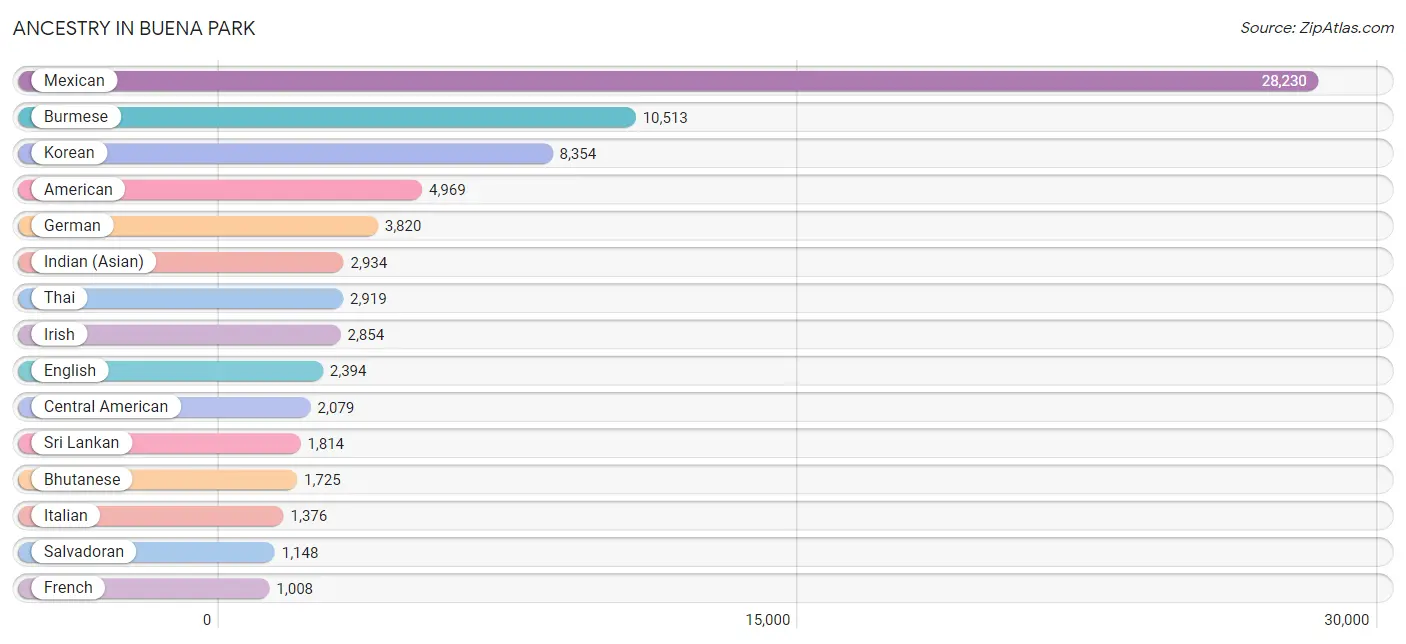
| Ancestry | # Population | % Population |
| African | 38 | 0.1% |
| American | 4,969 | 5.9% |
| Arab | 752 | 0.9% |
| Argentinean | 260 | 0.3% |
| Armenian | 25 | 0.0% |
| Austrian | 50 | 0.1% |
| Bangladeshi | 73 | 0.1% |
| Basque | 23 | 0.0% |
| Belgian | 19 | 0.0% |
| Bhutanese | 1,725 | 2.1% |
| Bolivian | 33 | 0.0% |
| Brazilian | 39 | 0.1% |
| British | 173 | 0.2% |
| Burmese | 10,513 | 12.6% |
| Cambodian | 86 | 0.1% |
| Canadian | 83 | 0.1% |
| Central American | 2,079 | 2.5% |
| Central American Indian | 127 | 0.2% |
| Cherokee | 99 | 0.1% |
| Chilean | 41 | 0.1% |
| Chippewa | 15 | 0.0% |
| Choctaw | 126 | 0.2% |
| Colombian | 188 | 0.2% |
| Costa Rican | 70 | 0.1% |
| Croatian | 63 | 0.1% |
| Cuban | 288 | 0.3% |
| Czech | 85 | 0.1% |
| Danish | 145 | 0.2% |
| Dutch | 630 | 0.7% |
| Eastern European | 27 | 0.0% |
| Ecuadorian | 46 | 0.1% |
| Egyptian | 71 | 0.1% |
| English | 2,394 | 2.9% |
| Ethiopian | 60 | 0.1% |
| European | 594 | 0.7% |
| Fijian | 9 | 0.0% |
| Filipino | 197 | 0.2% |
| Finnish | 62 | 0.1% |
| French | 1,008 | 1.2% |
| French Canadian | 400 | 0.5% |
| German | 3,820 | 4.6% |
| Ghanaian | 7 | 0.0% |
| Greek | 25 | 0.0% |
| Guamanian / Chamorro | 33 | 0.0% |
| Guatemalan | 664 | 0.8% |
| Honduran | 147 | 0.2% |
| Hopi | 30 | 0.0% |
| Hungarian | 15 | 0.0% |
| Icelander | 43 | 0.1% |
| Indian (Asian) | 2,934 | 3.5% |
| Indonesian | 16 | 0.0% |
| Iranian | 39 | 0.1% |
| Irish | 2,854 | 3.4% |
| Italian | 1,376 | 1.7% |
| Jamaican | 11 | 0.0% |
| Japanese | 964 | 1.1% |
| Jordanian | 153 | 0.2% |
| Korean | 8,354 | 10.0% |
| Laotian | 83 | 0.1% |
| Lebanese | 7 | 0.0% |
| Lithuanian | 50 | 0.1% |
| Malaysian | 204 | 0.2% |
| Mexican | 28,230 | 33.8% |
| Mexican American Indian | 496 | 0.6% |
| Mongolian | 64 | 0.1% |
| Moroccan | 47 | 0.1% |
| Native Hawaiian | 274 | 0.3% |
| Navajo | 24 | 0.0% |
| Nicaraguan | 47 | 0.1% |
| Nigerian | 42 | 0.1% |
| Northern European | 32 | 0.0% |
| Norwegian | 249 | 0.3% |
| Pakistani | 151 | 0.2% |
| Palestinian | 63 | 0.1% |
| Panamanian | 3 | 0.0% |
| Peruvian | 401 | 0.5% |
| Polish | 268 | 0.3% |
| Portuguese | 163 | 0.2% |
| Pueblo | 113 | 0.1% |
| Puerto Rican | 564 | 0.7% |
| Romanian | 331 | 0.4% |
| Russian | 116 | 0.1% |
| Salvadoran | 1,148 | 1.4% |
| Samoan | 89 | 0.1% |
| Scandinavian | 47 | 0.1% |
| Scotch-Irish | 171 | 0.2% |
| Scottish | 426 | 0.5% |
| Sioux | 8 | 0.0% |
| Slovene | 27 | 0.0% |
| South African | 55 | 0.1% |
| South American | 978 | 1.2% |
| Spaniard | 231 | 0.3% |
| Spanish | 333 | 0.4% |
| Sri Lankan | 1,814 | 2.2% |
| Subsaharan African | 202 | 0.2% |
| Swedish | 594 | 0.7% |
| Swiss | 58 | 0.1% |
| Syrian | 86 | 0.1% |
| Thai | 2,919 | 3.5% |
| Tohono O'Odham | 17 | 0.0% |
| Tongan | 194 | 0.2% |
| Ukrainian | 14 | 0.0% |
| Vietnamese | 39 | 0.1% |
| Welsh | 145 | 0.2% |
| West Indian | 24 | 0.0% |
| Yaqui | 69 | 0.1% |
| Yugoslavian | 38 | 0.1% | View All 107 Rows |
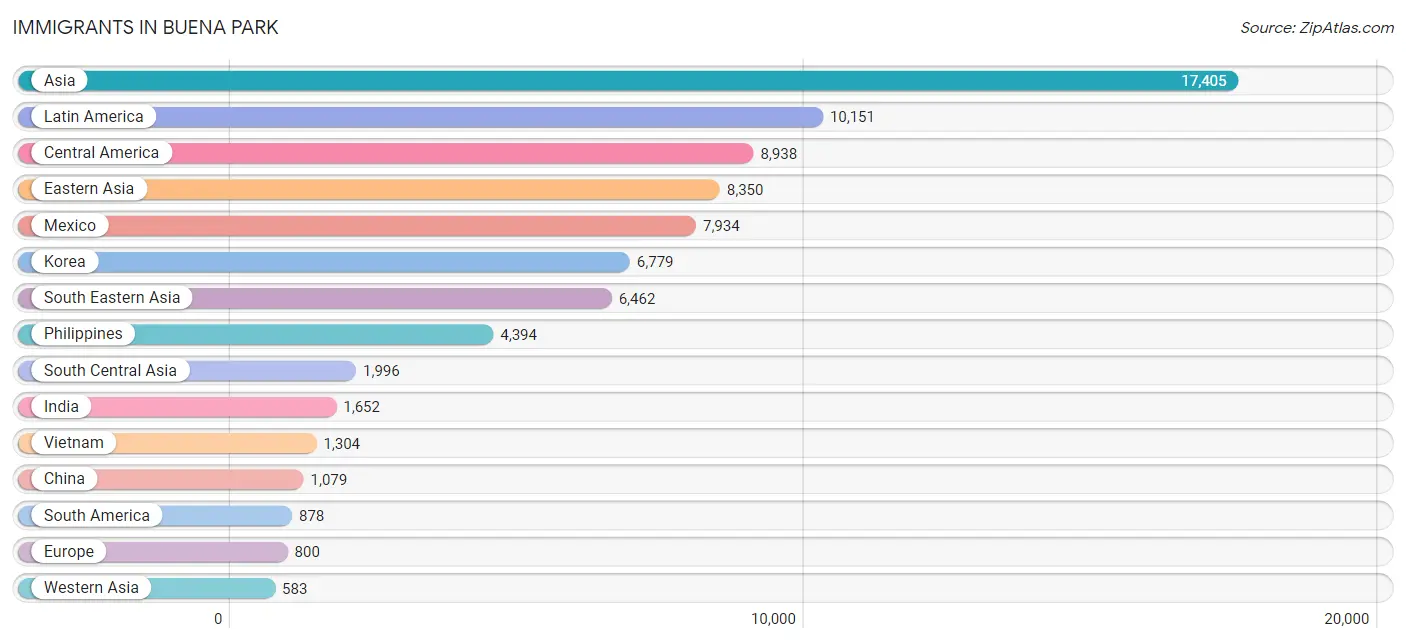
Immigrants in Buena Park
The most numerous immigrant groups reported in Buena Park came from Asia (17,405 | 20.8%), Latin America (10,151 | 12.1%), Central America (8,938 | 10.7%), Eastern Asia (8,350 | 10.0%), and Mexico (7,934 | 9.5%), together accounting for 63.2% of all Buena Park residents.
| Immigration Origin | # Population | % Population |
| Africa | 418 | 0.5% |
| Argentina | 139 | 0.2% |
| Asia | 17,405 | 20.8% |
| Bangladesh | 61 | 0.1% |
| Bolivia | 49 | 0.1% |
| Brazil | 37 | 0.0% |
| Cambodia | 325 | 0.4% |
| Canada | 191 | 0.2% |
| Caribbean | 335 | 0.4% |
| Central America | 8,938 | 10.7% |
| Chile | 18 | 0.0% |
| China | 1,079 | 1.3% |
| Colombia | 127 | 0.2% |
| Costa Rica | 89 | 0.1% |
| Cuba | 43 | 0.1% |
| Eastern Africa | 217 | 0.3% |
| Eastern Asia | 8,350 | 10.0% |
| Eastern Europe | 187 | 0.2% |
| Ecuador | 46 | 0.1% |
| Egypt | 59 | 0.1% |
| El Salvador | 341 | 0.4% |
| England | 65 | 0.1% |
| Ethiopia | 148 | 0.2% |
| Europe | 800 | 1.0% |
| Fiji | 61 | 0.1% |
| France | 40 | 0.1% |
| Germany | 124 | 0.2% |
| Ghana | 7 | 0.0% |
| Guatemala | 259 | 0.3% |
| Guyana | 27 | 0.0% |
| Honduras | 207 | 0.3% |
| Hong Kong | 81 | 0.1% |
| Hungary | 29 | 0.0% |
| India | 1,652 | 2.0% |
| Indonesia | 64 | 0.1% |
| Iran | 55 | 0.1% |
| Iraq | 18 | 0.0% |
| Ireland | 13 | 0.0% |
| Israel | 12 | 0.0% |
| Jamaica | 16 | 0.0% |
| Japan | 436 | 0.5% |
| Jordan | 317 | 0.4% |
| Kenya | 46 | 0.1% |
| Korea | 6,779 | 8.1% |
| Laos | 76 | 0.1% |
| Latin America | 10,151 | 12.1% |
| Malaysia | 63 | 0.1% |
| Mexico | 7,934 | 9.5% |
| Middle Africa | 22 | 0.0% |
| Morocco | 54 | 0.1% |
| Nepal | 15 | 0.0% |
| Netherlands | 77 | 0.1% |
| Nicaragua | 105 | 0.1% |
| Nigeria | 36 | 0.0% |
| Northern Africa | 113 | 0.1% |
| Northern Europe | 267 | 0.3% |
| Oceania | 120 | 0.1% |
| Pakistan | 178 | 0.2% |
| Panama | 3 | 0.0% |
| Peru | 426 | 0.5% |
| Philippines | 4,394 | 5.3% |
| Poland | 3 | 0.0% |
| Romania | 155 | 0.2% |
| Scotland | 18 | 0.0% |
| Sierra Leone | 17 | 0.0% |
| Singapore | 15 | 0.0% |
| South Africa | 6 | 0.0% |
| South America | 878 | 1.1% |
| South Central Asia | 1,996 | 2.4% |
| South Eastern Asia | 6,462 | 7.7% |
| Southern Europe | 92 | 0.1% |
| Spain | 92 | 0.1% |
| Sri Lanka | 35 | 0.0% |
| Switzerland | 13 | 0.0% |
| Syria | 86 | 0.1% |
| Taiwan | 578 | 0.7% |
| Thailand | 161 | 0.2% |
| Uruguay | 9 | 0.0% |
| Vietnam | 1,304 | 1.6% |
| West Indies | 276 | 0.3% |
| Western Africa | 60 | 0.1% |
| Western Asia | 583 | 0.7% |
| Western Europe | 254 | 0.3% |
| Zimbabwe | 23 | 0.0% | View All 84 Rows |
Sex and Age in Buena Park
Sex and Age in Buena Park
The most populous age groups in Buena Park are 30 to 34 Years (3,518 | 8.4%) for men and 30 to 34 Years (3,440 | 8.3%) for women.
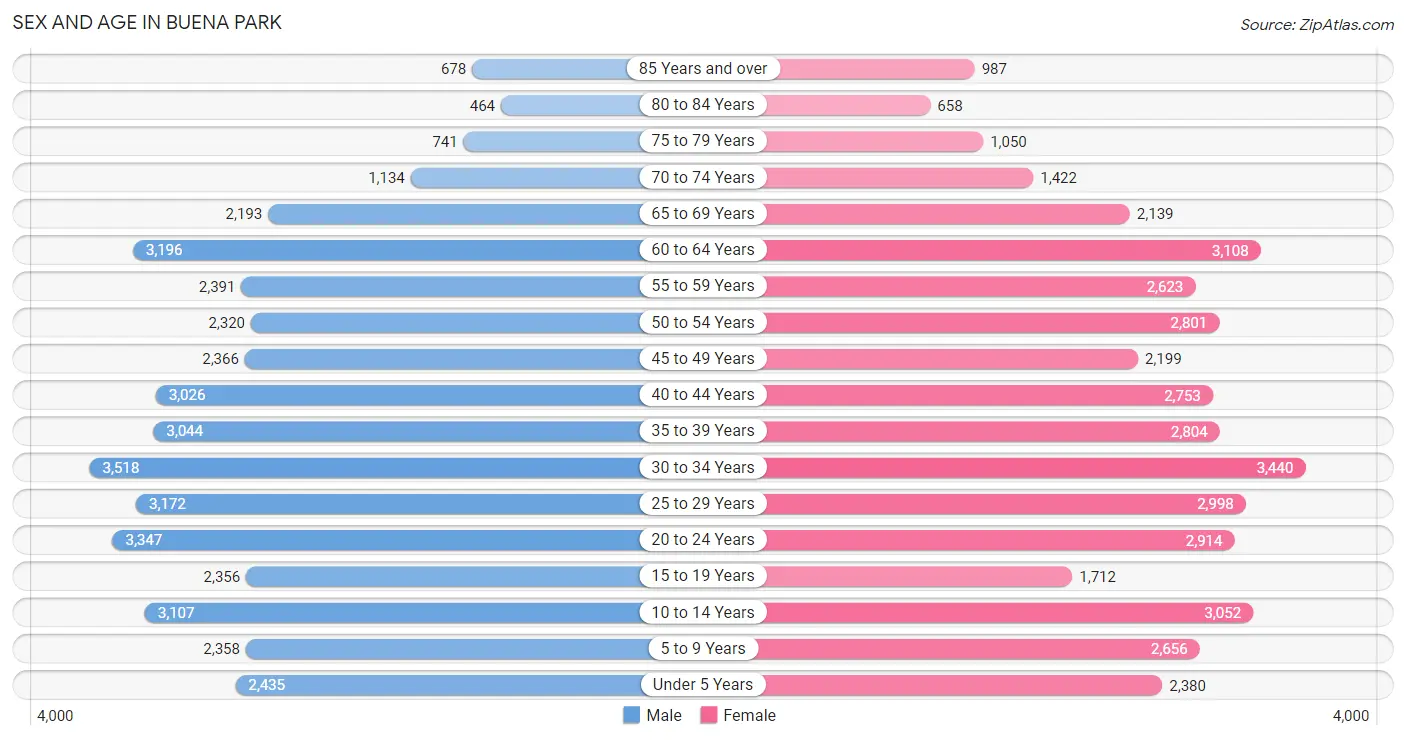
| Age Bracket | Male | Female |
| Under 5 Years | 2,435 (5.8%) | 2,380 (5.7%) |
| 5 to 9 Years | 2,358 (5.6%) | 2,656 (6.4%) |
| 10 to 14 Years | 3,107 (7.4%) | 3,052 (7.3%) |
| 15 to 19 Years | 2,356 (5.6%) | 1,712 (4.1%) |
| 20 to 24 Years | 3,347 (8.0%) | 2,914 (7.0%) |
| 25 to 29 Years | 3,172 (7.6%) | 2,998 (7.2%) |
| 30 to 34 Years | 3,518 (8.4%) | 3,440 (8.3%) |
| 35 to 39 Years | 3,044 (7.3%) | 2,804 (6.7%) |
| 40 to 44 Years | 3,026 (7.2%) | 2,753 (6.6%) |
| 45 to 49 Years | 2,366 (5.7%) | 2,199 (5.3%) |
| 50 to 54 Years | 2,320 (5.5%) | 2,801 (6.7%) |
| 55 to 59 Years | 2,391 (5.7%) | 2,623 (6.3%) |
| 60 to 64 Years | 3,196 (7.6%) | 3,108 (7.4%) |
| 65 to 69 Years | 2,193 (5.2%) | 2,139 (5.1%) |
| 70 to 74 Years | 1,134 (2.7%) | 1,422 (3.4%) |
| 75 to 79 Years | 741 (1.8%) | 1,050 (2.5%) |
| 80 to 84 Years | 464 (1.1%) | 658 (1.6%) |
| 85 Years and over | 678 (1.6%) | 987 (2.4%) |
| Total | 41,846 (100.0%) | 41,696 (100.0%) |
Families and Households in Buena Park
Median Family Size in Buena Park
The median family size in Buena Park is 3.66 persons per family, with married-couple families (14,333 | 72.1%) accounting for the largest median family size of 3.77 persons per family. On the other hand, single male/father families (2,009 | 10.1%) represent the smallest median family size with 3.03 persons per family.
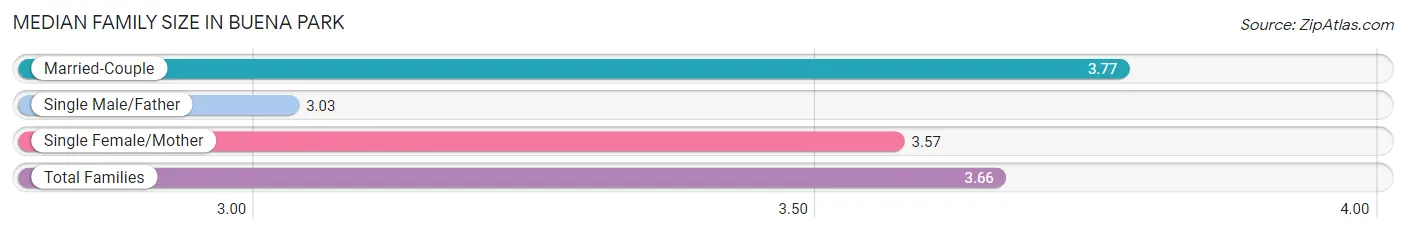
| Family Type | # Families | Family Size |
| Married-Couple | 14,333 (72.1%) | 3.77 |
| Single Male/Father | 2,009 (10.1%) | 3.03 |
| Single Female/Mother | 3,546 (17.8%) | 3.57 |
| Total Families | 19,888 (100.0%) | 3.66 |
Median Household Size in Buena Park
The median household size in Buena Park is 3.40 persons per household, with single female/mother households (3,546 | 14.6%) accounting for the largest median household size of 4 persons per household. non-family households (4,395 | 18.1%) represent the smallest median household size with 1.52 persons per household.
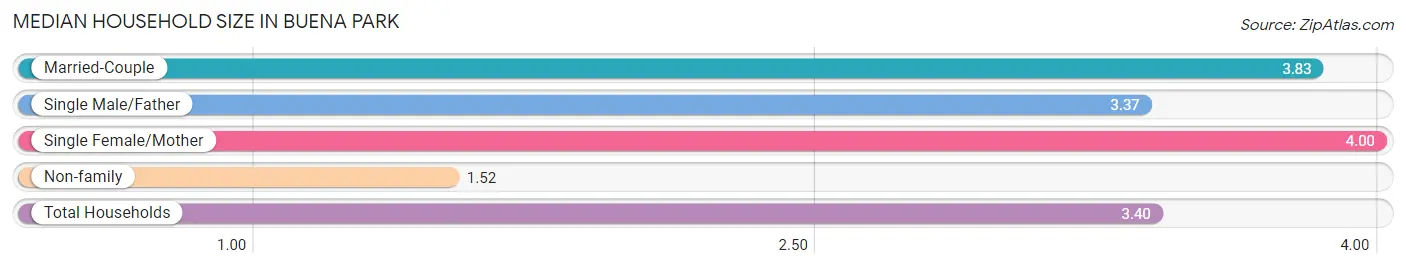
| Household Type | # Households | Household Size |
| Married-Couple | 14,333 (59.0%) | 3.83 |
| Single Male/Father | 2,009 (8.3%) | 3.37 |
| Single Female/Mother | 3,546 (14.6%) | 4.00 |
| Non-family | 4,395 (18.1%) | 1.52 |
| Total Households | 24,283 (100.0%) | 3.40 |
Household Size by Marriage Status in Buena Park
Out of a total of 24,283 households in Buena Park, 19,888 (81.9%) are family households, while 4,395 (18.1%) are nonfamily households. The most numerous type of family households are 2-person households, comprising 6,063, and the most common type of nonfamily households are 1-person households, comprising 2,915.
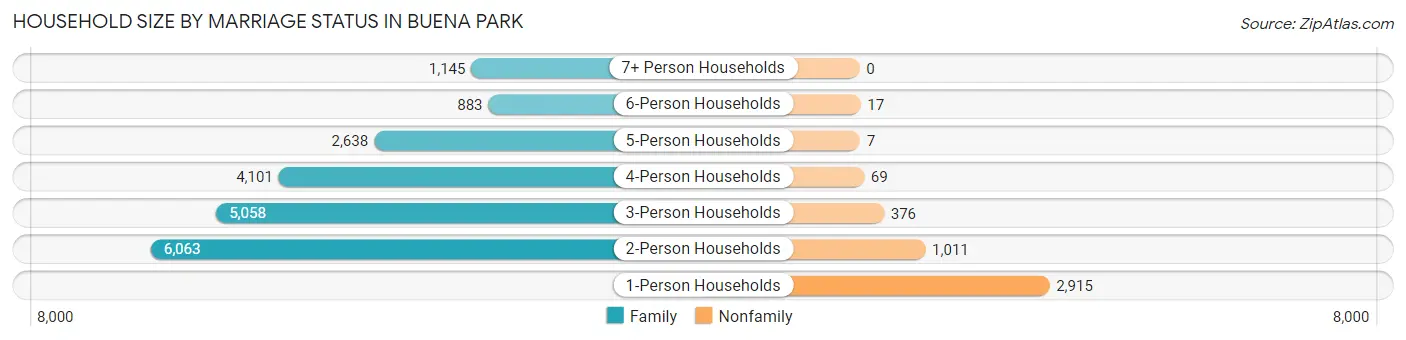
| Household Size | Family Households | Nonfamily Households |
| 1-Person Households | - | 2,915 (12.0%) |
| 2-Person Households | 6,063 (25.0%) | 1,011 (4.2%) |
| 3-Person Households | 5,058 (20.8%) | 376 (1.5%) |
| 4-Person Households | 4,101 (16.9%) | 69 (0.3%) |
| 5-Person Households | 2,638 (10.9%) | 7 (0.0%) |
| 6-Person Households | 883 (3.6%) | 17 (0.1%) |
| 7+ Person Households | 1,145 (4.7%) | 0 (0.0%) |
| Total | 19,888 (81.9%) | 4,395 (18.1%) |
Female Fertility in Buena Park
Fertility by Age in Buena Park
Average fertility rate in Buena Park is 50.0 births per 1,000 women. Women in the age bracket of 20 to 34 years have the highest fertility rate with 64.0 births per 1,000 women. Women in the age bracket of 20 to 34 years acount for 61.3% of all women with births.
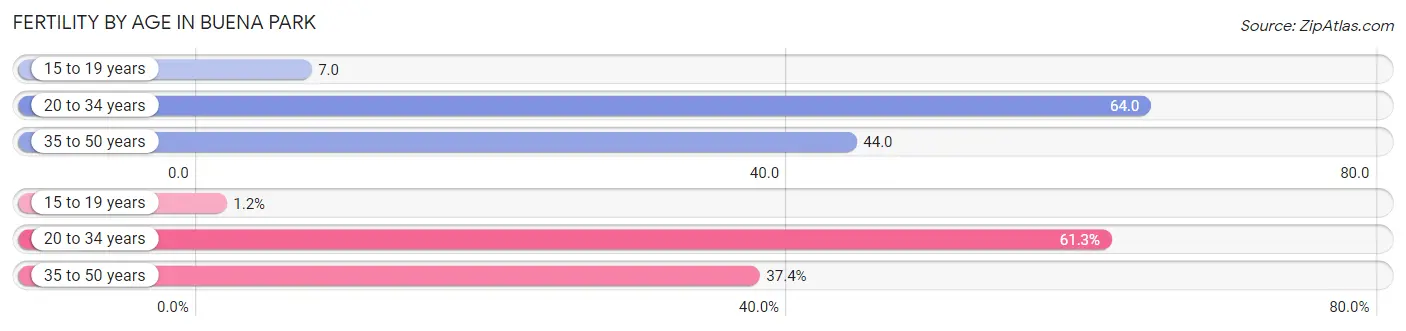
| Age Bracket | Women with Births | Births / 1,000 Women |
| 15 to 19 years | 12 (1.2%) | 7.0 |
| 20 to 34 years | 595 (61.3%) | 64.0 |
| 35 to 50 years | 363 (37.4%) | 44.0 |
| Total | 970 (100.0%) | 50.0 |
Fertility by Age by Marriage Status in Buena Park
79.3% of women with births (970) in Buena Park are married. The highest percentage of unmarried women with births falls into 15 to 19 years age bracket with 100.0% of them unmarried at the time of birth, while the lowest percentage of unmarried women with births belong to 35 to 50 years age bracket with 16.5% of them unmarried.
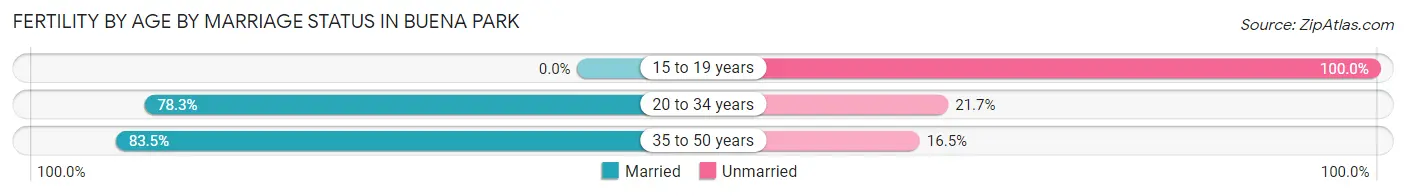
| Age Bracket | Married | Unmarried |
| 15 to 19 years | 0 (0.0%) | 12 (100.0%) |
| 20 to 34 years | 466 (78.3%) | 129 (21.7%) |
| 35 to 50 years | 303 (83.5%) | 60 (16.5%) |
| Total | 769 (79.3%) | 201 (20.7%) |
Fertility by Education in Buena Park
Average fertility rate in Buena Park is 50.0 births per 1,000 women. Women with the education attainment of graduate degree have the highest fertility rate of 71.0 births per 1,000 women, while women with the education attainment of less than high school have the lowest fertility at 30.0 births per 1,000 women. Women with the education attainment of college or associate's degree represent 28.8% of all women with births.
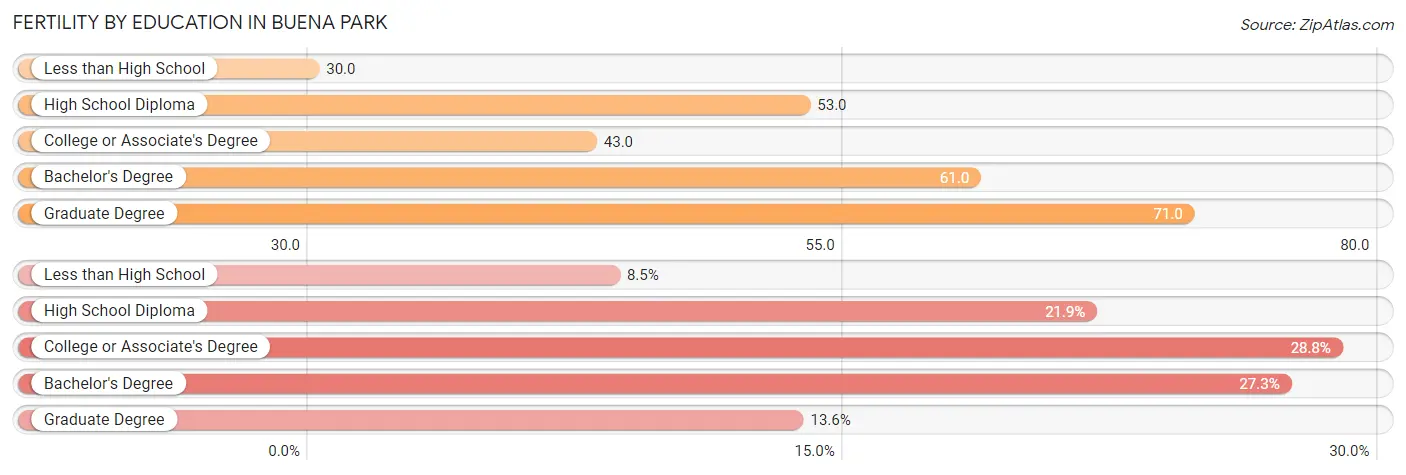
| Educational Attainment | Women with Births | Births / 1,000 Women |
| Less than High School | 82 (8.5%) | 30.0 |
| High School Diploma | 212 (21.9%) | 53.0 |
| College or Associate's Degree | 279 (28.8%) | 43.0 |
| Bachelor's Degree | 265 (27.3%) | 61.0 |
| Graduate Degree | 132 (13.6%) | 71.0 |
| Total | 970 (100.0%) | 50.0 |
Fertility by Education by Marriage Status in Buena Park
20.7% of women with births in Buena Park are unmarried. Women with the educational attainment of graduate degree are most likely to be married with 89.4% of them married at childbirth, while women with the educational attainment of high school diploma are least likely to be married with 42.9% of them unmarried at childbirth.
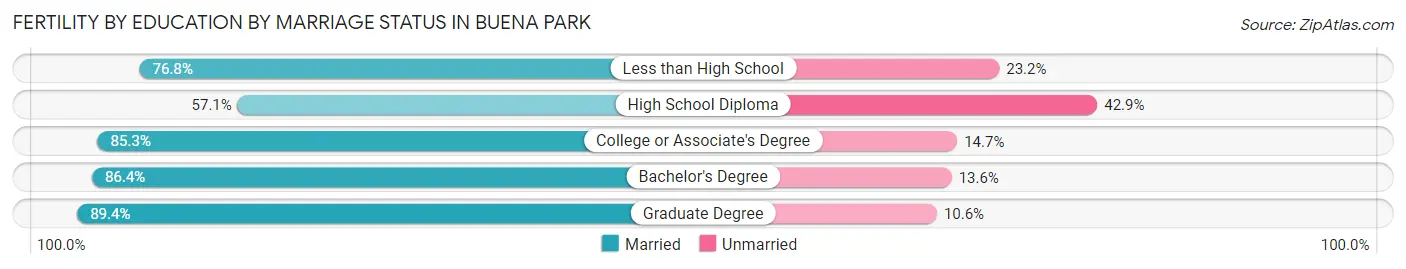
| Educational Attainment | Married | Unmarried |
| Less than High School | 63 (76.8%) | 19 (23.2%) |
| High School Diploma | 121 (57.1%) | 91 (42.9%) |
| College or Associate's Degree | 238 (85.3%) | 41 (14.7%) |
| Bachelor's Degree | 229 (86.4%) | 36 (13.6%) |
| Graduate Degree | 118 (89.4%) | 14 (10.6%) |
| Total | 769 (79.3%) | 201 (20.7%) |
Employment Characteristics in Buena Park
Employment by Class of Employer in Buena Park
Among the 41,952 employed individuals in Buena Park, private company employees (29,133 | 69.4%), local government employees (3,263 | 7.8%), and self-employed (not incorporated) (2,875 | 6.9%) make up the most common classes of employment.
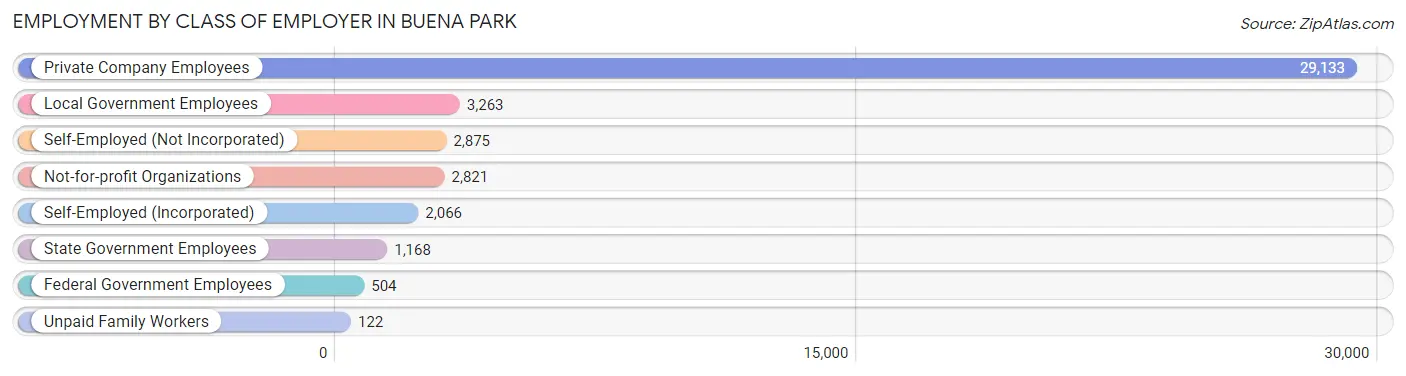
| Employer Class | # Employees | % Employees |
| Private Company Employees | 29,133 | 69.4% |
| Self-Employed (Incorporated) | 2,066 | 4.9% |
| Self-Employed (Not Incorporated) | 2,875 | 6.9% |
| Not-for-profit Organizations | 2,821 | 6.7% |
| Local Government Employees | 3,263 | 7.8% |
| State Government Employees | 1,168 | 2.8% |
| Federal Government Employees | 504 | 1.2% |
| Unpaid Family Workers | 122 | 0.3% |
| Total | 41,952 | 100.0% |
Employment Status by Age in Buena Park
According to the labor force statistics for Buena Park, out of the total population over 16 years of age (66,596), 69.0% or 45,951 individuals are in the labor force, with 5.4% or 2,481 of them unemployed. The age group with the highest labor force participation rate is 30 to 34 years, with 88.3% or 6,144 individuals in the labor force. Within the labor force, the 16 to 19 years age range has the highest percentage of unemployed individuals, with 13.5% or 140 of them being unemployed.
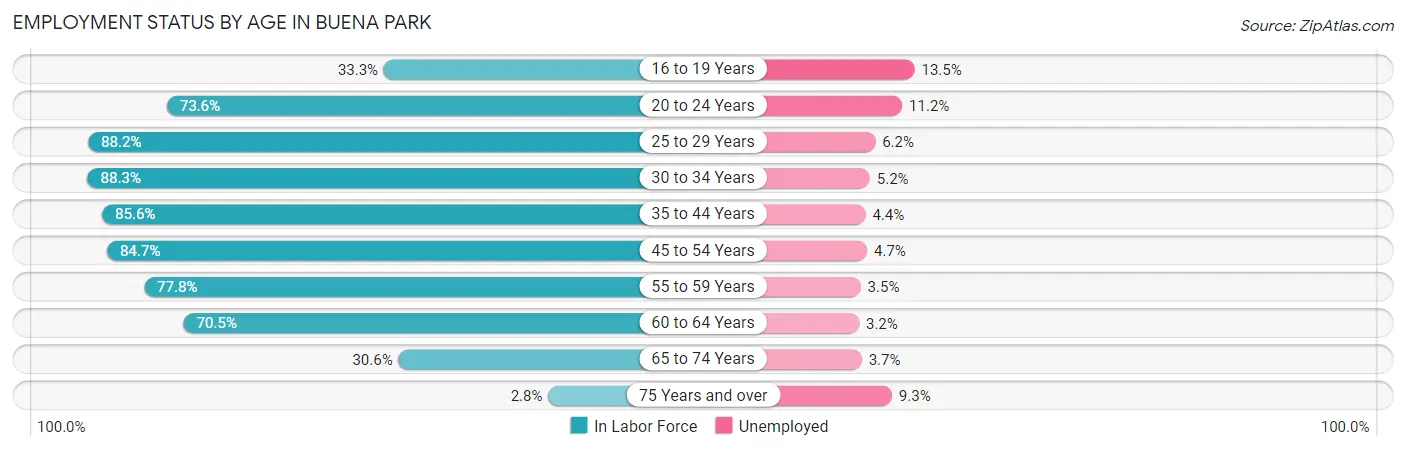
| Age Bracket | In Labor Force | Unemployed |
| 16 to 19 Years | 1,036 (33.3%) | 140 (13.5%) |
| 20 to 24 Years | 4,608 (73.6%) | 516 (11.2%) |
| 25 to 29 Years | 5,442 (88.2%) | 337 (6.2%) |
| 30 to 34 Years | 6,144 (88.3%) | 319 (5.2%) |
| 35 to 44 Years | 9,953 (85.6%) | 438 (4.4%) |
| 45 to 54 Years | 8,204 (84.7%) | 386 (4.7%) |
| 55 to 59 Years | 3,901 (77.8%) | 137 (3.5%) |
| 60 to 64 Years | 4,444 (70.5%) | 142 (3.2%) |
| 65 to 74 Years | 2,108 (30.6%) | 78 (3.7%) |
| 75 Years and over | 128 (2.8%) | 12 (9.3%) |
| Total | 45,951 (69.0%) | 2,481 (5.4%) |
Employment Status by Educational Attainment in Buena Park
According to labor force statistics for Buena Park, 83.2% of individuals (38,071) out of the total population between 25 and 64 years of age (45,759) are in the labor force, with 4.6% or 1,751 of them being unemployed. The group with the highest labor force participation rate are those with the educational attainment of bachelor's degree or higher, with 88.4% or 13,462 individuals in the labor force. Within the labor force, individuals with college / associate degree education have the highest percentage of unemployment, with 6.3% or 819 of them being unemployed.
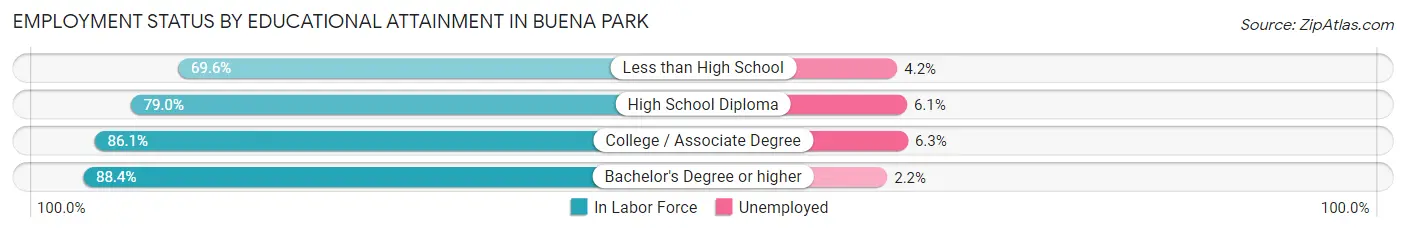
| Educational Attainment | In Labor Force | Unemployed |
| Less than High School | 4,197 (69.6%) | 253 (4.2%) |
| High School Diploma | 7,433 (79.0%) | 574 (6.1%) |
| College / Associate Degree | 12,993 (86.1%) | 951 (6.3%) |
| Bachelor's Degree or higher | 13,462 (88.4%) | 335 (2.2%) |
| Total | 38,071 (83.2%) | 2,105 (4.6%) |
Employment Occupations by Sex in Buena Park
Management, Business, Science and Arts Occupations
The most common Management, Business, Science and Arts occupations in Buena Park are Community & Social Service (4,665 | 10.7%), Management (3,800 | 8.7%), Health Diagnosing & Treating (3,201 | 7.4%), Business & Financial (2,965 | 6.8%), and Computers, Engineering & Science (2,542 | 5.9%).
Management, Business, Science and Arts Occupations by Sex
Within the Management, Business, Science and Arts occupations in Buena Park, the most male-oriented occupations are Architecture & Engineering (83.5%), Computers & Mathematics (75.1%), and Computers, Engineering & Science (74.2%), while the most female-oriented occupations are Health Technologists (70.8%), Legal Services & Support (70.4%), and Health Diagnosing & Treating (69.9%).
| Occupation | Male | Female |
| Management | 2,081 (54.8%) | 1,719 (45.2%) |
| Business & Financial | 1,322 (44.6%) | 1,643 (55.4%) |
| Computers, Engineering & Science | 1,887 (74.2%) | 655 (25.8%) |
| Computers & Mathematics | 824 (75.1%) | 273 (24.9%) |
| Architecture & Engineering | 947 (83.5%) | 187 (16.5%) |
| Life, Physical & Social Science | 116 (37.3%) | 195 (62.7%) |
| Community & Social Service | 1,833 (39.3%) | 2,832 (60.7%) |
| Education, Arts & Media | 273 (33.1%) | 553 (66.9%) |
| Legal Services & Support | 98 (29.6%) | 233 (70.4%) |
| Education Instruction & Library | 741 (33.3%) | 1,483 (66.7%) |
| Arts, Media & Entertainment | 721 (56.1%) | 563 (43.9%) |
| Health Diagnosing & Treating | 965 (30.1%) | 2,236 (69.9%) |
| Health Technologists | 598 (29.2%) | 1,450 (70.8%) |
| Total (Category) | 8,088 (47.1%) | 9,085 (52.9%) |
| Total (Overall) | 23,409 (53.9%) | 20,031 (46.1%) |
Services Occupations
The most common Services occupations in Buena Park are Food Preparation & Serving (2,391 | 5.5%), Healthcare Support (1,860 | 4.3%), Personal Care & Service (1,456 | 3.4%), Cleaning & Maintenance (1,200 | 2.8%), and Security & Protection (669 | 1.5%).
Services Occupations by Sex
Within the Services occupations in Buena Park, the most male-oriented occupations are Firefighting & Prevention (86.7%), Security & Protection (81.5%), and Law Enforcement (69.0%), while the most female-oriented occupations are Healthcare Support (71.3%), Personal Care & Service (69.0%), and Food Preparation & Serving (46.0%).
| Occupation | Male | Female |
| Healthcare Support | 534 (28.7%) | 1,326 (71.3%) |
| Security & Protection | 545 (81.5%) | 124 (18.5%) |
| Firefighting & Prevention | 409 (86.7%) | 63 (13.4%) |
| Law Enforcement | 136 (69.0%) | 61 (31.0%) |
| Food Preparation & Serving | 1,291 (54.0%) | 1,100 (46.0%) |
| Cleaning & Maintenance | 818 (68.2%) | 382 (31.8%) |
| Personal Care & Service | 452 (31.0%) | 1,004 (69.0%) |
| Total (Category) | 3,640 (48.0%) | 3,936 (51.9%) |
| Total (Overall) | 23,409 (53.9%) | 20,031 (46.1%) |
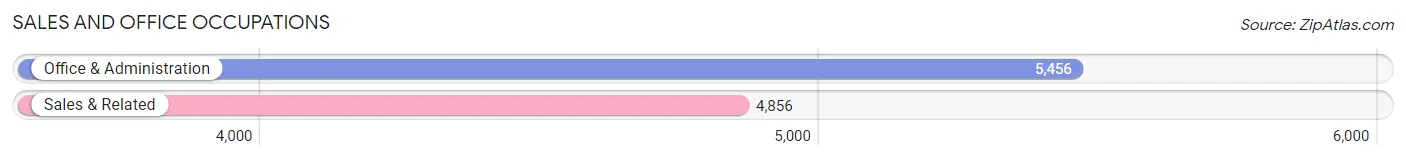
Sales and Office Occupations
The most common Sales and Office occupations in Buena Park are Office & Administration (5,456 | 12.6%), and Sales & Related (4,856 | 11.2%).
Sales and Office Occupations by Sex
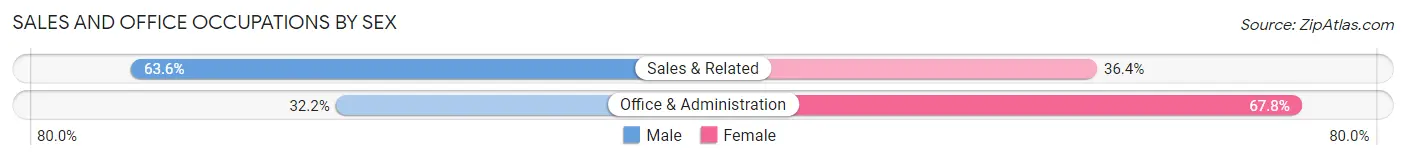
| Occupation | Male | Female |
| Sales & Related | 3,089 (63.6%) | 1,767 (36.4%) |
| Office & Administration | 1,755 (32.2%) | 3,701 (67.8%) |
| Total (Category) | 4,844 (47.0%) | 5,468 (53.0%) |
| Total (Overall) | 23,409 (53.9%) | 20,031 (46.1%) |
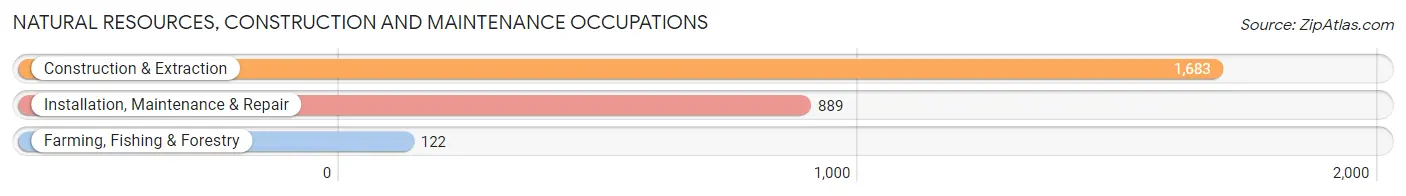
Natural Resources, Construction and Maintenance Occupations
The most common Natural Resources, Construction and Maintenance occupations in Buena Park are Construction & Extraction (1,683 | 3.9%), Installation, Maintenance & Repair (889 | 2.1%), and Farming, Fishing & Forestry (122 | 0.3%).
Natural Resources, Construction and Maintenance Occupations by Sex
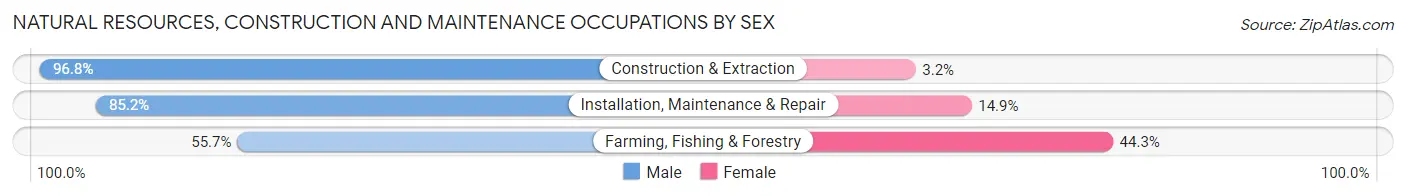
| Occupation | Male | Female |
| Farming, Fishing & Forestry | 68 (55.7%) | 54 (44.3%) |
| Construction & Extraction | 1,629 (96.8%) | 54 (3.2%) |
| Installation, Maintenance & Repair | 757 (85.2%) | 132 (14.8%) |
| Total (Category) | 2,454 (91.1%) | 240 (8.9%) |
| Total (Overall) | 23,409 (53.9%) | 20,031 (46.1%) |
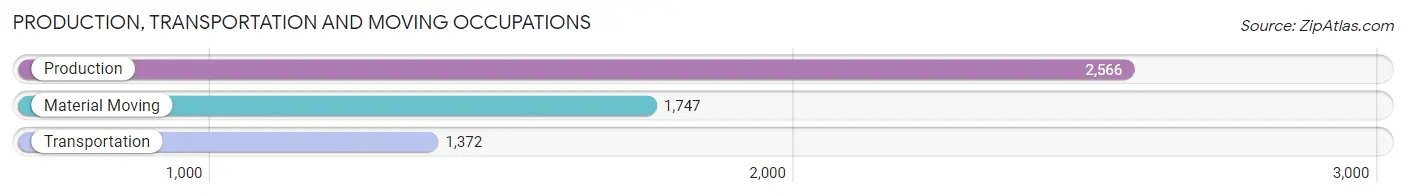
Production, Transportation and Moving Occupations
The most common Production, Transportation and Moving occupations in Buena Park are Production (2,566 | 5.9%), Material Moving (1,747 | 4.0%), and Transportation (1,372 | 3.2%).
Production, Transportation and Moving Occupations by Sex
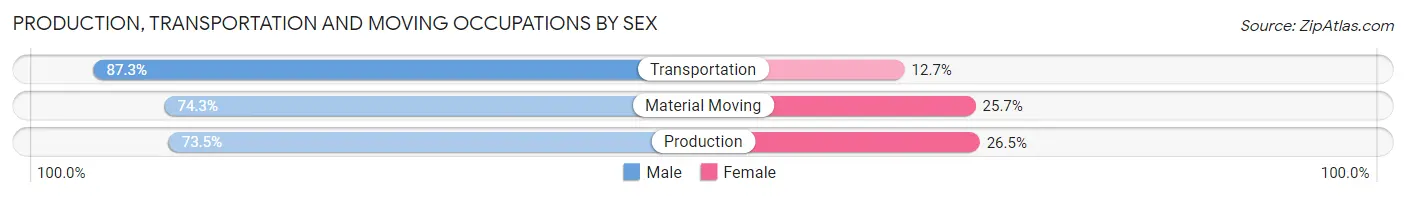
| Occupation | Male | Female |
| Production | 1,887 (73.5%) | 679 (26.5%) |
| Transportation | 1,198 (87.3%) | 174 (12.7%) |
| Material Moving | 1,298 (74.3%) | 449 (25.7%) |
| Total (Category) | 4,383 (77.1%) | 1,302 (22.9%) |
| Total (Overall) | 23,409 (53.9%) | 20,031 (46.1%) |
Employment Industries by Sex in Buena Park
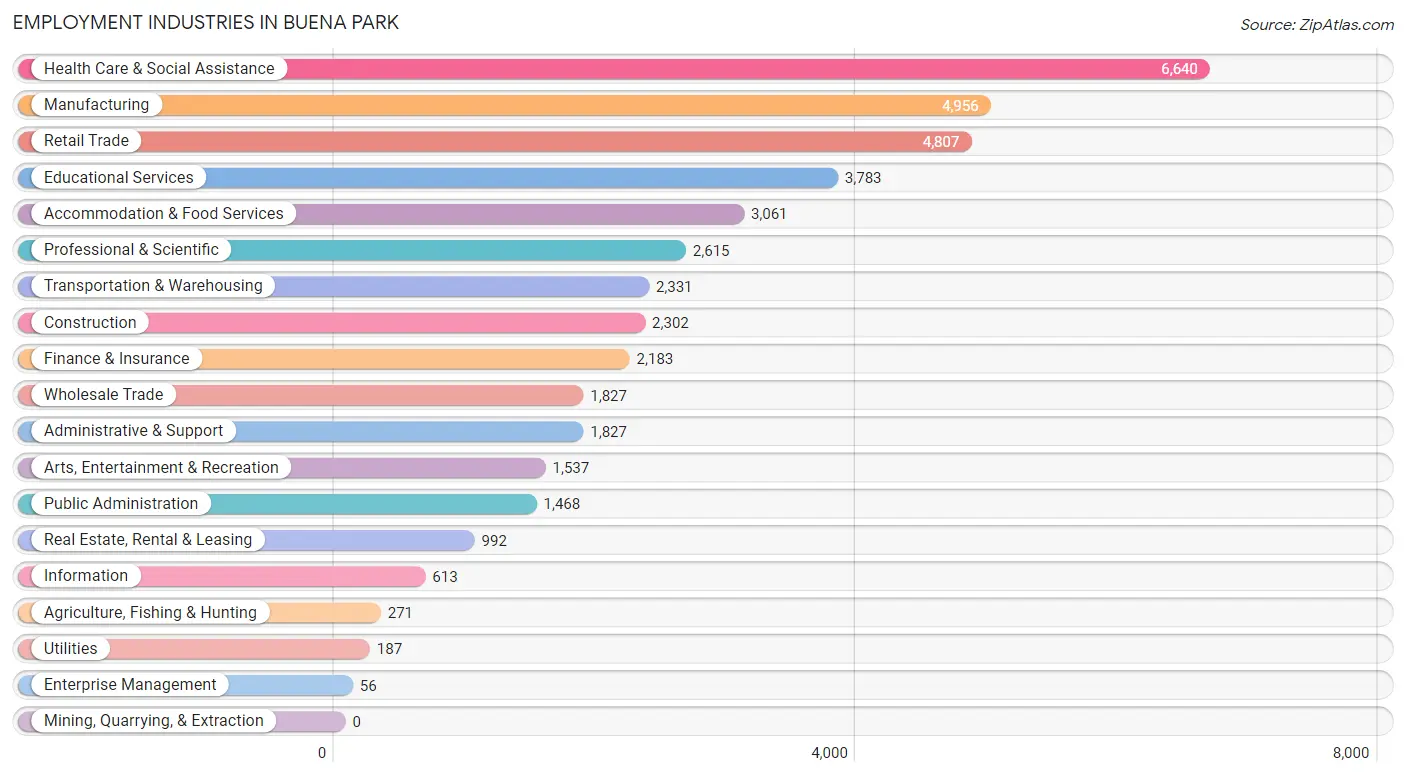
Employment Industries in Buena Park
The major employment industries in Buena Park include Health Care & Social Assistance (6,640 | 15.3%), Manufacturing (4,956 | 11.4%), Retail Trade (4,807 | 11.1%), Educational Services (3,783 | 8.7%), and Accommodation & Food Services (3,061 | 7.0%).
Employment Industries by Sex in Buena Park
The Buena Park industries that see more men than women are Utilities (100.0%), Construction (86.8%), and Agriculture, Fishing & Hunting (80.1%), whereas the industries that tend to have a higher number of women are Enterprise Management (87.5%), Health Care & Social Assistance (69.4%), and Educational Services (64.7%).
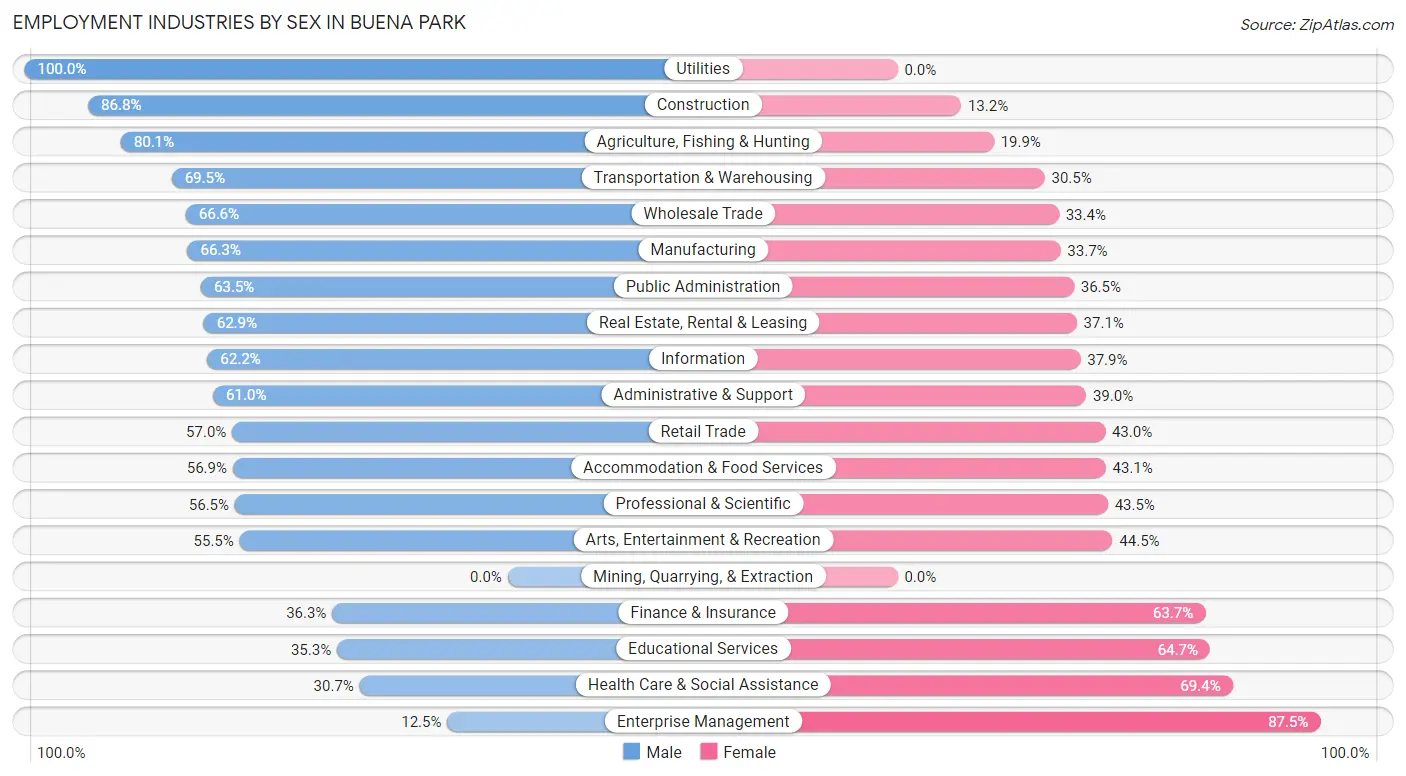
| Industry | Male | Female |
| Agriculture, Fishing & Hunting | 217 (80.1%) | 54 (19.9%) |
| Mining, Quarrying, & Extraction | 0 (0.0%) | 0 (0.0%) |
| Construction | 1,999 (86.8%) | 303 (13.2%) |
| Manufacturing | 3,284 (66.3%) | 1,672 (33.7%) |
| Wholesale Trade | 1,217 (66.6%) | 610 (33.4%) |
| Retail Trade | 2,742 (57.0%) | 2,065 (43.0%) |
| Transportation & Warehousing | 1,621 (69.5%) | 710 (30.5%) |
| Utilities | 187 (100.0%) | 0 (0.0%) |
| Information | 381 (62.2%) | 232 (37.9%) |
| Finance & Insurance | 793 (36.3%) | 1,390 (63.7%) |
| Real Estate, Rental & Leasing | 624 (62.9%) | 368 (37.1%) |
| Professional & Scientific | 1,477 (56.5%) | 1,138 (43.5%) |
| Enterprise Management | 7 (12.5%) | 49 (87.5%) |
| Administrative & Support | 1,114 (61.0%) | 713 (39.0%) |
| Educational Services | 1,337 (35.3%) | 2,446 (64.7%) |
| Health Care & Social Assistance | 2,035 (30.6%) | 4,605 (69.4%) |
| Arts, Entertainment & Recreation | 853 (55.5%) | 684 (44.5%) |
| Accommodation & Food Services | 1,742 (56.9%) | 1,319 (43.1%) |
| Public Administration | 932 (63.5%) | 536 (36.5%) |
| Total | 23,409 (53.9%) | 20,031 (46.1%) |
Education in Buena Park
School Enrollment in Buena Park
The most common levels of schooling among the 21,977 students in Buena Park are college / undergraduate (6,218 | 28.3%), middle school (4,571 | 20.8%), and elementary school (4,126 | 18.8%).
| School Level | # Students | % Students |
| Nursery / Preschool | 1,237 | 5.6% |
| Kindergarten | 1,034 | 4.7% |
| Elementary School | 4,126 | 18.8% |
| Middle School | 4,571 | 20.8% |
| High School | 3,678 | 16.7% |
| College / Undergraduate | 6,218 | 28.3% |
| Graduate / Professional | 1,113 | 5.1% |
| Total | 21,977 | 100.0% |
School Enrollment by Age by Funding Source in Buena Park
Out of a total of 21,977 students who are enrolled in schools in Buena Park, 2,967 (13.5%) attend a private institution, while the remaining 19,010 (86.5%) are enrolled in public schools. The age group of 3 to 4 year olds has the highest likelihood of being enrolled in private schools, with 508 (46.2% in the age bracket) enrolled. Conversely, the age group of 15 to 17 year olds has the lowest likelihood of being enrolled in a private school, with 2,320 (96.4% in the age bracket) attending a public institution.
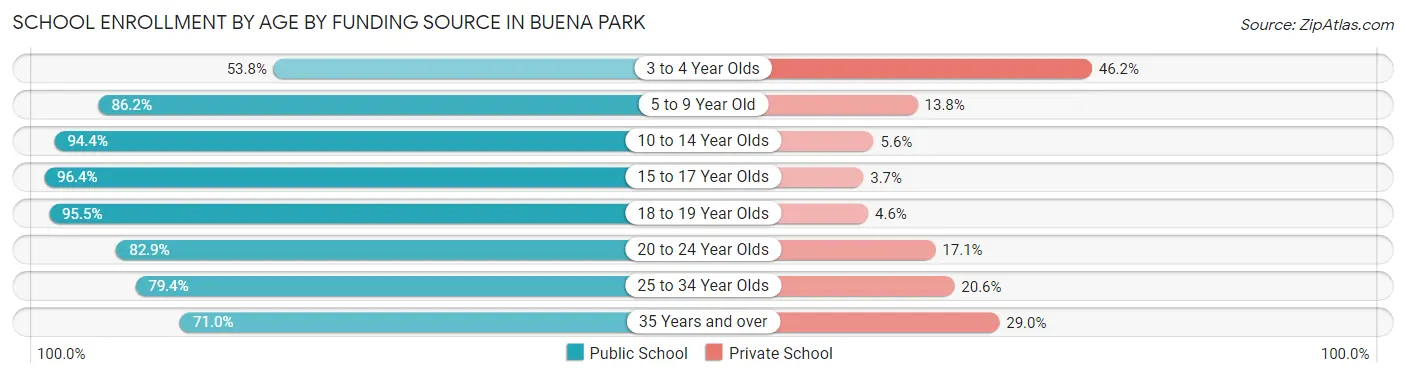
| Age Bracket | Public School | Private School |
| 3 to 4 Year Olds | 591 (53.8%) | 508 (46.2%) |
| 5 to 9 Year Old | 3,913 (86.2%) | 625 (13.8%) |
| 10 to 14 Year Olds | 5,647 (94.4%) | 333 (5.6%) |
| 15 to 17 Year Olds | 2,320 (96.4%) | 88 (3.6%) |
| 18 to 19 Year Olds | 1,321 (95.5%) | 63 (4.5%) |
| 20 to 24 Year Olds | 2,751 (82.9%) | 567 (17.1%) |
| 25 to 34 Year Olds | 1,528 (79.4%) | 397 (20.6%) |
| 35 Years and over | 941 (71.0%) | 384 (29.0%) |
| Total | 19,010 (86.5%) | 2,967 (13.5%) |
Educational Attainment by Field of Study in Buena Park
Business (3,744 | 19.7%), science & technology (2,008 | 10.6%), engineering (2,006 | 10.6%), social sciences (1,678 | 8.8%), and education (1,335 | 7.0%) are the most common fields of study among 19,004 individuals in Buena Park who have obtained a bachelor's degree or higher.
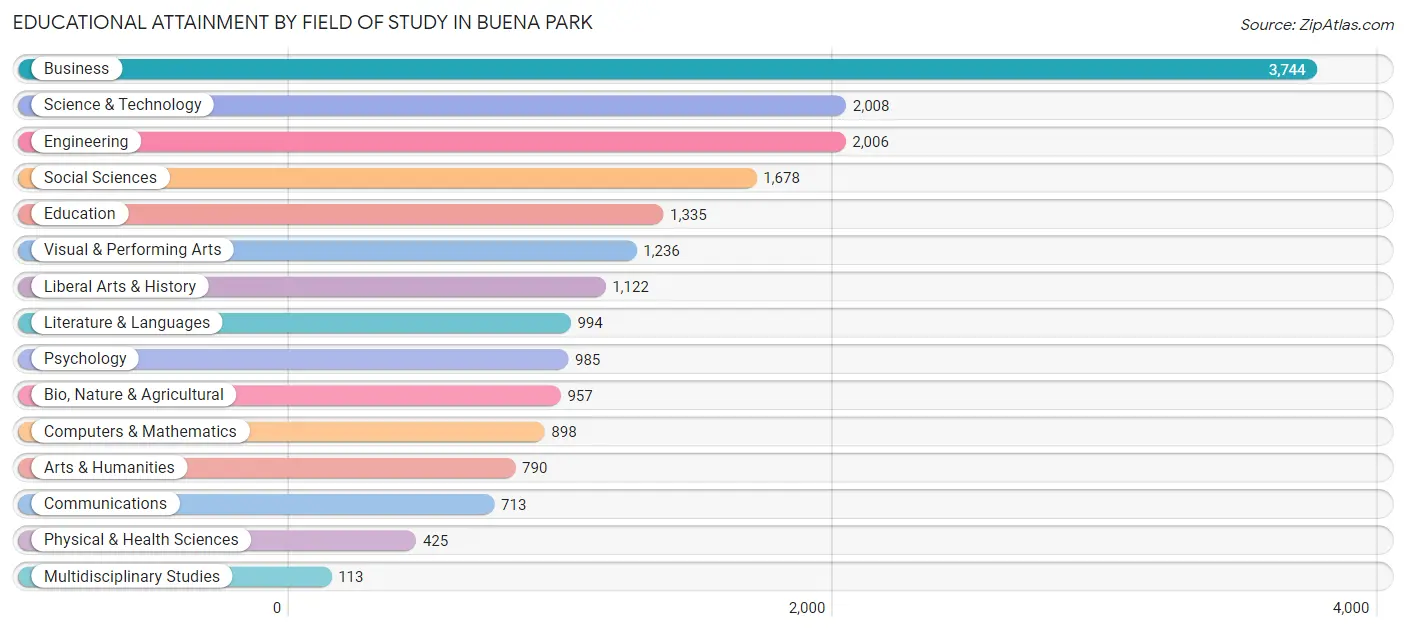
| Field of Study | # Graduates | % Graduates |
| Computers & Mathematics | 898 | 4.7% |
| Bio, Nature & Agricultural | 957 | 5.0% |
| Physical & Health Sciences | 425 | 2.2% |
| Psychology | 985 | 5.2% |
| Social Sciences | 1,678 | 8.8% |
| Engineering | 2,006 | 10.6% |
| Multidisciplinary Studies | 113 | 0.6% |
| Science & Technology | 2,008 | 10.6% |
| Business | 3,744 | 19.7% |
| Education | 1,335 | 7.0% |
| Literature & Languages | 994 | 5.2% |
| Liberal Arts & History | 1,122 | 5.9% |
| Visual & Performing Arts | 1,236 | 6.5% |
| Communications | 713 | 3.7% |
| Arts & Humanities | 790 | 4.2% |
| Total | 19,004 | 100.0% |
Transportation & Commute in Buena Park
Vehicle Availability by Sex in Buena Park
The most prevalent vehicle ownership categories in Buena Park are males with 2 vehicles (8,656, accounting for 38.2%) and females with 2 vehicles (6,291, making up 45.2%).
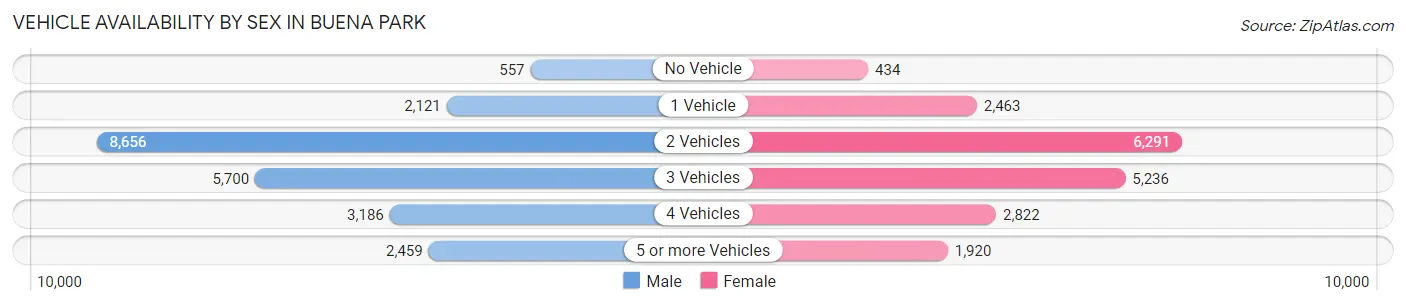
| Vehicles Available | Male | Female |
| No Vehicle | 557 (2.5%) | 434 (2.3%) |
| 1 Vehicle | 2,121 (9.3%) | 2,463 (12.9%) |
| 2 Vehicles | 8,656 (38.2%) | 6,291 (32.8%) |
| 3 Vehicles | 5,700 (25.1%) | 5,236 (27.3%) |
| 4 Vehicles | 3,186 (14.1%) | 2,822 (14.7%) |
| 5 or more Vehicles | 2,459 (10.8%) | 1,920 (10.0%) |
| Total | 22,679 (100.0%) | 19,166 (100.0%) |
Commute Time in Buena Park
The most frequently occuring commute durations in Buena Park are 30 to 34 minutes (7,130 commuters, 18.7%), 15 to 19 minutes (5,127 commuters, 13.4%), and 20 to 24 minutes (4,880 commuters, 12.8%).
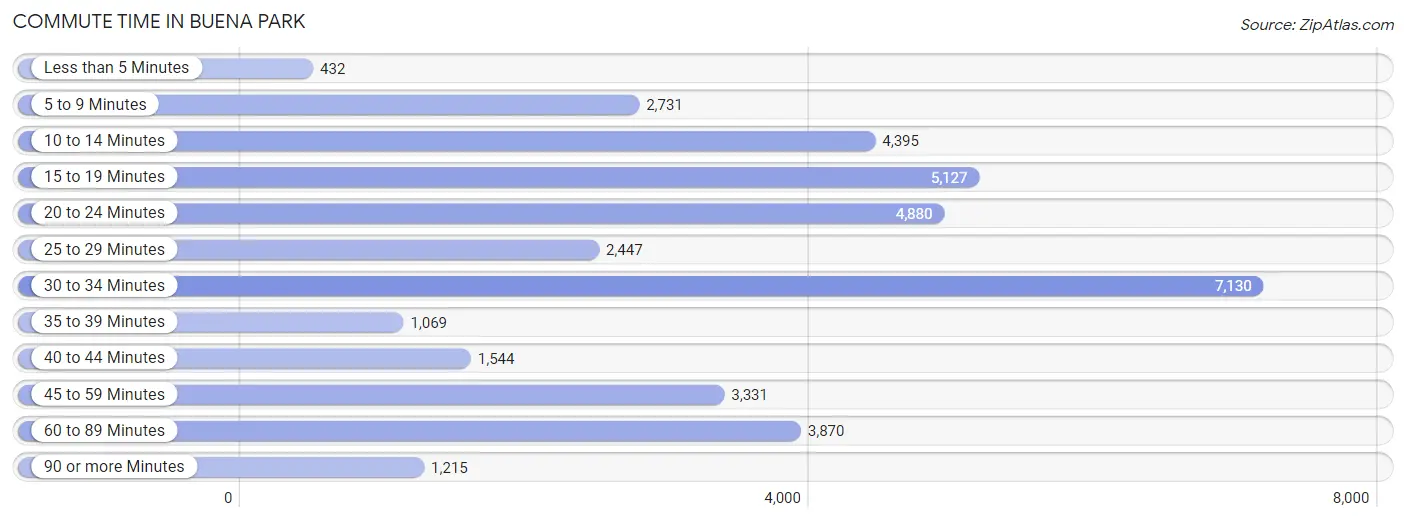
| Commute Time | # Commuters | % Commuters |
| Less than 5 Minutes | 432 | 1.1% |
| 5 to 9 Minutes | 2,731 | 7.1% |
| 10 to 14 Minutes | 4,395 | 11.5% |
| 15 to 19 Minutes | 5,127 | 13.4% |
| 20 to 24 Minutes | 4,880 | 12.8% |
| 25 to 29 Minutes | 2,447 | 6.4% |
| 30 to 34 Minutes | 7,130 | 18.7% |
| 35 to 39 Minutes | 1,069 | 2.8% |
| 40 to 44 Minutes | 1,544 | 4.0% |
| 45 to 59 Minutes | 3,331 | 8.7% |
| 60 to 89 Minutes | 3,870 | 10.1% |
| 90 or more Minutes | 1,215 | 3.2% |
Commute Time by Sex in Buena Park
The most common commute times in Buena Park are 30 to 34 minutes (3,602 commuters, 17.3%) for males and 30 to 34 minutes (3,528 commuters, 20.3%) for females.
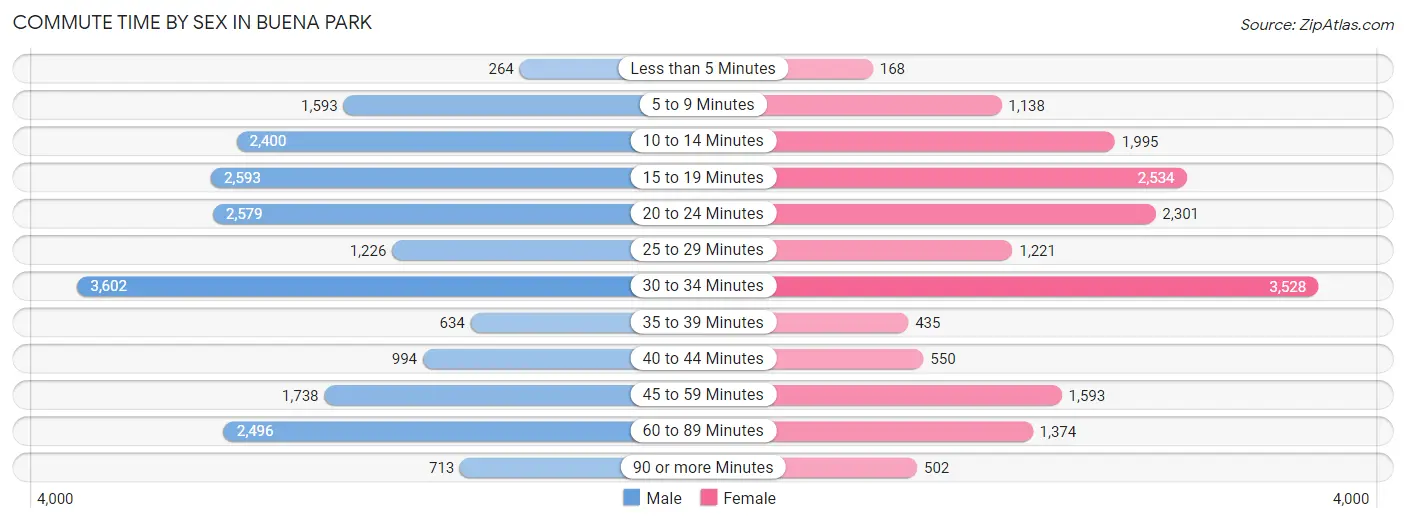
| Commute Time | Male | Female |
| Less than 5 Minutes | 264 (1.3%) | 168 (1.0%) |
| 5 to 9 Minutes | 1,593 (7.6%) | 1,138 (6.6%) |
| 10 to 14 Minutes | 2,400 (11.5%) | 1,995 (11.5%) |
| 15 to 19 Minutes | 2,593 (12.4%) | 2,534 (14.6%) |
| 20 to 24 Minutes | 2,579 (12.4%) | 2,301 (13.3%) |
| 25 to 29 Minutes | 1,226 (5.9%) | 1,221 (7.0%) |
| 30 to 34 Minutes | 3,602 (17.3%) | 3,528 (20.3%) |
| 35 to 39 Minutes | 634 (3.0%) | 435 (2.5%) |
| 40 to 44 Minutes | 994 (4.8%) | 550 (3.2%) |
| 45 to 59 Minutes | 1,738 (8.3%) | 1,593 (9.2%) |
| 60 to 89 Minutes | 2,496 (12.0%) | 1,374 (7.9%) |
| 90 or more Minutes | 713 (3.4%) | 502 (2.9%) |
Time of Departure to Work by Sex in Buena Park
The most frequent times of departure to work in Buena Park are 6:00 AM to 6:29 AM (2,605, 12.5%) for males and 7:00 AM to 7:29 AM (2,552, 14.7%) for females.
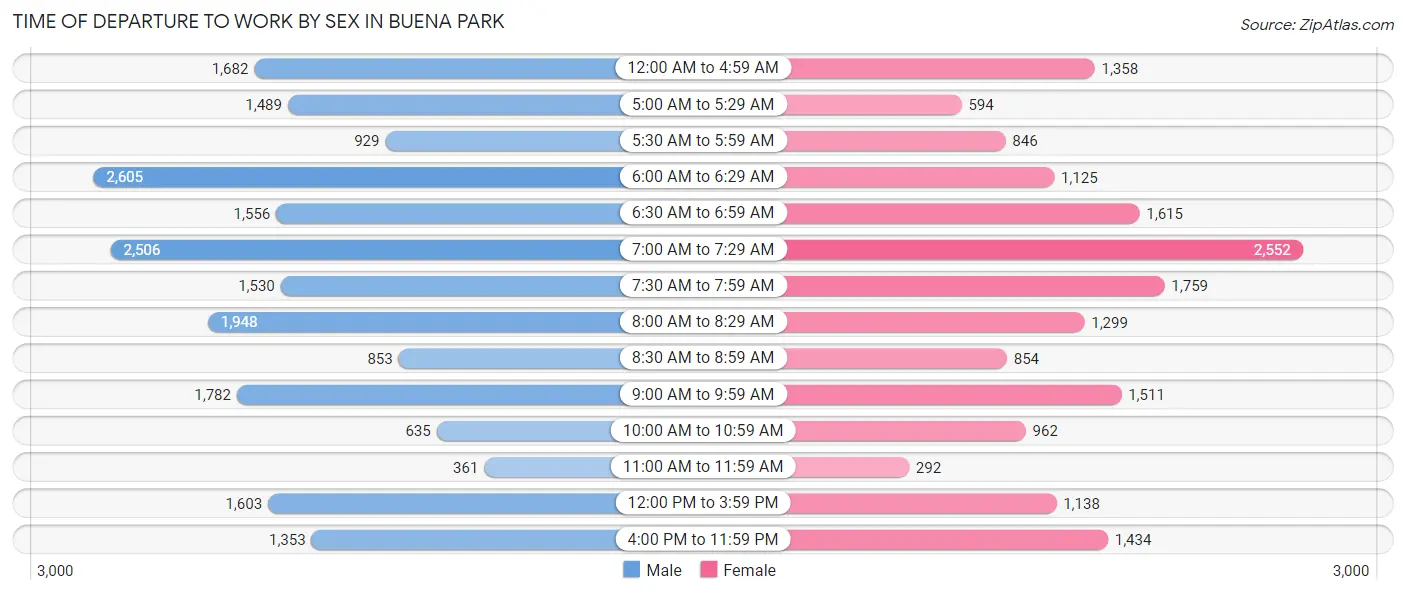
| Time of Departure | Male | Female |
| 12:00 AM to 4:59 AM | 1,682 (8.1%) | 1,358 (7.8%) |
| 5:00 AM to 5:29 AM | 1,489 (7.1%) | 594 (3.4%) |
| 5:30 AM to 5:59 AM | 929 (4.5%) | 846 (4.9%) |
| 6:00 AM to 6:29 AM | 2,605 (12.5%) | 1,125 (6.5%) |
| 6:30 AM to 6:59 AM | 1,556 (7.5%) | 1,615 (9.3%) |
| 7:00 AM to 7:29 AM | 2,506 (12.0%) | 2,552 (14.7%) |
| 7:30 AM to 7:59 AM | 1,530 (7.3%) | 1,759 (10.1%) |
| 8:00 AM to 8:29 AM | 1,948 (9.3%) | 1,299 (7.5%) |
| 8:30 AM to 8:59 AM | 853 (4.1%) | 854 (4.9%) |
| 9:00 AM to 9:59 AM | 1,782 (8.6%) | 1,511 (8.7%) |
| 10:00 AM to 10:59 AM | 635 (3.0%) | 962 (5.6%) |
| 11:00 AM to 11:59 AM | 361 (1.7%) | 292 (1.7%) |
| 12:00 PM to 3:59 PM | 1,603 (7.7%) | 1,138 (6.6%) |
| 4:00 PM to 11:59 PM | 1,353 (6.5%) | 1,434 (8.3%) |
| Total | 20,832 (100.0%) | 17,339 (100.0%) |
Housing Occupancy in Buena Park
Occupancy by Ownership in Buena Park
Of the total 24,283 dwellings in Buena Park, owner-occupied units account for 13,721 (56.5%), while renter-occupied units make up 10,562 (43.5%).
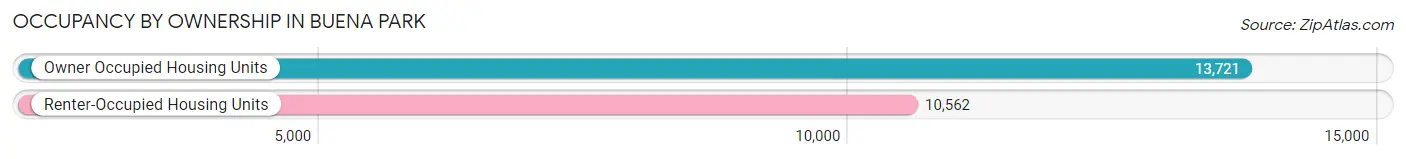
| Occupancy | # Housing Units | % Housing Units |
| Owner Occupied Housing Units | 13,721 | 56.5% |
| Renter-Occupied Housing Units | 10,562 | 43.5% |
| Total Occupied Housing Units | 24,283 | 100.0% |
Occupancy by Household Size in Buena Park
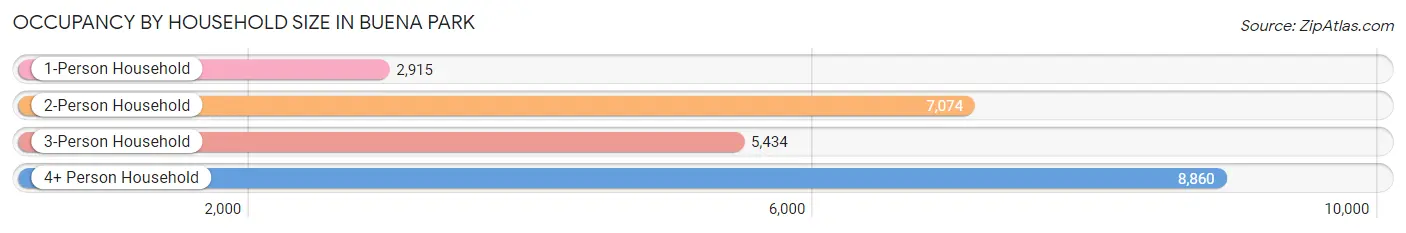
| Household Size | # Housing Units | % Housing Units |
| 1-Person Household | 2,915 | 12.0% |
| 2-Person Household | 7,074 | 29.1% |
| 3-Person Household | 5,434 | 22.4% |
| 4+ Person Household | 8,860 | 36.5% |
| Total Housing Units | 24,283 | 100.0% |
Occupancy by Ownership by Household Size in Buena Park
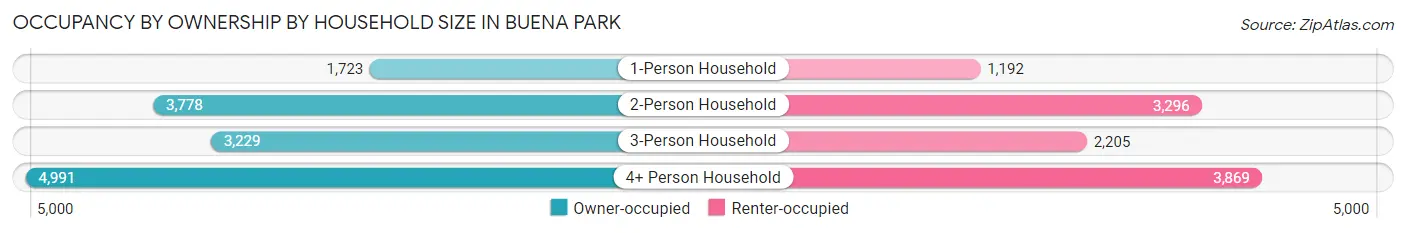
| Household Size | Owner-occupied | Renter-occupied |
| 1-Person Household | 1,723 (59.1%) | 1,192 (40.9%) |
| 2-Person Household | 3,778 (53.4%) | 3,296 (46.6%) |
| 3-Person Household | 3,229 (59.4%) | 2,205 (40.6%) |
| 4+ Person Household | 4,991 (56.3%) | 3,869 (43.7%) |
| Total Housing Units | 13,721 (56.5%) | 10,562 (43.5%) |
Occupancy by Educational Attainment in Buena Park
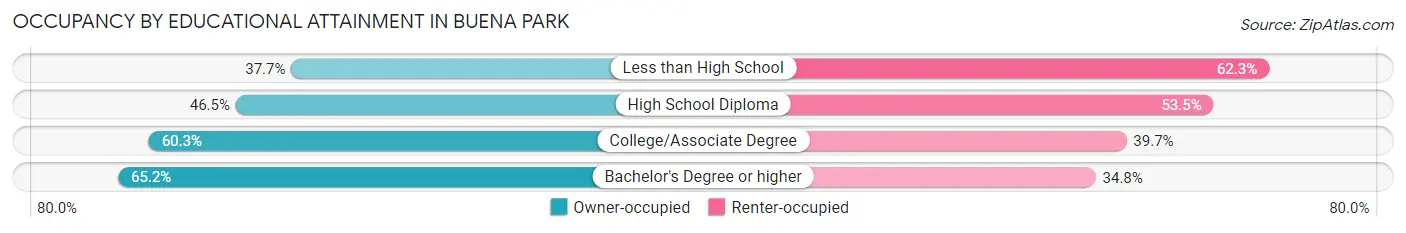
| Household Size | Owner-occupied | Renter-occupied |
| Less than High School | 1,208 (37.7%) | 1,996 (62.3%) |
| High School Diploma | 2,070 (46.5%) | 2,382 (53.5%) |
| College/Associate Degree | 4,899 (60.3%) | 3,224 (39.7%) |
| Bachelor's Degree or higher | 5,544 (65.2%) | 2,960 (34.8%) |
Occupancy by Age of Householder in Buena Park
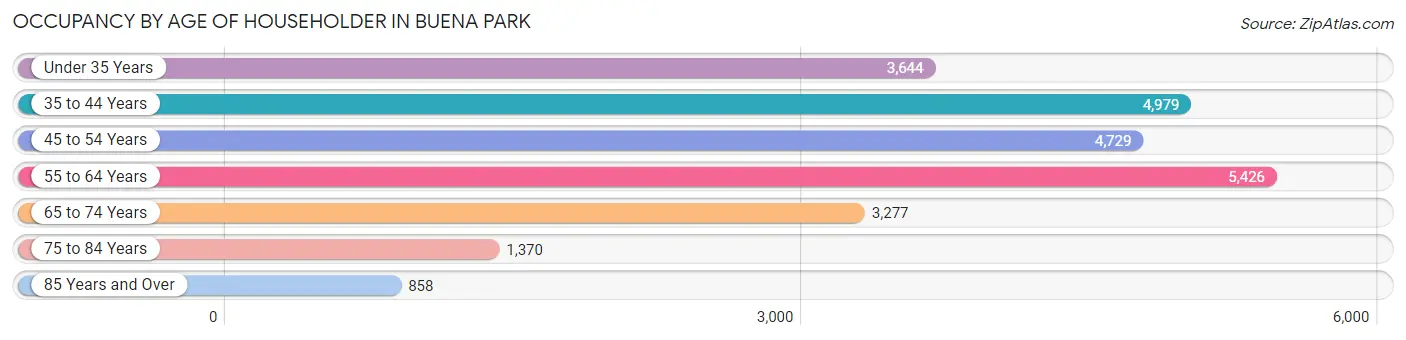
| Age Bracket | # Households | % Households |
| Under 35 Years | 3,644 | 15.0% |
| 35 to 44 Years | 4,979 | 20.5% |
| 45 to 54 Years | 4,729 | 19.5% |
| 55 to 64 Years | 5,426 | 22.3% |
| 65 to 74 Years | 3,277 | 13.5% |
| 75 to 84 Years | 1,370 | 5.6% |
| 85 Years and Over | 858 | 3.5% |
| Total | 24,283 | 100.0% |
Housing Finances in Buena Park
Median Income by Occupancy in Buena Park
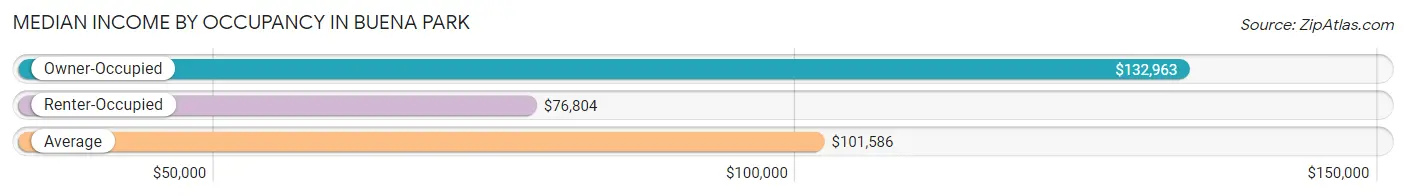
| Occupancy Type | # Households | Median Income |
| Owner-Occupied | 13,721 (56.5%) | $132,963 |
| Renter-Occupied | 10,562 (43.5%) | $76,804 |
| Average | 24,283 (100.0%) | $101,586 |
Occupancy by Householder Income Bracket in Buena Park
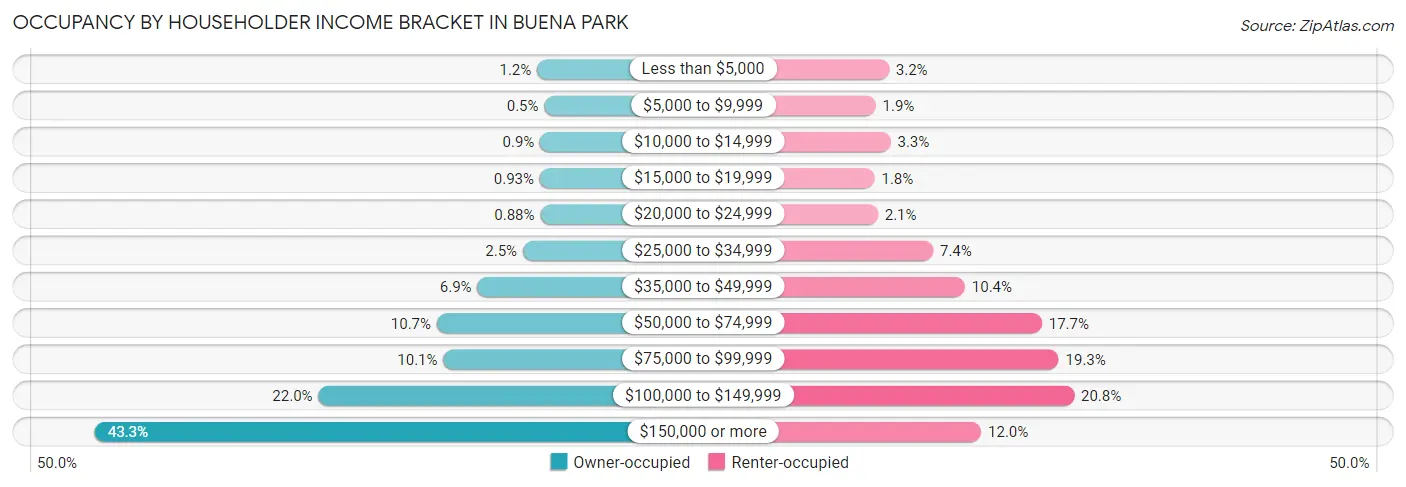
| Income Bracket | Owner-occupied | Renter-occupied |
| Less than $5,000 | 163 (1.2%) | 335 (3.2%) |
| $5,000 to $9,999 | 68 (0.5%) | 202 (1.9%) |
| $10,000 to $14,999 | 124 (0.9%) | 352 (3.3%) |
| $15,000 to $19,999 | 128 (0.9%) | 191 (1.8%) |
| $20,000 to $24,999 | 121 (0.9%) | 224 (2.1%) |
| $25,000 to $34,999 | 349 (2.5%) | 780 (7.4%) |
| $35,000 to $49,999 | 942 (6.9%) | 1,100 (10.4%) |
| $50,000 to $74,999 | 1,473 (10.7%) | 1,874 (17.7%) |
| $75,000 to $99,999 | 1,389 (10.1%) | 2,043 (19.3%) |
| $100,000 to $149,999 | 3,022 (22.0%) | 2,198 (20.8%) |
| $150,000 or more | 5,942 (43.3%) | 1,263 (12.0%) |
| Total | 13,721 (100.0%) | 10,562 (100.0%) |
Monthly Housing Cost Tiers in Buena Park
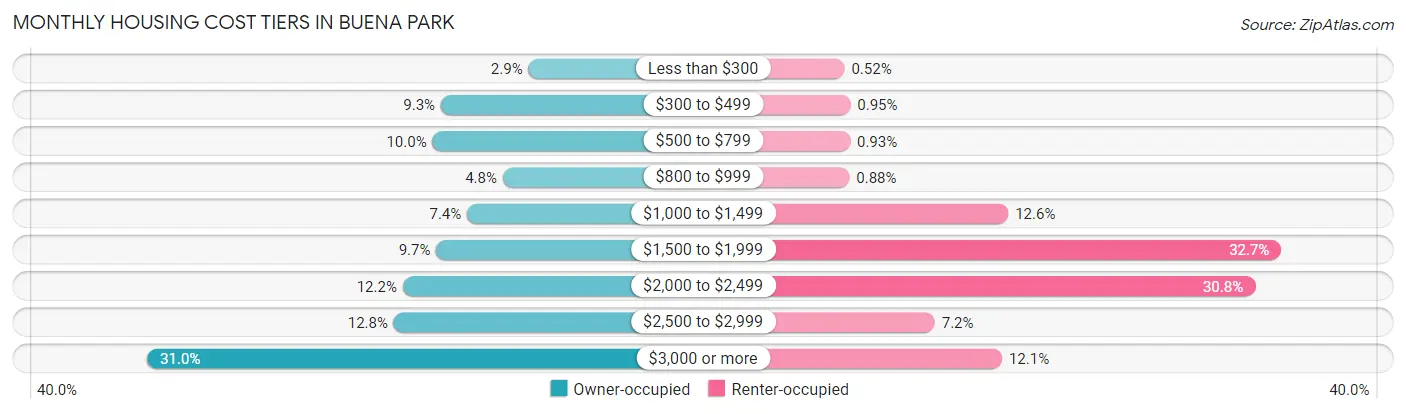
| Monthly Cost | Owner-occupied | Renter-occupied |
| Less than $300 | 397 (2.9%) | 55 (0.5%) |
| $300 to $499 | 1,281 (9.3%) | 100 (0.9%) |
| $500 to $799 | 1,367 (10.0%) | 98 (0.9%) |
| $800 to $999 | 656 (4.8%) | 93 (0.9%) |
| $1,000 to $1,499 | 1,017 (7.4%) | 1,329 (12.6%) |
| $1,500 to $1,999 | 1,328 (9.7%) | 3,452 (32.7%) |
| $2,000 to $2,499 | 1,667 (12.1%) | 3,248 (30.7%) |
| $2,500 to $2,999 | 1,757 (12.8%) | 757 (7.2%) |
| $3,000 or more | 4,251 (31.0%) | 1,280 (12.1%) |
| Total | 13,721 (100.0%) | 10,562 (100.0%) |
Physical Housing Characteristics in Buena Park
Housing Structures in Buena Park
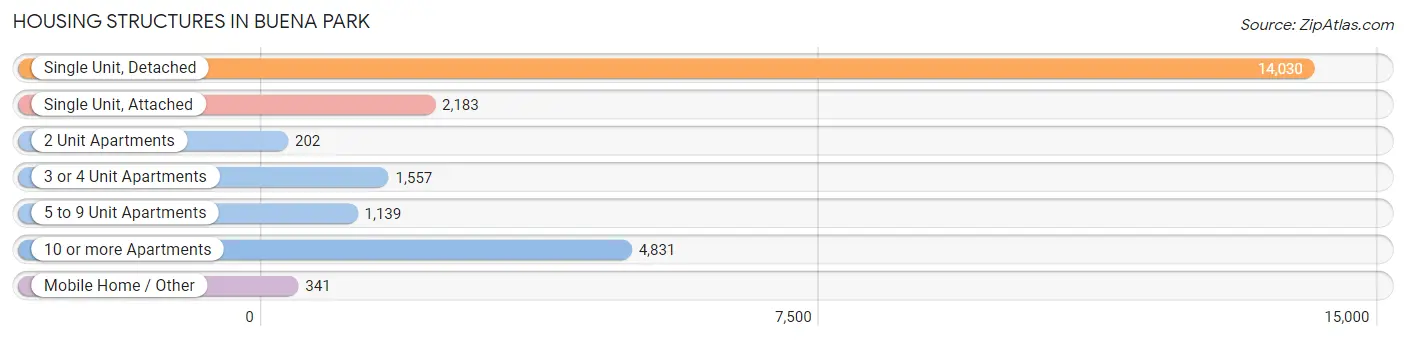
| Structure Type | # Housing Units | % Housing Units |
| Single Unit, Detached | 14,030 | 57.8% |
| Single Unit, Attached | 2,183 | 9.0% |
| 2 Unit Apartments | 202 | 0.8% |
| 3 or 4 Unit Apartments | 1,557 | 6.4% |
| 5 to 9 Unit Apartments | 1,139 | 4.7% |
| 10 or more Apartments | 4,831 | 19.9% |
| Mobile Home / Other | 341 | 1.4% |
| Total | 24,283 | 100.0% |
Housing Structures by Occupancy in Buena Park
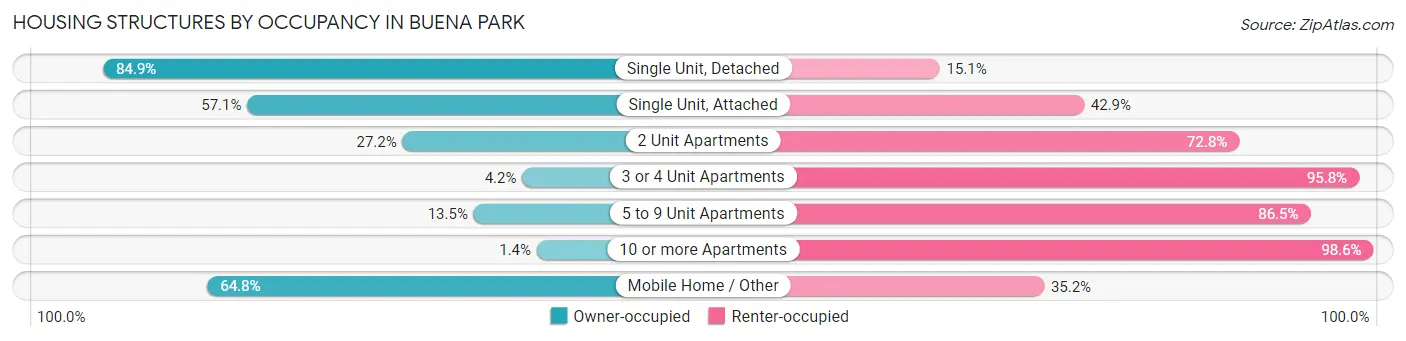
| Structure Type | Owner-occupied | Renter-occupied |
| Single Unit, Detached | 11,913 (84.9%) | 2,117 (15.1%) |
| Single Unit, Attached | 1,247 (57.1%) | 936 (42.9%) |
| 2 Unit Apartments | 55 (27.2%) | 147 (72.8%) |
| 3 or 4 Unit Apartments | 65 (4.2%) | 1,492 (95.8%) |
| 5 to 9 Unit Apartments | 154 (13.5%) | 985 (86.5%) |
| 10 or more Apartments | 66 (1.4%) | 4,765 (98.6%) |
| Mobile Home / Other | 221 (64.8%) | 120 (35.2%) |
| Total | 13,721 (56.5%) | 10,562 (43.5%) |
Housing Structures by Number of Rooms in Buena Park
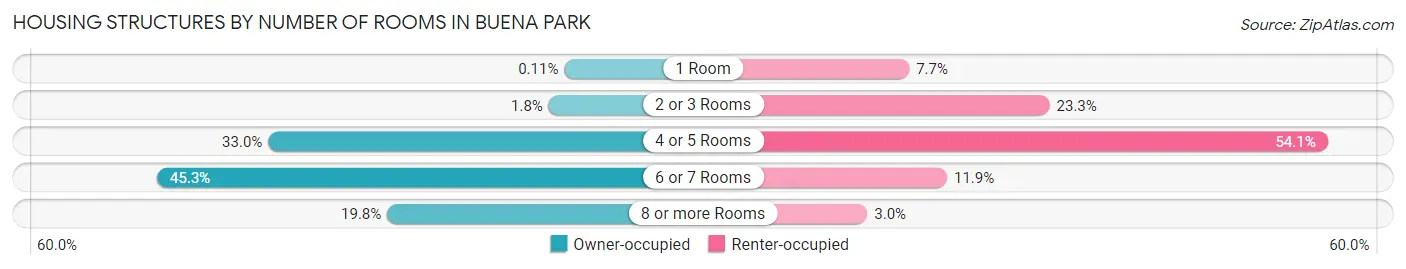
| Number of Rooms | Owner-occupied | Renter-occupied |
| 1 Room | 15 (0.1%) | 812 (7.7%) |
| 2 or 3 Rooms | 252 (1.8%) | 2,458 (23.3%) |
| 4 or 5 Rooms | 4,524 (33.0%) | 5,715 (54.1%) |
| 6 or 7 Rooms | 6,217 (45.3%) | 1,256 (11.9%) |
| 8 or more Rooms | 2,713 (19.8%) | 321 (3.0%) |
| Total | 13,721 (100.0%) | 10,562 (100.0%) |
Housing Structure by Heating Type in Buena Park
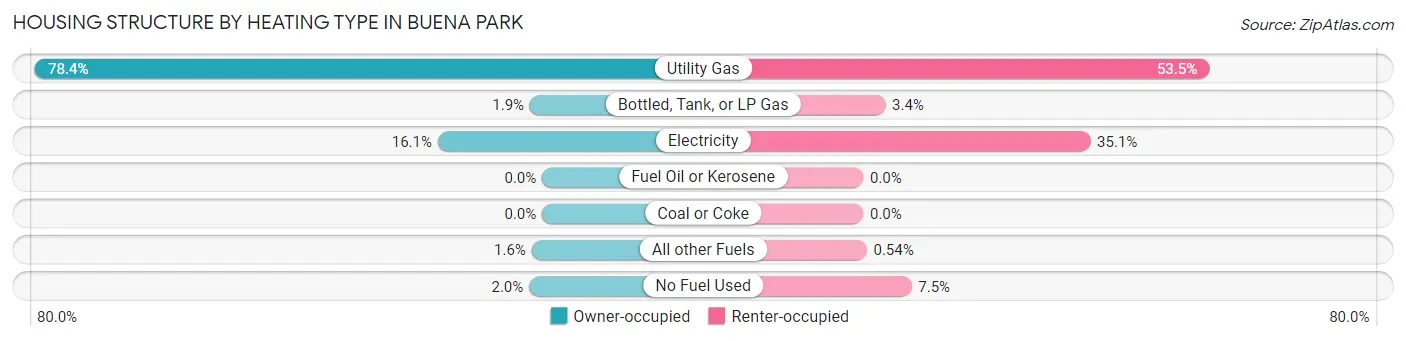
| Heating Type | Owner-occupied | Renter-occupied |
| Utility Gas | 10,754 (78.4%) | 5,648 (53.5%) |
| Bottled, Tank, or LP Gas | 258 (1.9%) | 360 (3.4%) |
| Electricity | 2,212 (16.1%) | 3,708 (35.1%) |
| Fuel Oil or Kerosene | 0 (0.0%) | 0 (0.0%) |
| Coal or Coke | 0 (0.0%) | 0 (0.0%) |
| All other Fuels | 221 (1.6%) | 57 (0.5%) |
| No Fuel Used | 276 (2.0%) | 789 (7.5%) |
| Total | 13,721 (100.0%) | 10,562 (100.0%) |
Household Vehicle Usage in Buena Park
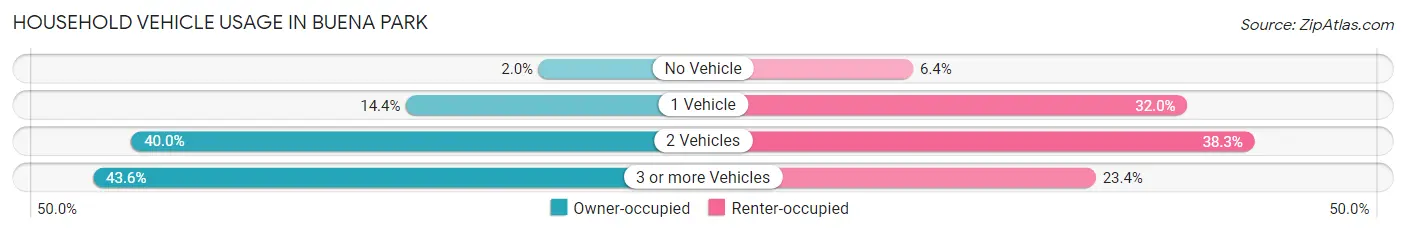
| Vehicles per Household | Owner-occupied | Renter-occupied |
| No Vehicle | 273 (2.0%) | 672 (6.4%) |
| 1 Vehicle | 1,972 (14.4%) | 3,377 (32.0%) |
| 2 Vehicles | 5,494 (40.0%) | 4,040 (38.3%) |
| 3 or more Vehicles | 5,982 (43.6%) | 2,473 (23.4%) |
| Total | 13,721 (100.0%) | 10,562 (100.0%) |
Real Estate & Mortgages in Buena Park
Real Estate and Mortgage Overview in Buena Park
| Characteristic | Without Mortgage | With Mortgage |
| Housing Units | 4,126 | 9,595 |
| Median Property Value | $687,900 | $708,300 |
| Median Household Income | $94,524 | $5,090 |
| Monthly Housing Costs | $578 | $4,251 |
| Real Estate Taxes | $2,837 | $255 |
Property Value by Mortgage Status in Buena Park
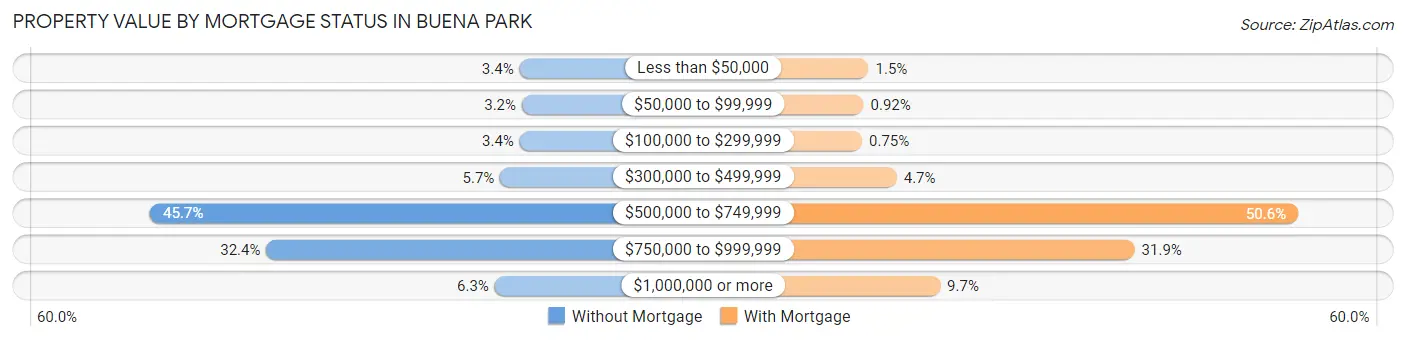
| Property Value | Without Mortgage | With Mortgage |
| Less than $50,000 | 142 (3.4%) | 143 (1.5%) |
| $50,000 to $99,999 | 131 (3.2%) | 88 (0.9%) |
| $100,000 to $299,999 | 141 (3.4%) | 72 (0.7%) |
| $300,000 to $499,999 | 233 (5.7%) | 452 (4.7%) |
| $500,000 to $749,999 | 1,884 (45.7%) | 4,851 (50.6%) |
| $750,000 to $999,999 | 1,336 (32.4%) | 3,061 (31.9%) |
| $1,000,000 or more | 259 (6.3%) | 928 (9.7%) |
| Total | 4,126 (100.0%) | 9,595 (100.0%) |
Household Income by Mortgage Status in Buena Park
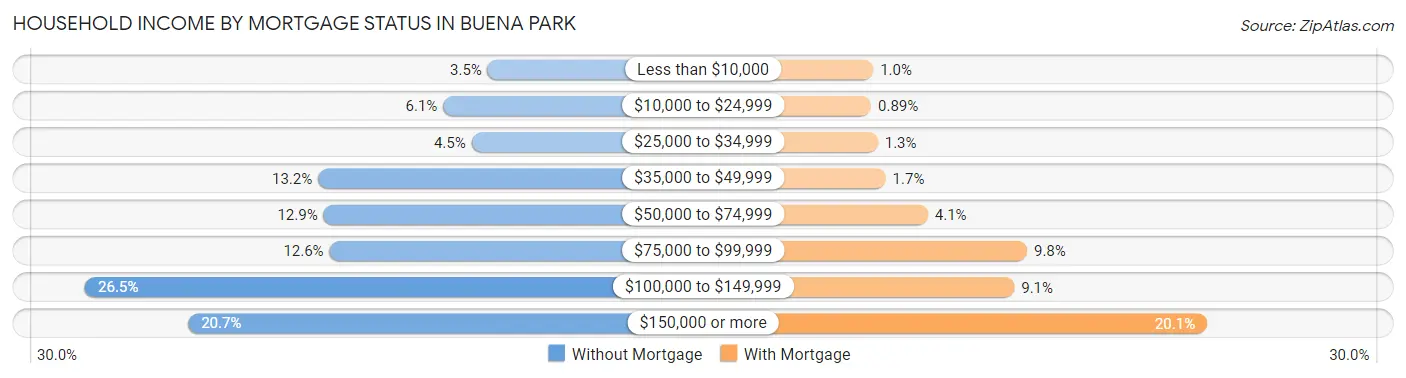
| Household Income | Without Mortgage | With Mortgage |
| Less than $10,000 | 146 (3.5%) | 97 (1.0%) |
| $10,000 to $24,999 | 251 (6.1%) | 85 (0.9%) |
| $25,000 to $34,999 | 184 (4.5%) | 122 (1.3%) |
| $35,000 to $49,999 | 546 (13.2%) | 165 (1.7%) |
| $50,000 to $74,999 | 533 (12.9%) | 396 (4.1%) |
| $75,000 to $99,999 | 519 (12.6%) | 940 (9.8%) |
| $100,000 to $149,999 | 1,095 (26.5%) | 870 (9.1%) |
| $150,000 or more | 852 (20.6%) | 1,927 (20.1%) |
| Total | 4,126 (100.0%) | 9,595 (100.0%) |
Property Value to Household Income Ratio in Buena Park
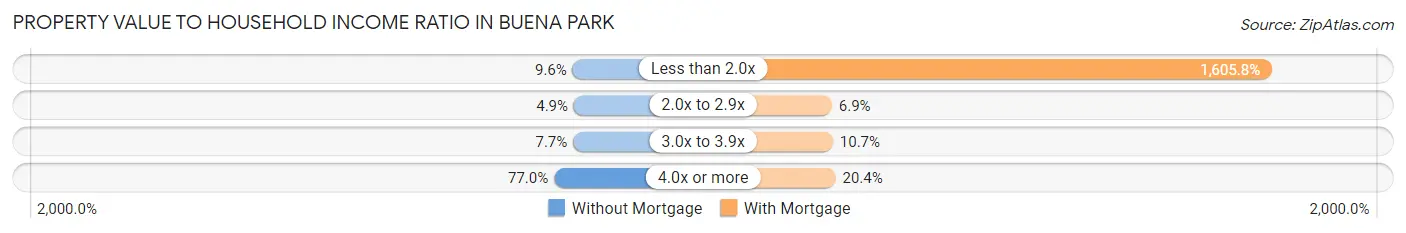
| Value-to-Income Ratio | Without Mortgage | With Mortgage |
| Less than 2.0x | 395 (9.6%) | 154,075 (1,605.8%) |
| 2.0x to 2.9x | 200 (4.9%) | 663 (6.9%) |
| 3.0x to 3.9x | 319 (7.7%) | 1,029 (10.7%) |
| 4.0x or more | 3,175 (76.9%) | 1,954 (20.4%) |
| Total | 4,126 (100.0%) | 9,595 (100.0%) |
Real Estate Taxes by Mortgage Status in Buena Park
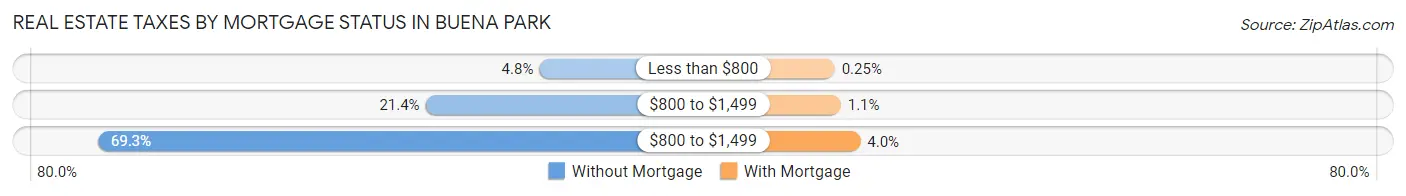
| Property Taxes | Without Mortgage | With Mortgage |
| Less than $800 | 198 (4.8%) | 24 (0.3%) |
| $800 to $1,499 | 884 (21.4%) | 108 (1.1%) |
| $800 to $1,499 | 2,859 (69.3%) | 383 (4.0%) |
| Total | 4,126 (100.0%) | 9,595 (100.0%) |
Health & Disability in Buena Park
Health Insurance Coverage by Age in Buena Park
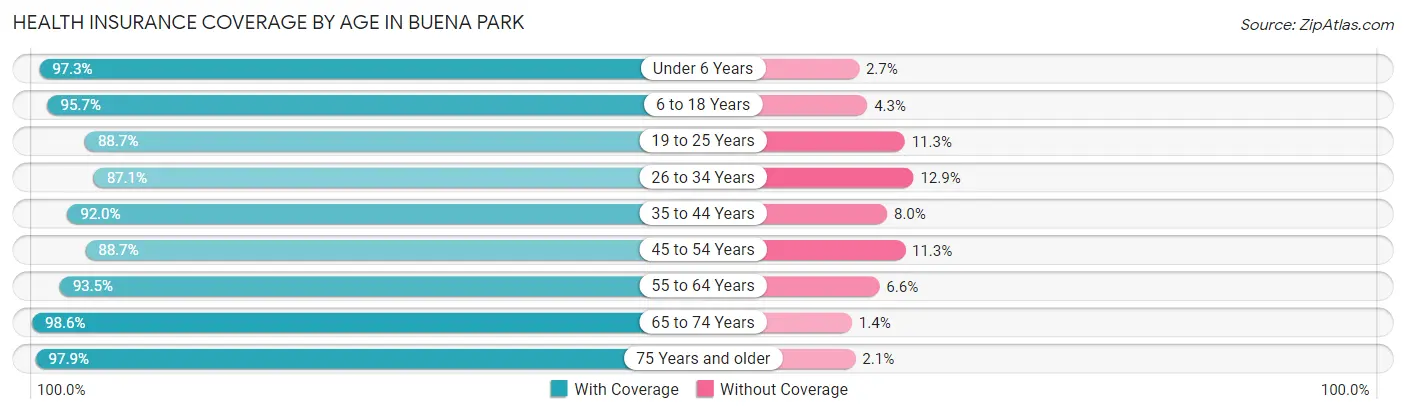
| Age Bracket | With Coverage | Without Coverage |
| Under 6 Years | 5,763 (97.3%) | 162 (2.7%) |
| 6 to 18 Years | 12,822 (95.7%) | 574 (4.3%) |
| 19 to 25 Years | 7,338 (88.7%) | 932 (11.3%) |
| 26 to 34 Years | 10,307 (87.1%) | 1,526 (12.9%) |
| 35 to 44 Years | 10,661 (92.0%) | 923 (8.0%) |
| 45 to 54 Years | 8,588 (88.7%) | 1,097 (11.3%) |
| 55 to 64 Years | 10,555 (93.4%) | 740 (6.6%) |
| 65 to 74 Years | 6,747 (98.6%) | 97 (1.4%) |
| 75 Years and older | 4,342 (97.9%) | 92 (2.1%) |
| Total | 77,123 (92.6%) | 6,143 (7.4%) |
Health Insurance Coverage by Citizenship Status in Buena Park
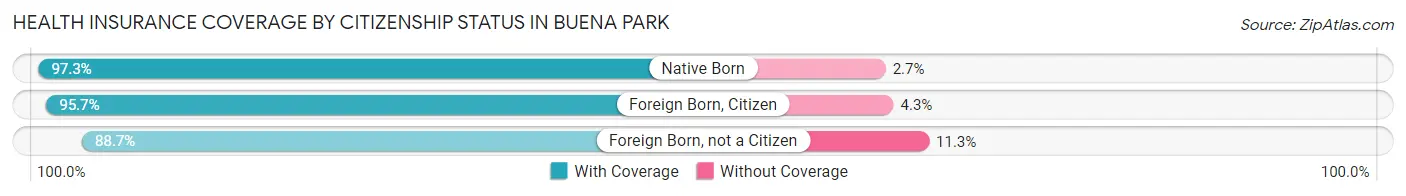
| Citizenship Status | With Coverage | Without Coverage |
| Native Born | 5,763 (97.3%) | 162 (2.7%) |
| Foreign Born, Citizen | 12,822 (95.7%) | 574 (4.3%) |
| Foreign Born, not a Citizen | 7,338 (88.7%) | 932 (11.3%) |
Health Insurance Coverage by Household Income in Buena Park
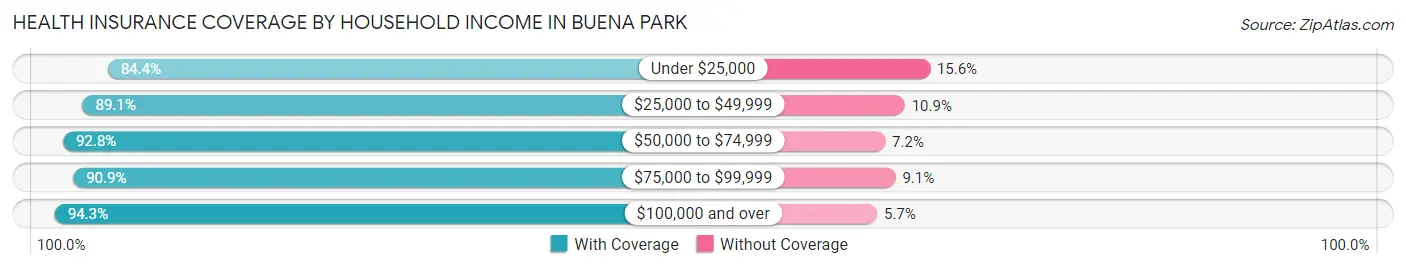
| Household Income | With Coverage | Without Coverage |
| Under $25,000 | 3,679 (84.4%) | 679 (15.6%) |
| $25,000 to $49,999 | 8,115 (89.1%) | 989 (10.9%) |
| $50,000 to $74,999 | 9,173 (92.8%) | 711 (7.2%) |
| $75,000 to $99,999 | 10,041 (90.9%) | 1,008 (9.1%) |
| $100,000 and over | 45,299 (94.3%) | 2,721 (5.7%) |
Public vs Private Health Insurance Coverage by Age in Buena Park
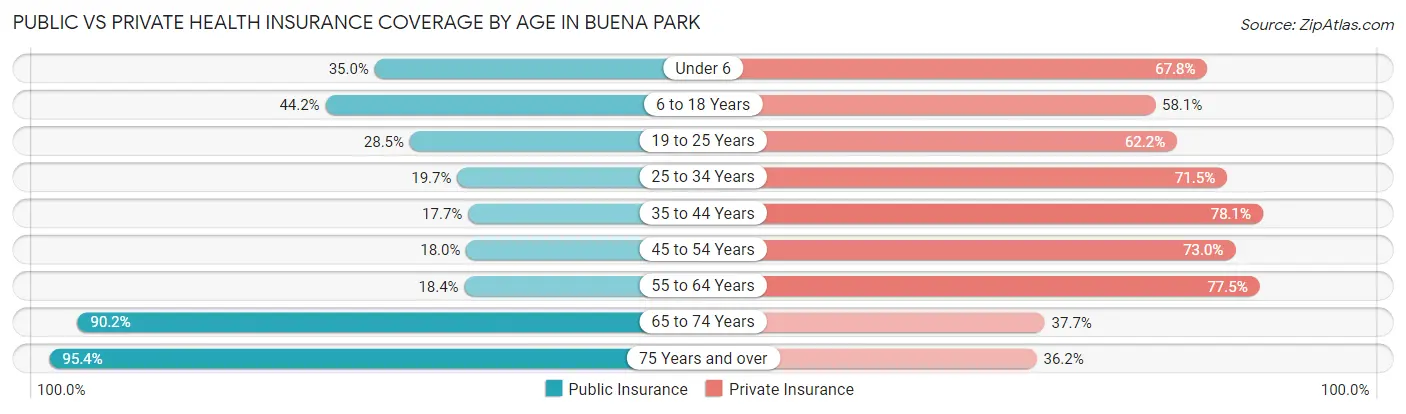
| Age Bracket | Public Insurance | Private Insurance |
| Under 6 | 2,075 (35.0%) | 4,019 (67.8%) |
| 6 to 18 Years | 5,916 (44.2%) | 7,788 (58.1%) |
| 19 to 25 Years | 2,356 (28.5%) | 5,145 (62.2%) |
| 25 to 34 Years | 2,329 (19.7%) | 8,461 (71.5%) |
| 35 to 44 Years | 2,047 (17.7%) | 9,052 (78.1%) |
| 45 to 54 Years | 1,745 (18.0%) | 7,071 (73.0%) |
| 55 to 64 Years | 2,074 (18.4%) | 8,756 (77.5%) |
| 65 to 74 Years | 6,173 (90.2%) | 2,577 (37.7%) |
| 75 Years and over | 4,230 (95.4%) | 1,603 (36.1%) |
| Total | 28,945 (34.8%) | 54,472 (65.4%) |
Disability Status by Sex by Age in Buena Park
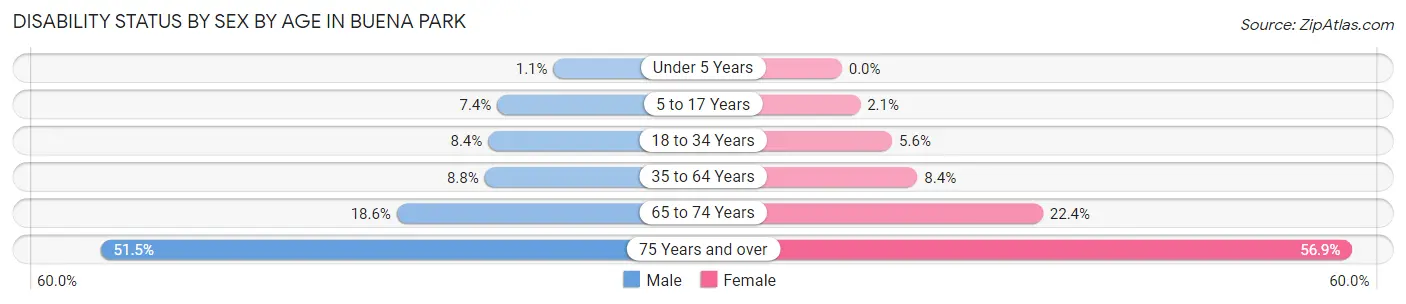
| Age Bracket | Male | Female |
| Under 5 Years | 27 (1.1%) | 0 (0.0%) |
| 5 to 17 Years | 510 (7.4%) | 137 (2.1%) |
| 18 to 34 Years | 917 (8.4%) | 565 (5.6%) |
| 35 to 64 Years | 1,431 (8.8%) | 1,370 (8.4%) |
| 65 to 74 Years | 613 (18.6%) | 793 (22.4%) |
| 75 Years and over | 946 (51.5%) | 1,477 (56.9%) |
Disability Class by Sex by Age in Buena Park
Disability Class: Hearing Difficulty
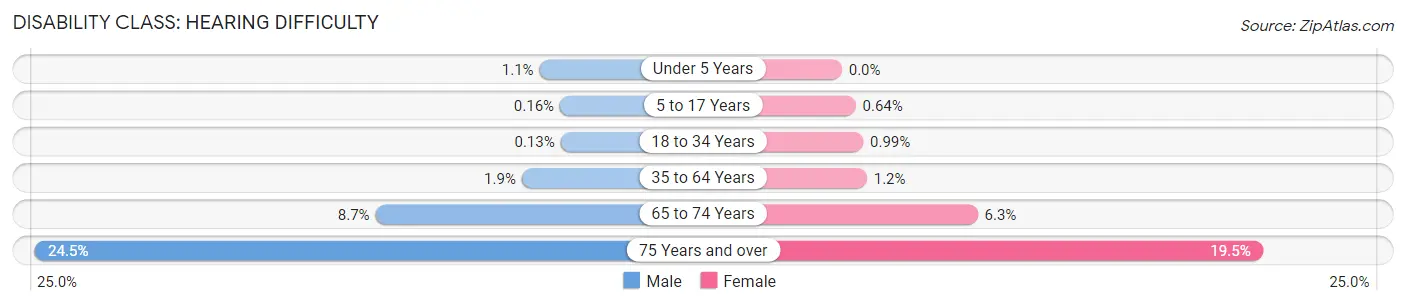
| Age Bracket | Male | Female |
| Under 5 Years | 27 (1.1%) | 0 (0.0%) |
| 5 to 17 Years | 11 (0.2%) | 43 (0.6%) |
| 18 to 34 Years | 14 (0.1%) | 100 (1.0%) |
| 35 to 64 Years | 315 (1.9%) | 188 (1.2%) |
| 65 to 74 Years | 288 (8.7%) | 223 (6.3%) |
| 75 Years and over | 450 (24.5%) | 507 (19.5%) |
Disability Class: Vision Difficulty
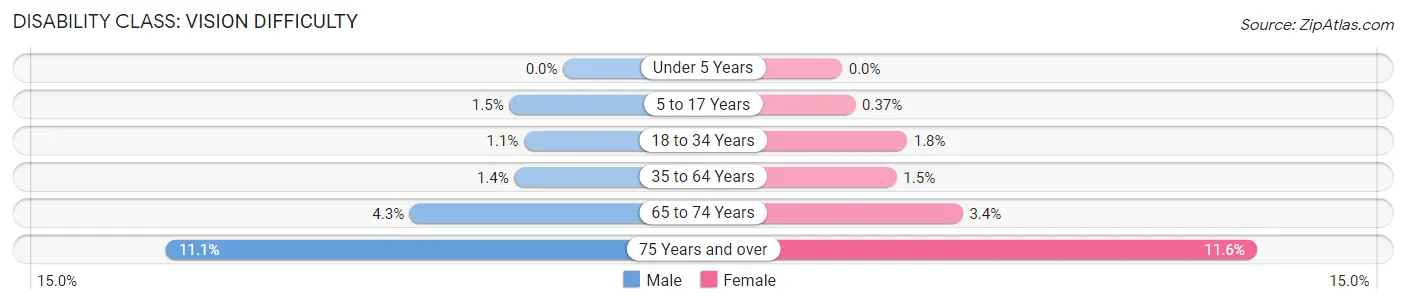
| Age Bracket | Male | Female |
| Under 5 Years | 0 (0.0%) | 0 (0.0%) |
| 5 to 17 Years | 104 (1.5%) | 25 (0.4%) |
| 18 to 34 Years | 119 (1.1%) | 182 (1.8%) |
| 35 to 64 Years | 222 (1.4%) | 247 (1.5%) |
| 65 to 74 Years | 141 (4.3%) | 119 (3.4%) |
| 75 Years and over | 203 (11.1%) | 300 (11.6%) |
Disability Class: Cognitive Difficulty
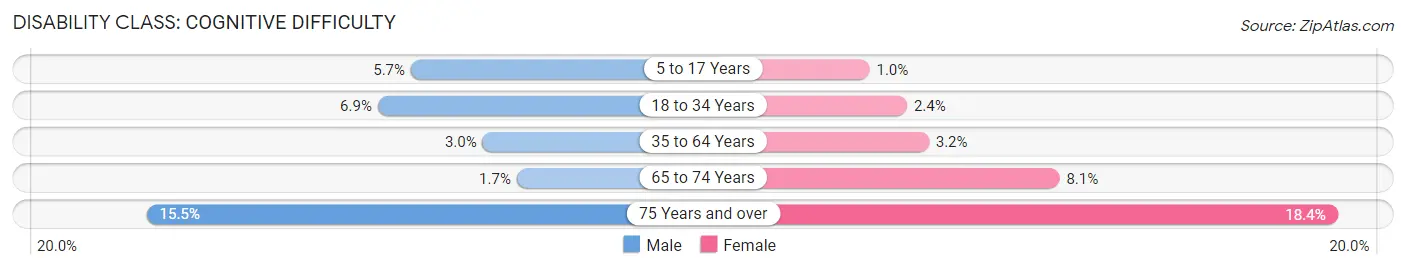
| Age Bracket | Male | Female |
| 5 to 17 Years | 391 (5.7%) | 69 (1.0%) |
| 18 to 34 Years | 754 (6.9%) | 244 (2.4%) |
| 35 to 64 Years | 489 (3.0%) | 525 (3.2%) |
| 65 to 74 Years | 57 (1.7%) | 286 (8.1%) |
| 75 Years and over | 284 (15.5%) | 478 (18.4%) |
Disability Class: Ambulatory Difficulty
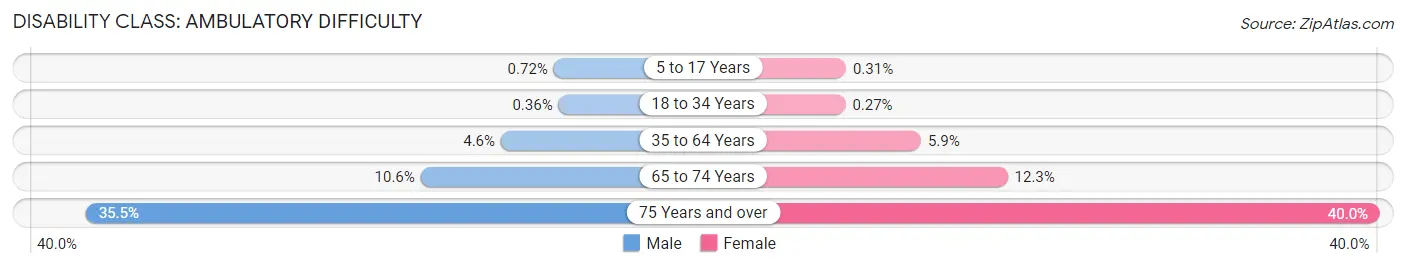
| Age Bracket | Male | Female |
| 5 to 17 Years | 50 (0.7%) | 21 (0.3%) |
| 18 to 34 Years | 39 (0.4%) | 27 (0.3%) |
| 35 to 64 Years | 756 (4.6%) | 957 (5.9%) |
| 65 to 74 Years | 350 (10.6%) | 436 (12.3%) |
| 75 Years and over | 651 (35.5%) | 1,038 (40.0%) |
Disability Class: Self-Care Difficulty
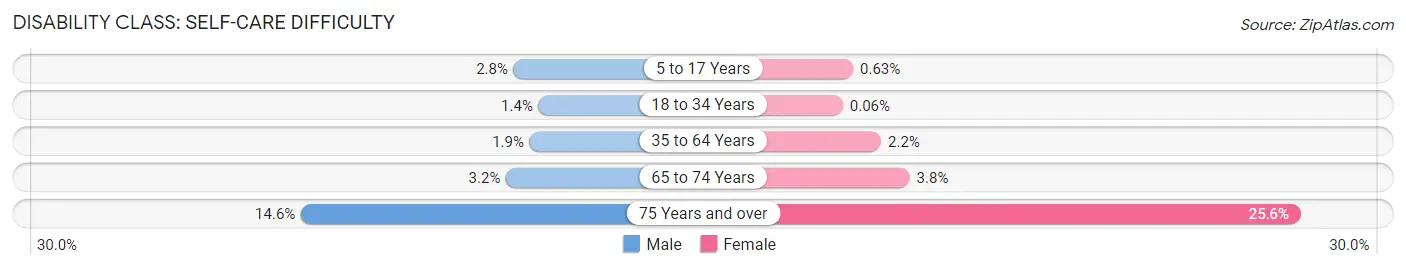
| Age Bracket | Male | Female |
| 5 to 17 Years | 191 (2.8%) | 42 (0.6%) |
| 18 to 34 Years | 150 (1.4%) | 6 (0.1%) |
| 35 to 64 Years | 304 (1.9%) | 357 (2.2%) |
| 65 to 74 Years | 105 (3.2%) | 134 (3.8%) |
| 75 Years and over | 268 (14.6%) | 664 (25.6%) |
Technology Access in Buena Park
Computing Device Access in Buena Park
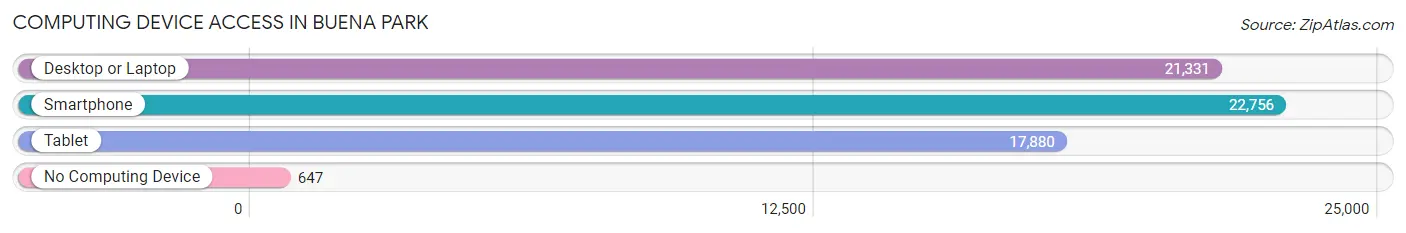
| Device Type | # Households | % Households |
| Desktop or Laptop | 21,331 | 87.8% |
| Smartphone | 22,756 | 93.7% |
| Tablet | 17,880 | 73.6% |
| No Computing Device | 647 | 2.7% |
| Total | 24,283 | 100.0% |
Internet Access in Buena Park
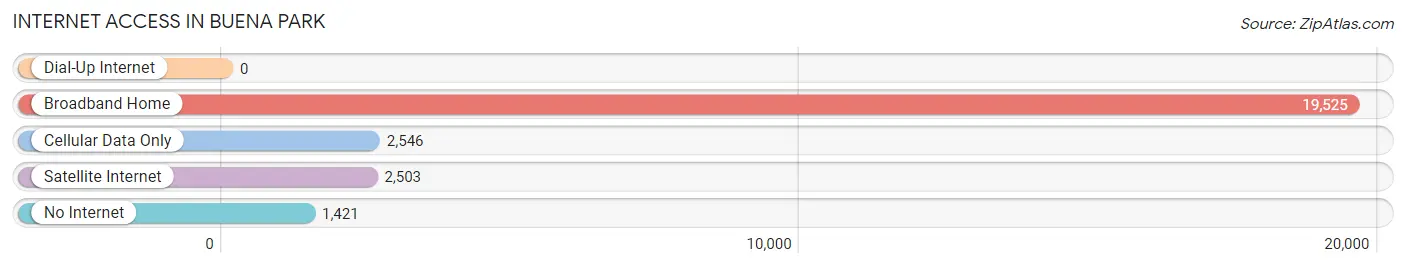
| Internet Type | # Households | % Households |
| Dial-Up Internet | 0 | 0.0% |
| Broadband Home | 19,525 | 80.4% |
| Cellular Data Only | 2,546 | 10.5% |
| Satellite Internet | 2,503 | 10.3% |
| No Internet | 1,421 | 5.9% |
| Total | 24,283 | 100.0% |
Buena Park Summary
Buena Park, California is a city located in the northwestern corner of Orange County, California. It is bordered by the cities of Anaheim, Cypress, La Palma, and Stanton. The population of Buena Park was 80,530 as of the 2010 census, making it the sixth-largest city in Orange County.
Geography
Buena Park is located at 33°51′15″N 117°59′19″W (33.854045, -117.988607). According to the United States Census Bureau, the city has a total area of 10.2 square miles (26.4 km2), all land.
The city is bordered by the cities of Anaheim, Cypress, La Palma, and Stanton. It is located approximately 12 miles (19 km) northwest of the city of Santa Ana, and is about 25 miles (40 km) southeast of the city of Los Angeles.
Climate
Buena Park has a Mediterranean climate, with warm, dry summers and mild, wet winters. The average annual temperature is 68°F (20°C). The average annual precipitation is 15.3 inches (389 mm).
Demographics
As of the 2010 census, there were 80,530 people, 28,948 households, and 20,890 families residing in the city. The population density was 7,895.3 people per square mile (3,053.2/km2). There were 29,845 housing units at an average density of 2,919.3 per square mile (1,127.7/km2). The racial makeup of the city was 53.3% White, 2.2% African American, 0.7% Native American, 15.2% Asian, 0.3% Pacific Islander, 24.2% from other races, and 4.2% from two or more races. Hispanic or Latino of any race were 44.2% of the population.
Economy
Buena Park is home to several major employers, including Knott's Berry Farm, the largest theme park in California, and the Los Angeles Angels of Anaheim baseball team. Other major employers include the Buena Park Mall, the Source Mall, and the Buena Park School District.
The city is also home to a number of small businesses, including restaurants, retail stores, and service providers. The city's economy is largely driven by tourism, with visitors coming to the city to visit Knott's Berry Farm and other attractions.
Conclusion
Buena Park, California is a city located in the northwestern corner of Orange County, California. It is bordered by the cities of Anaheim, Cypress, La Palma, and Stanton. The population of Buena Park was 80,530 as of the 2010 census, making it the sixth-largest city in Orange County. The city has a Mediterranean climate, with warm, dry summers and mild, wet winters. The racial makeup of the city was 53.3% White, 2.2% African American, 0.7% Native American, 15.2% Asian, 0.3% Pacific Islander, 24.2% from other races, and 4.2% from two or more races. Hispanic or Latino of any race were 44.2% of the population. The city's economy is largely driven by tourism, with visitors coming to the city to visit Knott's Berry Farm and other attractions. Buena Park is home to several major employers, including Knott's Berry Farm, the largest theme park in California, and the Los Angeles Angels of Anaheim baseball team. Other major employers include the Buena Park Mall, the Source Mall, and the Buena Park School District.
Common Questions
What is Per Capita Income in Buena Park?
Per Capita income in Buena Park is $37,945.
What is the Median Family Income in Buena Park?
Median Family Income in Buena Park is $101,722.
What is the Median Household income in Buena Park?
Median Household Income in Buena Park is $101,586.
What is Income or Wage Gap in Buena Park?
Income or Wage Gap in Buena Park is 14.8%.
Women in Buena Park earn 85.2 cents for every dollar earned by a man.
What is Family Income Deficit in Buena Park?
Family Income Deficit in Buena Park is $11,935.
Families that are below poverty line in Buena Park earn $11,935 less on average than the poverty threshold level.
What is Inequality or Gini Index in Buena Park?
Inequality or Gini Index in Buena Park is 0.41.
What is the Total Population of Buena Park?
Total Population of Buena Park is 83,542.
What is the Total Male Population of Buena Park?
Total Male Population of Buena Park is 41,846.
What is the Total Female Population of Buena Park?
Total Female Population of Buena Park is 41,696.
What is the Ratio of Males per 100 Females in Buena Park?
There are 100.36 Males per 100 Females in Buena Park.
What is the Ratio of Females per 100 Males in Buena Park?
There are 99.64 Females per 100 Males in Buena Park.
What is the Median Population Age in Buena Park?
Median Population Age in Buena Park is 36.9 Years.
What is the Average Family Size in Buena Park
Average Family Size in Buena Park is 3.7 People.
What is the Average Household Size in Buena Park
Average Household Size in Buena Park is 3.4 People.
How Large is the Labor Force in Buena Park?
There are 45,951 People in the Labor Forcein in Buena Park.
What is the Percentage of People in the Labor Force in Buena Park?
69.0% of People are in the Labor Force in Buena Park.
What is the Unemployment Rate in Buena Park?
Unemployment Rate in Buena Park is 5.4%.