Cerritos, CA Map & Demographics
Cerritos Map
Cerritos Overview
$51,243
PER CAPITA INCOME
$129,779
AVG FAMILY INCOME
$124,460
AVG HOUSEHOLD INCOME
26.7%
WAGE / INCOME GAP [ % ]
73.3¢/ $1
WAGE / INCOME GAP [ $ ]
$8,684
FAMILY INCOME DEFICIT
0.42
INEQUALITY / GINI INDEX
49,016
TOTAL POPULATION
24,583
MALE POPULATION
24,433
FEMALE POPULATION
100.61
MALES / 100 FEMALES
99.39
FEMALES / 100 MALES
46.6
MEDIAN AGE
3.4
AVG FAMILY SIZE
3.1
AVG HOUSEHOLD SIZE
23,707
LABOR FORCE [ PEOPLE ]
57.9%
PERCENT IN LABOR FORCE
5.4%
UNEMPLOYMENT RATE
Cerritos Zip Codes
Cerritos Area Codes
Income in Cerritos
Income Overview in Cerritos
Per Capita Income in Cerritos is $51,243, while median incomes of families and households are $129,779 and $124,460 respectively.
| Characteristic | Number | Measure |
| Per Capita Income | 49,016 | $51,243 |
| Median Family Income | 13,281 | $129,779 |
| Mean Family Income | 13,281 | $162,745 |
| Median Household Income | 15,772 | $124,460 |
| Mean Household Income | 15,772 | $155,281 |
| Income Deficit | 13,281 | $8,684 |
| Wage / Income Gap (%) | 49,016 | 26.73% |
| Wage / Income Gap ($) | 49,016 | 73.27¢ per $1 |
| Gini / Inequality Index | 49,016 | 0.42 |
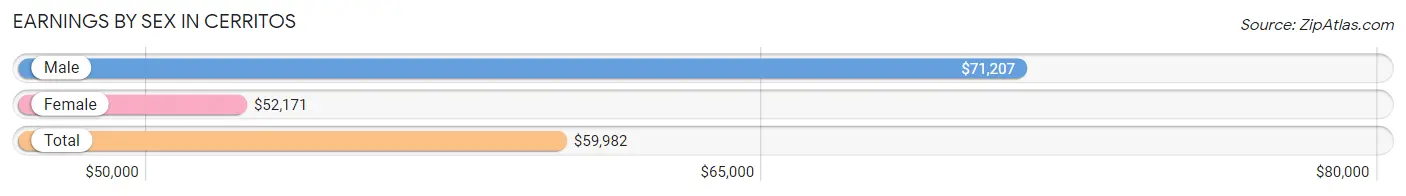
Earnings by Sex in Cerritos
Average Earnings in Cerritos are $59,982, $71,207 for men and $52,171 for women, a difference of 26.7%.
| Sex | Number | Average Earnings |
| Male | 12,520 (52.2%) | $71,207 |
| Female | 11,466 (47.8%) | $52,171 |
| Total | 23,986 (100.0%) | $59,982 |
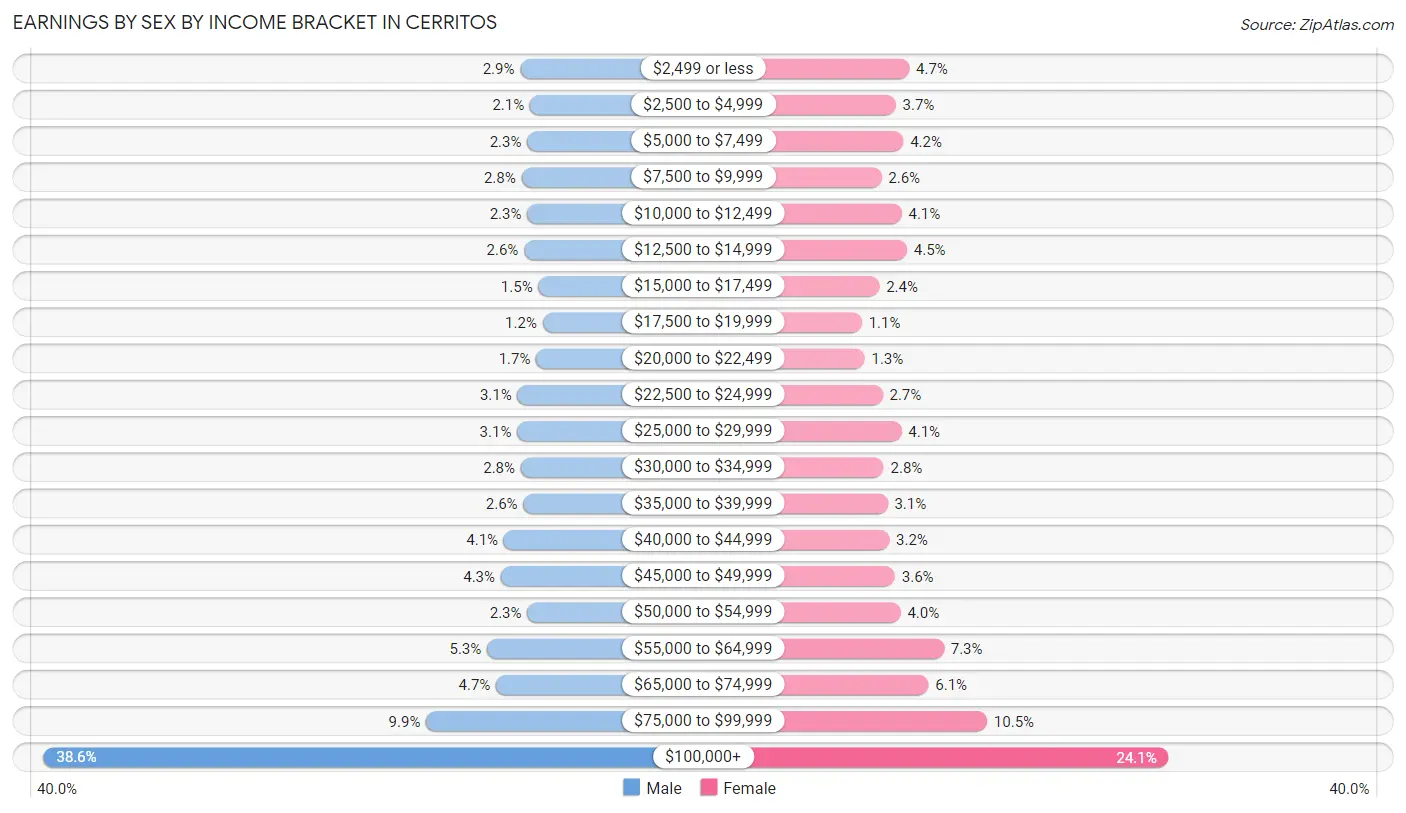
Earnings by Sex by Income Bracket in Cerritos
The most common earnings brackets in Cerritos are $100,000+ for men (4,831 | 38.6%) and $100,000+ for women (2,765 | 24.1%).
| Income | Male | Female |
| $2,499 or less | 357 (2.9%) | 536 (4.7%) |
| $2,500 to $4,999 | 265 (2.1%) | 420 (3.7%) |
| $5,000 to $7,499 | 292 (2.3%) | 485 (4.2%) |
| $7,500 to $9,999 | 345 (2.8%) | 297 (2.6%) |
| $10,000 to $12,499 | 292 (2.3%) | 470 (4.1%) |
| $12,500 to $14,999 | 320 (2.6%) | 516 (4.5%) |
| $15,000 to $17,499 | 186 (1.5%) | 279 (2.4%) |
| $17,500 to $19,999 | 146 (1.2%) | 128 (1.1%) |
| $20,000 to $22,499 | 207 (1.7%) | 152 (1.3%) |
| $22,500 to $24,999 | 383 (3.1%) | 307 (2.7%) |
| $25,000 to $29,999 | 386 (3.1%) | 469 (4.1%) |
| $30,000 to $34,999 | 352 (2.8%) | 316 (2.8%) |
| $35,000 to $39,999 | 328 (2.6%) | 350 (3.0%) |
| $40,000 to $44,999 | 511 (4.1%) | 364 (3.2%) |
| $45,000 to $49,999 | 539 (4.3%) | 413 (3.6%) |
| $50,000 to $54,999 | 290 (2.3%) | 461 (4.0%) |
| $55,000 to $64,999 | 668 (5.3%) | 834 (7.3%) |
| $65,000 to $74,999 | 583 (4.7%) | 700 (6.1%) |
| $75,000 to $99,999 | 1,239 (9.9%) | 1,204 (10.5%) |
| $100,000+ | 4,831 (38.6%) | 2,765 (24.1%) |
| Total | 12,520 (100.0%) | 11,466 (100.0%) |
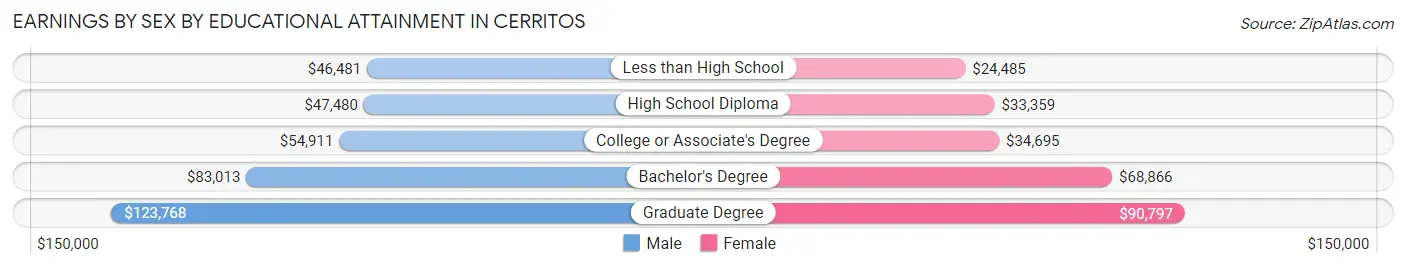
Earnings by Sex by Educational Attainment in Cerritos
Average earnings in Cerritos are $81,742 for men and $58,140 for women, a difference of 28.9%. Men with an educational attainment of graduate degree enjoy the highest average annual earnings of $123,768, while those with less than high school education earn the least with $46,481. Women with an educational attainment of graduate degree earn the most with the average annual earnings of $90,797, while those with less than high school education have the smallest earnings of $24,485.
| Educational Attainment | Male Income | Female Income |
| Less than High School | $46,481 | $24,485 |
| High School Diploma | $47,480 | $33,359 |
| College or Associate's Degree | $54,911 | $34,695 |
| Bachelor's Degree | $83,013 | $68,866 |
| Graduate Degree | $123,768 | $90,797 |
| Total | $81,742 | $58,140 |
Family Income in Cerritos
Family Income Brackets in Cerritos
According to the Cerritos family income data, there are 3,334 families falling into the $200,000+ income range, which is the most common income bracket and makes up 25.1% of all families. Conversely, the $10,000 to $14,999 income bracket is the least frequent group with only 159 families (1.2%) belonging to this category.
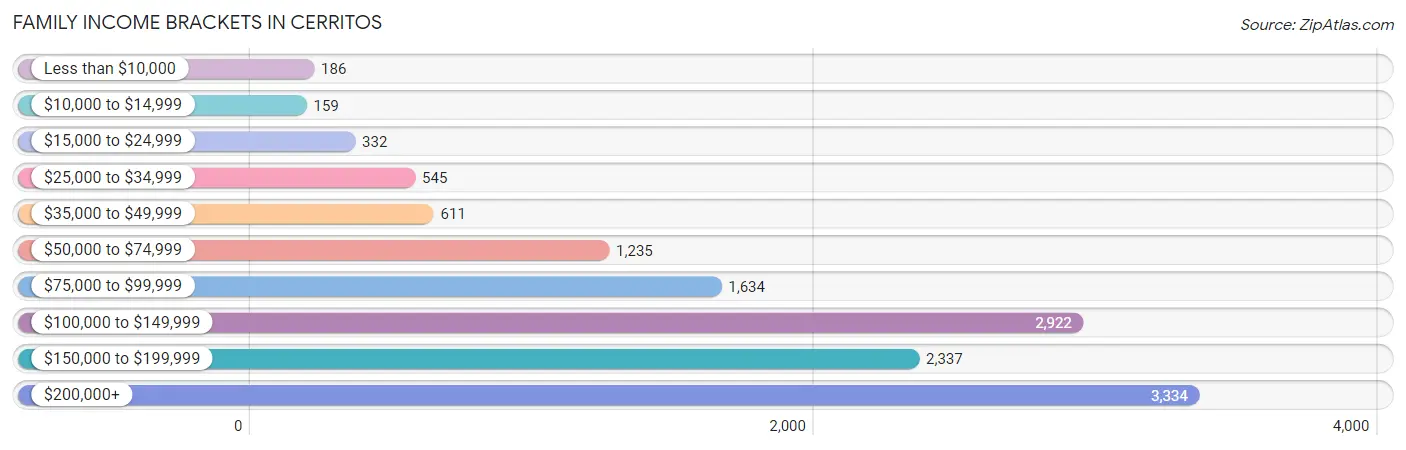
| Income Bracket | # Families | % Families |
| Less than $10,000 | 186 | 1.4% |
| $10,000 to $14,999 | 159 | 1.2% |
| $15,000 to $24,999 | 332 | 2.5% |
| $25,000 to $34,999 | 545 | 4.1% |
| $35,000 to $49,999 | 611 | 4.6% |
| $50,000 to $74,999 | 1,235 | 9.3% |
| $75,000 to $99,999 | 1,634 | 12.3% |
| $100,000 to $149,999 | 2,922 | 22.0% |
| $150,000 to $199,999 | 2,337 | 17.6% |
| $200,000+ | 3,334 | 25.1% |
Family Income by Famaliy Size in Cerritos
5-person families (1,154 | 8.7%) account for the highest median family income in Cerritos with $183,500 per family, while 2-person families (5,141 | 38.7%) have the highest median income of $46,350 per family member.
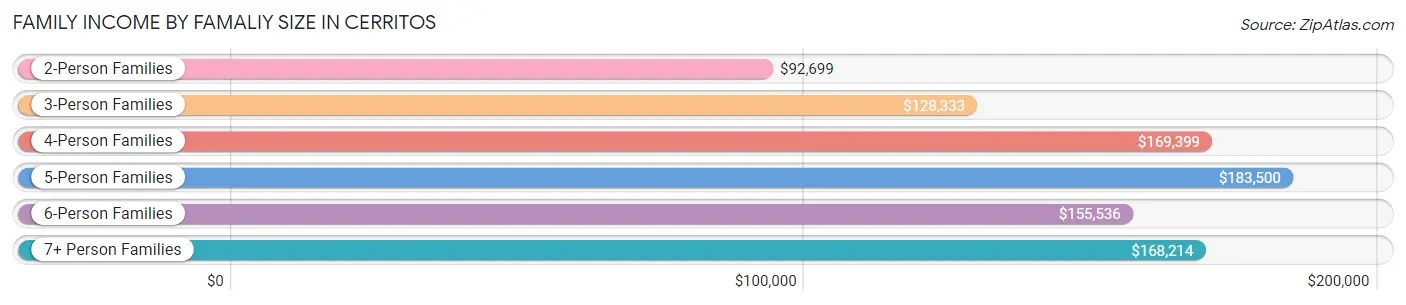
| Income Bracket | # Families | Median Income |
| 2-Person Families | 5,141 (38.7%) | $92,699 |
| 3-Person Families | 3,346 (25.2%) | $128,333 |
| 4-Person Families | 2,988 (22.5%) | $169,399 |
| 5-Person Families | 1,154 (8.7%) | $183,500 |
| 6-Person Families | 428 (3.2%) | $155,536 |
| 7+ Person Families | 224 (1.7%) | $168,214 |
| Total | 13,281 (100.0%) | $129,779 |
Family Income by Number of Earners in Cerritos
The median family income in Cerritos is $129,779, with families comprising 3+ earners (2,001) having the highest median family income of $198,015, while families with no earners (2,397) have the lowest median family income of $75,642, accounting for 15.1% and 18.0% of families, respectively.
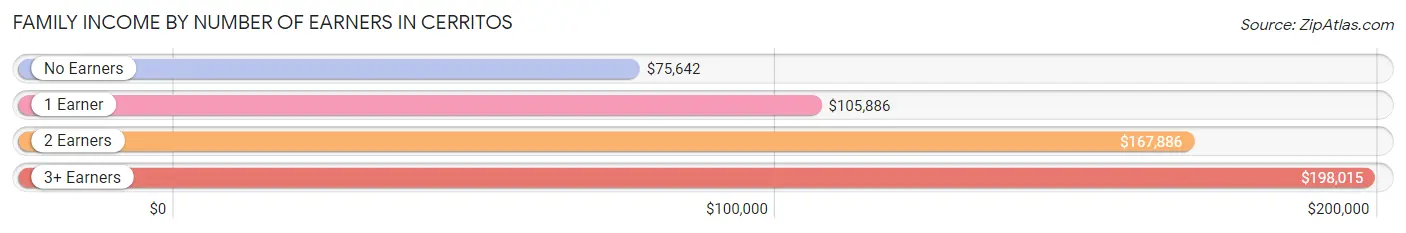
| Number of Earners | # Families | Median Income |
| No Earners | 2,397 (18.0%) | $75,642 |
| 1 Earner | 3,941 (29.7%) | $105,886 |
| 2 Earners | 4,942 (37.2%) | $167,886 |
| 3+ Earners | 2,001 (15.1%) | $198,015 |
| Total | 13,281 (100.0%) | $129,779 |
Household Income in Cerritos
Household Income Brackets in Cerritos
With 3,738 households falling in the category, the $200,000+ income range is the most frequent in Cerritos, accounting for 23.7% of all households. In contrast, only 221 households (1.4%) fall into the $10,000 to $14,999 income bracket, making it the least populous group.
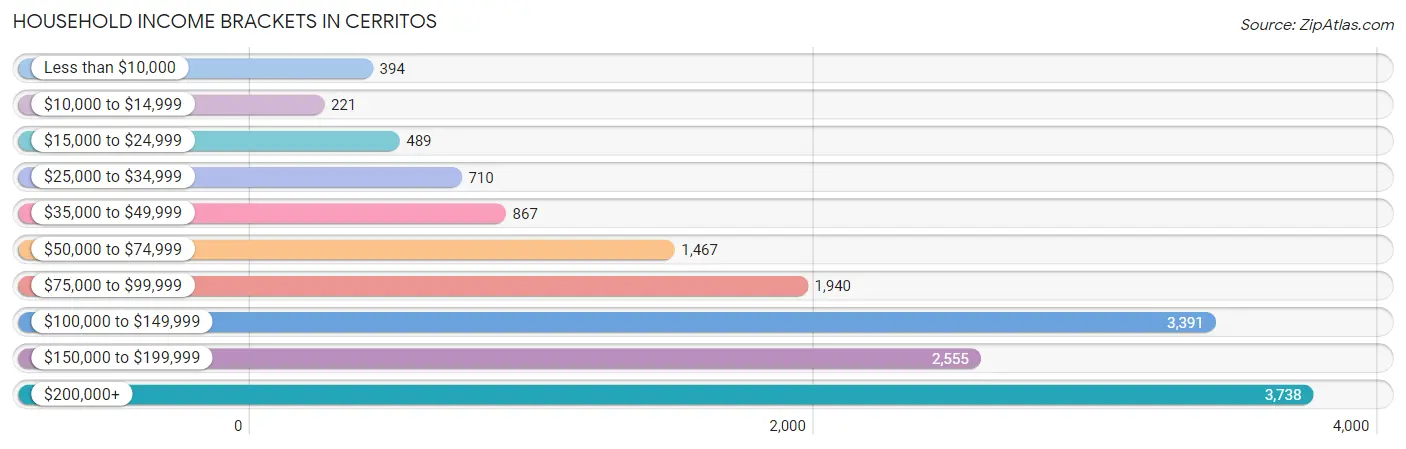
| Income Bracket | # Households | % Households |
| Less than $10,000 | 394 | 2.5% |
| $10,000 to $14,999 | 221 | 1.4% |
| $15,000 to $24,999 | 489 | 3.1% |
| $25,000 to $34,999 | 710 | 4.5% |
| $35,000 to $49,999 | 867 | 5.5% |
| $50,000 to $74,999 | 1,467 | 9.3% |
| $75,000 to $99,999 | 1,940 | 12.3% |
| $100,000 to $149,999 | 3,391 | 21.5% |
| $150,000 to $199,999 | 2,555 | 16.2% |
| $200,000+ | 3,738 | 23.7% |
Household Income by Householder Age in Cerritos
The median household income in Cerritos is $124,460, with the highest median household income of $155,467 found in the 45 to 64 years age bracket for the primary householder. A total of 6,399 households (40.6%) fall into this category. Meanwhile, the 15 to 24 years age bracket for the primary householder has the lowest median household income of $50,625, with 85 households (0.5%) in this group.
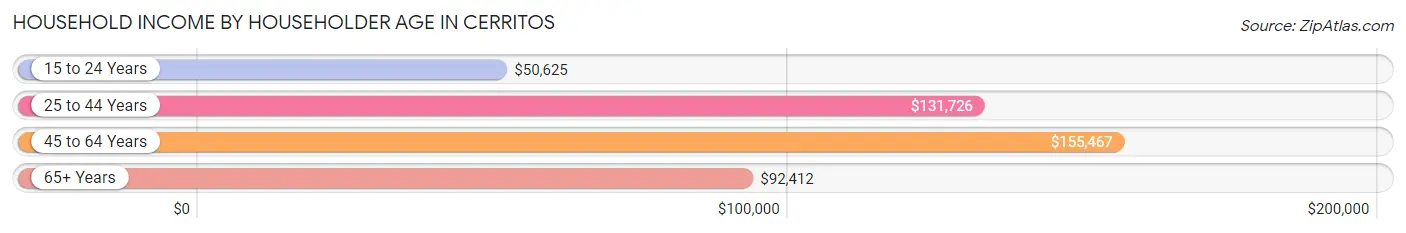
| Income Bracket | # Households | Median Income |
| 15 to 24 Years | 85 (0.5%) | $50,625 |
| 25 to 44 Years | 3,148 (20.0%) | $131,726 |
| 45 to 64 Years | 6,399 (40.6%) | $155,467 |
| 65+ Years | 6,140 (38.9%) | $92,412 |
| Total | 15,772 (100.0%) | $124,460 |
Poverty in Cerritos
Income Below Poverty by Sex and Age in Cerritos
With 5.0% poverty level for males and 5.0% for females among the residents of Cerritos, under 5 year old males and 35 to 44 year old females are the most vulnerable to poverty, with 111 males (9.5%) and 251 females (9.1%) in their respective age groups living below the poverty level.
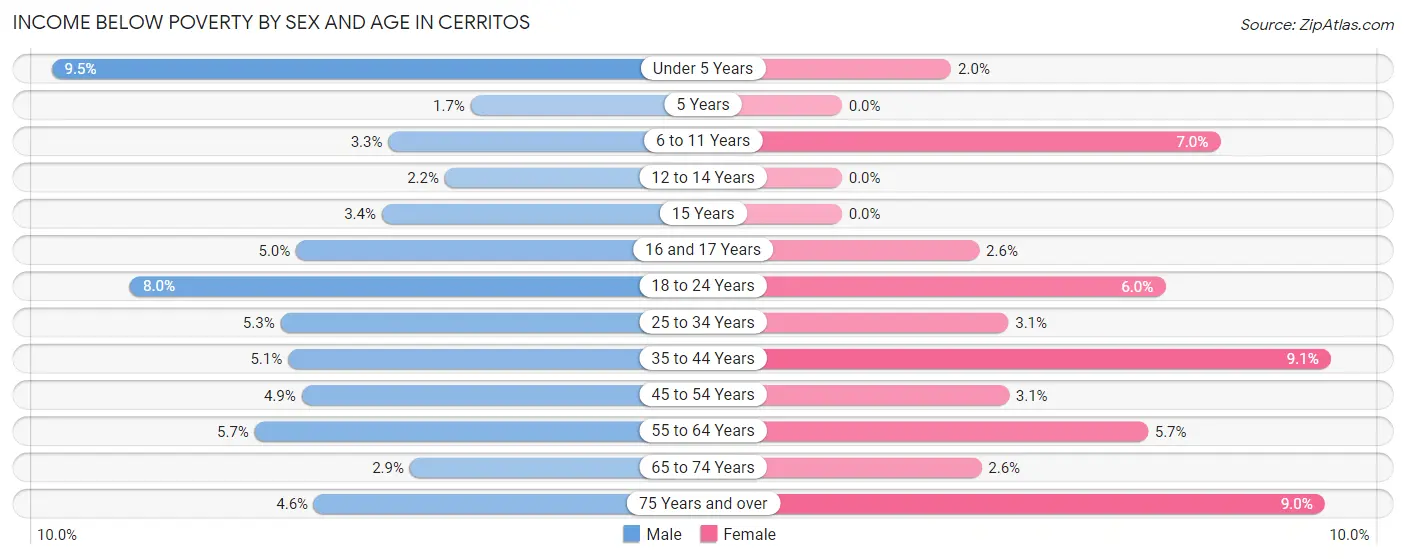
| Age Bracket | Male | Female |
| Under 5 Years | 111 (9.5%) | 18 (2.0%) |
| 5 Years | 5 (1.7%) | 0 (0.0%) |
| 6 to 11 Years | 59 (3.3%) | 85 (7.0%) |
| 12 to 14 Years | 22 (2.2%) | 0 (0.0%) |
| 15 Years | 10 (3.4%) | 0 (0.0%) |
| 16 and 17 Years | 28 (5.0%) | 11 (2.5%) |
| 18 to 24 Years | 153 (8.0%) | 105 (6.0%) |
| 25 to 34 Years | 150 (5.2%) | 81 (3.1%) |
| 35 to 44 Years | 131 (5.1%) | 251 (9.1%) |
| 45 to 54 Years | 153 (4.9%) | 97 (3.1%) |
| 55 to 64 Years | 179 (5.7%) | 200 (5.7%) |
| 65 to 74 Years | 88 (2.9%) | 94 (2.6%) |
| 75 Years and over | 125 (4.6%) | 274 (9.0%) |
| Total | 1,214 (5.0%) | 1,216 (5.0%) |
Income Above Poverty by Sex and Age in Cerritos
According to the poverty statistics in Cerritos, males aged 5 years and females aged 5 years are the age groups that are most secure financially, with 98.3% of males and 100.0% of females in these age groups living above the poverty line.
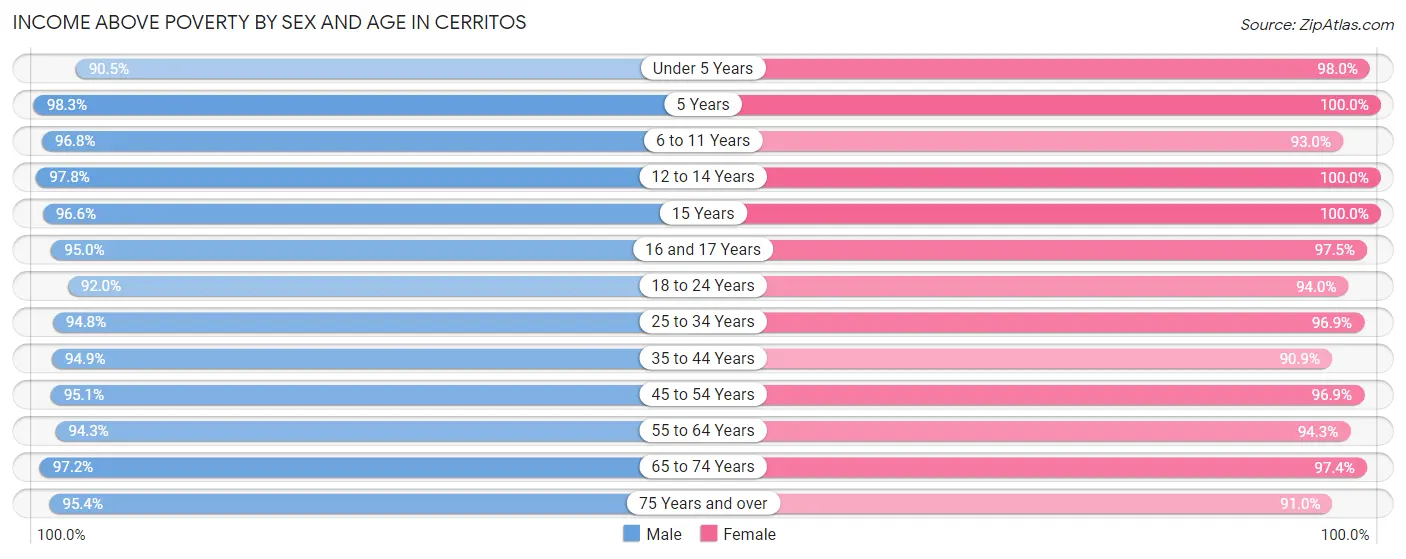
| Age Bracket | Male | Female |
| Under 5 Years | 1,057 (90.5%) | 867 (98.0%) |
| 5 Years | 285 (98.3%) | 256 (100.0%) |
| 6 to 11 Years | 1,754 (96.8%) | 1,125 (93.0%) |
| 12 to 14 Years | 978 (97.8%) | 831 (100.0%) |
| 15 Years | 287 (96.6%) | 295 (100.0%) |
| 16 and 17 Years | 536 (95.0%) | 421 (97.5%) |
| 18 to 24 Years | 1,750 (92.0%) | 1,644 (94.0%) |
| 25 to 34 Years | 2,707 (94.8%) | 2,539 (96.9%) |
| 35 to 44 Years | 2,434 (94.9%) | 2,517 (90.9%) |
| 45 to 54 Years | 2,994 (95.1%) | 3,032 (96.9%) |
| 55 to 64 Years | 2,943 (94.3%) | 3,324 (94.3%) |
| 65 to 74 Years | 3,004 (97.2%) | 3,538 (97.4%) |
| 75 Years and over | 2,577 (95.4%) | 2,785 (91.0%) |
| Total | 23,306 (95.1%) | 23,174 (95.0%) |
Income Below Poverty Among Married-Couple Families in Cerritos
The poverty statistics for married-couple families in Cerritos show that 2.1% or 211 of the total 10,285 families live below the poverty line. Families with 3 or 4 children have the highest poverty rate of 6.6%, comprising of 28 families. On the other hand, families with 5 or more children have the lowest poverty rate of 0.0%, which includes 0 families.
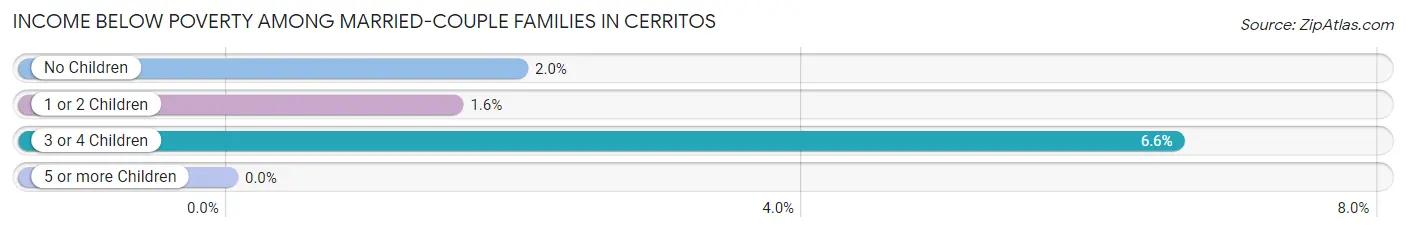
| Children | Above Poverty | Below Poverty |
| No Children | 6,268 (98.0%) | 129 (2.0%) |
| 1 or 2 Children | 3,385 (98.4%) | 54 (1.6%) |
| 3 or 4 Children | 397 (93.4%) | 28 (6.6%) |
| 5 or more Children | 24 (100.0%) | 0 (0.0%) |
| Total | 10,074 (98.0%) | 211 (2.1%) |
Income Below Poverty Among Single-Parent Households in Cerritos
According to the poverty data in Cerritos, 14.7% or 136 single-father households and 10.6% or 219 single-mother households are living below the poverty line. Among single-father households, those with 1 or 2 children have the highest poverty rate, with 47 households (42.0%) experiencing poverty. Likewise, among single-mother households, those with no children have the highest poverty rate, with 146 households (11.7%) falling below the poverty line.
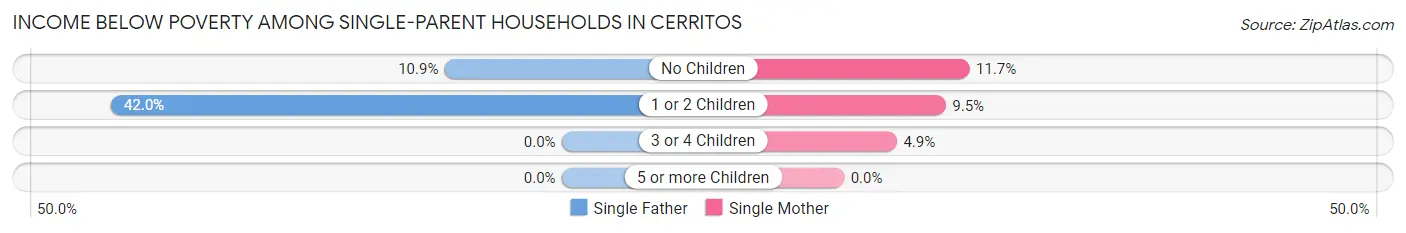
| Children | Single Father | Single Mother |
| No Children | 89 (10.9%) | 146 (11.7%) |
| 1 or 2 Children | 47 (42.0%) | 70 (9.5%) |
| 3 or 4 Children | 0 (0.0%) | 3 (4.9%) |
| 5 or more Children | 0 (0.0%) | 0 (0.0%) |
| Total | 136 (14.7%) | 219 (10.6%) |
Income Below Poverty Among Married-Couple vs Single-Parent Households in Cerritos
The poverty data for Cerritos shows that 211 of the married-couple family households (2.1%) and 355 of the single-parent households (11.8%) are living below the poverty level. Within the married-couple family households, those with 3 or 4 children have the highest poverty rate, with 28 households (6.6%) falling below the poverty line. Among the single-parent households, those with 1 or 2 children have the highest poverty rate, with 117 household (13.8%) living below poverty.
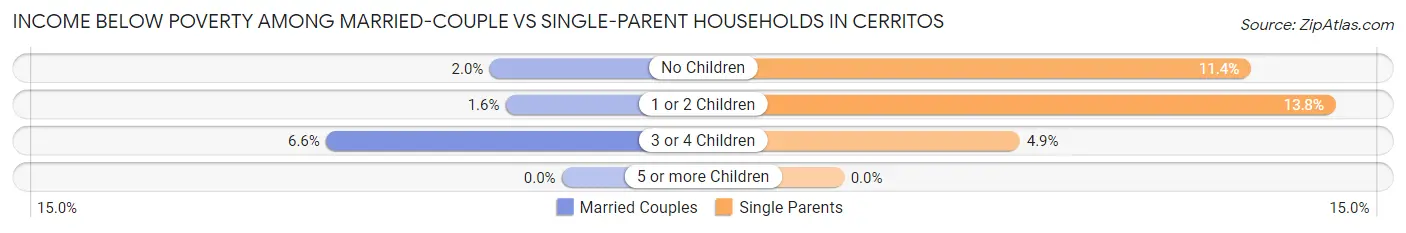
| Children | Married-Couple Families | Single-Parent Households |
| No Children | 129 (2.0%) | 235 (11.4%) |
| 1 or 2 Children | 54 (1.6%) | 117 (13.8%) |
| 3 or 4 Children | 28 (6.6%) | 3 (4.9%) |
| 5 or more Children | 0 (0.0%) | 0 (0.0%) |
| Total | 211 (2.1%) | 355 (11.8%) |
Race in Cerritos
The most populous races in Cerritos are Asian (29,733 | 60.7%), White / Caucasian (7,753 | 15.8%), and Hispanic or Latino (6,856 | 14.0%).
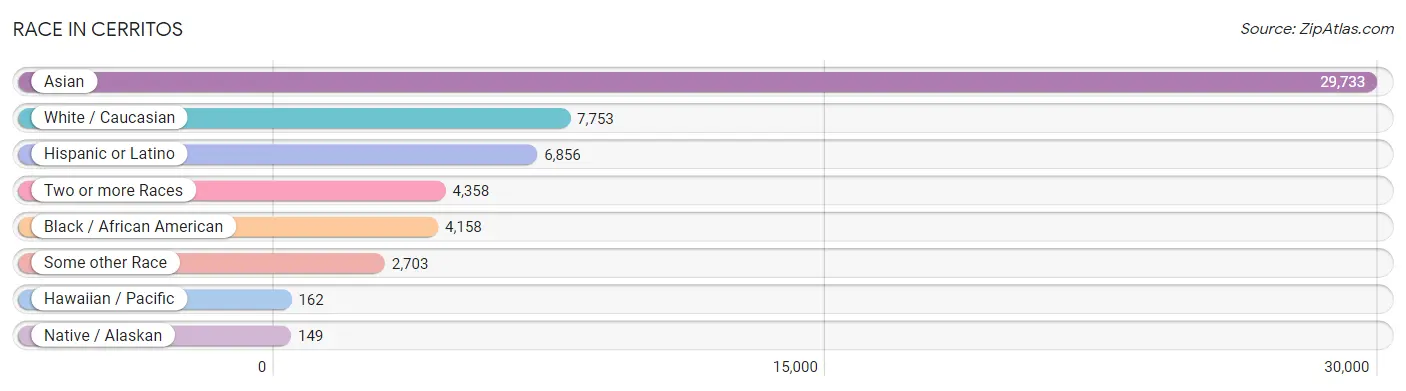
| Race | # Population | % Population |
| Asian | 29,733 | 60.7% |
| Black / African American | 4,158 | 8.5% |
| Hawaiian / Pacific | 162 | 0.3% |
| Hispanic or Latino | 6,856 | 14.0% |
| Native / Alaskan | 149 | 0.3% |
| White / Caucasian | 7,753 | 15.8% |
| Two or more Races | 4,358 | 8.9% |
| Some other Race | 2,703 | 5.5% |
| Total | 49,016 | 100.0% |
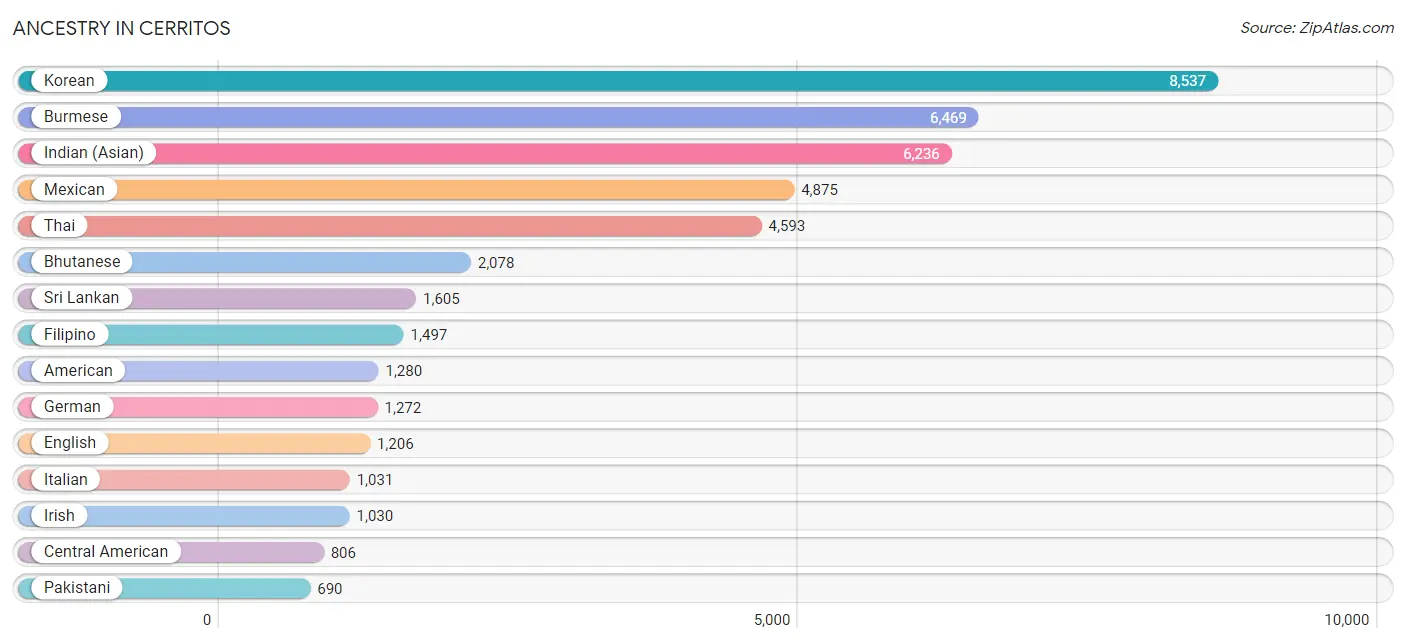
Ancestry in Cerritos
The most populous ancestries reported in Cerritos are Korean (8,537 | 17.4%), Burmese (6,469 | 13.2%), Indian (Asian) (6,236 | 12.7%), Mexican (4,875 | 10.0%), and Thai (4,593 | 9.4%), together accounting for 62.7% of all Cerritos residents.
| Ancestry | # Population | % Population |
| Afghan | 36 | 0.1% |
| African | 181 | 0.4% |
| American | 1,280 | 2.6% |
| Arab | 269 | 0.5% |
| Argentinean | 113 | 0.2% |
| Armenian | 60 | 0.1% |
| Assyrian / Chaldean / Syriac | 14 | 0.0% |
| Australian | 6 | 0.0% |
| Austrian | 40 | 0.1% |
| Bangladeshi | 11 | 0.0% |
| Basque | 5 | 0.0% |
| Belizean | 42 | 0.1% |
| Bhutanese | 2,078 | 4.2% |
| Blackfeet | 67 | 0.1% |
| British | 51 | 0.1% |
| Burmese | 6,469 | 13.2% |
| Cambodian | 26 | 0.1% |
| Canadian | 100 | 0.2% |
| Central American | 806 | 1.6% |
| Central American Indian | 25 | 0.1% |
| Cherokee | 66 | 0.1% |
| Chinese | 55 | 0.1% |
| Chippewa | 15 | 0.0% |
| Colombian | 55 | 0.1% |
| Costa Rican | 28 | 0.1% |
| Creek | 9 | 0.0% |
| Croatian | 224 | 0.5% |
| Cuban | 184 | 0.4% |
| Czech | 17 | 0.0% |
| Czechoslovakian | 8 | 0.0% |
| Danish | 103 | 0.2% |
| Dominican | 17 | 0.0% |
| Dutch | 526 | 1.1% |
| Eastern European | 68 | 0.1% |
| Ecuadorian | 132 | 0.3% |
| Egyptian | 73 | 0.2% |
| English | 1,206 | 2.5% |
| Ethiopian | 33 | 0.1% |
| European | 233 | 0.5% |
| Filipino | 1,497 | 3.0% |
| French | 585 | 1.2% |
| French Canadian | 75 | 0.2% |
| German | 1,272 | 2.6% |
| Ghanaian | 9 | 0.0% |
| Greek | 63 | 0.1% |
| Guamanian / Chamorro | 106 | 0.2% |
| Guatemalan | 63 | 0.1% |
| Guyanese | 6 | 0.0% |
| Hmong | 15 | 0.0% |
| Honduran | 191 | 0.4% |
| Indian (Asian) | 6,236 | 12.7% |
| Iranian | 50 | 0.1% |
| Irish | 1,030 | 2.1% |
| Italian | 1,031 | 2.1% |
| Jamaican | 23 | 0.1% |
| Japanese | 436 | 0.9% |
| Korean | 8,537 | 17.4% |
| Laotian | 69 | 0.1% |
| Lebanese | 72 | 0.2% |
| Lithuanian | 19 | 0.0% |
| Malaysian | 108 | 0.2% |
| Mexican | 4,875 | 10.0% |
| Mexican American Indian | 49 | 0.1% |
| Native Hawaiian | 19 | 0.0% |
| Nicaraguan | 128 | 0.3% |
| Nigerian | 105 | 0.2% |
| Northern European | 17 | 0.0% |
| Norwegian | 116 | 0.2% |
| Pakistani | 690 | 1.4% |
| Palestinian | 51 | 0.1% |
| Pennsylvania German | 9 | 0.0% |
| Peruvian | 226 | 0.5% |
| Polish | 185 | 0.4% |
| Portuguese | 167 | 0.3% |
| Puerto Rican | 90 | 0.2% |
| Romanian | 37 | 0.1% |
| Russian | 56 | 0.1% |
| Salvadoran | 363 | 0.7% |
| Samoan | 49 | 0.1% |
| Scandinavian | 77 | 0.2% |
| Scotch-Irish | 78 | 0.2% |
| Scottish | 197 | 0.4% |
| Slavic | 12 | 0.0% |
| Slovak | 7 | 0.0% |
| Slovene | 15 | 0.0% |
| South American | 530 | 1.1% |
| South American Indian | 11 | 0.0% |
| Spaniard | 89 | 0.2% |
| Spanish | 43 | 0.1% |
| Sri Lankan | 1,605 | 3.3% |
| Subsaharan African | 324 | 0.7% |
| Swedish | 153 | 0.3% |
| Swiss | 22 | 0.0% |
| Syrian | 21 | 0.0% |
| Thai | 4,593 | 9.4% |
| Turkish | 14 | 0.0% |
| Ugandan | 9 | 0.0% |
| Ukrainian | 15 | 0.0% |
| Venezuelan | 4 | 0.0% |
| Vietnamese | 195 | 0.4% |
| Welsh | 18 | 0.0% |
| Yaqui | 11 | 0.0% |
| Yugoslavian | 16 | 0.0% | View All 103 Rows |
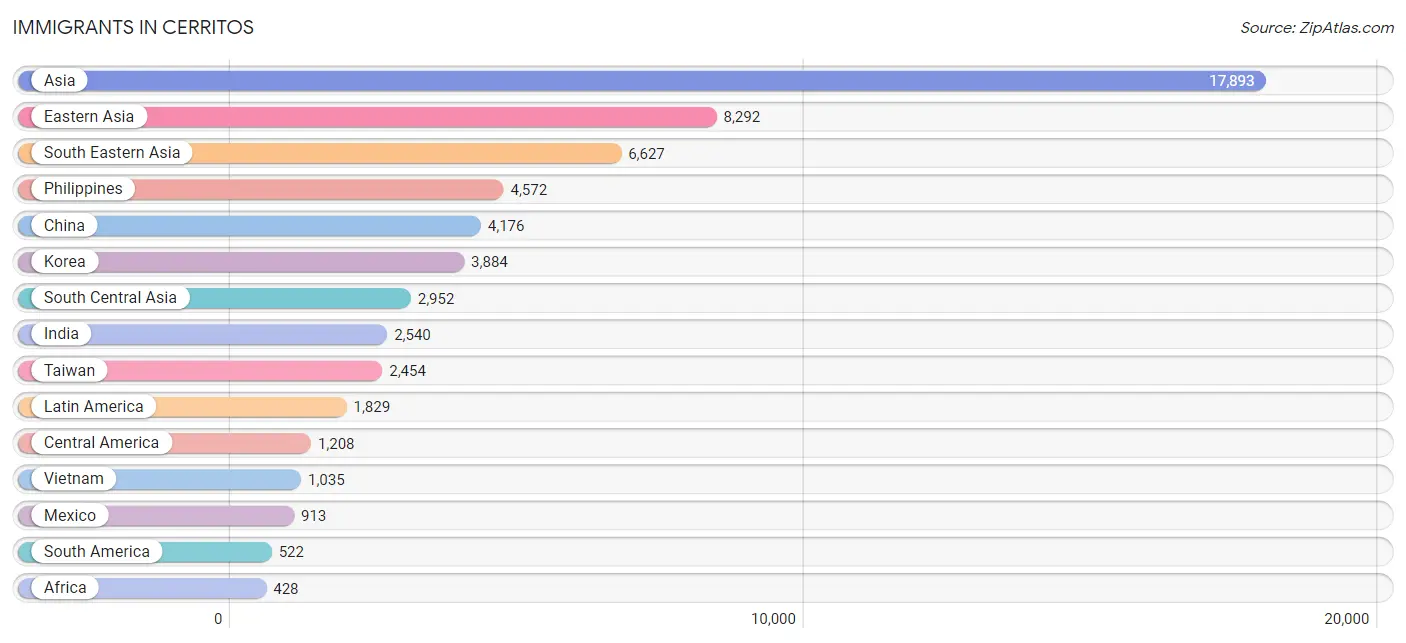
Immigrants in Cerritos
The most numerous immigrant groups reported in Cerritos came from Asia (17,893 | 36.5%), Eastern Asia (8,292 | 16.9%), South Eastern Asia (6,627 | 13.5%), Philippines (4,572 | 9.3%), and China (4,176 | 8.5%), together accounting for 84.8% of all Cerritos residents.
| Immigration Origin | # Population | % Population |
| Africa | 428 | 0.9% |
| Argentina | 113 | 0.2% |
| Asia | 17,893 | 36.5% |
| Austria | 7 | 0.0% |
| Azores | 53 | 0.1% |
| Bangladesh | 133 | 0.3% |
| Brazil | 12 | 0.0% |
| Cambodia | 301 | 0.6% |
| Cameroon | 116 | 0.2% |
| Canada | 167 | 0.3% |
| Caribbean | 99 | 0.2% |
| Central America | 1,208 | 2.5% |
| Chile | 81 | 0.2% |
| China | 4,176 | 8.5% |
| Colombia | 57 | 0.1% |
| Costa Rica | 7 | 0.0% |
| Cuba | 75 | 0.2% |
| Dominican Republic | 5 | 0.0% |
| Eastern Africa | 131 | 0.3% |
| Eastern Asia | 8,292 | 16.9% |
| Eastern Europe | 76 | 0.2% |
| Ecuador | 80 | 0.2% |
| Egypt | 85 | 0.2% |
| El Salvador | 133 | 0.3% |
| England | 64 | 0.1% |
| Eritrea | 16 | 0.0% |
| Ethiopia | 7 | 0.0% |
| Europe | 403 | 0.8% |
| Fiji | 52 | 0.1% |
| Germany | 31 | 0.1% |
| Ghana | 9 | 0.0% |
| Greece | 9 | 0.0% |
| Guatemala | 20 | 0.0% |
| Guyana | 72 | 0.2% |
| Honduras | 101 | 0.2% |
| Hong Kong | 189 | 0.4% |
| India | 2,540 | 5.2% |
| Indonesia | 225 | 0.5% |
| Iran | 38 | 0.1% |
| Ireland | 9 | 0.0% |
| Jamaica | 19 | 0.0% |
| Japan | 220 | 0.4% |
| Kenya | 58 | 0.1% |
| Korea | 3,884 | 7.9% |
| Kuwait | 13 | 0.0% |
| Laos | 74 | 0.2% |
| Latin America | 1,829 | 3.7% |
| Malaysia | 41 | 0.1% |
| Mexico | 913 | 1.9% |
| Middle Africa | 124 | 0.3% |
| Morocco | 12 | 0.0% |
| Netherlands | 36 | 0.1% |
| Nicaragua | 30 | 0.1% |
| Nigeria | 54 | 0.1% |
| Northern Africa | 97 | 0.2% |
| Northern Europe | 174 | 0.4% |
| Oceania | 73 | 0.2% |
| Pakistan | 145 | 0.3% |
| Panama | 4 | 0.0% |
| Peru | 98 | 0.2% |
| Philippines | 4,572 | 9.3% |
| Portugal | 70 | 0.1% |
| Romania | 9 | 0.0% |
| Russia | 21 | 0.0% |
| Serbia | 6 | 0.0% |
| South Africa | 13 | 0.0% |
| South America | 522 | 1.1% |
| South Central Asia | 2,952 | 6.0% |
| South Eastern Asia | 6,627 | 13.5% |
| Southern Europe | 79 | 0.2% |
| Sri Lanka | 96 | 0.2% |
| Taiwan | 2,454 | 5.0% |
| Thailand | 351 | 0.7% |
| Uganda | 19 | 0.0% |
| Venezuela | 4 | 0.0% |
| Vietnam | 1,035 | 2.1% |
| Western Africa | 63 | 0.1% |
| Western Asia | 13 | 0.0% |
| Western Europe | 74 | 0.2% | View All 79 Rows |
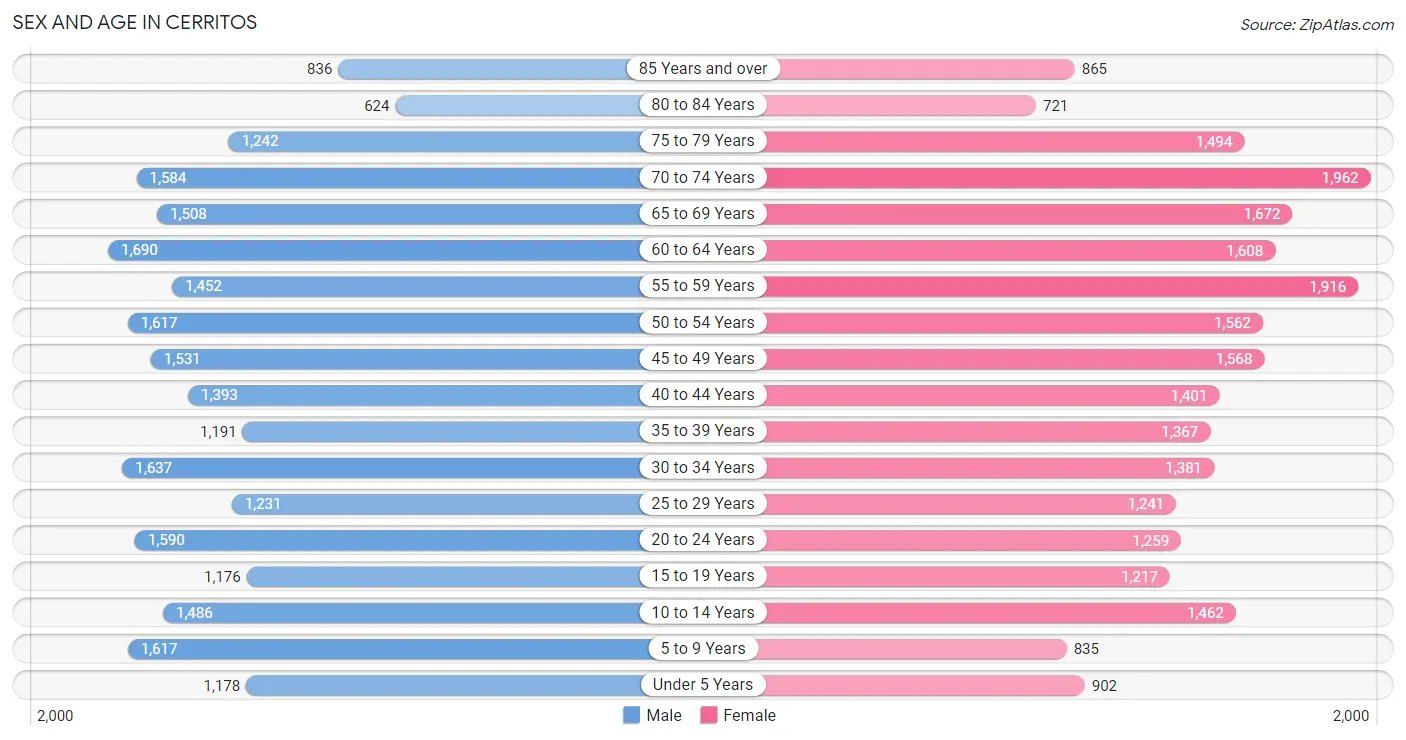
Sex and Age in Cerritos
Sex and Age in Cerritos
The most populous age groups in Cerritos are 60 to 64 Years (1,690 | 6.9%) for men and 70 to 74 Years (1,962 | 8.0%) for women.
| Age Bracket | Male | Female |
| Under 5 Years | 1,178 (4.8%) | 902 (3.7%) |
| 5 to 9 Years | 1,617 (6.6%) | 835 (3.4%) |
| 10 to 14 Years | 1,486 (6.0%) | 1,462 (6.0%) |
| 15 to 19 Years | 1,176 (4.8%) | 1,217 (5.0%) |
| 20 to 24 Years | 1,590 (6.5%) | 1,259 (5.1%) |
| 25 to 29 Years | 1,231 (5.0%) | 1,241 (5.1%) |
| 30 to 34 Years | 1,637 (6.7%) | 1,381 (5.7%) |
| 35 to 39 Years | 1,191 (4.8%) | 1,367 (5.6%) |
| 40 to 44 Years | 1,393 (5.7%) | 1,401 (5.7%) |
| 45 to 49 Years | 1,531 (6.2%) | 1,568 (6.4%) |
| 50 to 54 Years | 1,617 (6.6%) | 1,562 (6.4%) |
| 55 to 59 Years | 1,452 (5.9%) | 1,916 (7.8%) |
| 60 to 64 Years | 1,690 (6.9%) | 1,608 (6.6%) |
| 65 to 69 Years | 1,508 (6.1%) | 1,672 (6.8%) |
| 70 to 74 Years | 1,584 (6.4%) | 1,962 (8.0%) |
| 75 to 79 Years | 1,242 (5.1%) | 1,494 (6.1%) |
| 80 to 84 Years | 624 (2.5%) | 721 (2.9%) |
| 85 Years and over | 836 (3.4%) | 865 (3.5%) |
| Total | 24,583 (100.0%) | 24,433 (100.0%) |
Families and Households in Cerritos
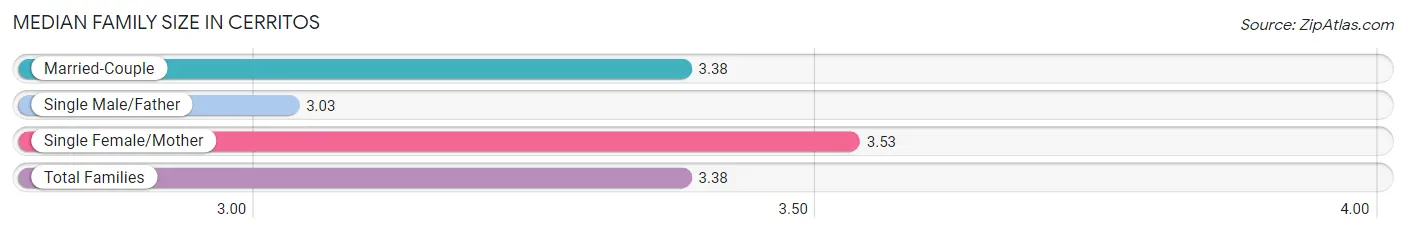
Median Family Size in Cerritos
The median family size in Cerritos is 3.38 persons per family, with single female/mother families (2,069 | 15.6%) accounting for the largest median family size of 3.53 persons per family. On the other hand, single male/father families (927 | 7.0%) represent the smallest median family size with 3.03 persons per family.
| Family Type | # Families | Family Size |
| Married-Couple | 10,285 (77.4%) | 3.38 |
| Single Male/Father | 927 (7.0%) | 3.03 |
| Single Female/Mother | 2,069 (15.6%) | 3.53 |
| Total Families | 13,281 (100.0%) | 3.38 |
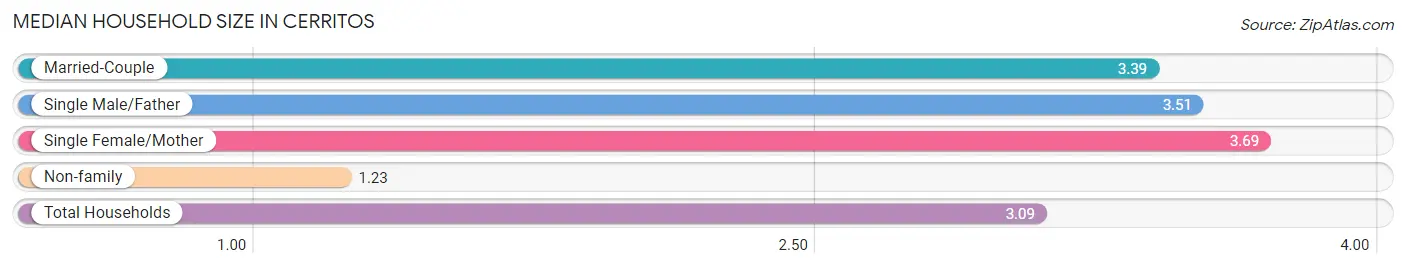
Median Household Size in Cerritos
The median household size in Cerritos is 3.09 persons per household, with single female/mother households (2,069 | 13.1%) accounting for the largest median household size of 3.69 persons per household. non-family households (2,491 | 15.8%) represent the smallest median household size with 1.23 persons per household.
| Household Type | # Households | Household Size |
| Married-Couple | 10,285 (65.2%) | 3.39 |
| Single Male/Father | 927 (5.9%) | 3.51 |
| Single Female/Mother | 2,069 (13.1%) | 3.69 |
| Non-family | 2,491 (15.8%) | 1.23 |
| Total Households | 15,772 (100.0%) | 3.09 |
Household Size by Marriage Status in Cerritos
Out of a total of 15,772 households in Cerritos, 13,281 (84.2%) are family households, while 2,491 (15.8%) are nonfamily households. The most numerous type of family households are 2-person households, comprising 4,910, and the most common type of nonfamily households are 1-person households, comprising 2,109.
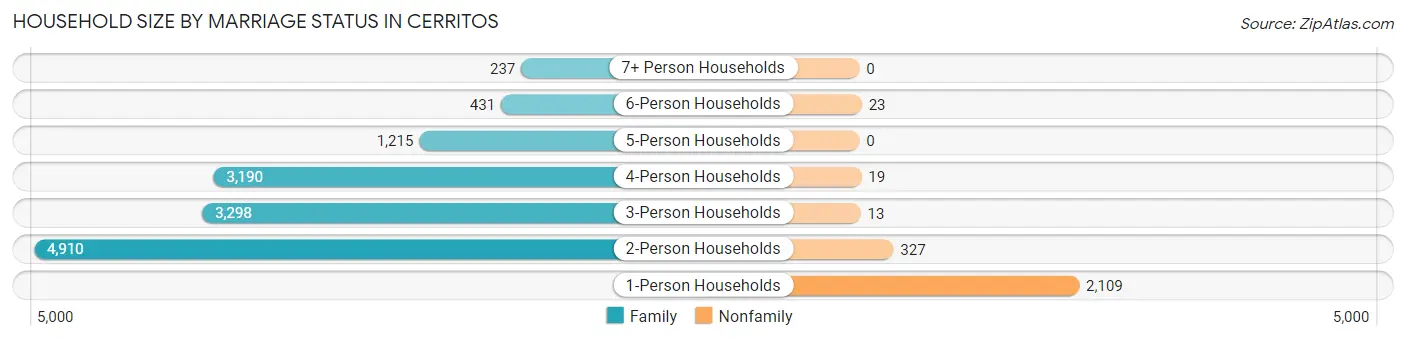
| Household Size | Family Households | Nonfamily Households |
| 1-Person Households | - | 2,109 (13.4%) |
| 2-Person Households | 4,910 (31.1%) | 327 (2.1%) |
| 3-Person Households | 3,298 (20.9%) | 13 (0.1%) |
| 4-Person Households | 3,190 (20.2%) | 19 (0.1%) |
| 5-Person Households | 1,215 (7.7%) | 0 (0.0%) |
| 6-Person Households | 431 (2.7%) | 23 (0.2%) |
| 7+ Person Households | 237 (1.5%) | 0 (0.0%) |
| Total | 13,281 (84.2%) | 2,491 (15.8%) |
Female Fertility in Cerritos
Fertility by Age in Cerritos
Average fertility rate in Cerritos is 50.0 births per 1,000 women. Women in the age bracket of 20 to 34 years have the highest fertility rate with 74.0 births per 1,000 women. Women in the age bracket of 20 to 34 years acount for 58.6% of all women with births.
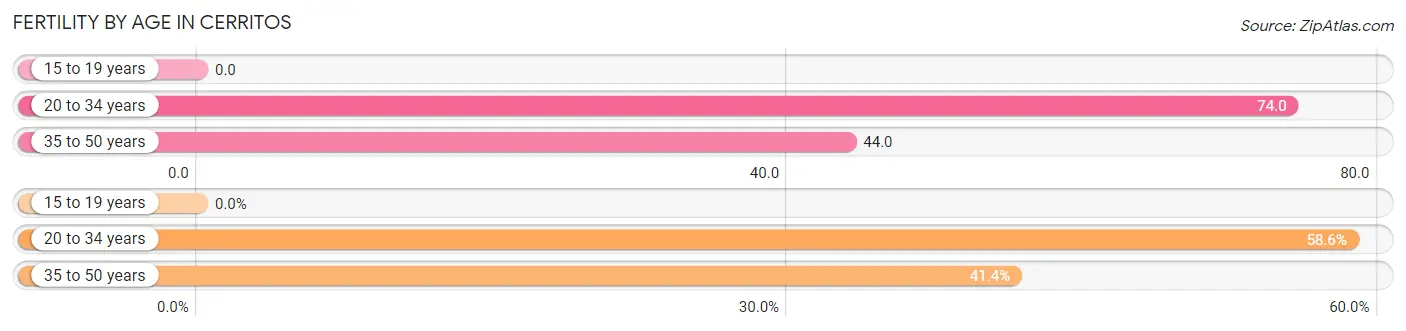
| Age Bracket | Women with Births | Births / 1,000 Women |
| 15 to 19 years | 0 (0.0%) | 0.0 |
| 20 to 34 years | 287 (58.6%) | 74.0 |
| 35 to 50 years | 203 (41.4%) | 44.0 |
| Total | 490 (100.0%) | 50.0 |
Fertility by Age by Marriage Status in Cerritos
81.0% of women with births (490) in Cerritos are married. The highest percentage of unmarried women with births falls into 35 to 50 years age bracket with 33.0% of them unmarried at the time of birth, while the lowest percentage of unmarried women with births belong to 20 to 34 years age bracket with 9.1% of them unmarried.
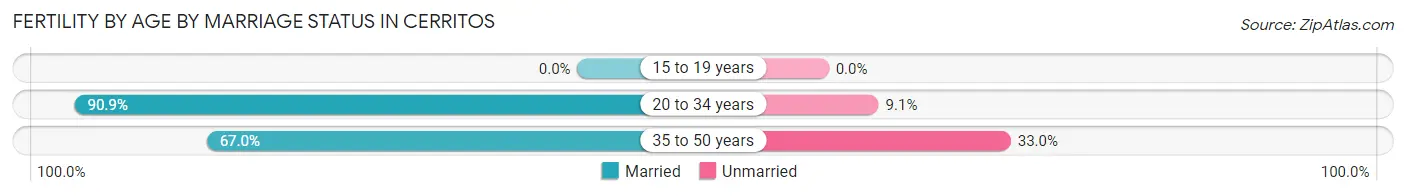
| Age Bracket | Married | Unmarried |
| 15 to 19 years | 0 (0.0%) | 0 (0.0%) |
| 20 to 34 years | 261 (90.9%) | 26 (9.1%) |
| 35 to 50 years | 136 (67.0%) | 67 (33.0%) |
| Total | 397 (81.0%) | 93 (19.0%) |
Fertility by Education in Cerritos
Average fertility rate in Cerritos is 50.0 births per 1,000 women. Women with the education attainment of graduate degree have the highest fertility rate of 107.0 births per 1,000 women, while women with the education attainment of less than high school have the lowest fertility at 23.0 births per 1,000 women. Women with the education attainment of graduate degree represent 37.3% of all women with births.
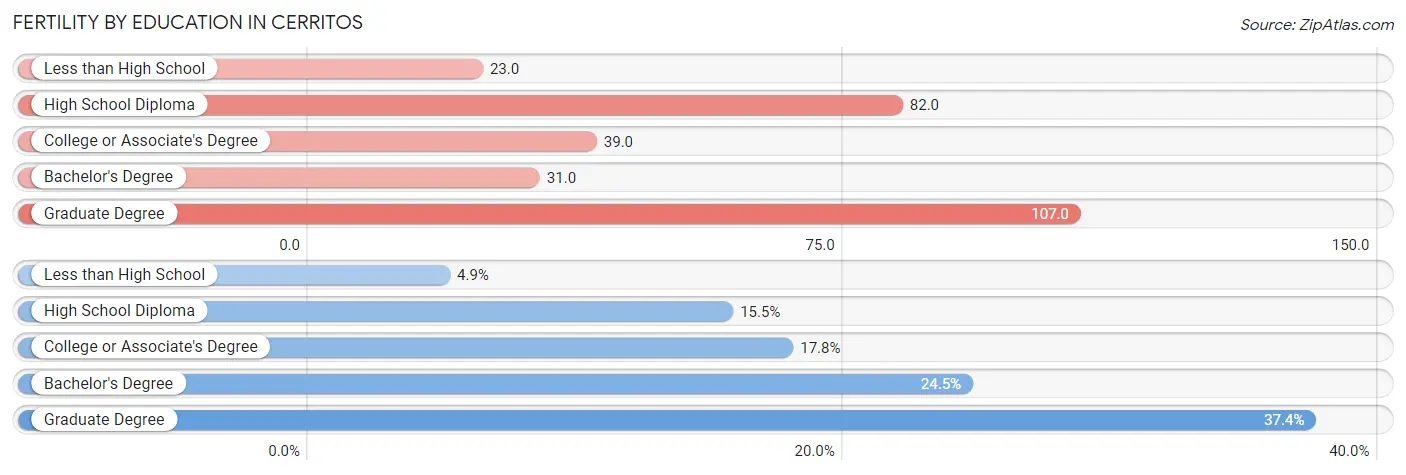
| Educational Attainment | Women with Births | Births / 1,000 Women |
| Less than High School | 24 (4.9%) | 23.0 |
| High School Diploma | 76 (15.5%) | 82.0 |
| College or Associate's Degree | 87 (17.8%) | 39.0 |
| Bachelor's Degree | 120 (24.5%) | 31.0 |
| Graduate Degree | 183 (37.3%) | 107.0 |
| Total | 490 (100.0%) | 50.0 |
Fertility by Education by Marriage Status in Cerritos
19.0% of women with births in Cerritos are unmarried. Women with the educational attainment of less than high school are most likely to be married with 100.0% of them married at childbirth, while women with the educational attainment of college or associate's degree are least likely to be married with 37.9% of them unmarried at childbirth.
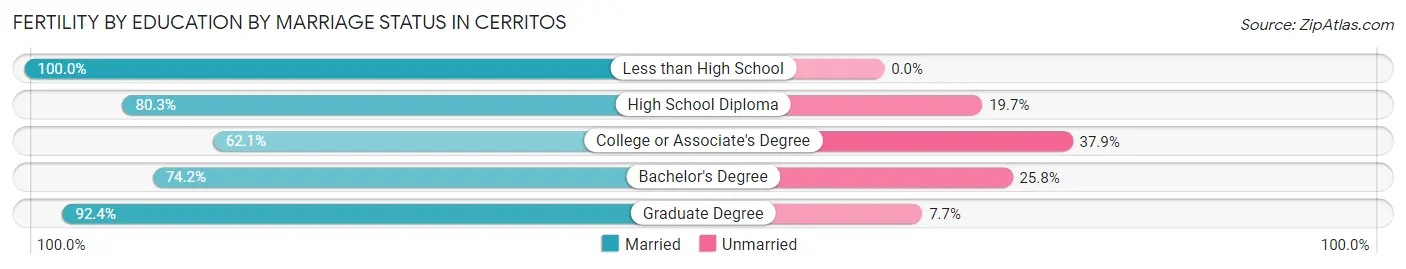
| Educational Attainment | Married | Unmarried |
| Less than High School | 24 (100.0%) | 0 (0.0%) |
| High School Diploma | 61 (80.3%) | 15 (19.7%) |
| College or Associate's Degree | 54 (62.1%) | 33 (37.9%) |
| Bachelor's Degree | 89 (74.2%) | 31 (25.8%) |
| Graduate Degree | 169 (92.3%) | 14 (7.6%) |
| Total | 397 (81.0%) | 93 (19.0%) |
Employment Characteristics in Cerritos
Employment by Class of Employer in Cerritos
Among the 21,926 employed individuals in Cerritos, private company employees (13,568 | 61.9%), local government employees (2,538 | 11.6%), and not-for-profit organizations (1,664 | 7.6%) make up the most common classes of employment.
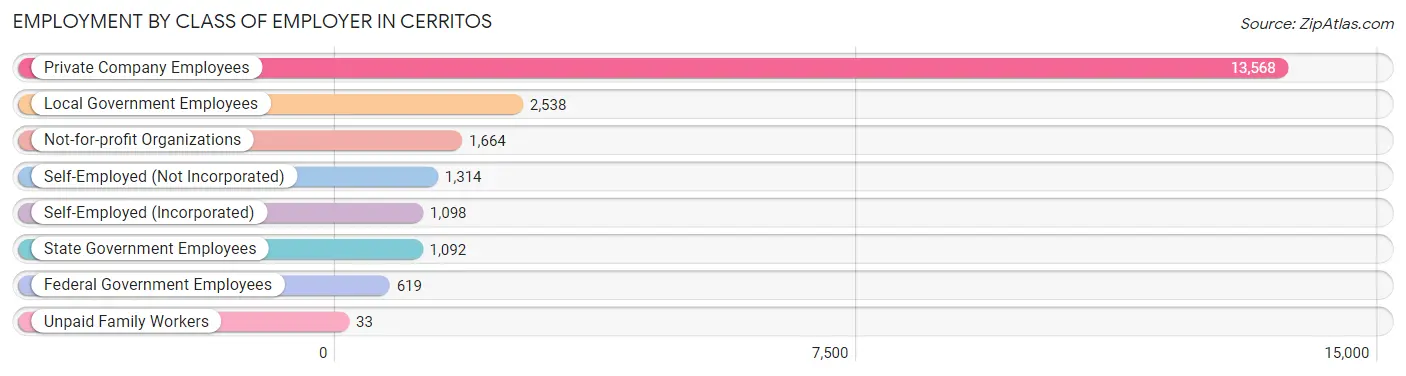
| Employer Class | # Employees | % Employees |
| Private Company Employees | 13,568 | 61.9% |
| Self-Employed (Incorporated) | 1,098 | 5.0% |
| Self-Employed (Not Incorporated) | 1,314 | 6.0% |
| Not-for-profit Organizations | 1,664 | 7.6% |
| Local Government Employees | 2,538 | 11.6% |
| State Government Employees | 1,092 | 5.0% |
| Federal Government Employees | 619 | 2.8% |
| Unpaid Family Workers | 33 | 0.2% |
| Total | 21,926 | 100.0% |
Employment Status by Age in Cerritos
According to the labor force statistics for Cerritos, out of the total population over 16 years of age (40,944), 57.9% or 23,707 individuals are in the labor force, with 5.4% or 1,280 of them unemployed. The age group with the highest labor force participation rate is 30 to 34 years, with 87.6% or 2,644 individuals in the labor force. Within the labor force, the 20 to 24 years age range has the highest percentage of unemployed individuals, with 19.2% or 416 of them being unemployed.
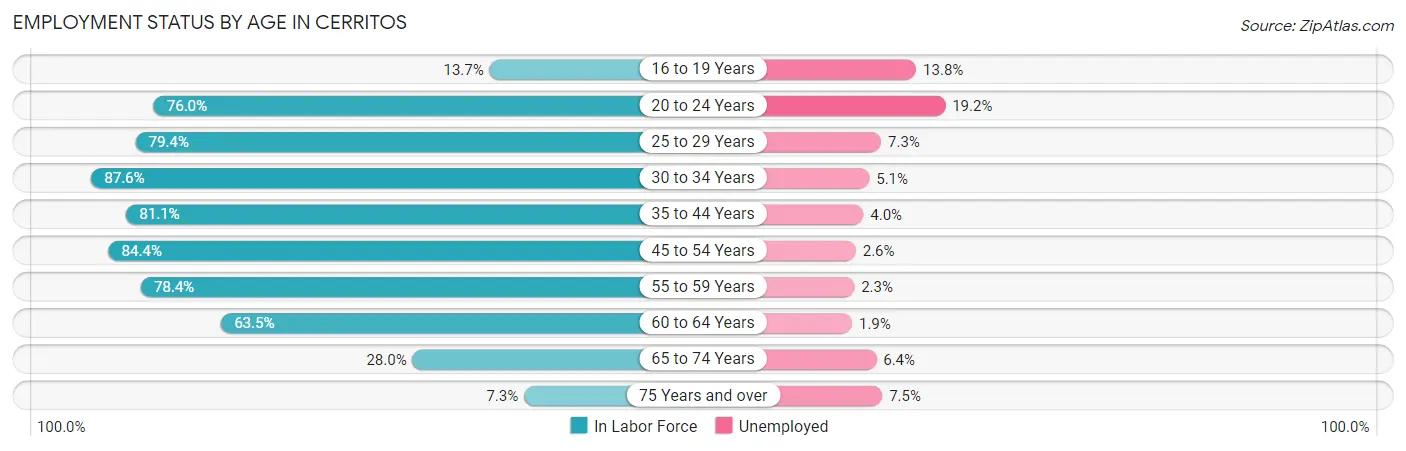
| Age Bracket | In Labor Force | Unemployed |
| 16 to 19 Years | 247 (13.7%) | 34 (13.8%) |
| 20 to 24 Years | 2,165 (76.0%) | 416 (19.2%) |
| 25 to 29 Years | 1,963 (79.4%) | 143 (7.3%) |
| 30 to 34 Years | 2,644 (87.6%) | 135 (5.1%) |
| 35 to 44 Years | 4,340 (81.1%) | 174 (4.0%) |
| 45 to 54 Years | 5,299 (84.4%) | 138 (2.6%) |
| 55 to 59 Years | 2,641 (78.4%) | 61 (2.3%) |
| 60 to 64 Years | 2,094 (63.5%) | 40 (1.9%) |
| 65 to 74 Years | 1,883 (28.0%) | 121 (6.4%) |
| 75 Years and over | 422 (7.3%) | 32 (7.5%) |
| Total | 23,707 (57.9%) | 1,280 (5.4%) |
Employment Status by Educational Attainment in Cerritos
According to labor force statistics for Cerritos, 79.8% of individuals (18,981) out of the total population between 25 and 64 years of age (23,786) are in the labor force, with 3.6% or 683 of them being unemployed. The group with the highest labor force participation rate are those with the educational attainment of bachelor's degree or higher, with 85.0% or 12,109 individuals in the labor force. Within the labor force, individuals with high school diploma education have the highest percentage of unemployment, with 6.2% or 116 of them being unemployed.
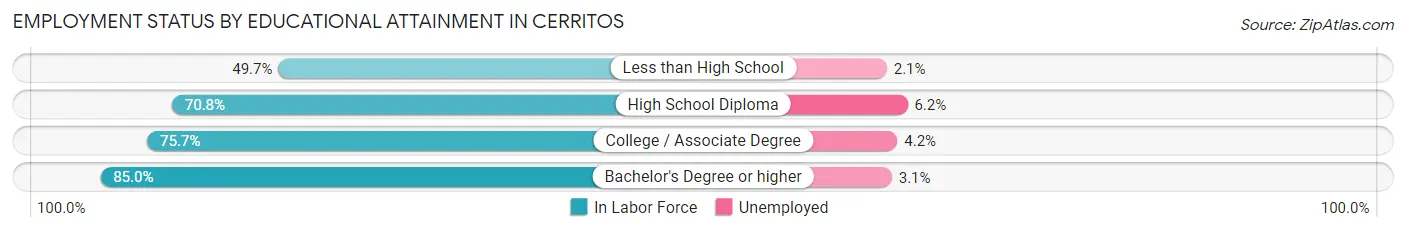
| Educational Attainment | In Labor Force | Unemployed |
| Less than High School | 429 (49.7%) | 18 (2.1%) |
| High School Diploma | 1,864 (70.8%) | 163 (6.2%) |
| College / Associate Degree | 4,575 (75.7%) | 254 (4.2%) |
| Bachelor's Degree or higher | 12,109 (85.0%) | 442 (3.1%) |
| Total | 18,981 (79.8%) | 856 (3.6%) |
Employment Occupations by Sex in Cerritos
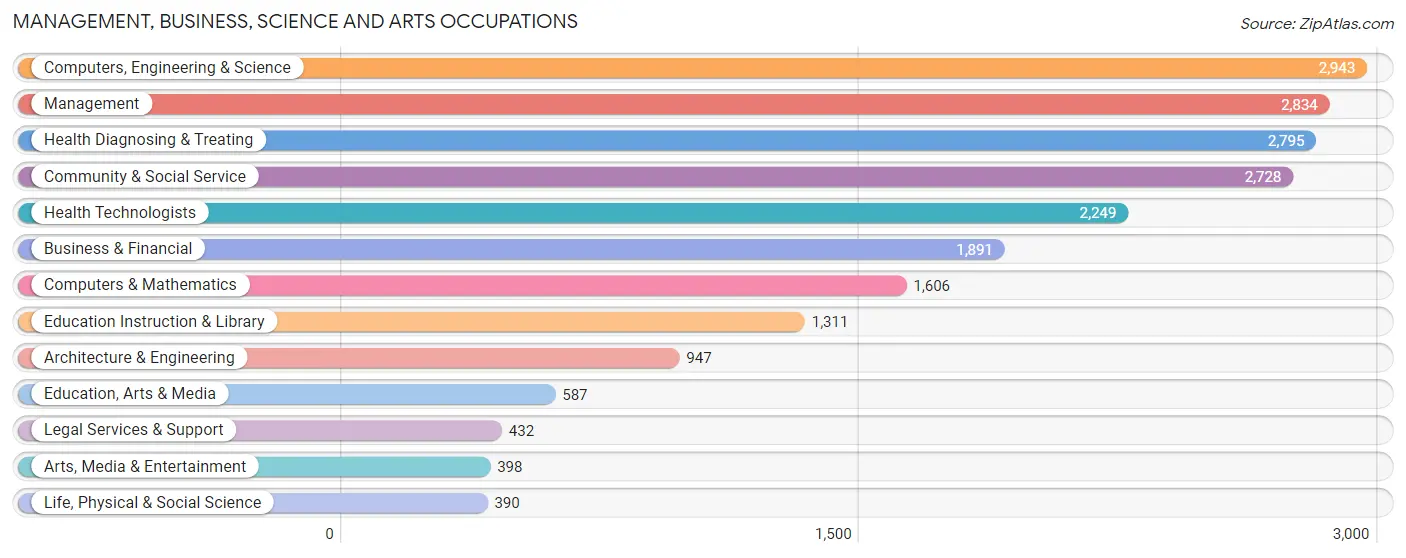
Management, Business, Science and Arts Occupations
The most common Management, Business, Science and Arts occupations in Cerritos are Computers, Engineering & Science (2,943 | 13.2%), Management (2,834 | 12.7%), Health Diagnosing & Treating (2,795 | 12.5%), Community & Social Service (2,728 | 12.2%), and Health Technologists (2,249 | 10.1%).
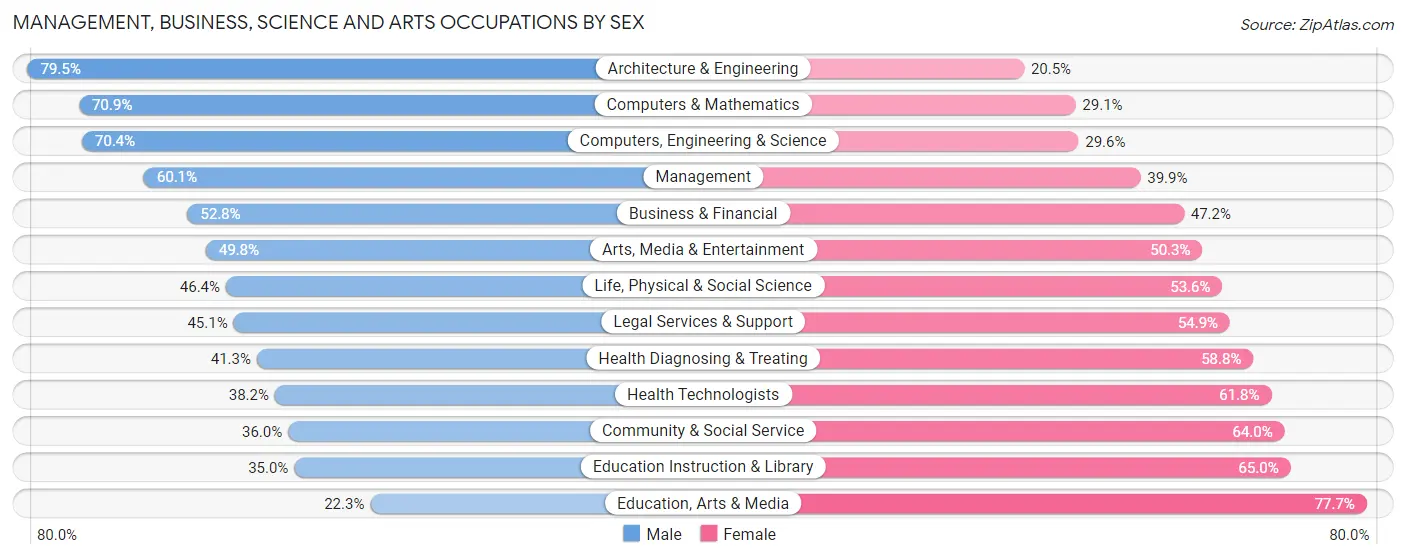
Management, Business, Science and Arts Occupations by Sex
Within the Management, Business, Science and Arts occupations in Cerritos, the most male-oriented occupations are Architecture & Engineering (79.5%), Computers & Mathematics (70.9%), and Computers, Engineering & Science (70.4%), while the most female-oriented occupations are Education, Arts & Media (77.7%), Education Instruction & Library (65.0%), and Community & Social Service (64.0%).
| Occupation | Male | Female |
| Management | 1,703 (60.1%) | 1,131 (39.9%) |
| Business & Financial | 999 (52.8%) | 892 (47.2%) |
| Computers, Engineering & Science | 2,073 (70.4%) | 870 (29.6%) |
| Computers & Mathematics | 1,139 (70.9%) | 467 (29.1%) |
| Architecture & Engineering | 753 (79.5%) | 194 (20.5%) |
| Life, Physical & Social Science | 181 (46.4%) | 209 (53.6%) |
| Community & Social Service | 983 (36.0%) | 1,745 (64.0%) |
| Education, Arts & Media | 131 (22.3%) | 456 (77.7%) |
| Legal Services & Support | 195 (45.1%) | 237 (54.9%) |
| Education Instruction & Library | 459 (35.0%) | 852 (65.0%) |
| Arts, Media & Entertainment | 198 (49.7%) | 200 (50.2%) |
| Health Diagnosing & Treating | 1,153 (41.2%) | 1,642 (58.8%) |
| Health Technologists | 860 (38.2%) | 1,389 (61.8%) |
| Total (Category) | 6,911 (52.4%) | 6,280 (47.6%) |
| Total (Overall) | 11,766 (52.6%) | 10,603 (47.4%) |
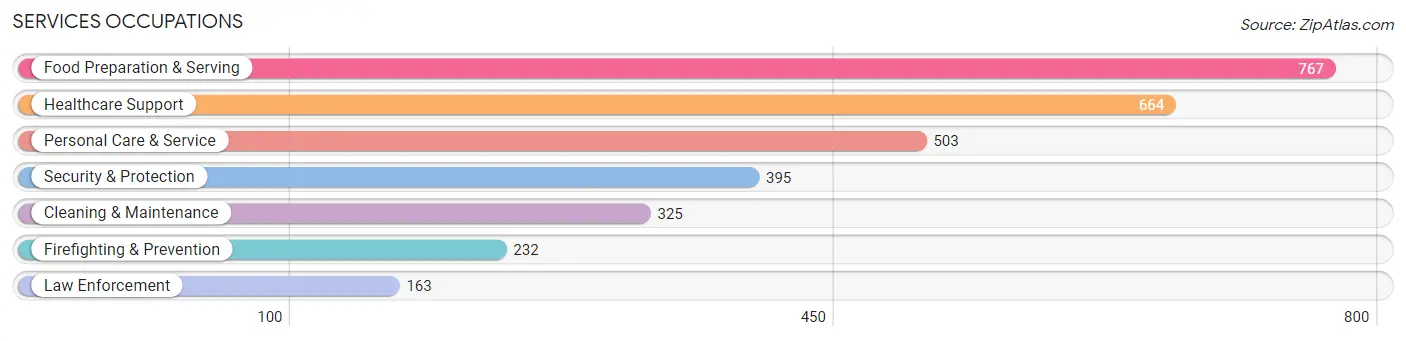
Services Occupations
The most common Services occupations in Cerritos are Food Preparation & Serving (767 | 3.4%), Healthcare Support (664 | 3.0%), Personal Care & Service (503 | 2.2%), Security & Protection (395 | 1.8%), and Cleaning & Maintenance (325 | 1.5%).
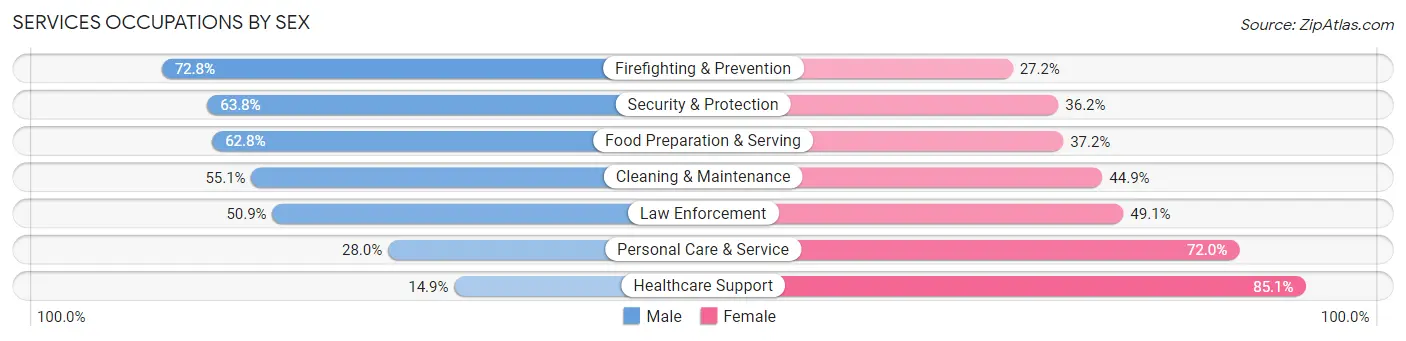
Services Occupations by Sex
Within the Services occupations in Cerritos, the most male-oriented occupations are Firefighting & Prevention (72.8%), Security & Protection (63.8%), and Food Preparation & Serving (62.8%), while the most female-oriented occupations are Healthcare Support (85.1%), Personal Care & Service (72.0%), and Law Enforcement (49.1%).
| Occupation | Male | Female |
| Healthcare Support | 99 (14.9%) | 565 (85.1%) |
| Security & Protection | 252 (63.8%) | 143 (36.2%) |
| Firefighting & Prevention | 169 (72.8%) | 63 (27.2%) |
| Law Enforcement | 83 (50.9%) | 80 (49.1%) |
| Food Preparation & Serving | 482 (62.8%) | 285 (37.2%) |
| Cleaning & Maintenance | 179 (55.1%) | 146 (44.9%) |
| Personal Care & Service | 141 (28.0%) | 362 (72.0%) |
| Total (Category) | 1,153 (43.4%) | 1,501 (56.6%) |
| Total (Overall) | 11,766 (52.6%) | 10,603 (47.4%) |
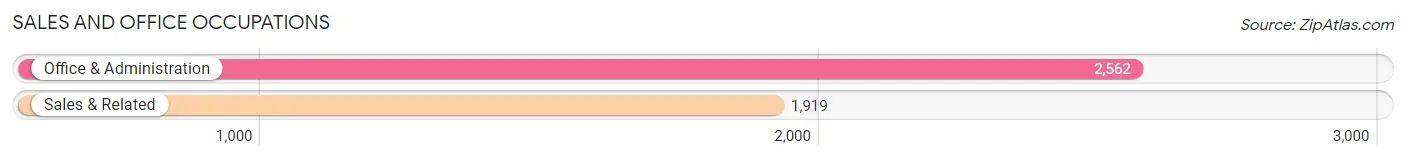
Sales and Office Occupations
The most common Sales and Office occupations in Cerritos are Office & Administration (2,562 | 11.5%), and Sales & Related (1,919 | 8.6%).
Sales and Office Occupations by Sex
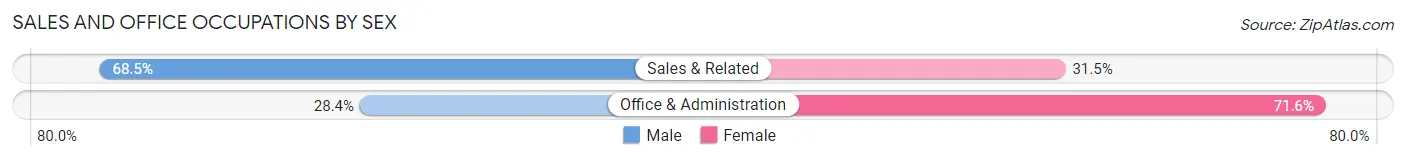
| Occupation | Male | Female |
| Sales & Related | 1,314 (68.5%) | 605 (31.5%) |
| Office & Administration | 728 (28.4%) | 1,834 (71.6%) |
| Total (Category) | 2,042 (45.6%) | 2,439 (54.4%) |
| Total (Overall) | 11,766 (52.6%) | 10,603 (47.4%) |
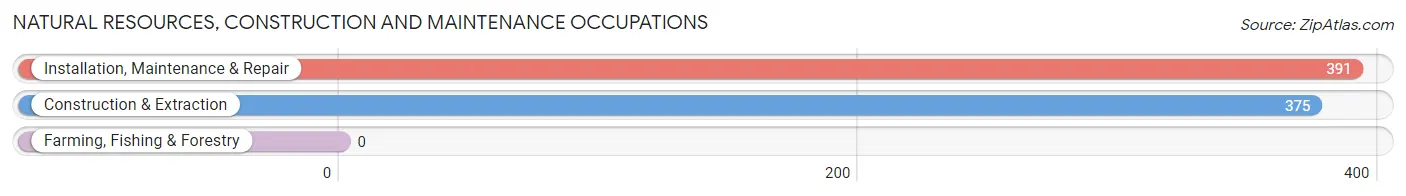
Natural Resources, Construction and Maintenance Occupations
The most common Natural Resources, Construction and Maintenance occupations in Cerritos are Installation, Maintenance & Repair (391 | 1.8%), and Construction & Extraction (375 | 1.7%).
Natural Resources, Construction and Maintenance Occupations by Sex
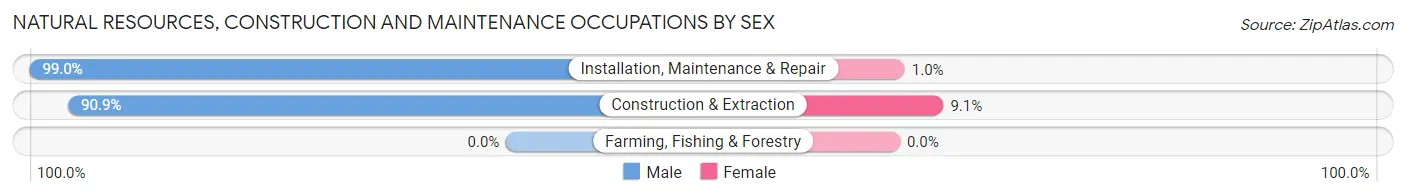
| Occupation | Male | Female |
| Farming, Fishing & Forestry | 0 (0.0%) | 0 (0.0%) |
| Construction & Extraction | 341 (90.9%) | 34 (9.1%) |
| Installation, Maintenance & Repair | 387 (99.0%) | 4 (1.0%) |
| Total (Category) | 728 (95.0%) | 38 (5.0%) |
| Total (Overall) | 11,766 (52.6%) | 10,603 (47.4%) |
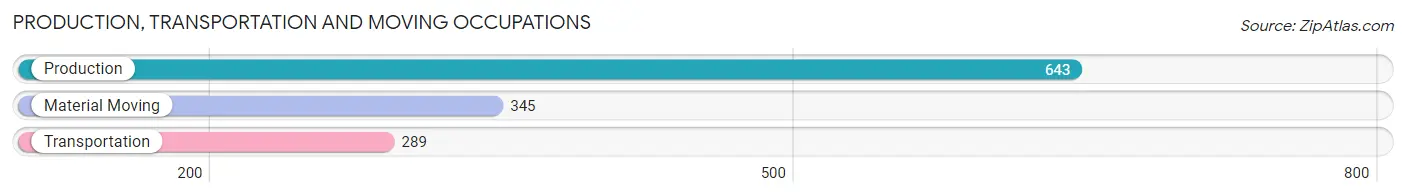
Production, Transportation and Moving Occupations
The most common Production, Transportation and Moving occupations in Cerritos are Production (643 | 2.9%), Material Moving (345 | 1.5%), and Transportation (289 | 1.3%).
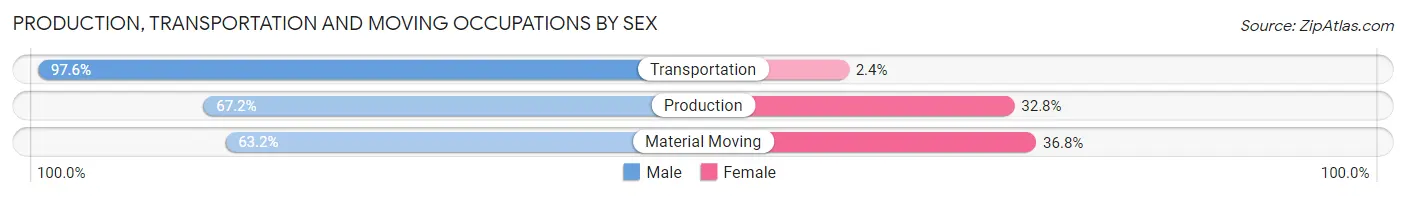
Production, Transportation and Moving Occupations by Sex
| Occupation | Male | Female |
| Production | 432 (67.2%) | 211 (32.8%) |
| Transportation | 282 (97.6%) | 7 (2.4%) |
| Material Moving | 218 (63.2%) | 127 (36.8%) |
| Total (Category) | 932 (73.0%) | 345 (27.0%) |
| Total (Overall) | 11,766 (52.6%) | 10,603 (47.4%) |
Employment Industries by Sex in Cerritos
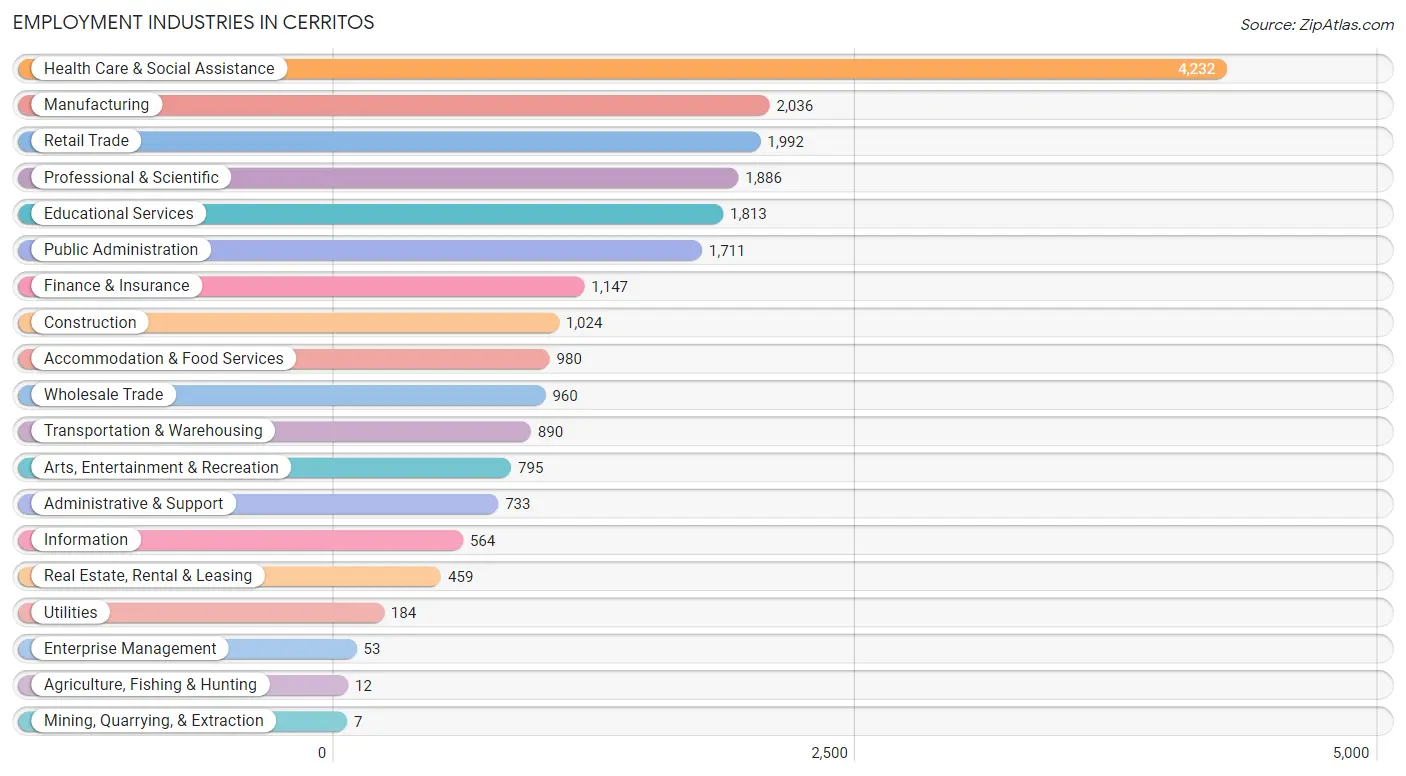
Employment Industries in Cerritos
The major employment industries in Cerritos include Health Care & Social Assistance (4,232 | 18.9%), Manufacturing (2,036 | 9.1%), Retail Trade (1,992 | 8.9%), Professional & Scientific (1,886 | 8.4%), and Educational Services (1,813 | 8.1%).
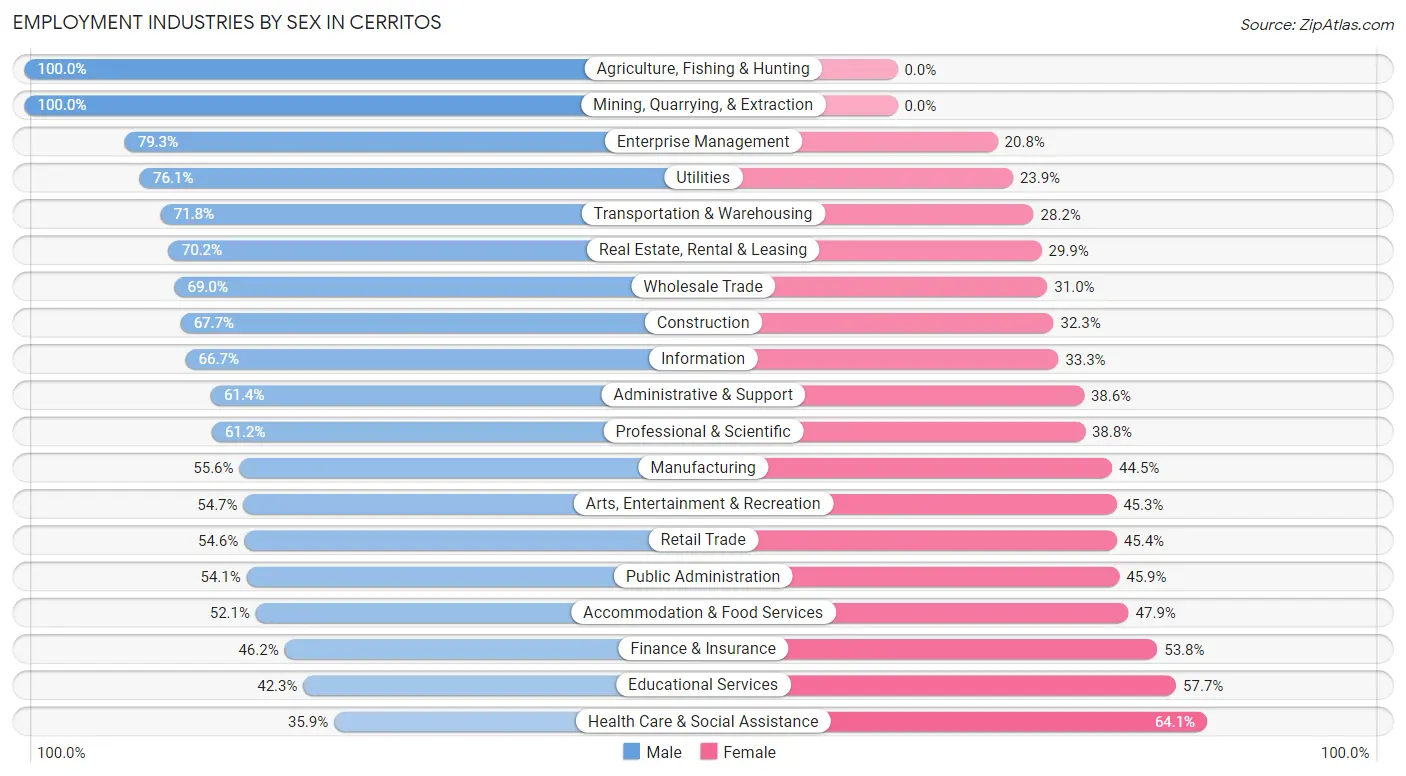
Employment Industries by Sex in Cerritos
The Cerritos industries that see more men than women are Agriculture, Fishing & Hunting (100.0%), Mining, Quarrying, & Extraction (100.0%), and Enterprise Management (79.2%), whereas the industries that tend to have a higher number of women are Health Care & Social Assistance (64.1%), Educational Services (57.7%), and Finance & Insurance (53.8%).
| Industry | Male | Female |
| Agriculture, Fishing & Hunting | 12 (100.0%) | 0 (0.0%) |
| Mining, Quarrying, & Extraction | 7 (100.0%) | 0 (0.0%) |
| Construction | 693 (67.7%) | 331 (32.3%) |
| Manufacturing | 1,131 (55.5%) | 905 (44.5%) |
| Wholesale Trade | 662 (69.0%) | 298 (31.0%) |
| Retail Trade | 1,087 (54.6%) | 905 (45.4%) |
| Transportation & Warehousing | 639 (71.8%) | 251 (28.2%) |
| Utilities | 140 (76.1%) | 44 (23.9%) |
| Information | 376 (66.7%) | 188 (33.3%) |
| Finance & Insurance | 530 (46.2%) | 617 (53.8%) |
| Real Estate, Rental & Leasing | 322 (70.2%) | 137 (29.8%) |
| Professional & Scientific | 1,154 (61.2%) | 732 (38.8%) |
| Enterprise Management | 42 (79.2%) | 11 (20.7%) |
| Administrative & Support | 450 (61.4%) | 283 (38.6%) |
| Educational Services | 767 (42.3%) | 1,046 (57.7%) |
| Health Care & Social Assistance | 1,521 (35.9%) | 2,711 (64.1%) |
| Arts, Entertainment & Recreation | 435 (54.7%) | 360 (45.3%) |
| Accommodation & Food Services | 511 (52.1%) | 469 (47.9%) |
| Public Administration | 925 (54.1%) | 786 (45.9%) |
| Total | 11,766 (52.6%) | 10,603 (47.4%) |
Education in Cerritos
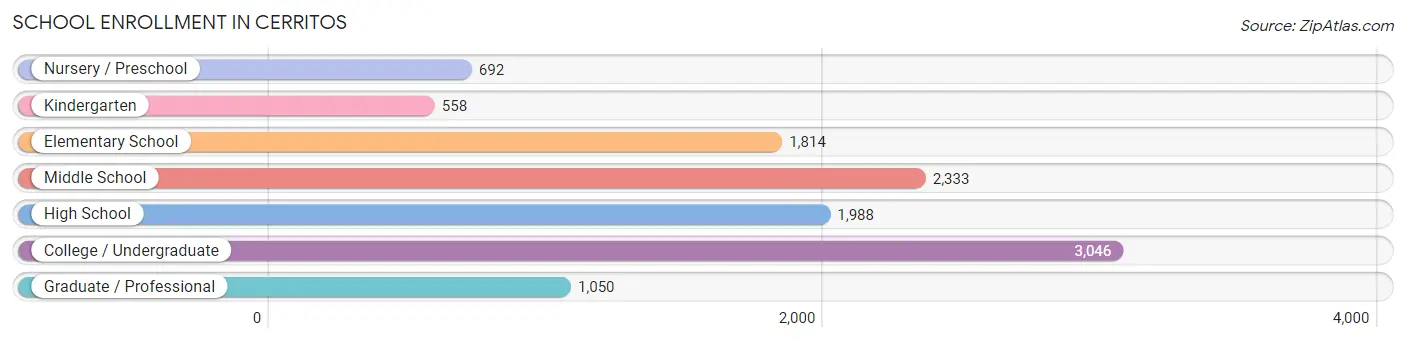
School Enrollment in Cerritos
The most common levels of schooling among the 11,481 students in Cerritos are college / undergraduate (3,046 | 26.5%), middle school (2,333 | 20.3%), and high school (1,988 | 17.3%).
| School Level | # Students | % Students |
| Nursery / Preschool | 692 | 6.0% |
| Kindergarten | 558 | 4.9% |
| Elementary School | 1,814 | 15.8% |
| Middle School | 2,333 | 20.3% |
| High School | 1,988 | 17.3% |
| College / Undergraduate | 3,046 | 26.5% |
| Graduate / Professional | 1,050 | 9.1% |
| Total | 11,481 | 100.0% |
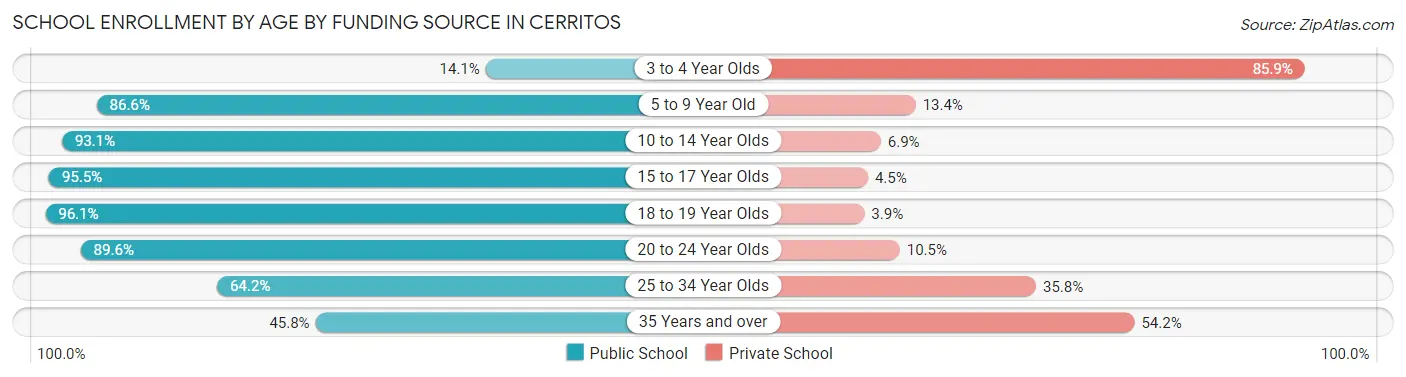
School Enrollment by Age by Funding Source in Cerritos
Out of a total of 11,481 students who are enrolled in schools in Cerritos, 2,044 (17.8%) attend a private institution, while the remaining 9,437 (82.2%) are enrolled in public schools. The age group of 3 to 4 year olds has the highest likelihood of being enrolled in private schools, with 480 (85.9% in the age bracket) enrolled. Conversely, the age group of 18 to 19 year olds has the lowest likelihood of being enrolled in a private school, with 723 (96.1% in the age bracket) attending a public institution.
| Age Bracket | Public School | Private School |
| 3 to 4 Year Olds | 79 (14.1%) | 480 (85.9%) |
| 5 to 9 Year Old | 1,975 (86.6%) | 306 (13.4%) |
| 10 to 14 Year Olds | 2,684 (93.1%) | 200 (6.9%) |
| 15 to 17 Year Olds | 1,455 (95.5%) | 69 (4.5%) |
| 18 to 19 Year Olds | 723 (96.1%) | 29 (3.9%) |
| 20 to 24 Year Olds | 1,516 (89.5%) | 177 (10.4%) |
| 25 to 34 Year Olds | 632 (64.2%) | 353 (35.8%) |
| 35 Years and over | 368 (45.8%) | 435 (54.2%) |
| Total | 9,437 (82.2%) | 2,044 (17.8%) |
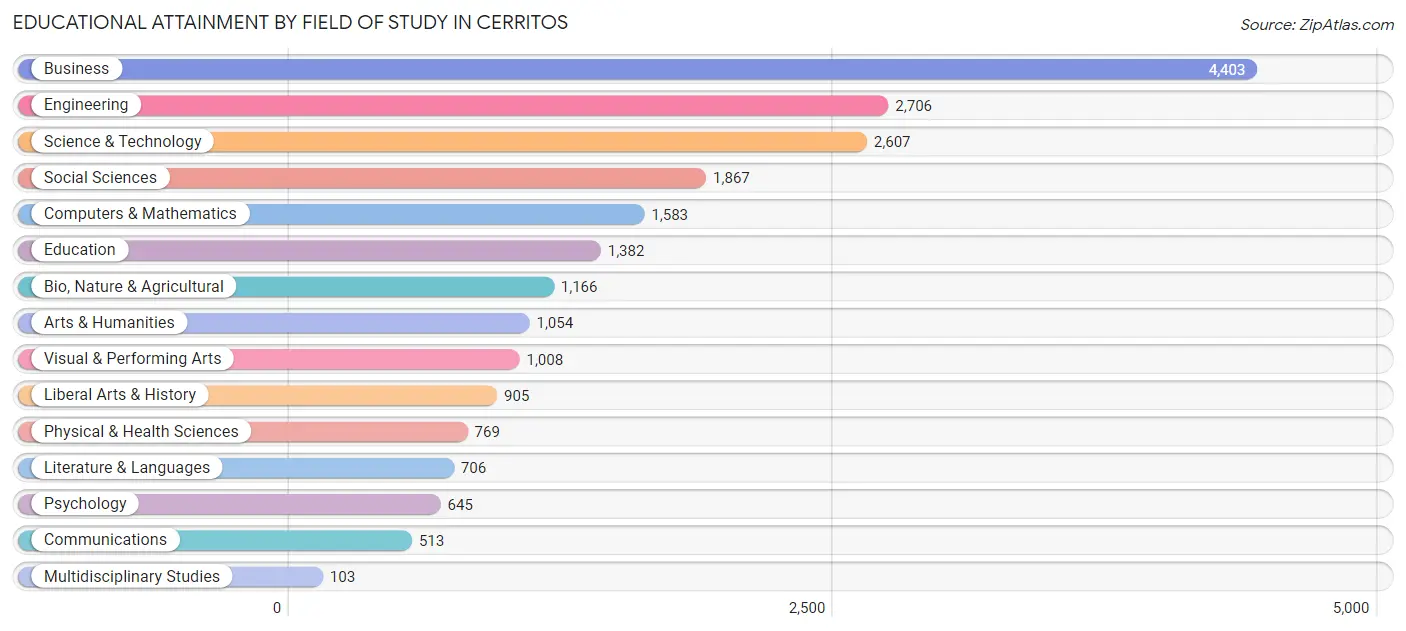
Educational Attainment by Field of Study in Cerritos
Business (4,403 | 20.6%), engineering (2,706 | 12.6%), science & technology (2,607 | 12.2%), social sciences (1,867 | 8.7%), and computers & mathematics (1,583 | 7.4%) are the most common fields of study among 21,417 individuals in Cerritos who have obtained a bachelor's degree or higher.
| Field of Study | # Graduates | % Graduates |
| Computers & Mathematics | 1,583 | 7.4% |
| Bio, Nature & Agricultural | 1,166 | 5.4% |
| Physical & Health Sciences | 769 | 3.6% |
| Psychology | 645 | 3.0% |
| Social Sciences | 1,867 | 8.7% |
| Engineering | 2,706 | 12.6% |
| Multidisciplinary Studies | 103 | 0.5% |
| Science & Technology | 2,607 | 12.2% |
| Business | 4,403 | 20.6% |
| Education | 1,382 | 6.5% |
| Literature & Languages | 706 | 3.3% |
| Liberal Arts & History | 905 | 4.2% |
| Visual & Performing Arts | 1,008 | 4.7% |
| Communications | 513 | 2.4% |
| Arts & Humanities | 1,054 | 4.9% |
| Total | 21,417 | 100.0% |
Transportation & Commute in Cerritos
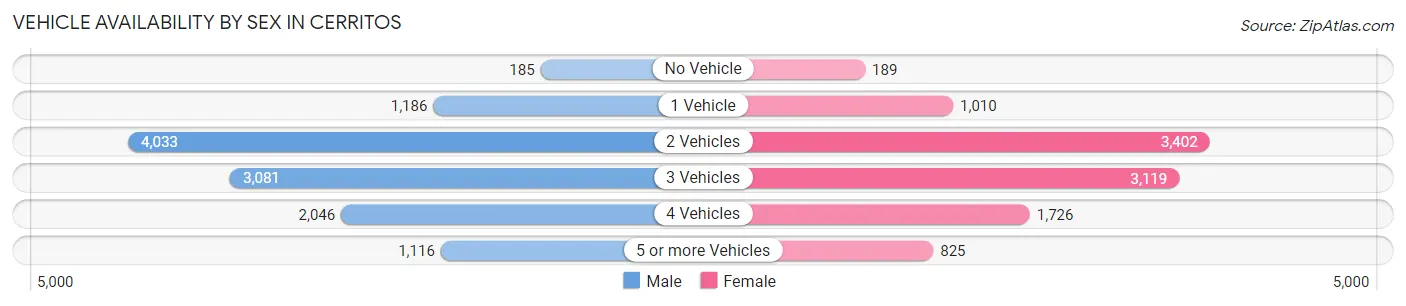
Vehicle Availability by Sex in Cerritos
The most prevalent vehicle ownership categories in Cerritos are males with 2 vehicles (4,033, accounting for 34.6%) and females with 2 vehicles (3,402, making up 39.3%).
| Vehicles Available | Male | Female |
| No Vehicle | 185 (1.6%) | 189 (1.8%) |
| 1 Vehicle | 1,186 (10.2%) | 1,010 (9.8%) |
| 2 Vehicles | 4,033 (34.6%) | 3,402 (33.1%) |
| 3 Vehicles | 3,081 (26.5%) | 3,119 (30.4%) |
| 4 Vehicles | 2,046 (17.6%) | 1,726 (16.8%) |
| 5 or more Vehicles | 1,116 (9.6%) | 825 (8.0%) |
| Total | 11,647 (100.0%) | 10,271 (100.0%) |
Commute Time in Cerritos
The most frequently occuring commute durations in Cerritos are 30 to 34 minutes (2,692 commuters, 14.5%), 20 to 24 minutes (2,631 commuters, 14.1%), and 60 to 89 minutes (2,198 commuters, 11.8%).
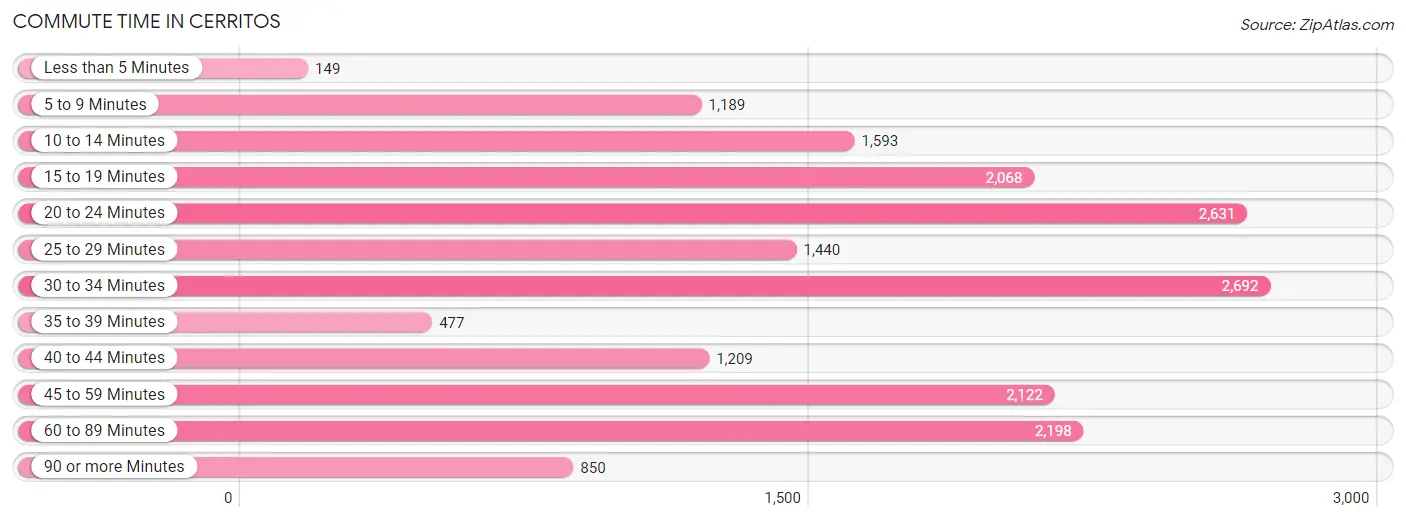
| Commute Time | # Commuters | % Commuters |
| Less than 5 Minutes | 149 | 0.8% |
| 5 to 9 Minutes | 1,189 | 6.4% |
| 10 to 14 Minutes | 1,593 | 8.6% |
| 15 to 19 Minutes | 2,068 | 11.1% |
| 20 to 24 Minutes | 2,631 | 14.1% |
| 25 to 29 Minutes | 1,440 | 7.7% |
| 30 to 34 Minutes | 2,692 | 14.5% |
| 35 to 39 Minutes | 477 | 2.6% |
| 40 to 44 Minutes | 1,209 | 6.5% |
| 45 to 59 Minutes | 2,122 | 11.4% |
| 60 to 89 Minutes | 2,198 | 11.8% |
| 90 or more Minutes | 850 | 4.6% |
Commute Time by Sex in Cerritos
The most common commute times in Cerritos are 30 to 34 minutes (1,641 commuters, 16.3%) for males and 20 to 24 minutes (1,386 commuters, 16.2%) for females.
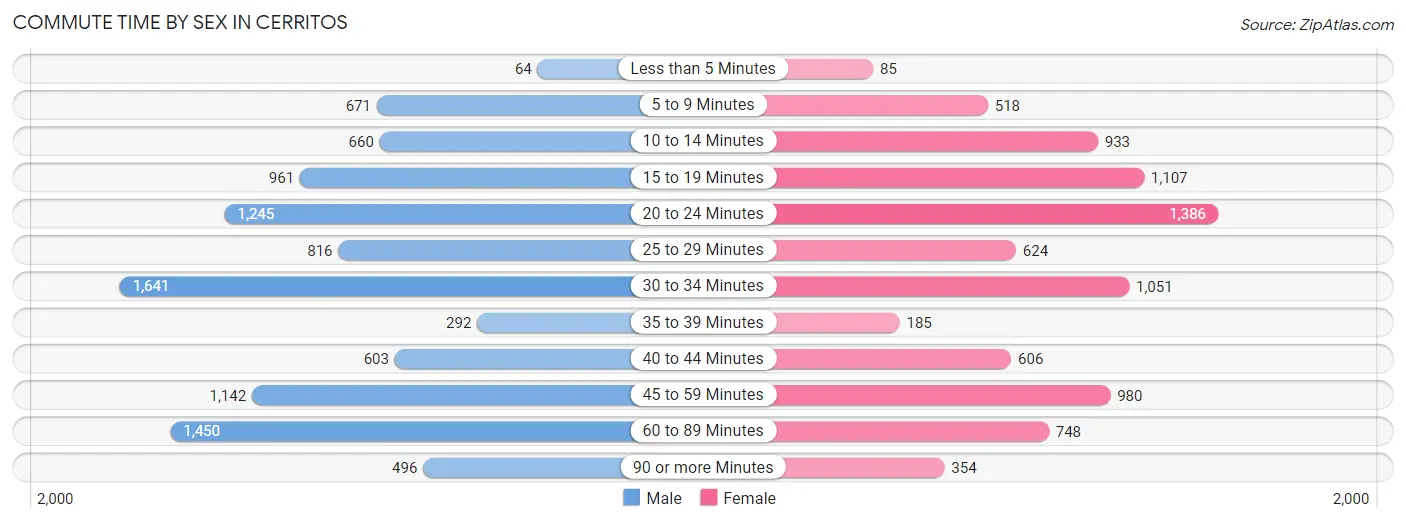
| Commute Time | Male | Female |
| Less than 5 Minutes | 64 (0.6%) | 85 (1.0%) |
| 5 to 9 Minutes | 671 (6.7%) | 518 (6.0%) |
| 10 to 14 Minutes | 660 (6.6%) | 933 (10.9%) |
| 15 to 19 Minutes | 961 (9.6%) | 1,107 (12.9%) |
| 20 to 24 Minutes | 1,245 (12.4%) | 1,386 (16.2%) |
| 25 to 29 Minutes | 816 (8.1%) | 624 (7.3%) |
| 30 to 34 Minutes | 1,641 (16.3%) | 1,051 (12.2%) |
| 35 to 39 Minutes | 292 (2.9%) | 185 (2.2%) |
| 40 to 44 Minutes | 603 (6.0%) | 606 (7.1%) |
| 45 to 59 Minutes | 1,142 (11.4%) | 980 (11.4%) |
| 60 to 89 Minutes | 1,450 (14.4%) | 748 (8.7%) |
| 90 or more Minutes | 496 (4.9%) | 354 (4.1%) |
Time of Departure to Work by Sex in Cerritos
The most frequent times of departure to work in Cerritos are 7:00 AM to 7:29 AM (1,539, 15.3%) for males and 7:00 AM to 7:29 AM (1,438, 16.8%) for females.
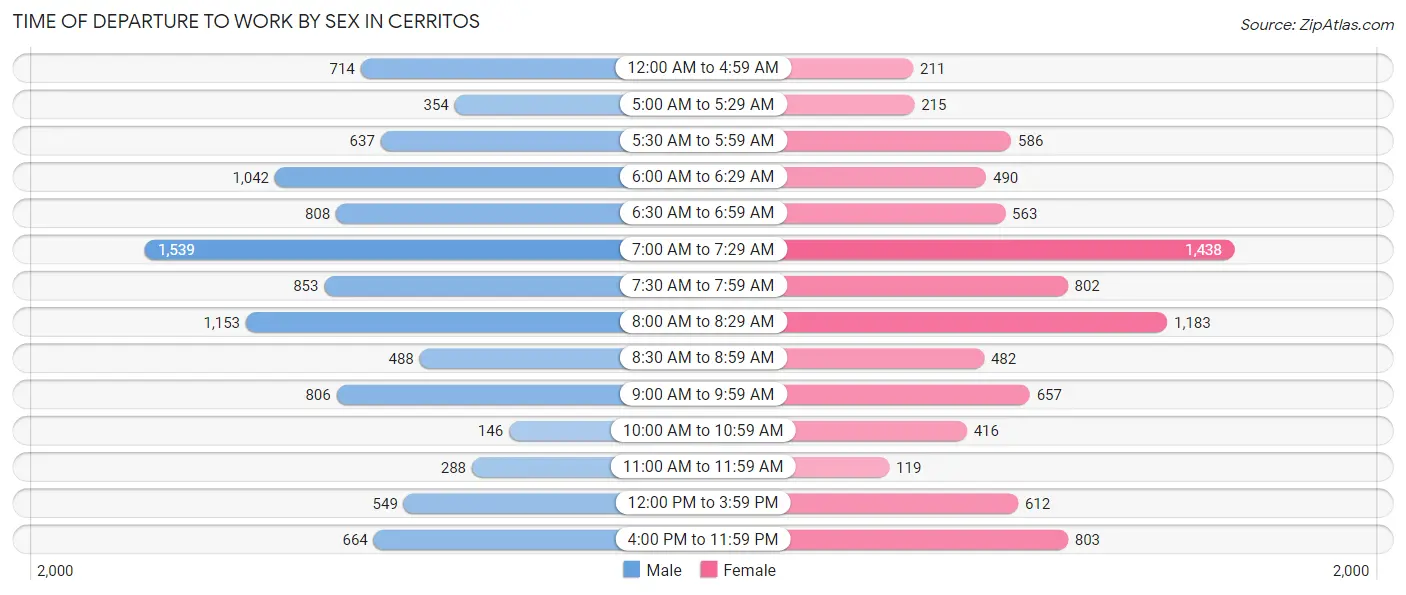
| Time of Departure | Male | Female |
| 12:00 AM to 4:59 AM | 714 (7.1%) | 211 (2.5%) |
| 5:00 AM to 5:29 AM | 354 (3.5%) | 215 (2.5%) |
| 5:30 AM to 5:59 AM | 637 (6.3%) | 586 (6.8%) |
| 6:00 AM to 6:29 AM | 1,042 (10.4%) | 490 (5.7%) |
| 6:30 AM to 6:59 AM | 808 (8.1%) | 563 (6.6%) |
| 7:00 AM to 7:29 AM | 1,539 (15.3%) | 1,438 (16.8%) |
| 7:30 AM to 7:59 AM | 853 (8.5%) | 802 (9.3%) |
| 8:00 AM to 8:29 AM | 1,153 (11.5%) | 1,183 (13.8%) |
| 8:30 AM to 8:59 AM | 488 (4.9%) | 482 (5.6%) |
| 9:00 AM to 9:59 AM | 806 (8.0%) | 657 (7.7%) |
| 10:00 AM to 10:59 AM | 146 (1.5%) | 416 (4.9%) |
| 11:00 AM to 11:59 AM | 288 (2.9%) | 119 (1.4%) |
| 12:00 PM to 3:59 PM | 549 (5.5%) | 612 (7.1%) |
| 4:00 PM to 11:59 PM | 664 (6.6%) | 803 (9.4%) |
| Total | 10,041 (100.0%) | 8,577 (100.0%) |
Housing Occupancy in Cerritos
Occupancy by Ownership in Cerritos
Of the total 15,772 dwellings in Cerritos, owner-occupied units account for 11,860 (75.2%), while renter-occupied units make up 3,912 (24.8%).
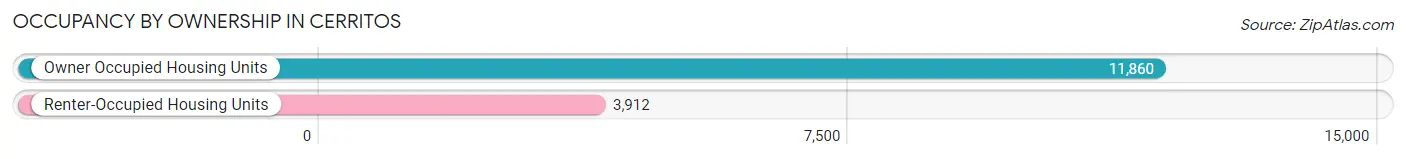
| Occupancy | # Housing Units | % Housing Units |
| Owner Occupied Housing Units | 11,860 | 75.2% |
| Renter-Occupied Housing Units | 3,912 | 24.8% |
| Total Occupied Housing Units | 15,772 | 100.0% |
Occupancy by Household Size in Cerritos
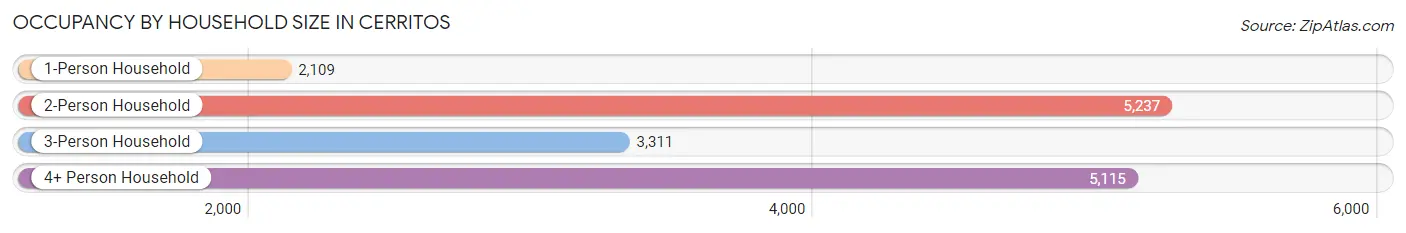
| Household Size | # Housing Units | % Housing Units |
| 1-Person Household | 2,109 | 13.4% |
| 2-Person Household | 5,237 | 33.2% |
| 3-Person Household | 3,311 | 21.0% |
| 4+ Person Household | 5,115 | 32.4% |
| Total Housing Units | 15,772 | 100.0% |
Occupancy by Ownership by Household Size in Cerritos
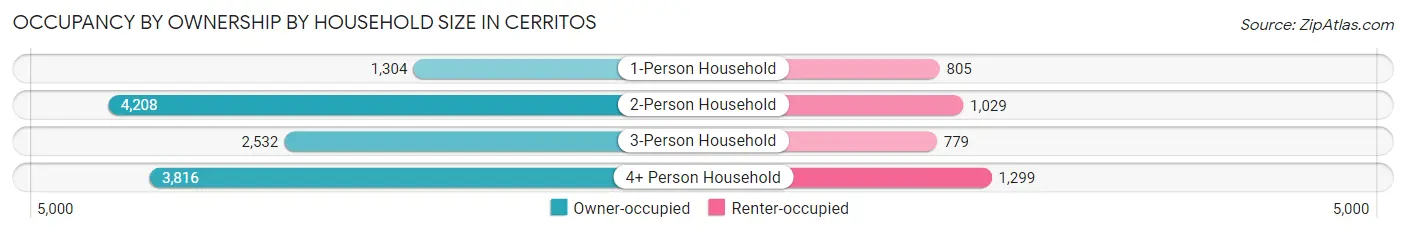
| Household Size | Owner-occupied | Renter-occupied |
| 1-Person Household | 1,304 (61.8%) | 805 (38.2%) |
| 2-Person Household | 4,208 (80.3%) | 1,029 (19.7%) |
| 3-Person Household | 2,532 (76.5%) | 779 (23.5%) |
| 4+ Person Household | 3,816 (74.6%) | 1,299 (25.4%) |
| Total Housing Units | 11,860 (75.2%) | 3,912 (24.8%) |
Occupancy by Educational Attainment in Cerritos
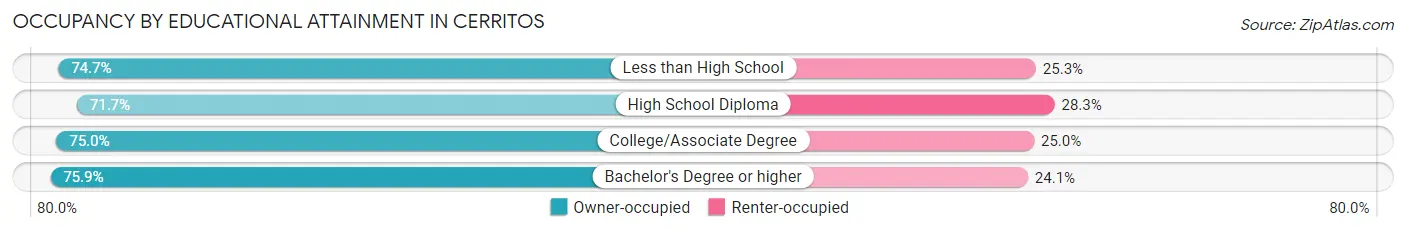
| Household Size | Owner-occupied | Renter-occupied |
| Less than High School | 445 (74.7%) | 151 (25.3%) |
| High School Diploma | 1,219 (71.7%) | 481 (28.3%) |
| College/Associate Degree | 2,820 (75.0%) | 942 (25.0%) |
| Bachelor's Degree or higher | 7,376 (75.9%) | 2,338 (24.1%) |
Occupancy by Age of Householder in Cerritos
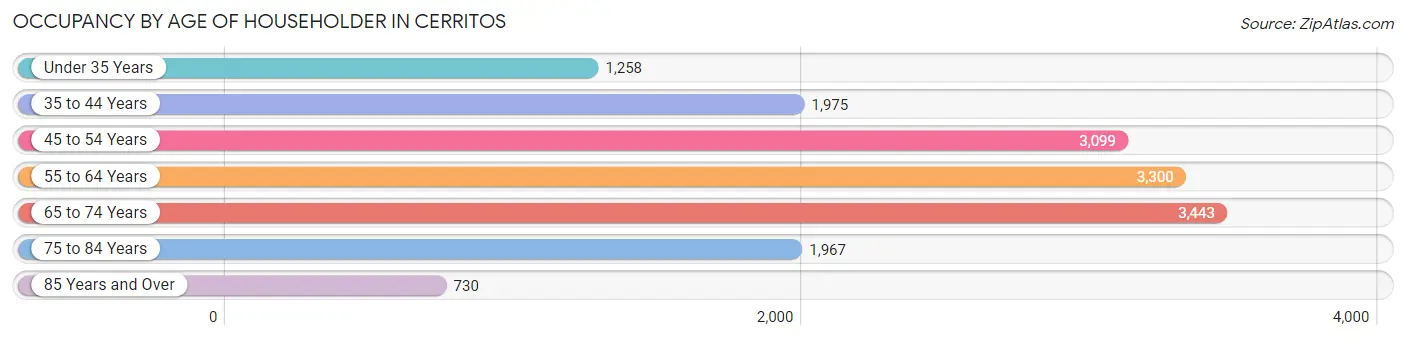
| Age Bracket | # Households | % Households |
| Under 35 Years | 1,258 | 8.0% |
| 35 to 44 Years | 1,975 | 12.5% |
| 45 to 54 Years | 3,099 | 19.7% |
| 55 to 64 Years | 3,300 | 20.9% |
| 65 to 74 Years | 3,443 | 21.8% |
| 75 to 84 Years | 1,967 | 12.5% |
| 85 Years and Over | 730 | 4.6% |
| Total | 15,772 | 100.0% |
Housing Finances in Cerritos
Median Income by Occupancy in Cerritos
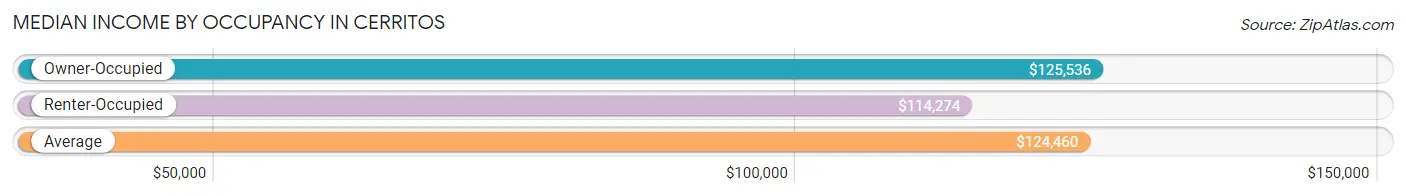
| Occupancy Type | # Households | Median Income |
| Owner-Occupied | 11,860 (75.2%) | $125,536 |
| Renter-Occupied | 3,912 (24.8%) | $114,274 |
| Average | 15,772 (100.0%) | $124,460 |
Occupancy by Householder Income Bracket in Cerritos
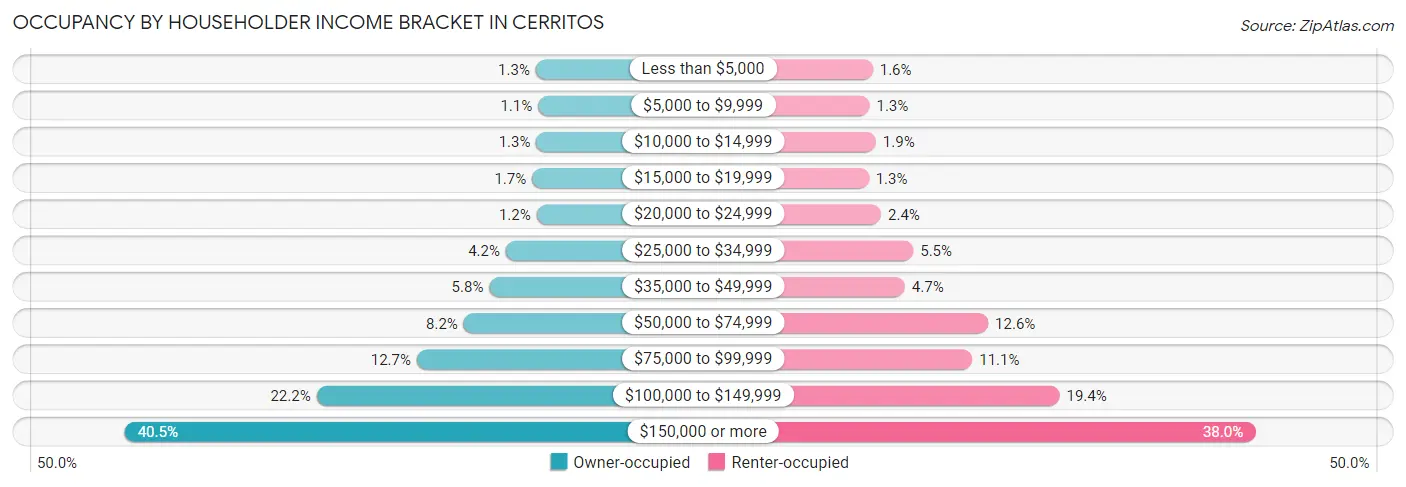
| Income Bracket | Owner-occupied | Renter-occupied |
| Less than $5,000 | 156 (1.3%) | 64 (1.6%) |
| $5,000 to $9,999 | 130 (1.1%) | 52 (1.3%) |
| $10,000 to $14,999 | 151 (1.3%) | 76 (1.9%) |
| $15,000 to $19,999 | 198 (1.7%) | 49 (1.3%) |
| $20,000 to $24,999 | 147 (1.2%) | 95 (2.4%) |
| $25,000 to $34,999 | 495 (4.2%) | 215 (5.5%) |
| $35,000 to $49,999 | 682 (5.8%) | 184 (4.7%) |
| $50,000 to $74,999 | 970 (8.2%) | 494 (12.6%) |
| $75,000 to $99,999 | 1,500 (12.7%) | 435 (11.1%) |
| $100,000 to $149,999 | 2,633 (22.2%) | 760 (19.4%) |
| $150,000 or more | 4,798 (40.5%) | 1,488 (38.0%) |
| Total | 11,860 (100.0%) | 3,912 (100.0%) |
Monthly Housing Cost Tiers in Cerritos
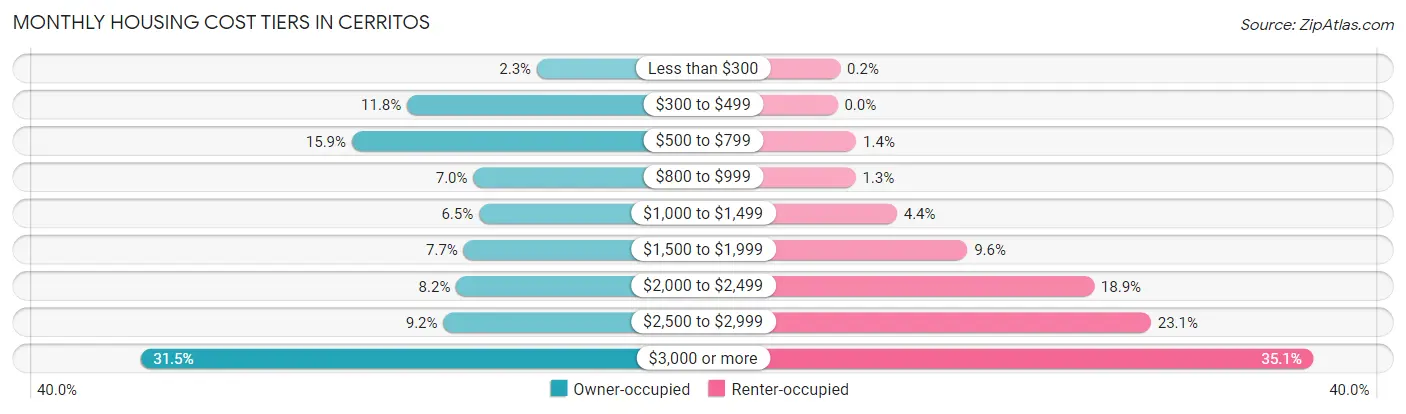
| Monthly Cost | Owner-occupied | Renter-occupied |
| Less than $300 | 269 (2.3%) | 8 (0.2%) |
| $300 to $499 | 1,403 (11.8%) | 0 (0.0%) |
| $500 to $799 | 1,886 (15.9%) | 54 (1.4%) |
| $800 to $999 | 824 (7.0%) | 52 (1.3%) |
| $1,000 to $1,499 | 775 (6.5%) | 171 (4.4%) |
| $1,500 to $1,999 | 909 (7.7%) | 374 (9.6%) |
| $2,000 to $2,499 | 974 (8.2%) | 739 (18.9%) |
| $2,500 to $2,999 | 1,086 (9.2%) | 903 (23.1%) |
| $3,000 or more | 3,734 (31.5%) | 1,372 (35.1%) |
| Total | 11,860 (100.0%) | 3,912 (100.0%) |
Physical Housing Characteristics in Cerritos
Housing Structures in Cerritos
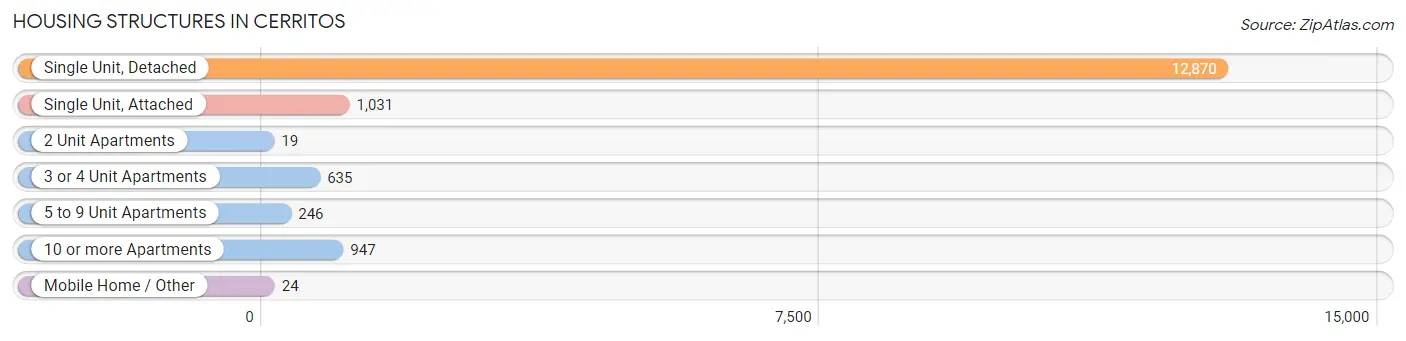
| Structure Type | # Housing Units | % Housing Units |
| Single Unit, Detached | 12,870 | 81.6% |
| Single Unit, Attached | 1,031 | 6.5% |
| 2 Unit Apartments | 19 | 0.1% |
| 3 or 4 Unit Apartments | 635 | 4.0% |
| 5 to 9 Unit Apartments | 246 | 1.6% |
| 10 or more Apartments | 947 | 6.0% |
| Mobile Home / Other | 24 | 0.2% |
| Total | 15,772 | 100.0% |
Housing Structures by Occupancy in Cerritos
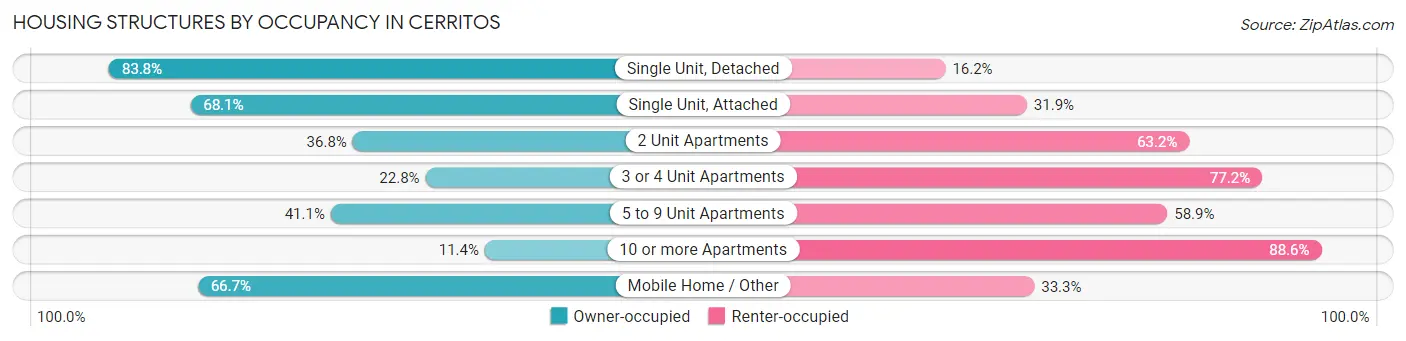
| Structure Type | Owner-occupied | Renter-occupied |
| Single Unit, Detached | 10,781 (83.8%) | 2,089 (16.2%) |
| Single Unit, Attached | 702 (68.1%) | 329 (31.9%) |
| 2 Unit Apartments | 7 (36.8%) | 12 (63.2%) |
| 3 or 4 Unit Apartments | 145 (22.8%) | 490 (77.2%) |
| 5 to 9 Unit Apartments | 101 (41.1%) | 145 (58.9%) |
| 10 or more Apartments | 108 (11.4%) | 839 (88.6%) |
| Mobile Home / Other | 16 (66.7%) | 8 (33.3%) |
| Total | 11,860 (75.2%) | 3,912 (24.8%) |
Housing Structures by Number of Rooms in Cerritos
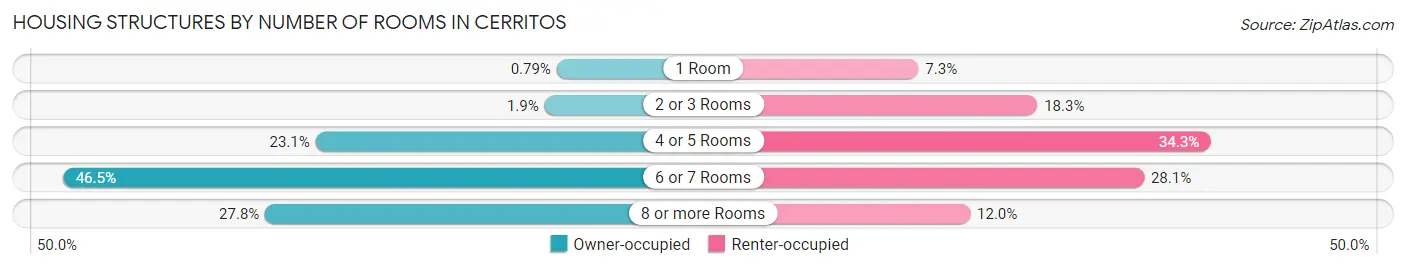
| Number of Rooms | Owner-occupied | Renter-occupied |
| 1 Room | 94 (0.8%) | 284 (7.3%) |
| 2 or 3 Rooms | 226 (1.9%) | 714 (18.2%) |
| 4 or 5 Rooms | 2,738 (23.1%) | 1,343 (34.3%) |
| 6 or 7 Rooms | 5,511 (46.5%) | 1,100 (28.1%) |
| 8 or more Rooms | 3,291 (27.8%) | 471 (12.0%) |
| Total | 11,860 (100.0%) | 3,912 (100.0%) |
Housing Structure by Heating Type in Cerritos
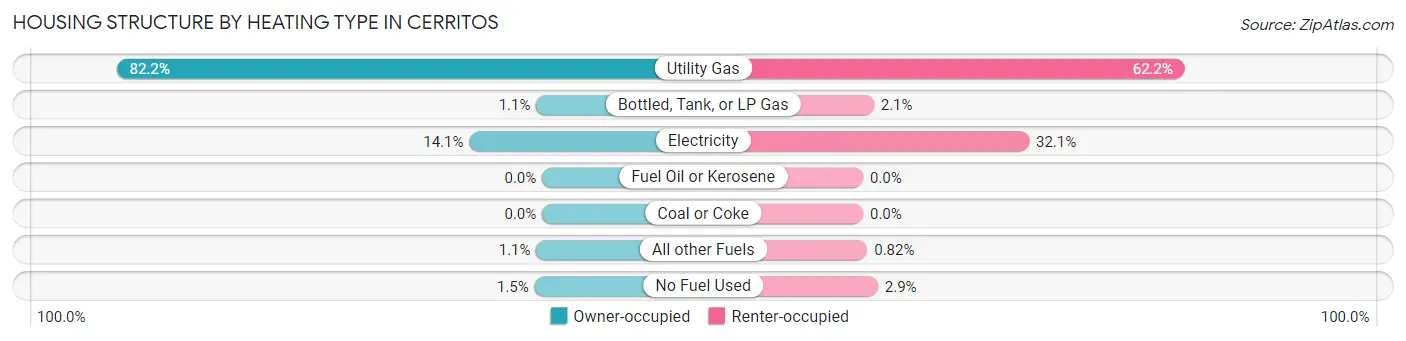
| Heating Type | Owner-occupied | Renter-occupied |
| Utility Gas | 9,753 (82.2%) | 2,432 (62.2%) |
| Bottled, Tank, or LP Gas | 133 (1.1%) | 81 (2.1%) |
| Electricity | 1,669 (14.1%) | 1,255 (32.1%) |
| Fuel Oil or Kerosene | 0 (0.0%) | 0 (0.0%) |
| Coal or Coke | 0 (0.0%) | 0 (0.0%) |
| All other Fuels | 132 (1.1%) | 32 (0.8%) |
| No Fuel Used | 173 (1.5%) | 112 (2.9%) |
| Total | 11,860 (100.0%) | 3,912 (100.0%) |
Household Vehicle Usage in Cerritos
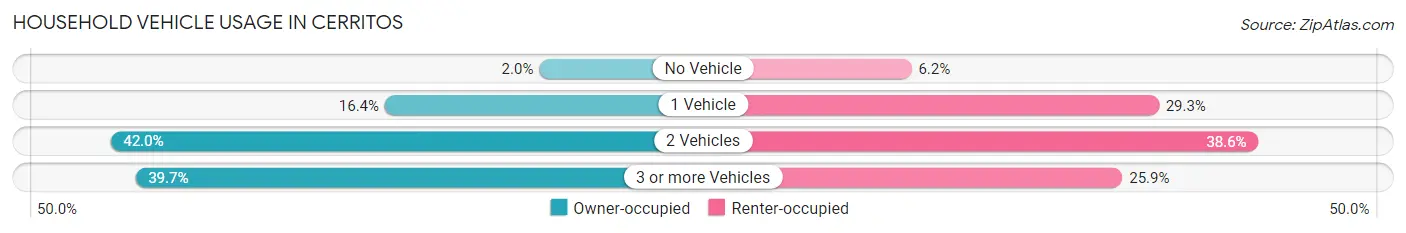
| Vehicles per Household | Owner-occupied | Renter-occupied |
| No Vehicle | 232 (2.0%) | 243 (6.2%) |
| 1 Vehicle | 1,942 (16.4%) | 1,146 (29.3%) |
| 2 Vehicles | 4,981 (42.0%) | 1,510 (38.6%) |
| 3 or more Vehicles | 4,705 (39.7%) | 1,013 (25.9%) |
| Total | 11,860 (100.0%) | 3,912 (100.0%) |
Real Estate & Mortgages in Cerritos
Real Estate and Mortgage Overview in Cerritos
| Characteristic | Without Mortgage | With Mortgage |
| Housing Units | 4,829 | 7,031 |
| Median Property Value | $850,600 | $870,200 |
| Median Household Income | $98,946 | $3,381 |
| Monthly Housing Costs | $621 | $3,734 |
| Real Estate Taxes | $4,065 | $94 |
Property Value by Mortgage Status in Cerritos
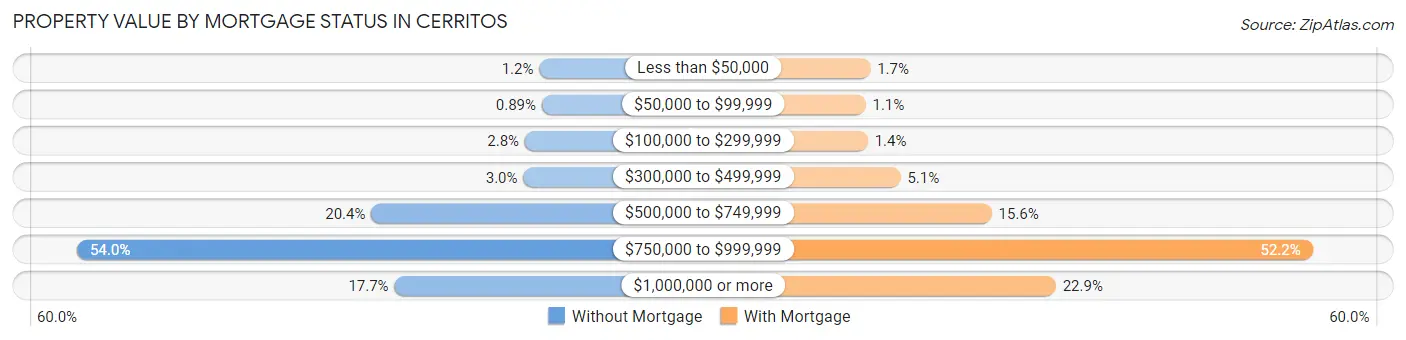
| Property Value | Without Mortgage | With Mortgage |
| Less than $50,000 | 57 (1.2%) | 118 (1.7%) |
| $50,000 to $99,999 | 43 (0.9%) | 80 (1.1%) |
| $100,000 to $299,999 | 136 (2.8%) | 98 (1.4%) |
| $300,000 to $499,999 | 145 (3.0%) | 361 (5.1%) |
| $500,000 to $749,999 | 984 (20.4%) | 1,093 (15.5%) |
| $750,000 to $999,999 | 2,608 (54.0%) | 3,672 (52.2%) |
| $1,000,000 or more | 856 (17.7%) | 1,609 (22.9%) |
| Total | 4,829 (100.0%) | 7,031 (100.0%) |
Household Income by Mortgage Status in Cerritos
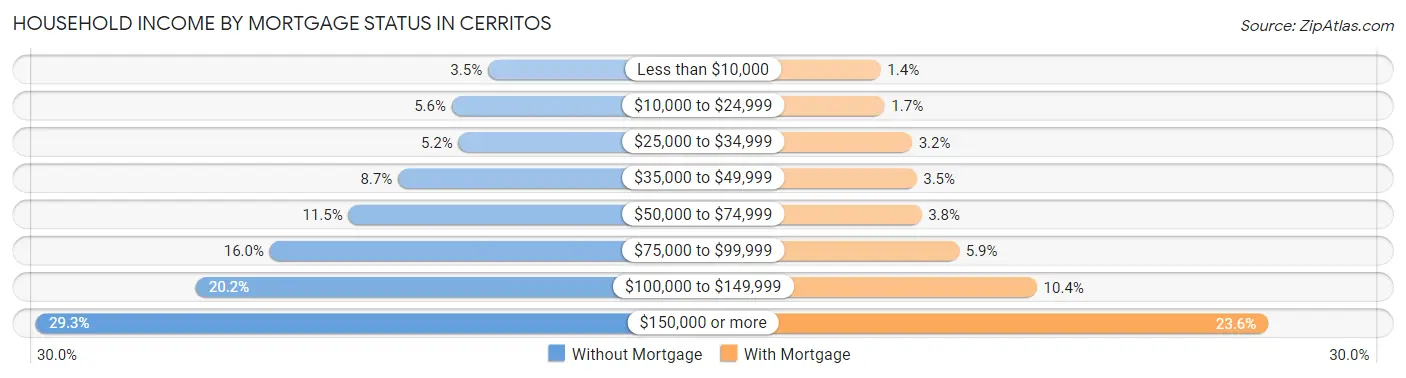
| Household Income | Without Mortgage | With Mortgage |
| Less than $10,000 | 170 (3.5%) | 100 (1.4%) |
| $10,000 to $24,999 | 270 (5.6%) | 116 (1.7%) |
| $25,000 to $34,999 | 251 (5.2%) | 226 (3.2%) |
| $35,000 to $49,999 | 418 (8.7%) | 244 (3.5%) |
| $50,000 to $74,999 | 555 (11.5%) | 264 (3.7%) |
| $75,000 to $99,999 | 772 (16.0%) | 415 (5.9%) |
| $100,000 to $149,999 | 976 (20.2%) | 728 (10.3%) |
| $150,000 or more | 1,417 (29.3%) | 1,657 (23.6%) |
| Total | 4,829 (100.0%) | 7,031 (100.0%) |
Property Value to Household Income Ratio in Cerritos
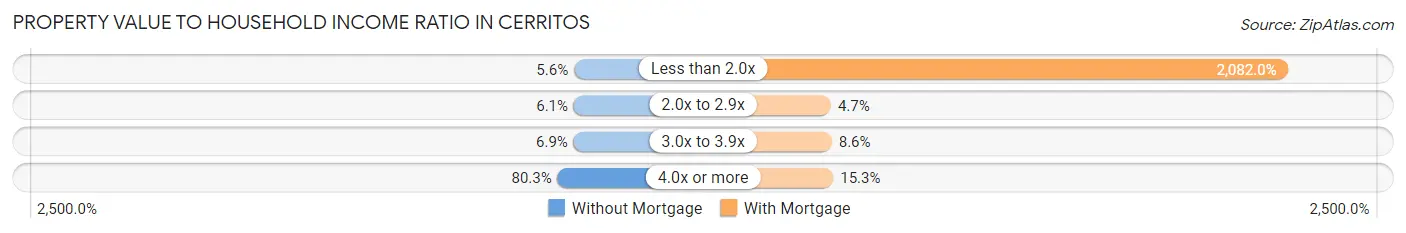
| Value-to-Income Ratio | Without Mortgage | With Mortgage |
| Less than 2.0x | 268 (5.6%) | 146,387 (2,082.0%) |
| 2.0x to 2.9x | 292 (6.0%) | 333 (4.7%) |
| 3.0x to 3.9x | 332 (6.9%) | 604 (8.6%) |
| 4.0x or more | 3,879 (80.3%) | 1,075 (15.3%) |
| Total | 4,829 (100.0%) | 7,031 (100.0%) |
Real Estate Taxes by Mortgage Status in Cerritos
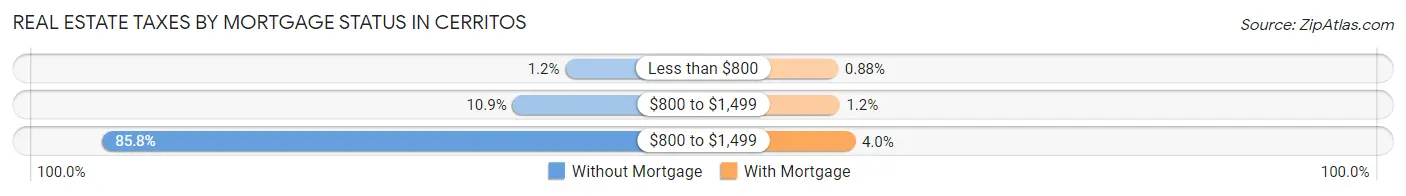
| Property Taxes | Without Mortgage | With Mortgage |
| Less than $800 | 60 (1.2%) | 62 (0.9%) |
| $800 to $1,499 | 526 (10.9%) | 83 (1.2%) |
| $800 to $1,499 | 4,143 (85.8%) | 281 (4.0%) |
| Total | 4,829 (100.0%) | 7,031 (100.0%) |
Health & Disability in Cerritos
Health Insurance Coverage by Age in Cerritos
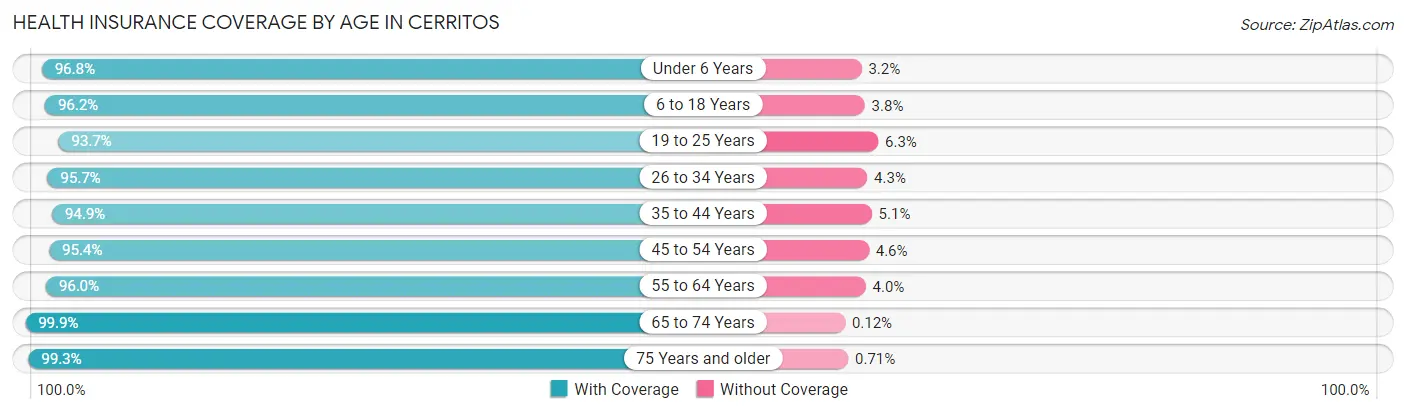
| Age Bracket | With Coverage | Without Coverage |
| Under 6 Years | 2,542 (96.8%) | 84 (3.2%) |
| 6 to 18 Years | 6,551 (96.2%) | 259 (3.8%) |
| 19 to 25 Years | 3,683 (93.7%) | 248 (6.3%) |
| 26 to 34 Years | 4,603 (95.7%) | 205 (4.3%) |
| 35 to 44 Years | 5,061 (94.9%) | 272 (5.1%) |
| 45 to 54 Years | 5,968 (95.4%) | 286 (4.6%) |
| 55 to 64 Years | 6,382 (96.0%) | 264 (4.0%) |
| 65 to 74 Years | 6,716 (99.9%) | 8 (0.1%) |
| 75 Years and older | 5,720 (99.3%) | 41 (0.7%) |
| Total | 47,226 (96.6%) | 1,667 (3.4%) |
Health Insurance Coverage by Citizenship Status in Cerritos
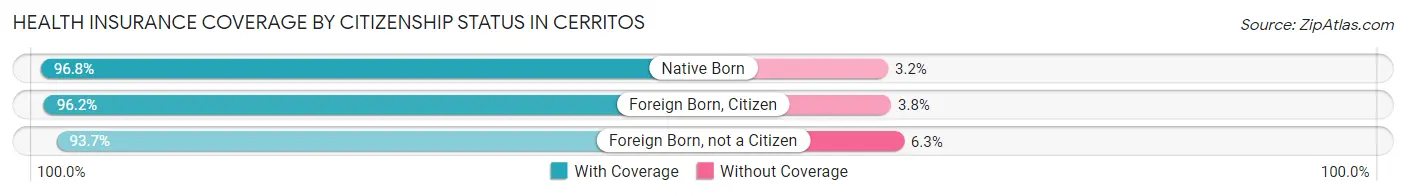
| Citizenship Status | With Coverage | Without Coverage |
| Native Born | 2,542 (96.8%) | 84 (3.2%) |
| Foreign Born, Citizen | 6,551 (96.2%) | 259 (3.8%) |
| Foreign Born, not a Citizen | 3,683 (93.7%) | 248 (6.3%) |
Health Insurance Coverage by Household Income in Cerritos
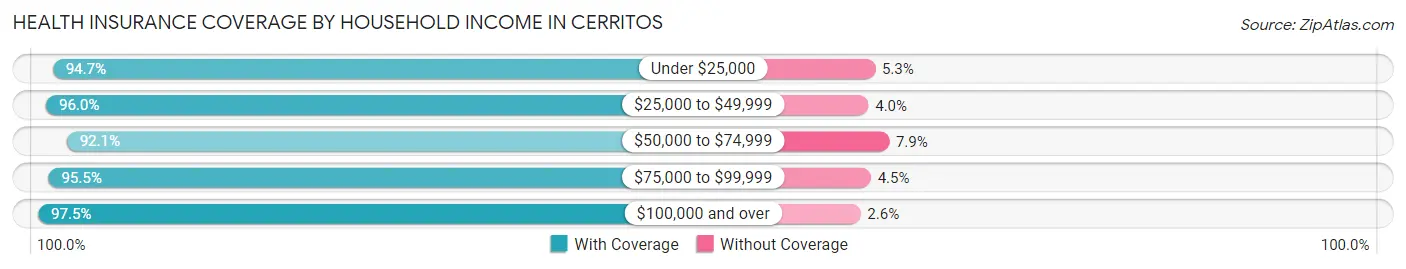
| Household Income | With Coverage | Without Coverage |
| Under $25,000 | 2,064 (94.7%) | 115 (5.3%) |
| $25,000 to $49,999 | 3,522 (96.0%) | 148 (4.0%) |
| $50,000 to $74,999 | 3,581 (92.1%) | 307 (7.9%) |
| $75,000 to $99,999 | 5,005 (95.5%) | 235 (4.5%) |
| $100,000 and over | 32,890 (97.5%) | 862 (2.5%) |
Public vs Private Health Insurance Coverage by Age in Cerritos
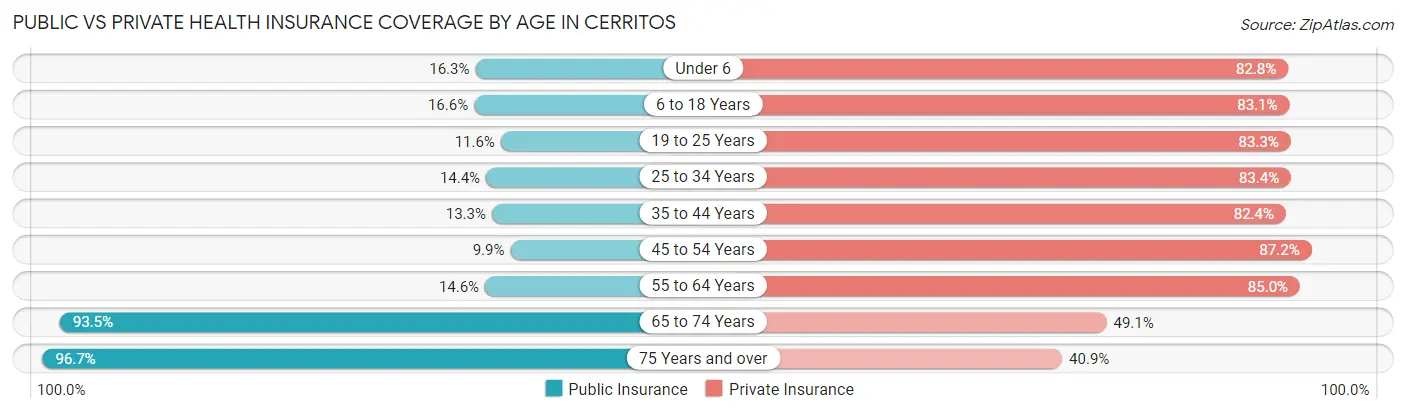
| Age Bracket | Public Insurance | Private Insurance |
| Under 6 | 429 (16.3%) | 2,175 (82.8%) |
| 6 to 18 Years | 1,130 (16.6%) | 5,657 (83.1%) |
| 19 to 25 Years | 457 (11.6%) | 3,275 (83.3%) |
| 25 to 34 Years | 691 (14.4%) | 4,009 (83.4%) |
| 35 to 44 Years | 708 (13.3%) | 4,395 (82.4%) |
| 45 to 54 Years | 616 (9.9%) | 5,453 (87.2%) |
| 55 to 64 Years | 967 (14.5%) | 5,651 (85.0%) |
| 65 to 74 Years | 6,284 (93.5%) | 3,304 (49.1%) |
| 75 Years and over | 5,570 (96.7%) | 2,356 (40.9%) |
| Total | 16,852 (34.5%) | 36,275 (74.2%) |
Disability Status by Sex by Age in Cerritos
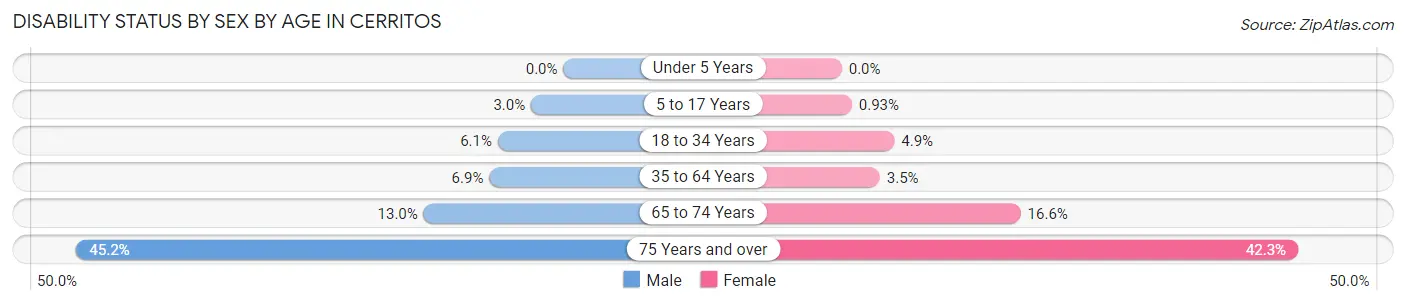
| Age Bracket | Male | Female |
| Under 5 Years | 0 (0.0%) | 0 (0.0%) |
| 5 to 17 Years | 119 (3.0%) | 28 (0.9%) |
| 18 to 34 Years | 288 (6.1%) | 213 (4.9%) |
| 35 to 64 Years | 606 (6.9%) | 333 (3.5%) |
| 65 to 74 Years | 401 (13.0%) | 603 (16.6%) |
| 75 Years and over | 1,221 (45.2%) | 1,295 (42.3%) |
Disability Class by Sex by Age in Cerritos
Disability Class: Hearing Difficulty
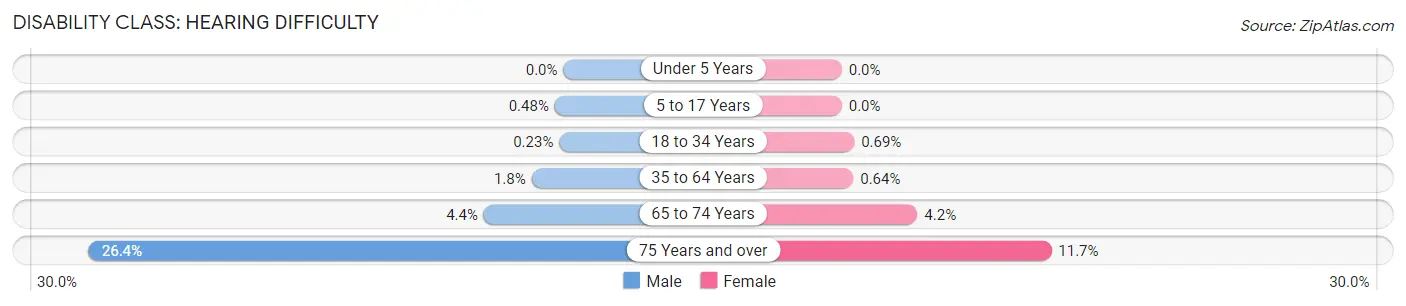
| Age Bracket | Male | Female |
| Under 5 Years | 0 (0.0%) | 0 (0.0%) |
| 5 to 17 Years | 19 (0.5%) | 0 (0.0%) |
| 18 to 34 Years | 11 (0.2%) | 30 (0.7%) |
| 35 to 64 Years | 156 (1.8%) | 60 (0.6%) |
| 65 to 74 Years | 137 (4.4%) | 153 (4.2%) |
| 75 Years and over | 714 (26.4%) | 357 (11.7%) |
Disability Class: Vision Difficulty
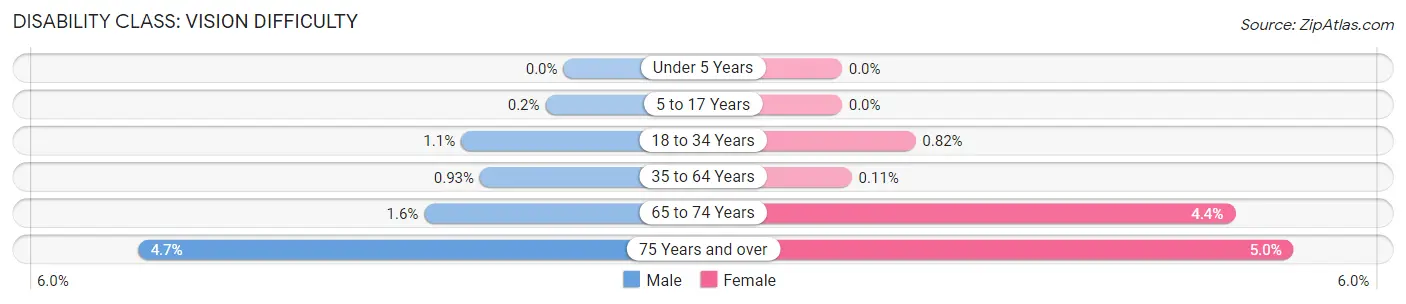
| Age Bracket | Male | Female |
| Under 5 Years | 0 (0.0%) | 0 (0.0%) |
| 5 to 17 Years | 8 (0.2%) | 0 (0.0%) |
| 18 to 34 Years | 54 (1.1%) | 36 (0.8%) |
| 35 to 64 Years | 82 (0.9%) | 10 (0.1%) |
| 65 to 74 Years | 48 (1.5%) | 159 (4.4%) |
| 75 Years and over | 128 (4.7%) | 154 (5.0%) |
Disability Class: Cognitive Difficulty
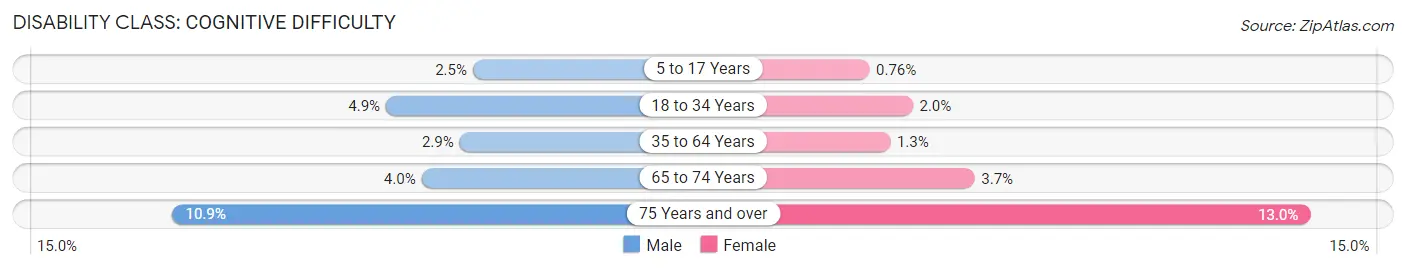
| Age Bracket | Male | Female |
| 5 to 17 Years | 100 (2.5%) | 23 (0.8%) |
| 18 to 34 Years | 234 (4.9%) | 86 (2.0%) |
| 35 to 64 Years | 255 (2.9%) | 126 (1.3%) |
| 65 to 74 Years | 122 (4.0%) | 134 (3.7%) |
| 75 Years and over | 294 (10.9%) | 399 (13.0%) |
Disability Class: Ambulatory Difficulty
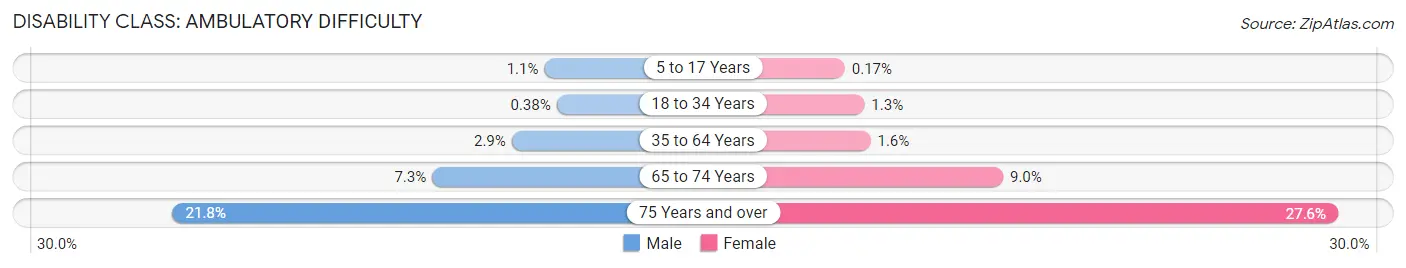
| Age Bracket | Male | Female |
| 5 to 17 Years | 42 (1.1%) | 5 (0.2%) |
| 18 to 34 Years | 18 (0.4%) | 55 (1.3%) |
| 35 to 64 Years | 254 (2.9%) | 151 (1.6%) |
| 65 to 74 Years | 226 (7.3%) | 326 (9.0%) |
| 75 Years and over | 588 (21.8%) | 845 (27.6%) |
Disability Class: Self-Care Difficulty
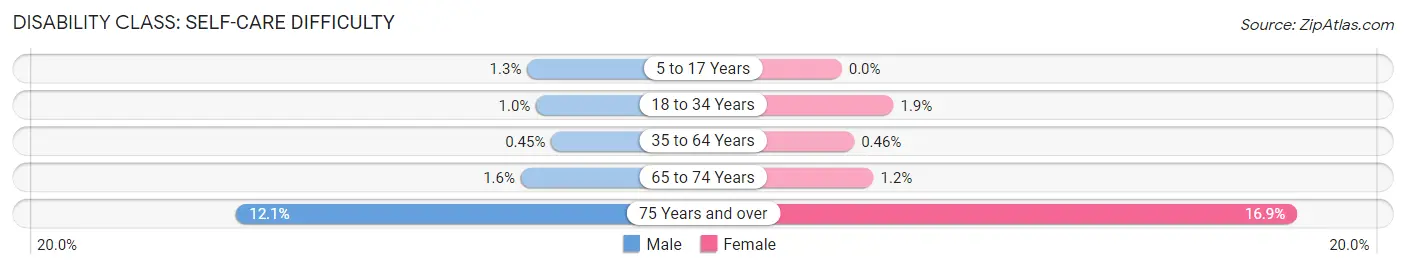
| Age Bracket | Male | Female |
| 5 to 17 Years | 53 (1.3%) | 0 (0.0%) |
| 18 to 34 Years | 48 (1.0%) | 84 (1.9%) |
| 35 to 64 Years | 40 (0.4%) | 43 (0.5%) |
| 65 to 74 Years | 49 (1.6%) | 43 (1.2%) |
| 75 Years and over | 328 (12.1%) | 517 (16.9%) |
Technology Access in Cerritos
Computing Device Access in Cerritos
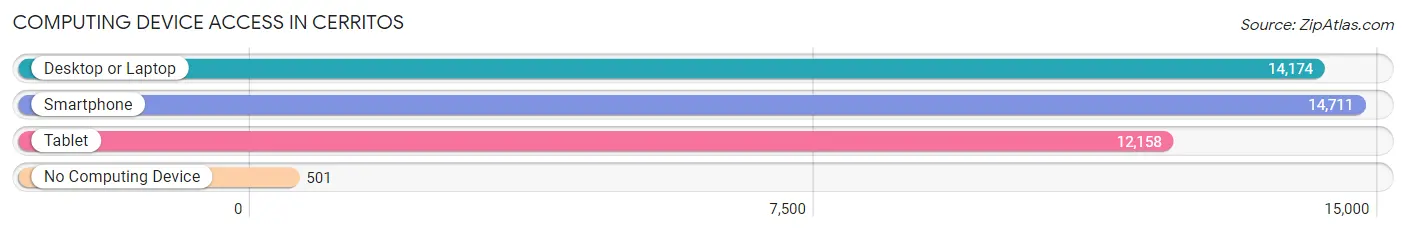
| Device Type | # Households | % Households |
| Desktop or Laptop | 14,174 | 89.9% |
| Smartphone | 14,711 | 93.3% |
| Tablet | 12,158 | 77.1% |
| No Computing Device | 501 | 3.2% |
| Total | 15,772 | 100.0% |
Internet Access in Cerritos
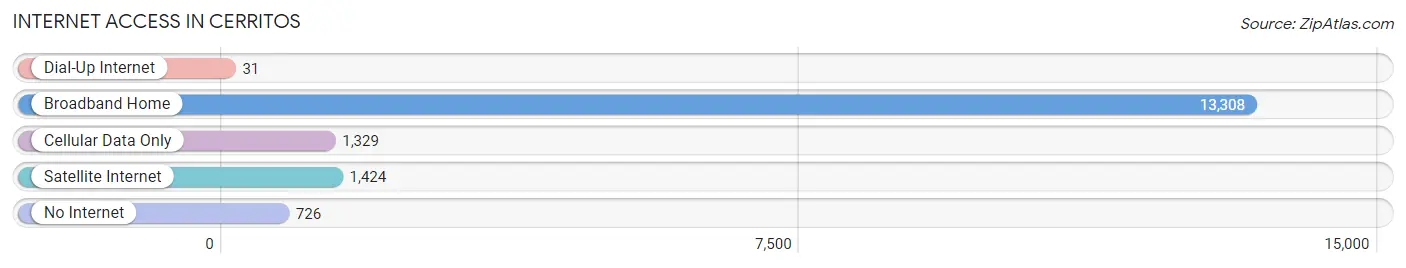
| Internet Type | # Households | % Households |
| Dial-Up Internet | 31 | 0.2% |
| Broadband Home | 13,308 | 84.4% |
| Cellular Data Only | 1,329 | 8.4% |
| Satellite Internet | 1,424 | 9.0% |
| No Internet | 726 | 4.6% |
| Total | 15,772 | 100.0% |
Cerritos Summary
Cerritos, California is a city located in Los Angeles County, California. It is located in the southeastern corner of the county, about 20 miles southeast of downtown Los Angeles. The city was incorporated in 1956 and has a population of approximately 50,000 people.
History
The area that is now Cerritos was originally inhabited by the Tongva Native American tribe. The first Europeans to settle in the area were Spanish missionaries in the late 1700s. The area was then part of the Rancho Los Coyotes Mexican land grant. In the mid-1800s, the area was divided into several large ranches, including the Rancho Los Cerritos. The ranch was owned by the Bixby family, who were prominent in the area.
In 1956, the area was incorporated as the City of Cerritos. The city was named after the Rancho Los Cerritos, which was named after the Spanish word for “little hills.” The city was initially a rural farming community, but it quickly developed into a suburban community.
Geography
Cerritos is located in the southeastern corner of Los Angeles County, about 20 miles southeast of downtown Los Angeles. The city is bordered by the cities of Artesia, Bellflower, Lakewood, and Long Beach. The city covers an area of about 9.2 square miles and has a population density of about 5,400 people per square mile.
The city is located in the Los Angeles Basin and is surrounded by several hills. The highest point in the city is the Cerritos Hill, which is about 500 feet above sea level. The city is also located near several rivers, including the Los Angeles River, the San Gabriel River, and the Santa Ana River.
Economy
Cerritos is a major economic center in Los Angeles County. The city is home to several large companies, including Toyota Motor Sales USA, Inc., which has its headquarters in the city. Other major employers in the city include the Cerritos Auto Square, the Cerritos Towne Center, and the Cerritos Center for the Performing Arts.
The city also has a thriving retail sector, with several shopping centers and malls. The Cerritos Towne Center is the largest shopping center in the city and is home to over 150 stores and restaurants.
Demographics
As of the 2010 census, the population of Cerritos was 49,041. The racial makeup of the city was 44.3% White, 2.7% African American, 0.5% Native American, 37.2% Asian, 0.2% Pacific Islander, 11.2% from other races, and 4.1% from two or more races. Hispanic or Latino of any race were 24.6% of the population.
The median household income in Cerritos was $77,890 in 2018. The median home value was $637,400 in 2018. The city has a high rate of homeownership, with over 70% of residents owning their own homes.
Common Questions
What is Per Capita Income in Cerritos?
Per Capita income in Cerritos is $51,243.
What is the Median Family Income in Cerritos?
Median Family Income in Cerritos is $129,779.
What is the Median Household income in Cerritos?
Median Household Income in Cerritos is $124,460.
What is Income or Wage Gap in Cerritos?
Income or Wage Gap in Cerritos is 26.7%.
Women in Cerritos earn 73.3 cents for every dollar earned by a man.
What is Family Income Deficit in Cerritos?
Family Income Deficit in Cerritos is $8,684.
Families that are below poverty line in Cerritos earn $8,684 less on average than the poverty threshold level.
What is Inequality or Gini Index in Cerritos?
Inequality or Gini Index in Cerritos is 0.42.
What is the Total Population of Cerritos?
Total Population of Cerritos is 49,016.
What is the Total Male Population of Cerritos?
Total Male Population of Cerritos is 24,583.
What is the Total Female Population of Cerritos?
Total Female Population of Cerritos is 24,433.
What is the Ratio of Males per 100 Females in Cerritos?
There are 100.61 Males per 100 Females in Cerritos.
What is the Ratio of Females per 100 Males in Cerritos?
There are 99.39 Females per 100 Males in Cerritos.
What is the Median Population Age in Cerritos?
Median Population Age in Cerritos is 46.6 Years.
What is the Average Family Size in Cerritos
Average Family Size in Cerritos is 3.4 People.
What is the Average Household Size in Cerritos
Average Household Size in Cerritos is 3.1 People.
How Large is the Labor Force in Cerritos?
There are 23,707 People in the Labor Forcein in Cerritos.
What is the Percentage of People in the Labor Force in Cerritos?
57.9% of People are in the Labor Force in Cerritos.
What is the Unemployment Rate in Cerritos?
Unemployment Rate in Cerritos is 5.4%.