Manteca, CA Map & Demographics
Manteca Map
Manteca Overview
$36,000
PER CAPITA INCOME
$95,730
AVG FAMILY INCOME
$89,966
AVG HOUSEHOLD INCOME
26.7%
WAGE / INCOME GAP [ % ]
73.3¢/ $1
WAGE / INCOME GAP [ $ ]
$9,716
FAMILY INCOME DEFICIT
0.41
INEQUALITY / GINI INDEX
83,897
TOTAL POPULATION
42,697
MALE POPULATION
41,200
FEMALE POPULATION
103.63
MALES / 100 FEMALES
96.49
FEMALES / 100 MALES
37.0
MEDIAN AGE
3.6
AVG FAMILY SIZE
3.2
AVG HOUSEHOLD SIZE
39,025
LABOR FORCE [ PEOPLE ]
60.2%
PERCENT IN LABOR FORCE
6.4%
UNEMPLOYMENT RATE
Manteca Area Codes
Income in Manteca
Income Overview in Manteca
Per Capita Income in Manteca is $36,000, while median incomes of families and households are $95,730 and $89,966 respectively.
| Characteristic | Number | Measure |
| Per Capita Income | 83,897 | $36,000 |
| Median Family Income | 20,152 | $95,730 |
| Mean Family Income | 20,152 | $120,103 |
| Median Household Income | 26,217 | $89,966 |
| Mean Household Income | 26,217 | $111,632 |
| Income Deficit | 20,152 | $9,716 |
| Wage / Income Gap (%) | 83,897 | 26.73% |
| Wage / Income Gap ($) | 83,897 | 73.27¢ per $1 |
| Gini / Inequality Index | 83,897 | 0.41 |
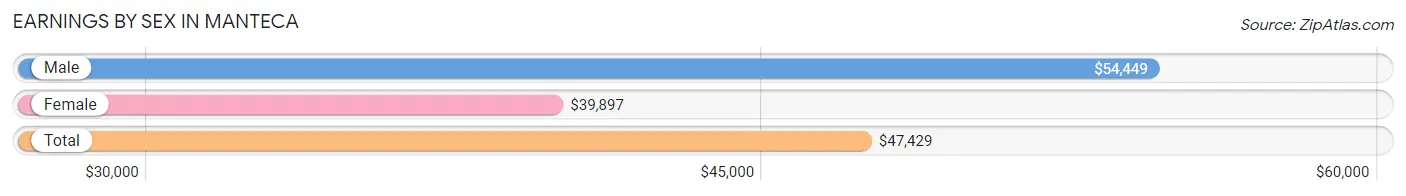
Earnings by Sex in Manteca
Average Earnings in Manteca are $47,429, $54,449 for men and $39,897 for women, a difference of 26.7%.
| Sex | Number | Average Earnings |
| Male | 21,883 (55.4%) | $54,449 |
| Female | 17,613 (44.6%) | $39,897 |
| Total | 39,496 (100.0%) | $47,429 |
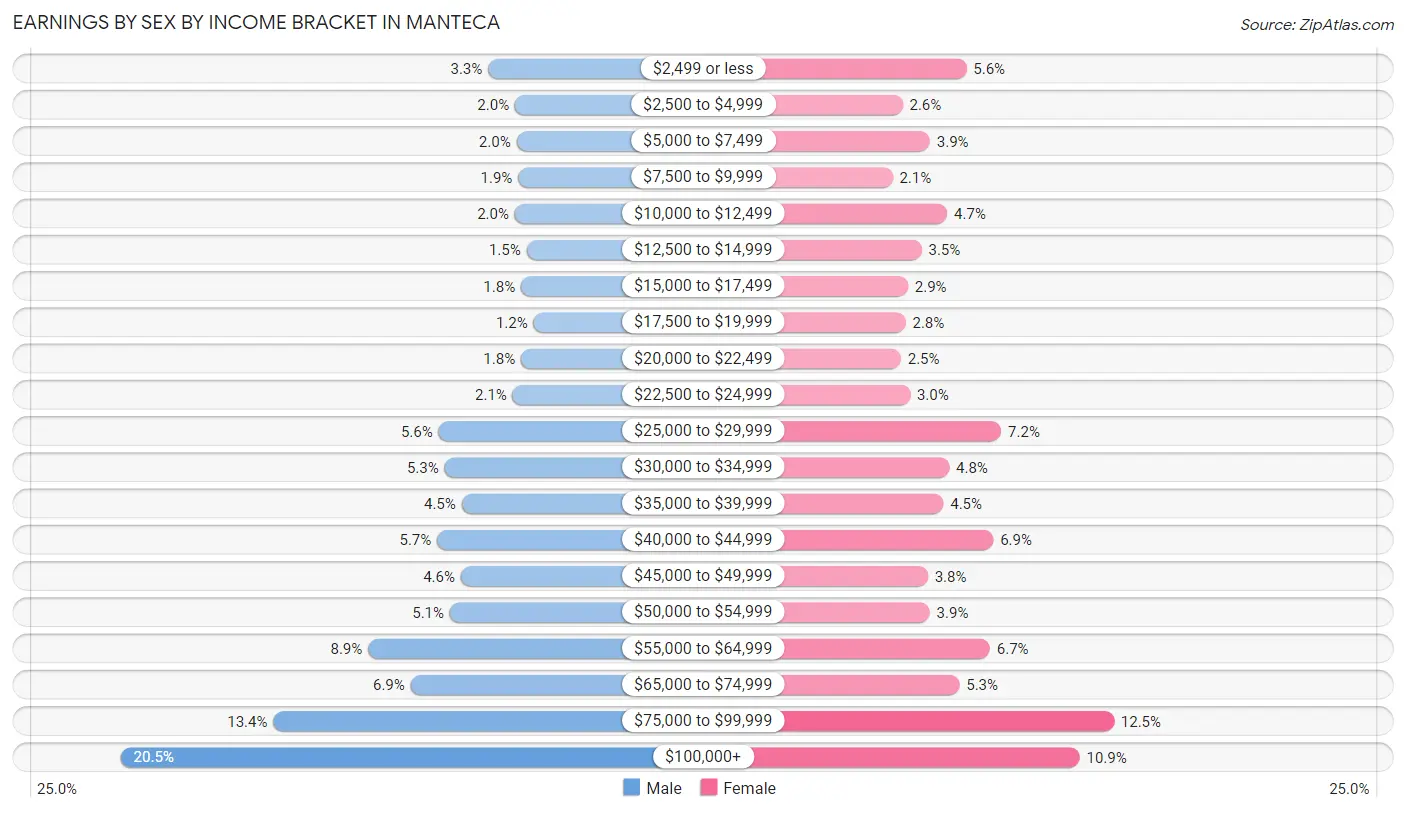
Earnings by Sex by Income Bracket in Manteca
The most common earnings brackets in Manteca are $100,000+ for men (4,485 | 20.5%) and $75,000 to $99,999 for women (2,204 | 12.5%).
| Income | Male | Female |
| $2,499 or less | 721 (3.3%) | 987 (5.6%) |
| $2,500 to $4,999 | 444 (2.0%) | 460 (2.6%) |
| $5,000 to $7,499 | 430 (2.0%) | 686 (3.9%) |
| $7,500 to $9,999 | 412 (1.9%) | 377 (2.1%) |
| $10,000 to $12,499 | 447 (2.0%) | 828 (4.7%) |
| $12,500 to $14,999 | 327 (1.5%) | 616 (3.5%) |
| $15,000 to $17,499 | 384 (1.8%) | 503 (2.9%) |
| $17,500 to $19,999 | 254 (1.2%) | 484 (2.8%) |
| $20,000 to $22,499 | 383 (1.8%) | 445 (2.5%) |
| $22,500 to $24,999 | 468 (2.1%) | 522 (3.0%) |
| $25,000 to $29,999 | 1,227 (5.6%) | 1,274 (7.2%) |
| $30,000 to $34,999 | 1,167 (5.3%) | 843 (4.8%) |
| $35,000 to $39,999 | 992 (4.5%) | 796 (4.5%) |
| $40,000 to $44,999 | 1,243 (5.7%) | 1,208 (6.9%) |
| $45,000 to $49,999 | 1,001 (4.6%) | 668 (3.8%) |
| $50,000 to $54,999 | 1,112 (5.1%) | 684 (3.9%) |
| $55,000 to $64,999 | 1,949 (8.9%) | 1,180 (6.7%) |
| $65,000 to $74,999 | 1,515 (6.9%) | 928 (5.3%) |
| $75,000 to $99,999 | 2,922 (13.4%) | 2,204 (12.5%) |
| $100,000+ | 4,485 (20.5%) | 1,920 (10.9%) |
| Total | 21,883 (100.0%) | 17,613 (100.0%) |
Earnings by Sex by Educational Attainment in Manteca
Average earnings in Manteca are $59,590 for men and $42,156 for women, a difference of 29.3%. Men with an educational attainment of graduate degree enjoy the highest average annual earnings of $111,411, while those with less than high school education earn the least with $39,925. Women with an educational attainment of graduate degree earn the most with the average annual earnings of $82,130, while those with less than high school education have the smallest earnings of $23,837.

| Educational Attainment | Male Income | Female Income |
| Less than High School | $39,925 | $23,837 |
| High School Diploma | $52,910 | $33,320 |
| College or Associate's Degree | $67,080 | $41,403 |
| Bachelor's Degree | $83,487 | $61,791 |
| Graduate Degree | $111,411 | $82,130 |
| Total | $59,590 | $42,156 |
Family Income in Manteca
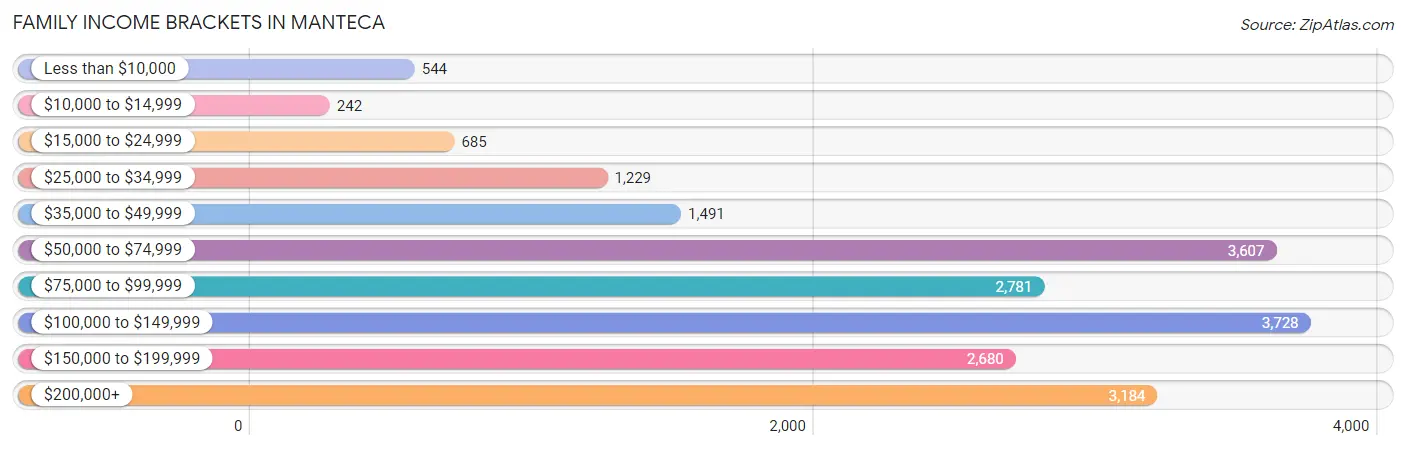
Family Income Brackets in Manteca
According to the Manteca family income data, there are 3,728 families falling into the $100,000 to $149,999 income range, which is the most common income bracket and makes up 18.5% of all families. Conversely, the $10,000 to $14,999 income bracket is the least frequent group with only 242 families (1.2%) belonging to this category.
| Income Bracket | # Families | % Families |
| Less than $10,000 | 544 | 2.7% |
| $10,000 to $14,999 | 242 | 1.2% |
| $15,000 to $24,999 | 685 | 3.4% |
| $25,000 to $34,999 | 1,229 | 6.1% |
| $35,000 to $49,999 | 1,491 | 7.4% |
| $50,000 to $74,999 | 3,607 | 17.9% |
| $75,000 to $99,999 | 2,781 | 13.8% |
| $100,000 to $149,999 | 3,728 | 18.5% |
| $150,000 to $199,999 | 2,680 | 13.3% |
| $200,000+ | 3,184 | 15.8% |
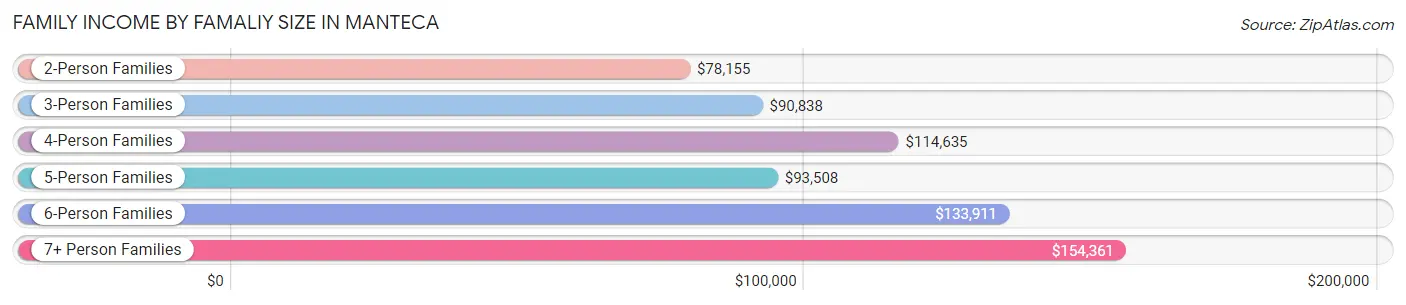
Family Income by Famaliy Size in Manteca
7+ person families (913 | 4.5%) account for the highest median family income in Manteca with $154,361 per family, while 2-person families (7,483 | 37.1%) have the highest median income of $39,078 per family member.
| Income Bracket | # Families | Median Income |
| 2-Person Families | 7,483 (37.1%) | $78,155 |
| 3-Person Families | 4,645 (23.1%) | $90,838 |
| 4-Person Families | 3,873 (19.2%) | $114,635 |
| 5-Person Families | 2,459 (12.2%) | $93,508 |
| 6-Person Families | 779 (3.9%) | $133,911 |
| 7+ Person Families | 913 (4.5%) | $154,361 |
| Total | 20,152 (100.0%) | $95,730 |
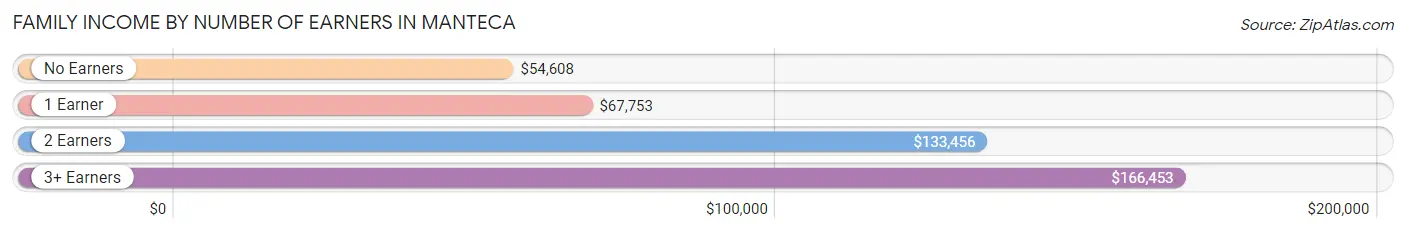
Family Income by Number of Earners in Manteca
The median family income in Manteca is $95,730, with families comprising 3+ earners (3,098) having the highest median family income of $166,453, while families with no earners (2,757) have the lowest median family income of $54,608, accounting for 15.4% and 13.7% of families, respectively.
| Number of Earners | # Families | Median Income |
| No Earners | 2,757 (13.7%) | $54,608 |
| 1 Earner | 7,570 (37.6%) | $67,753 |
| 2 Earners | 6,727 (33.4%) | $133,456 |
| 3+ Earners | 3,098 (15.4%) | $166,453 |
| Total | 20,152 (100.0%) | $95,730 |
Household Income in Manteca
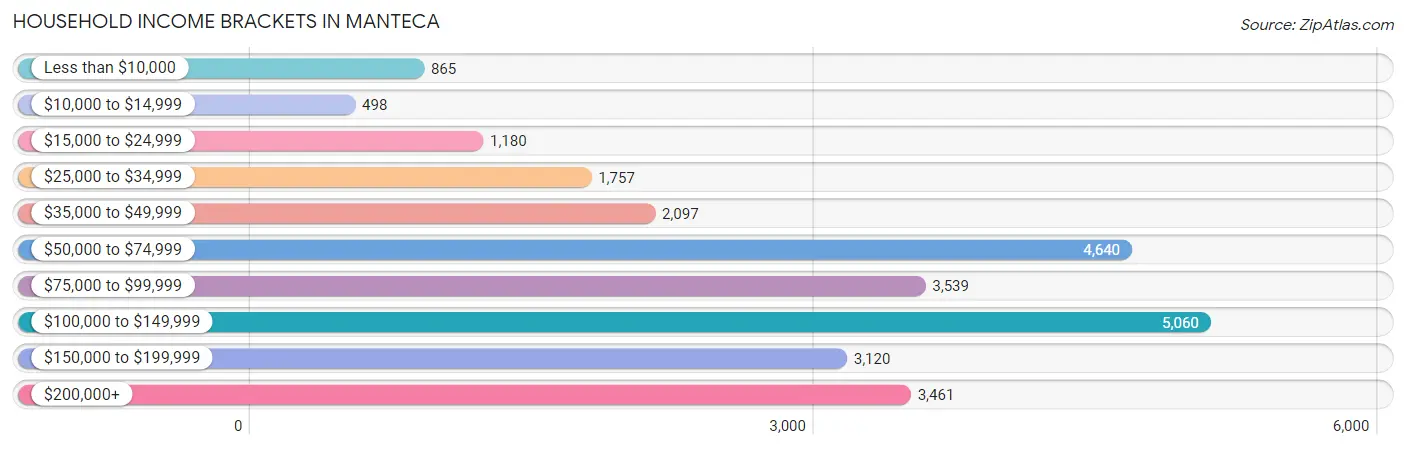
Household Income Brackets in Manteca
With 5,060 households falling in the category, the $100,000 to $149,999 income range is the most frequent in Manteca, accounting for 19.3% of all households. In contrast, only 498 households (1.9%) fall into the $10,000 to $14,999 income bracket, making it the least populous group.
| Income Bracket | # Households | % Households |
| Less than $10,000 | 865 | 3.3% |
| $10,000 to $14,999 | 498 | 1.9% |
| $15,000 to $24,999 | 1,180 | 4.5% |
| $25,000 to $34,999 | 1,757 | 6.7% |
| $35,000 to $49,999 | 2,097 | 8.0% |
| $50,000 to $74,999 | 4,640 | 17.7% |
| $75,000 to $99,999 | 3,539 | 13.5% |
| $100,000 to $149,999 | 5,060 | 19.3% |
| $150,000 to $199,999 | 3,120 | 11.9% |
| $200,000+ | 3,461 | 13.2% |
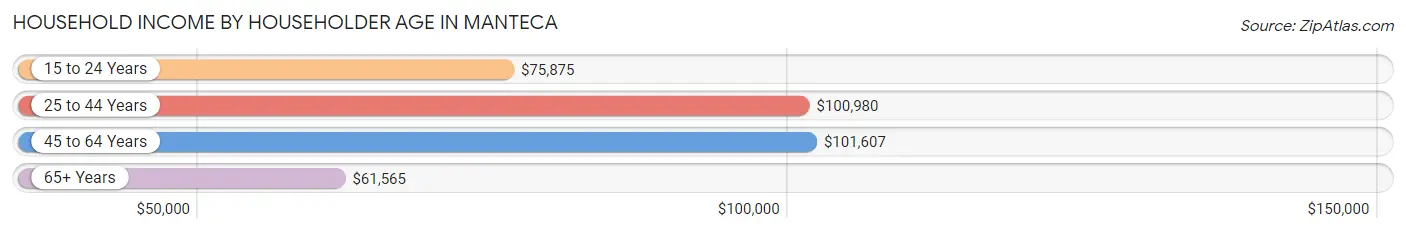
Household Income by Householder Age in Manteca
The median household income in Manteca is $89,966, with the highest median household income of $101,607 found in the 45 to 64 years age bracket for the primary householder. A total of 10,363 households (39.5%) fall into this category. Meanwhile, the 65+ years age bracket for the primary householder has the lowest median household income of $61,565, with 6,576 households (25.1%) in this group.
| Income Bracket | # Households | Median Income |
| 15 to 24 Years | 416 (1.6%) | $75,875 |
| 25 to 44 Years | 8,862 (33.8%) | $100,980 |
| 45 to 64 Years | 10,363 (39.5%) | $101,607 |
| 65+ Years | 6,576 (25.1%) | $61,565 |
| Total | 26,217 (100.0%) | $89,966 |
Poverty in Manteca
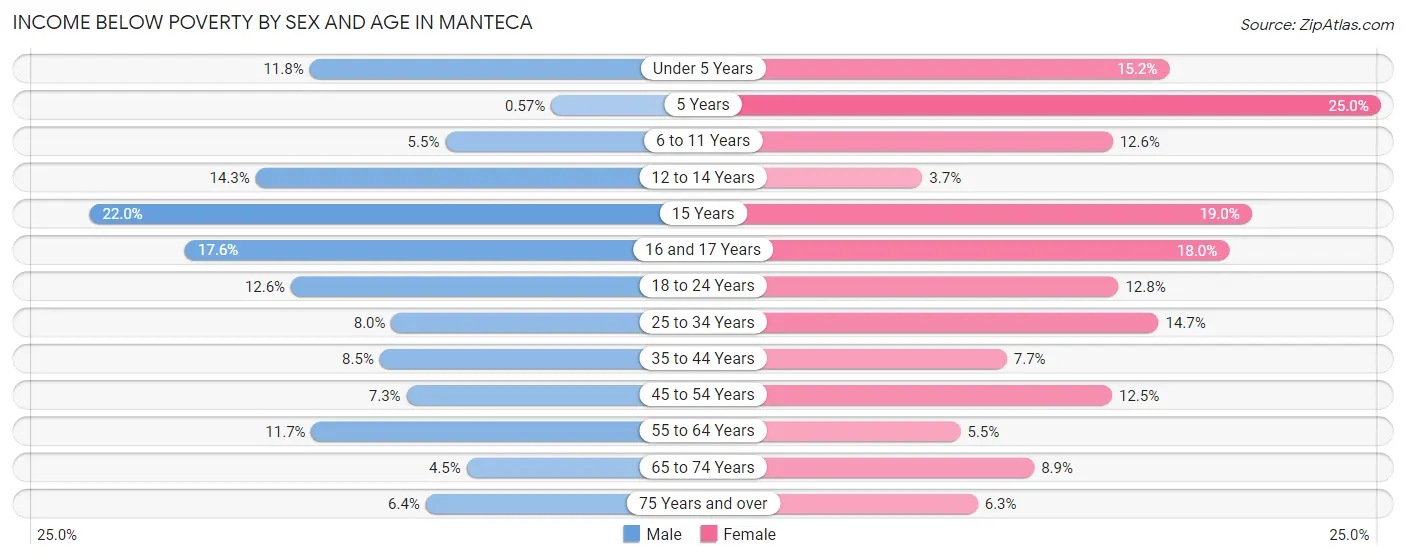
Income Below Poverty by Sex and Age in Manteca
With 9.2% poverty level for males and 10.8% for females among the residents of Manteca, 15 year old males and 5 year old females are the most vulnerable to poverty, with 93 males (22.0%) and 121 females (25.0%) in their respective age groups living below the poverty level.
| Age Bracket | Male | Female |
| Under 5 Years | 399 (11.8%) | 345 (15.2%) |
| 5 Years | 4 (0.6%) | 121 (25.0%) |
| 6 to 11 Years | 191 (5.5%) | 482 (12.6%) |
| 12 to 14 Years | 299 (14.3%) | 54 (3.7%) |
| 15 Years | 93 (22.0%) | 120 (19.0%) |
| 16 and 17 Years | 187 (17.6%) | 193 (18.0%) |
| 18 to 24 Years | 483 (12.6%) | 411 (12.8%) |
| 25 to 34 Years | 472 (8.0%) | 844 (14.7%) |
| 35 to 44 Years | 519 (8.5%) | 415 (7.7%) |
| 45 to 54 Years | 395 (7.3%) | 665 (12.5%) |
| 55 to 64 Years | 612 (11.7%) | 282 (5.5%) |
| 65 to 74 Years | 133 (4.5%) | 326 (8.9%) |
| 75 Years and over | 120 (6.4%) | 170 (6.3%) |
| Total | 3,907 (9.2%) | 4,428 (10.8%) |
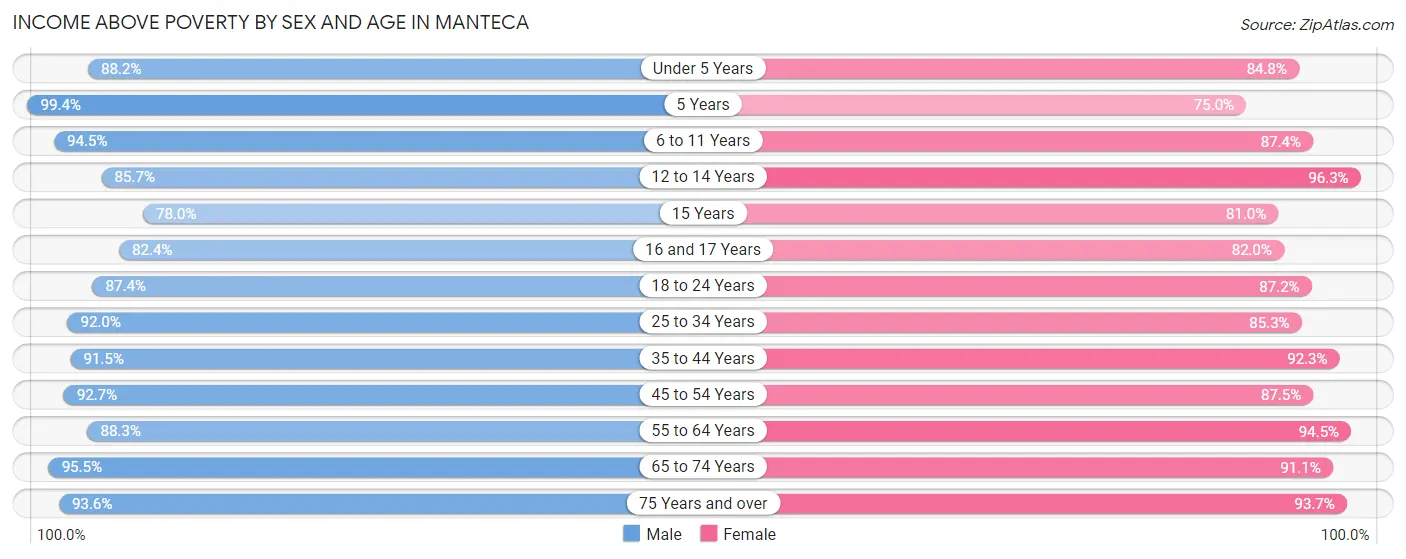
Income Above Poverty by Sex and Age in Manteca
According to the poverty statistics in Manteca, males aged 5 years and females aged 12 to 14 years are the age groups that are most secure financially, with 99.4% of males and 96.3% of females in these age groups living above the poverty line.
| Age Bracket | Male | Female |
| Under 5 Years | 2,987 (88.2%) | 1,926 (84.8%) |
| 5 Years | 699 (99.4%) | 363 (75.0%) |
| 6 to 11 Years | 3,292 (94.5%) | 3,352 (87.4%) |
| 12 to 14 Years | 1,795 (85.7%) | 1,391 (96.3%) |
| 15 Years | 330 (78.0%) | 511 (81.0%) |
| 16 and 17 Years | 878 (82.4%) | 881 (82.0%) |
| 18 to 24 Years | 3,338 (87.4%) | 2,791 (87.2%) |
| 25 to 34 Years | 5,444 (92.0%) | 4,896 (85.3%) |
| 35 to 44 Years | 5,576 (91.5%) | 5,000 (92.3%) |
| 45 to 54 Years | 5,030 (92.7%) | 4,639 (87.5%) |
| 55 to 64 Years | 4,622 (88.3%) | 4,837 (94.5%) |
| 65 to 74 Years | 2,827 (95.5%) | 3,323 (91.1%) |
| 75 Years and over | 1,757 (93.6%) | 2,525 (93.7%) |
| Total | 38,575 (90.8%) | 36,435 (89.2%) |
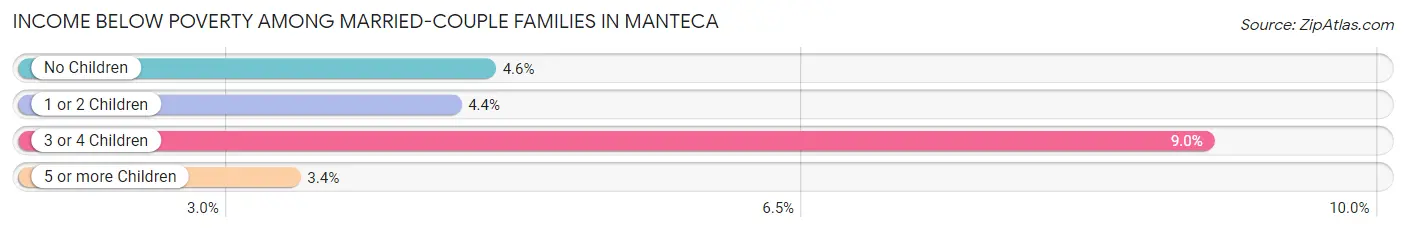
Income Below Poverty Among Married-Couple Families in Manteca
The poverty statistics for married-couple families in Manteca show that 4.9% or 711 of the total 14,481 families live below the poverty line. Families with 3 or 4 children have the highest poverty rate of 8.9%, comprising of 129 families. On the other hand, families with 5 or more children have the lowest poverty rate of 3.4%, which includes 10 families.
| Children | Above Poverty | Below Poverty |
| No Children | 7,328 (95.4%) | 351 (4.6%) |
| 1 or 2 Children | 4,844 (95.6%) | 221 (4.4%) |
| 3 or 4 Children | 1,312 (91.0%) | 129 (8.9%) |
| 5 or more Children | 286 (96.6%) | 10 (3.4%) |
| Total | 13,770 (95.1%) | 711 (4.9%) |
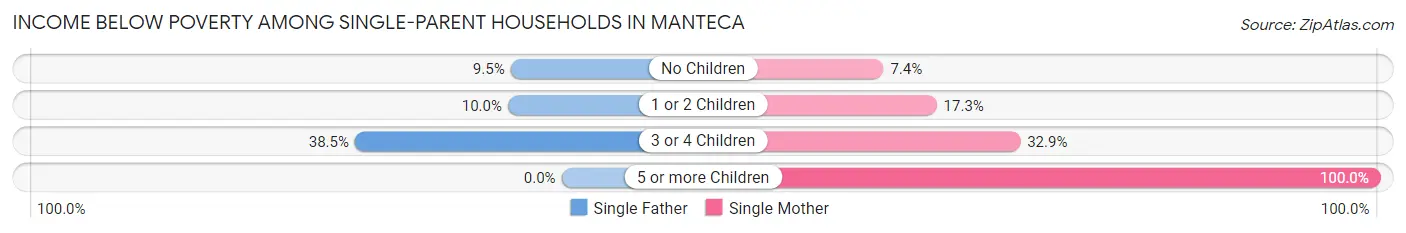
Income Below Poverty Among Single-Parent Households in Manteca
According to the poverty data in Manteca, 12.7% or 250 single-father households and 15.8% or 583 single-mother households are living below the poverty line. Among single-father households, those with 3 or 4 children have the highest poverty rate, with 77 households (38.5%) experiencing poverty. Likewise, among single-mother households, those with 5 or more children have the highest poverty rate, with 12 households (100.0%) falling below the poverty line.
| Children | Single Father | Single Mother |
| No Children | 81 (9.5%) | 103 (7.4%) |
| 1 or 2 Children | 92 (10.0%) | 320 (17.3%) |
| 3 or 4 Children | 77 (38.5%) | 148 (32.9%) |
| 5 or more Children | 0 (0.0%) | 12 (100.0%) |
| Total | 250 (12.7%) | 583 (15.8%) |
Income Below Poverty Among Married-Couple vs Single-Parent Households in Manteca
The poverty data for Manteca shows that 711 of the married-couple family households (4.9%) and 833 of the single-parent households (14.7%) are living below the poverty level. Within the married-couple family households, those with 3 or 4 children have the highest poverty rate, with 129 households (8.9%) falling below the poverty line. Among the single-parent households, those with 5 or more children have the highest poverty rate, with 12 household (100.0%) living below poverty.
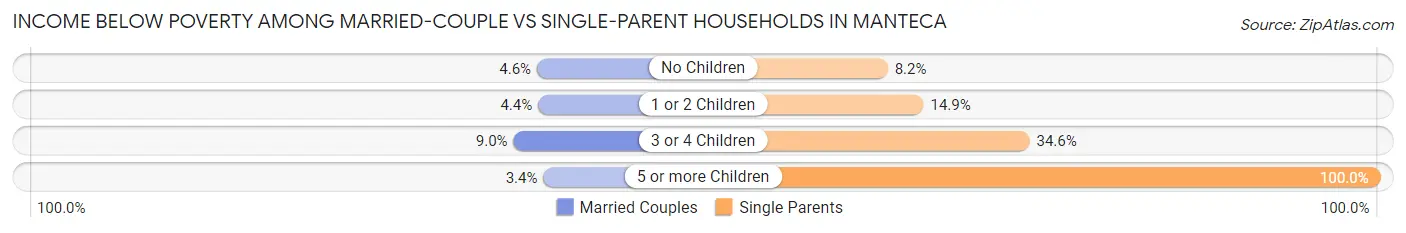
| Children | Married-Couple Families | Single-Parent Households |
| No Children | 351 (4.6%) | 184 (8.2%) |
| 1 or 2 Children | 221 (4.4%) | 412 (14.9%) |
| 3 or 4 Children | 129 (8.9%) | 225 (34.6%) |
| 5 or more Children | 10 (3.4%) | 12 (100.0%) |
| Total | 711 (4.9%) | 833 (14.7%) |
Race in Manteca
The most populous races in Manteca are White / Caucasian (42,635 | 50.8%), Hispanic or Latino (33,522 | 40.0%), and Two or more Races (14,959 | 17.8%).
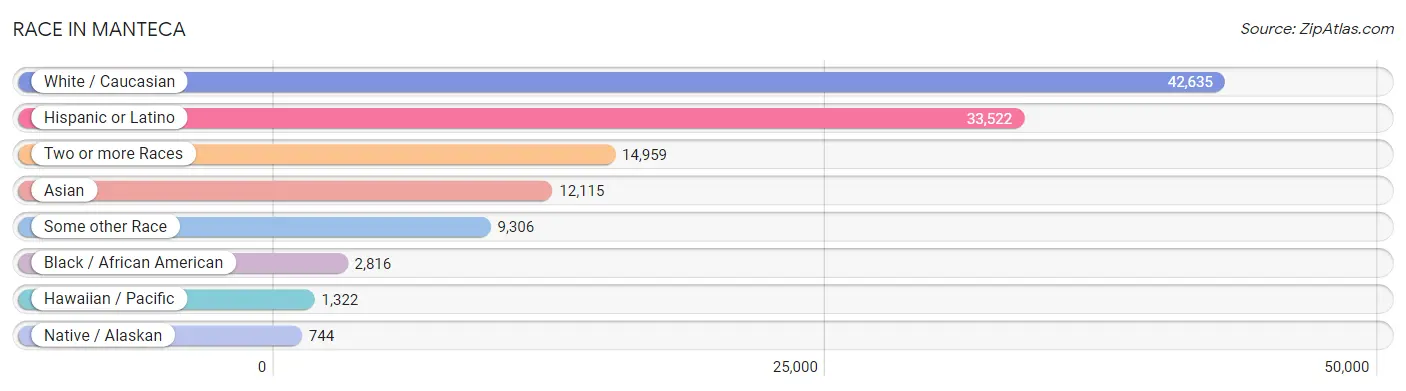
| Race | # Population | % Population |
| Asian | 12,115 | 14.4% |
| Black / African American | 2,816 | 3.4% |
| Hawaiian / Pacific | 1,322 | 1.6% |
| Hispanic or Latino | 33,522 | 40.0% |
| Native / Alaskan | 744 | 0.9% |
| White / Caucasian | 42,635 | 50.8% |
| Two or more Races | 14,959 | 17.8% |
| Some other Race | 9,306 | 11.1% |
| Total | 83,897 | 100.0% |
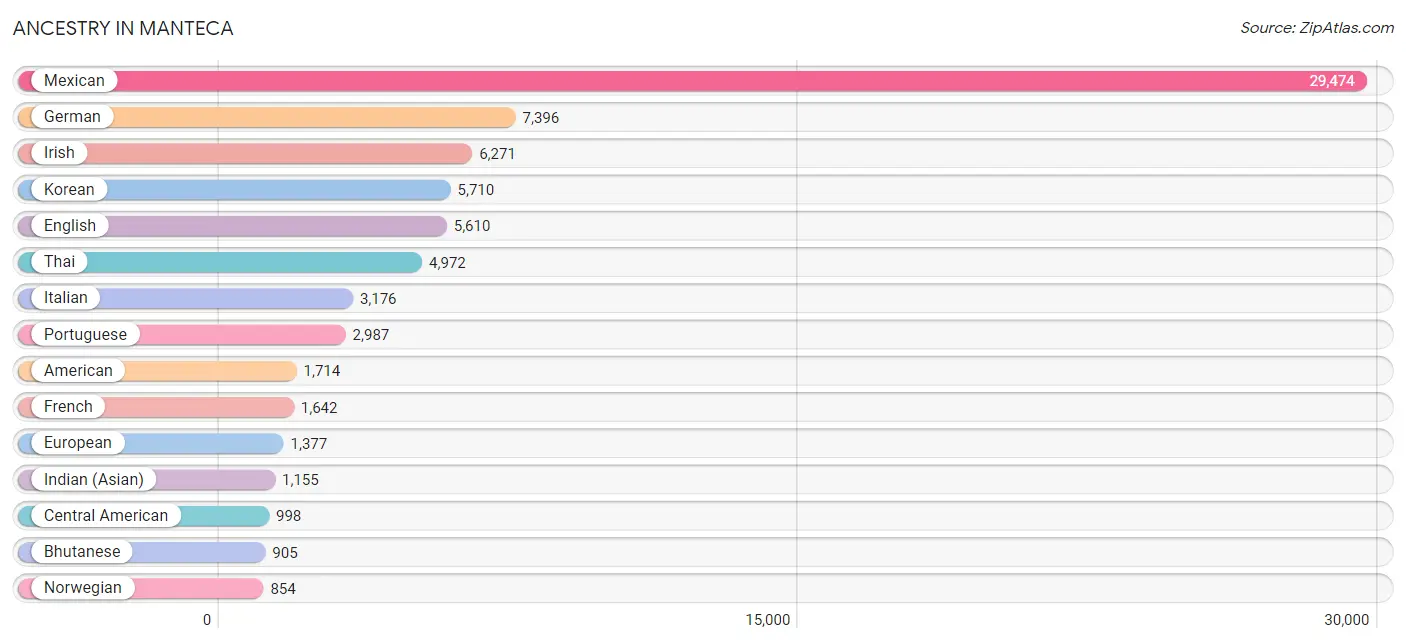
Ancestry in Manteca
The most populous ancestries reported in Manteca are Mexican (29,474 | 35.1%), German (7,396 | 8.8%), Irish (6,271 | 7.5%), Korean (5,710 | 6.8%), and English (5,610 | 6.7%), together accounting for 64.9% of all Manteca residents.
| Ancestry | # Population | % Population |
| Afghan | 212 | 0.3% |
| African | 145 | 0.2% |
| American | 1,714 | 2.0% |
| Apache | 181 | 0.2% |
| Arab | 332 | 0.4% |
| Argentinean | 10 | 0.0% |
| Armenian | 19 | 0.0% |
| Assyrian / Chaldean / Syriac | 55 | 0.1% |
| Australian | 17 | 0.0% |
| Austrian | 42 | 0.1% |
| Bangladeshi | 159 | 0.2% |
| Basque | 54 | 0.1% |
| Bhutanese | 905 | 1.1% |
| Bolivian | 61 | 0.1% |
| British | 179 | 0.2% |
| Bulgarian | 18 | 0.0% |
| Burmese | 185 | 0.2% |
| Canadian | 71 | 0.1% |
| Celtic | 9 | 0.0% |
| Central American | 998 | 1.2% |
| Central American Indian | 178 | 0.2% |
| Cherokee | 455 | 0.5% |
| Chilean | 5 | 0.0% |
| Chippewa | 37 | 0.0% |
| Choctaw | 153 | 0.2% |
| Colombian | 161 | 0.2% |
| Costa Rican | 34 | 0.0% |
| Creek | 29 | 0.0% |
| Croatian | 8 | 0.0% |
| Cuban | 19 | 0.0% |
| Czech | 39 | 0.1% |
| Czechoslovakian | 114 | 0.1% |
| Danish | 450 | 0.5% |
| Dominican | 53 | 0.1% |
| Dutch | 575 | 0.7% |
| Eastern European | 269 | 0.3% |
| Ecuadorian | 169 | 0.2% |
| English | 5,610 | 6.7% |
| Ethiopian | 16 | 0.0% |
| European | 1,377 | 1.6% |
| Finnish | 66 | 0.1% |
| French | 1,642 | 2.0% |
| French Canadian | 63 | 0.1% |
| German | 7,396 | 8.8% |
| Greek | 212 | 0.3% |
| Guamanian / Chamorro | 219 | 0.3% |
| Guatemalan | 111 | 0.1% |
| Honduran | 108 | 0.1% |
| Hopi | 1 | 0.0% |
| Hungarian | 60 | 0.1% |
| Indian (Asian) | 1,155 | 1.4% |
| Iranian | 14 | 0.0% |
| Irish | 6,271 | 7.5% |
| Iroquois | 7 | 0.0% |
| Italian | 3,176 | 3.8% |
| Japanese | 353 | 0.4% |
| Jordanian | 26 | 0.0% |
| Korean | 5,710 | 6.8% |
| Lebanese | 76 | 0.1% |
| Lithuanian | 8 | 0.0% |
| Malaysian | 180 | 0.2% |
| Maltese | 81 | 0.1% |
| Mexican | 29,474 | 35.1% |
| Mexican American Indian | 190 | 0.2% |
| Native Hawaiian | 454 | 0.5% |
| Navajo | 199 | 0.2% |
| Nepalese | 54 | 0.1% |
| Nicaraguan | 195 | 0.2% |
| Nigerian | 16 | 0.0% |
| Northern European | 71 | 0.1% |
| Norwegian | 854 | 1.0% |
| Paiute | 57 | 0.1% |
| Pakistani | 203 | 0.2% |
| Palestinian | 68 | 0.1% |
| Panamanian | 25 | 0.0% |
| Pennsylvania German | 22 | 0.0% |
| Peruvian | 219 | 0.3% |
| Pima | 39 | 0.1% |
| Polish | 718 | 0.9% |
| Portuguese | 2,987 | 3.6% |
| Pueblo | 7 | 0.0% |
| Puerto Rican | 601 | 0.7% |
| Russian | 209 | 0.3% |
| Salvadoran | 508 | 0.6% |
| Samoan | 508 | 0.6% |
| Scandinavian | 158 | 0.2% |
| Scotch-Irish | 651 | 0.8% |
| Scottish | 755 | 0.9% |
| Seminole | 5 | 0.0% |
| Sioux | 203 | 0.2% |
| Slavic | 9 | 0.0% |
| Slovak | 24 | 0.0% |
| South American | 670 | 0.8% |
| Spaniard | 669 | 0.8% |
| Spanish | 392 | 0.5% |
| Sri Lankan | 324 | 0.4% |
| Subsaharan African | 198 | 0.2% |
| Swedish | 572 | 0.7% |
| Swiss | 160 | 0.2% |
| Thai | 4,972 | 5.9% |
| Tongan | 7 | 0.0% |
| Trinidadian and Tobagonian | 33 | 0.0% |
| Ukrainian | 14 | 0.0% |
| Uruguayan | 45 | 0.1% |
| Welsh | 154 | 0.2% |
| Yaqui | 132 | 0.2% | View All 106 Rows |
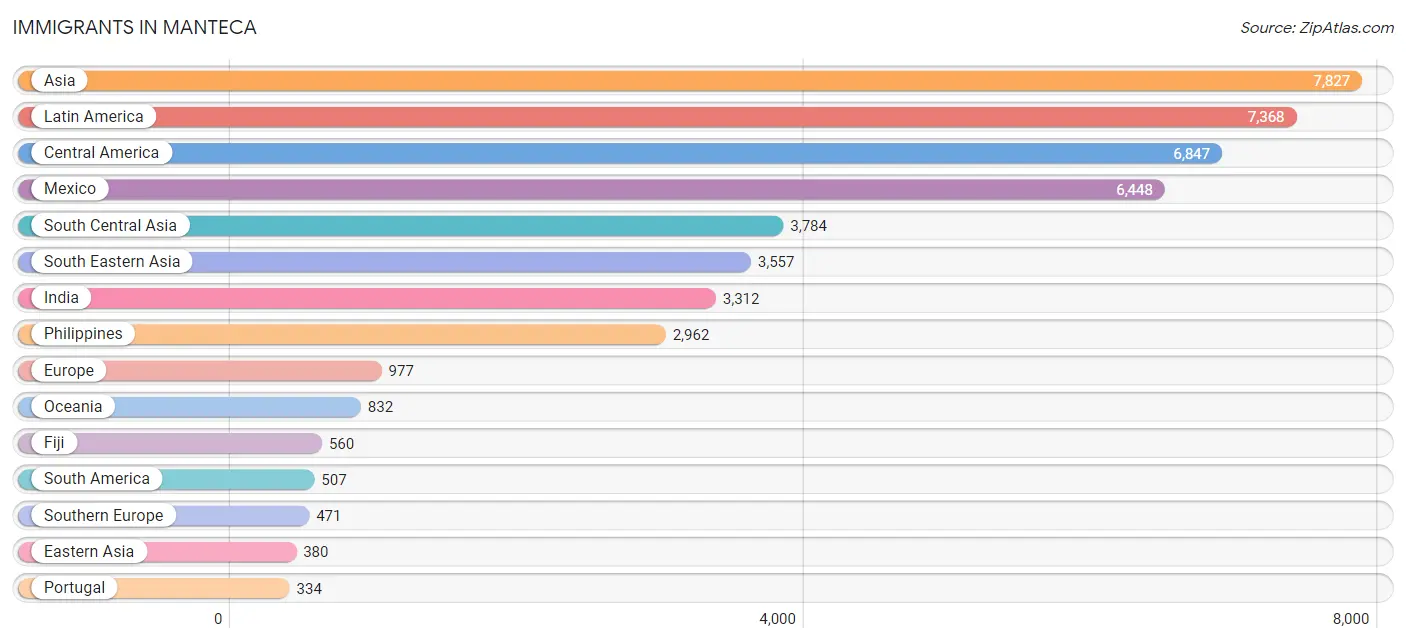
Immigrants in Manteca
The most numerous immigrant groups reported in Manteca came from Asia (7,827 | 9.3%), Latin America (7,368 | 8.8%), Central America (6,847 | 8.2%), Mexico (6,448 | 7.7%), and South Central Asia (3,784 | 4.5%), together accounting for 38.5% of all Manteca residents.
| Immigration Origin | # Population | % Population |
| Afghanistan | 314 | 0.4% |
| Africa | 35 | 0.0% |
| Argentina | 54 | 0.1% |
| Asia | 7,827 | 9.3% |
| Austria | 12 | 0.0% |
| Azores | 95 | 0.1% |
| Bolivia | 41 | 0.1% |
| Cambodia | 89 | 0.1% |
| Canada | 112 | 0.1% |
| Caribbean | 14 | 0.0% |
| Central America | 6,847 | 8.2% |
| China | 297 | 0.4% |
| Colombia | 17 | 0.0% |
| Denmark | 46 | 0.1% |
| Eastern Africa | 6 | 0.0% |
| Eastern Asia | 380 | 0.4% |
| Eastern Europe | 42 | 0.1% |
| Ecuador | 80 | 0.1% |
| El Salvador | 249 | 0.3% |
| England | 49 | 0.1% |
| Eritrea | 6 | 0.0% |
| Europe | 977 | 1.2% |
| Fiji | 560 | 0.7% |
| France | 153 | 0.2% |
| Germany | 66 | 0.1% |
| Guatemala | 7 | 0.0% |
| Honduras | 44 | 0.1% |
| Hong Kong | 11 | 0.0% |
| Hungary | 12 | 0.0% |
| India | 3,312 | 4.0% |
| Iran | 33 | 0.0% |
| Italy | 83 | 0.1% |
| Japan | 30 | 0.0% |
| Jordan | 13 | 0.0% |
| Korea | 53 | 0.1% |
| Laos | 100 | 0.1% |
| Latin America | 7,368 | 8.8% |
| Mexico | 6,448 | 7.7% |
| Middle Africa | 13 | 0.0% |
| Nepal | 44 | 0.1% |
| Netherlands | 12 | 0.0% |
| Nicaragua | 99 | 0.1% |
| Nigeria | 16 | 0.0% |
| Northern Europe | 221 | 0.3% |
| Oceania | 832 | 1.0% |
| Pakistan | 68 | 0.1% |
| Peru | 304 | 0.4% |
| Philippines | 2,962 | 3.5% |
| Portugal | 334 | 0.4% |
| Romania | 14 | 0.0% |
| Russia | 16 | 0.0% |
| Singapore | 25 | 0.0% |
| South America | 507 | 0.6% |
| South Central Asia | 3,784 | 4.5% |
| South Eastern Asia | 3,557 | 4.2% |
| Southern Europe | 471 | 0.6% |
| Spain | 54 | 0.1% |
| Sweden | 46 | 0.1% |
| Taiwan | 69 | 0.1% |
| Thailand | 254 | 0.3% |
| Trinidad and Tobago | 14 | 0.0% |
| Uzbekistan | 13 | 0.0% |
| Vietnam | 127 | 0.2% |
| Western Africa | 16 | 0.0% |
| Western Asia | 64 | 0.1% |
| Western Europe | 243 | 0.3% |
| Yemen | 51 | 0.1% |
| Zaire | 13 | 0.0% | View All 68 Rows |
Sex and Age in Manteca
Sex and Age in Manteca
The most populous age groups in Manteca are 25 to 29 Years (3,458 | 8.1%) for men and 5 to 9 Years (3,257 | 7.9%) for women.
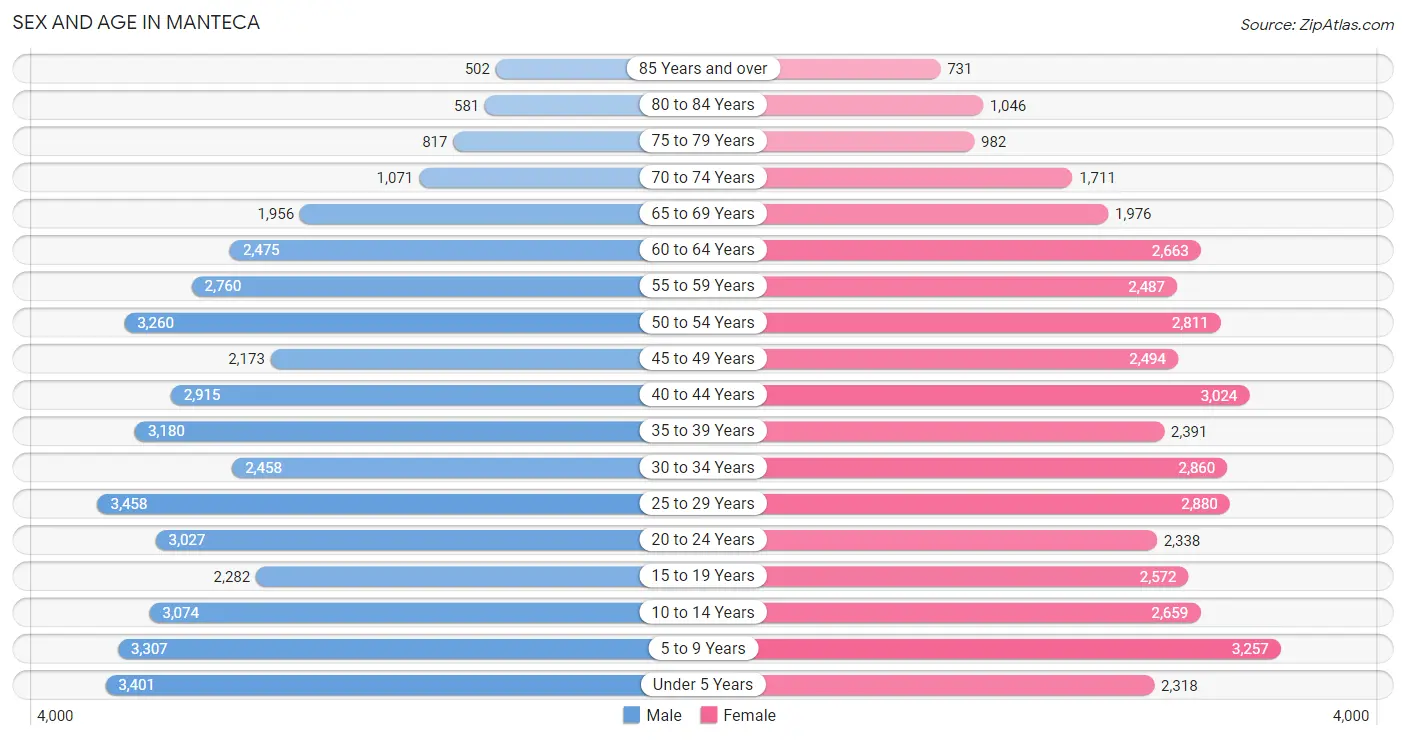
| Age Bracket | Male | Female |
| Under 5 Years | 3,401 (8.0%) | 2,318 (5.6%) |
| 5 to 9 Years | 3,307 (7.7%) | 3,257 (7.9%) |
| 10 to 14 Years | 3,074 (7.2%) | 2,659 (6.5%) |
| 15 to 19 Years | 2,282 (5.3%) | 2,572 (6.2%) |
| 20 to 24 Years | 3,027 (7.1%) | 2,338 (5.7%) |
| 25 to 29 Years | 3,458 (8.1%) | 2,880 (7.0%) |
| 30 to 34 Years | 2,458 (5.8%) | 2,860 (6.9%) |
| 35 to 39 Years | 3,180 (7.4%) | 2,391 (5.8%) |
| 40 to 44 Years | 2,915 (6.8%) | 3,024 (7.3%) |
| 45 to 49 Years | 2,173 (5.1%) | 2,494 (6.0%) |
| 50 to 54 Years | 3,260 (7.6%) | 2,811 (6.8%) |
| 55 to 59 Years | 2,760 (6.5%) | 2,487 (6.0%) |
| 60 to 64 Years | 2,475 (5.8%) | 2,663 (6.5%) |
| 65 to 69 Years | 1,956 (4.6%) | 1,976 (4.8%) |
| 70 to 74 Years | 1,071 (2.5%) | 1,711 (4.2%) |
| 75 to 79 Years | 817 (1.9%) | 982 (2.4%) |
| 80 to 84 Years | 581 (1.4%) | 1,046 (2.5%) |
| 85 Years and over | 502 (1.2%) | 731 (1.8%) |
| Total | 42,697 (100.0%) | 41,200 (100.0%) |
Families and Households in Manteca
Median Family Size in Manteca
The median family size in Manteca is 3.62 persons per family, with married-couple families (14,481 | 71.9%) accounting for the largest median family size of 3.76 persons per family. On the other hand, single male/father families (1,973 | 9.8%) represent the smallest median family size with 3.01 persons per family.
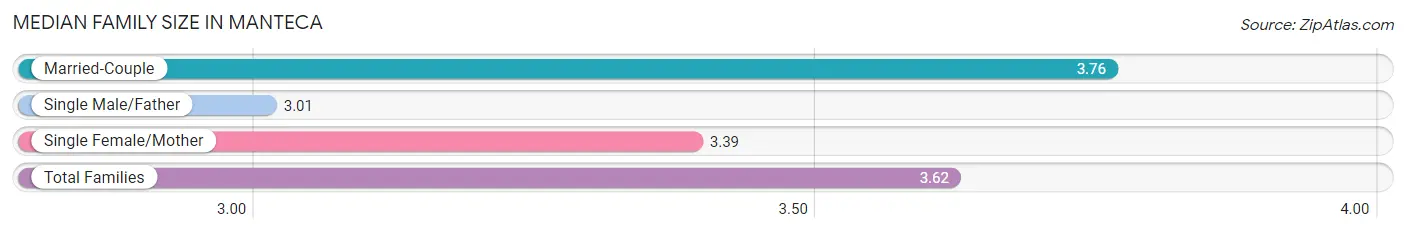
| Family Type | # Families | Family Size |
| Married-Couple | 14,481 (71.9%) | 3.76 |
| Single Male/Father | 1,973 (9.8%) | 3.01 |
| Single Female/Mother | 3,698 (18.3%) | 3.39 |
| Total Families | 20,152 (100.0%) | 3.62 |
Median Household Size in Manteca
The median household size in Manteca is 3.17 persons per household, with married-couple households (14,481 | 55.2%) accounting for the largest median household size of 3.79 persons per household. non-family households (6,065 | 23.1%) represent the smallest median household size with 1.32 persons per household.
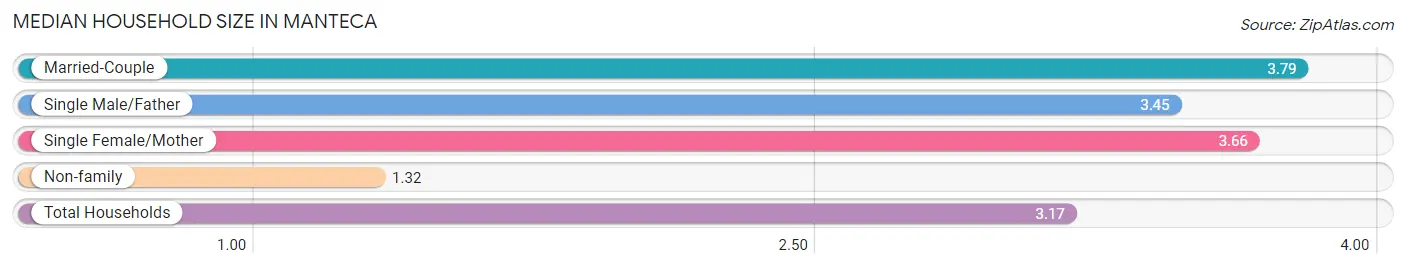
| Household Type | # Households | Household Size |
| Married-Couple | 14,481 (55.2%) | 3.79 |
| Single Male/Father | 1,973 (7.5%) | 3.45 |
| Single Female/Mother | 3,698 (14.1%) | 3.66 |
| Non-family | 6,065 (23.1%) | 1.32 |
| Total Households | 26,217 (100.0%) | 3.17 |
Household Size by Marriage Status in Manteca
Out of a total of 26,217 households in Manteca, 20,152 (76.9%) are family households, while 6,065 (23.1%) are nonfamily households. The most numerous type of family households are 2-person households, comprising 6,828, and the most common type of nonfamily households are 1-person households, comprising 4,642.
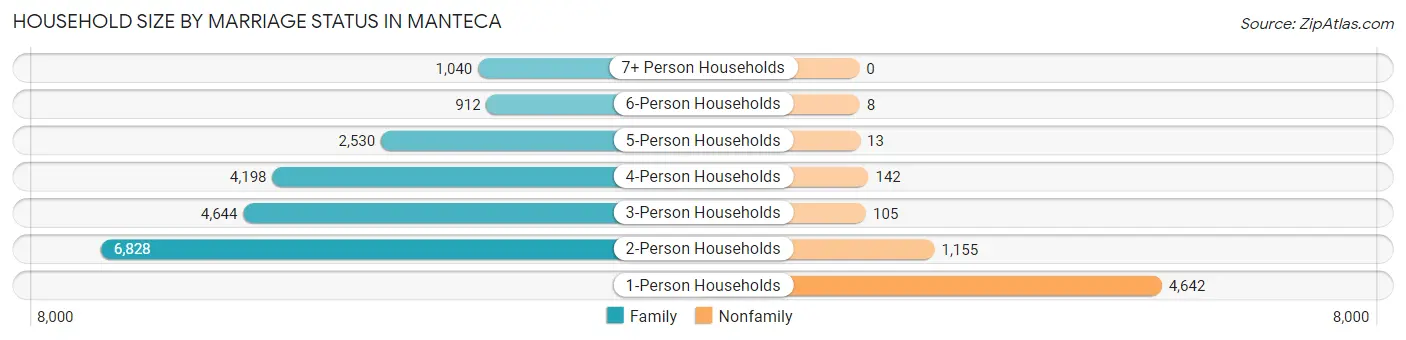
| Household Size | Family Households | Nonfamily Households |
| 1-Person Households | - | 4,642 (17.7%) |
| 2-Person Households | 6,828 (26.0%) | 1,155 (4.4%) |
| 3-Person Households | 4,644 (17.7%) | 105 (0.4%) |
| 4-Person Households | 4,198 (16.0%) | 142 (0.5%) |
| 5-Person Households | 2,530 (9.7%) | 13 (0.1%) |
| 6-Person Households | 912 (3.5%) | 8 (0.0%) |
| 7+ Person Households | 1,040 (4.0%) | 0 (0.0%) |
| Total | 20,152 (76.9%) | 6,065 (23.1%) |
Female Fertility in Manteca
Fertility by Age in Manteca
Average fertility rate in Manteca is 49.0 births per 1,000 women. Women in the age bracket of 20 to 34 years have the highest fertility rate with 95.0 births per 1,000 women. Women in the age bracket of 20 to 34 years acount for 81.8% of all women with births.
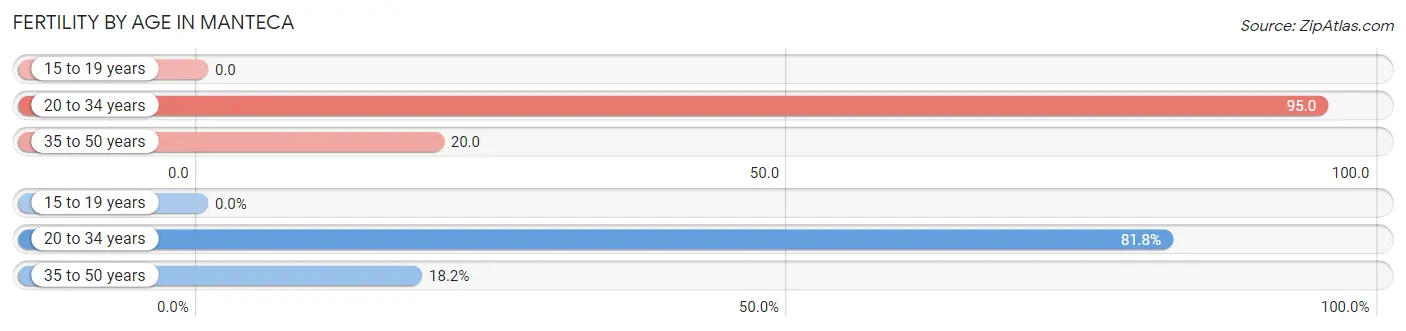
| Age Bracket | Women with Births | Births / 1,000 Women |
| 15 to 19 years | 0 (0.0%) | 0.0 |
| 20 to 34 years | 766 (81.8%) | 95.0 |
| 35 to 50 years | 170 (18.2%) | 20.0 |
| Total | 936 (100.0%) | 49.0 |
Fertility by Age by Marriage Status in Manteca
74.6% of women with births (936) in Manteca are married. The highest percentage of unmarried women with births falls into 20 to 34 years age bracket with 29.8% of them unmarried at the time of birth, while the lowest percentage of unmarried women with births belong to 35 to 50 years age bracket with 5.9% of them unmarried.
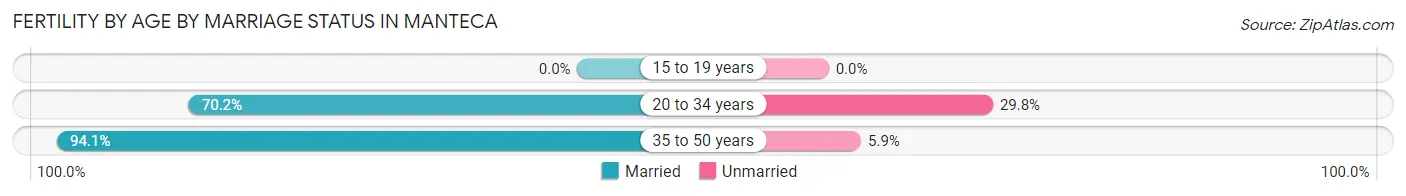
| Age Bracket | Married | Unmarried |
| 15 to 19 years | 0 (0.0%) | 0 (0.0%) |
| 20 to 34 years | 538 (70.2%) | 228 (29.8%) |
| 35 to 50 years | 160 (94.1%) | 10 (5.9%) |
| Total | 698 (74.6%) | 238 (25.4%) |
Fertility by Education in Manteca
Average fertility rate in Manteca is 49.0 births per 1,000 women. Women with the education attainment of graduate degree have the highest fertility rate of 67.0 births per 1,000 women, while women with the education attainment of less than high school have the lowest fertility at 27.0 births per 1,000 women. Women with the education attainment of college or associate's degree represent 37.8% of all women with births.
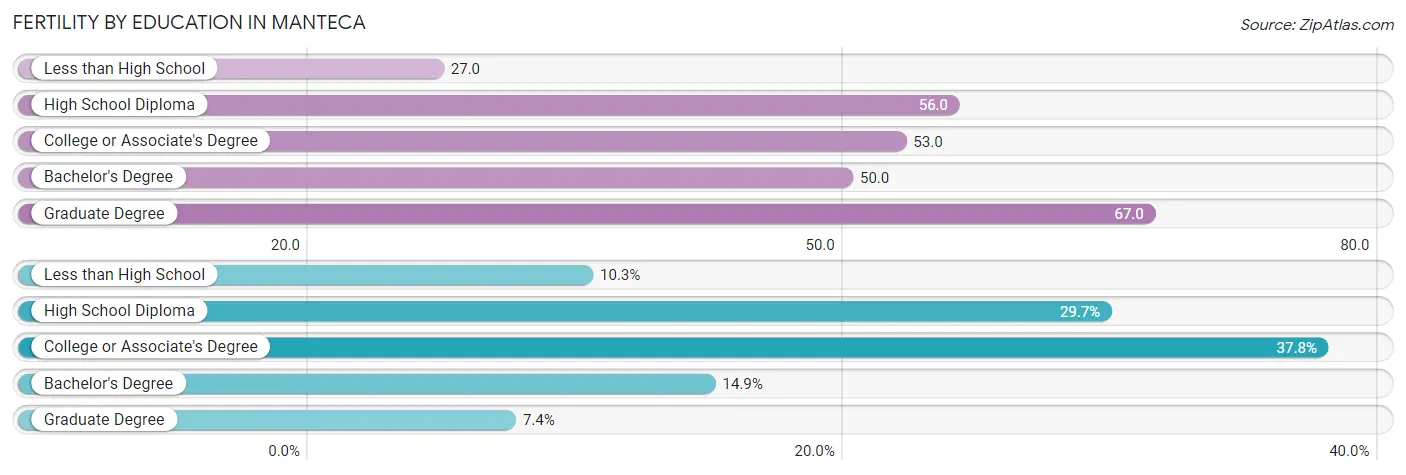
| Educational Attainment | Women with Births | Births / 1,000 Women |
| Less than High School | 96 (10.3%) | 27.0 |
| High School Diploma | 278 (29.7%) | 56.0 |
| College or Associate's Degree | 354 (37.8%) | 53.0 |
| Bachelor's Degree | 139 (14.8%) | 50.0 |
| Graduate Degree | 69 (7.4%) | 67.0 |
| Total | 936 (100.0%) | 49.0 |
Fertility by Education by Marriage Status in Manteca
25.4% of women with births in Manteca are unmarried. Women with the educational attainment of bachelor's degree are most likely to be married with 100.0% of them married at childbirth, while women with the educational attainment of less than high school are least likely to be married with 60.4% of them unmarried at childbirth.
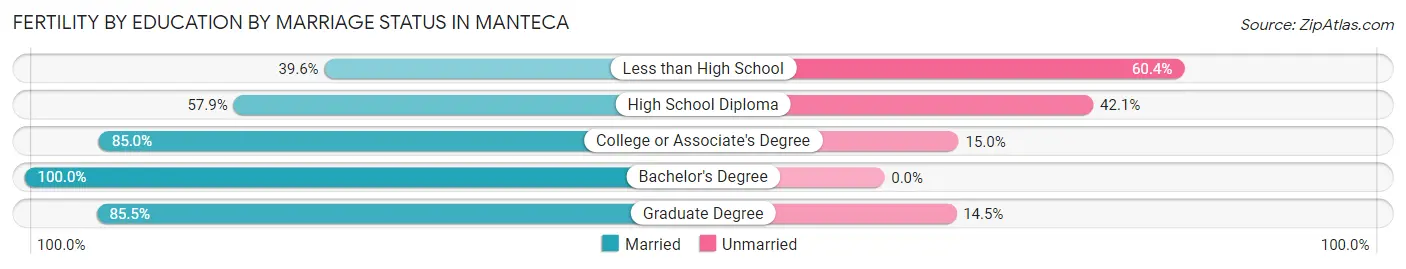
| Educational Attainment | Married | Unmarried |
| Less than High School | 38 (39.6%) | 58 (60.4%) |
| High School Diploma | 161 (57.9%) | 117 (42.1%) |
| College or Associate's Degree | 301 (85.0%) | 53 (15.0%) |
| Bachelor's Degree | 139 (100.0%) | 0 (0.0%) |
| Graduate Degree | 59 (85.5%) | 10 (14.5%) |
| Total | 698 (74.6%) | 238 (25.4%) |
Employment Characteristics in Manteca
Employment by Class of Employer in Manteca
Among the 35,398 employed individuals in Manteca, private company employees (25,026 | 70.7%), local government employees (3,078 | 8.7%), and self-employed (not incorporated) (1,915 | 5.4%) make up the most common classes of employment.
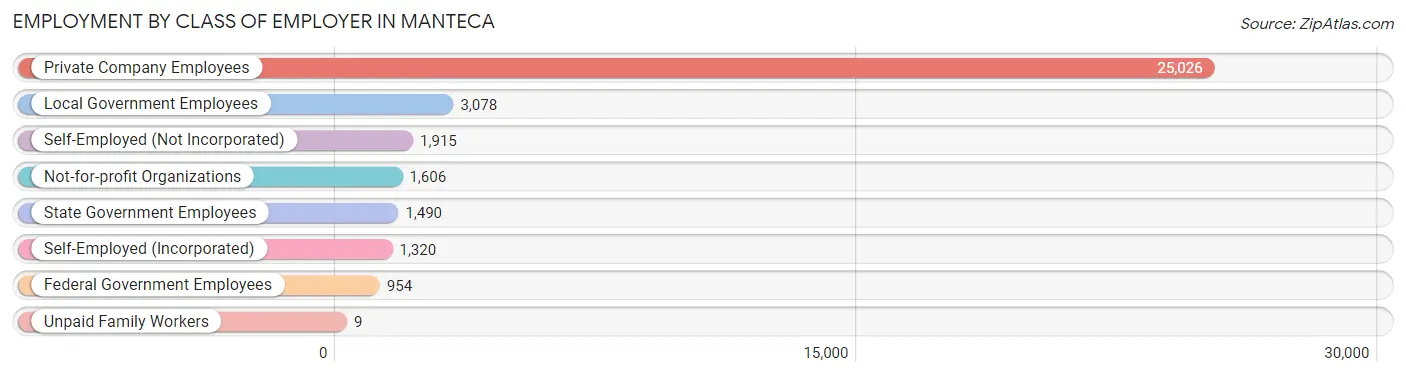
| Employer Class | # Employees | % Employees |
| Private Company Employees | 25,026 | 70.7% |
| Self-Employed (Incorporated) | 1,320 | 3.7% |
| Self-Employed (Not Incorporated) | 1,915 | 5.4% |
| Not-for-profit Organizations | 1,606 | 4.5% |
| Local Government Employees | 3,078 | 8.7% |
| State Government Employees | 1,490 | 4.2% |
| Federal Government Employees | 954 | 2.7% |
| Unpaid Family Workers | 9 | 0.0% |
| Total | 35,398 | 100.0% |
Employment Status by Age in Manteca
According to the labor force statistics for Manteca, out of the total population over 16 years of age (64,826), 60.2% or 39,025 individuals are in the labor force, with 6.4% or 2,498 of them unemployed. The age group with the highest labor force participation rate is 35 to 44 years, with 81.9% or 9,427 individuals in the labor force. Within the labor force, the 16 to 19 years age range has the highest percentage of unemployed individuals, with 15.8% or 184 of them being unemployed.
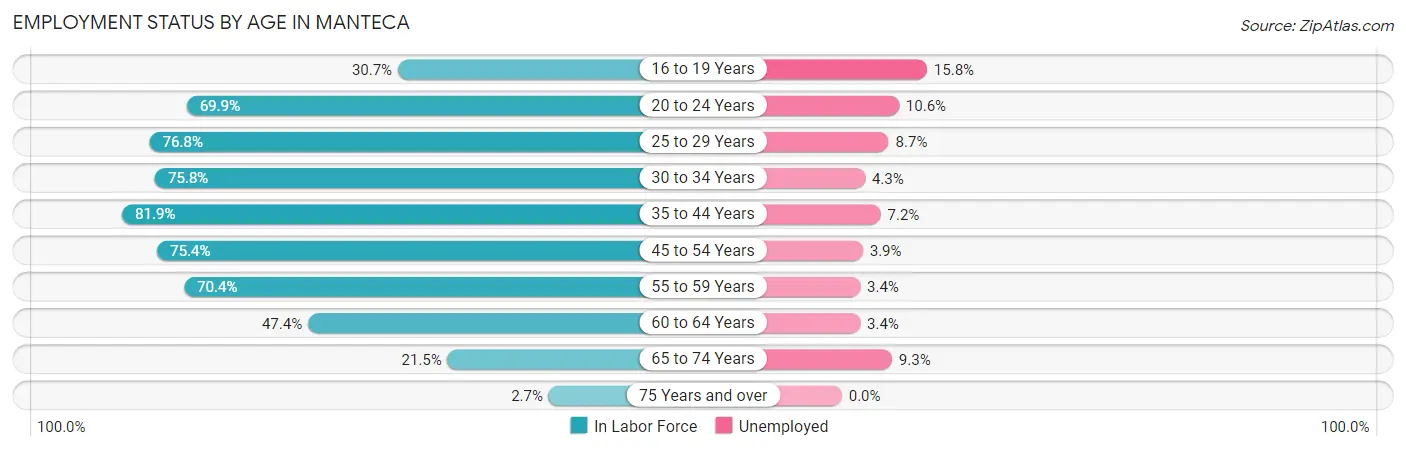
| Age Bracket | In Labor Force | Unemployed |
| 16 to 19 Years | 1,166 (30.7%) | 184 (15.8%) |
| 20 to 24 Years | 3,750 (69.9%) | 398 (10.6%) |
| 25 to 29 Years | 4,868 (76.8%) | 424 (8.7%) |
| 30 to 34 Years | 4,031 (75.8%) | 173 (4.3%) |
| 35 to 44 Years | 9,427 (81.9%) | 679 (7.2%) |
| 45 to 54 Years | 8,096 (75.4%) | 316 (3.9%) |
| 55 to 59 Years | 3,694 (70.4%) | 126 (3.4%) |
| 60 to 64 Years | 2,435 (47.4%) | 83 (3.4%) |
| 65 to 74 Years | 1,444 (21.5%) | 134 (9.3%) |
| 75 Years and over | 126 (2.7%) | 0 (0.0%) |
| Total | 39,025 (60.2%) | 2,498 (6.4%) |
Employment Status by Educational Attainment in Manteca
According to labor force statistics for Manteca, 73.5% of individuals (32,552) out of the total population between 25 and 64 years of age (44,289) are in the labor force, with 5.5% or 1,790 of them being unemployed. The group with the highest labor force participation rate are those with the educational attainment of bachelor's degree or higher, with 83.0% or 7,029 individuals in the labor force. Within the labor force, individuals with less than high school education have the highest percentage of unemployment, with 8.9% or 304 of them being unemployed.
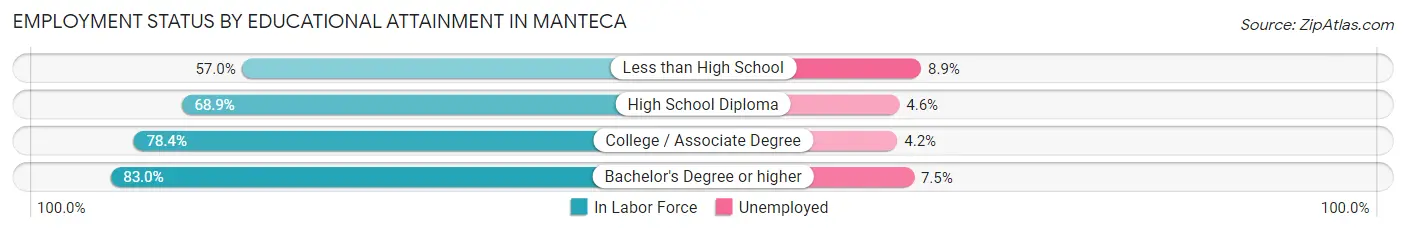
| Educational Attainment | In Labor Force | Unemployed |
| Less than High School | 3,414 (57.0%) | 533 (8.9%) |
| High School Diploma | 9,221 (68.9%) | 616 (4.6%) |
| College / Associate Degree | 12,894 (78.4%) | 691 (4.2%) |
| Bachelor's Degree or higher | 7,029 (83.0%) | 635 (7.5%) |
| Total | 32,552 (73.5%) | 2,436 (5.5%) |
Employment Occupations by Sex in Manteca
Management, Business, Science and Arts Occupations
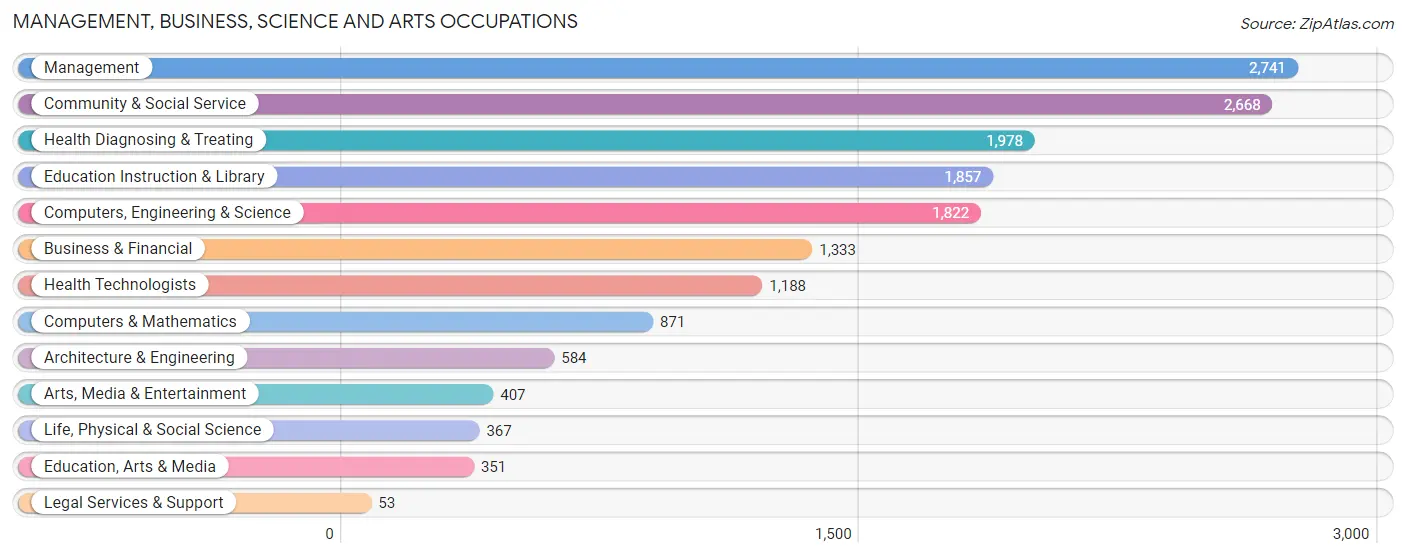
The most common Management, Business, Science and Arts occupations in Manteca are Management (2,741 | 7.5%), Community & Social Service (2,668 | 7.3%), Health Diagnosing & Treating (1,978 | 5.4%), Education Instruction & Library (1,857 | 5.1%), and Computers, Engineering & Science (1,822 | 5.0%).
Management, Business, Science and Arts Occupations by Sex
Within the Management, Business, Science and Arts occupations in Manteca, the most male-oriented occupations are Architecture & Engineering (90.1%), Arts, Media & Entertainment (74.7%), and Computers, Engineering & Science (72.3%), while the most female-oriented occupations are Education Instruction & Library (82.2%), Business & Financial (72.1%), and Health Diagnosing & Treating (71.8%).
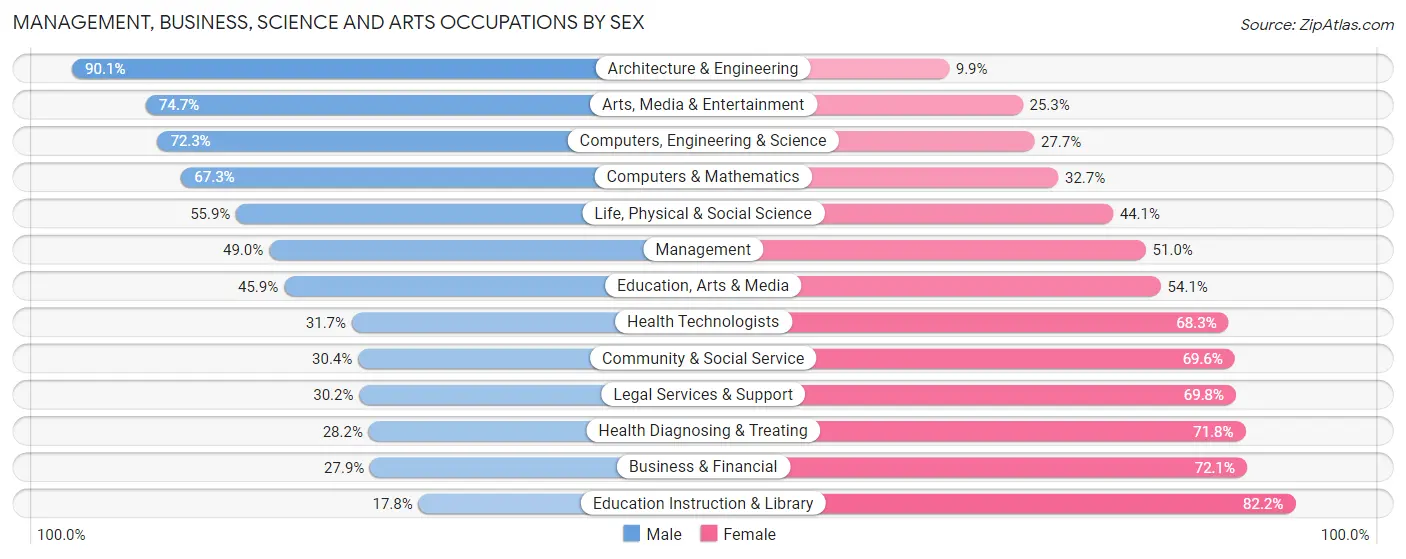
| Occupation | Male | Female |
| Management | 1,343 (49.0%) | 1,398 (51.0%) |
| Business & Financial | 372 (27.9%) | 961 (72.1%) |
| Computers, Engineering & Science | 1,317 (72.3%) | 505 (27.7%) |
| Computers & Mathematics | 586 (67.3%) | 285 (32.7%) |
| Architecture & Engineering | 526 (90.1%) | 58 (9.9%) |
| Life, Physical & Social Science | 205 (55.9%) | 162 (44.1%) |
| Community & Social Service | 812 (30.4%) | 1,856 (69.6%) |
| Education, Arts & Media | 161 (45.9%) | 190 (54.1%) |
| Legal Services & Support | 16 (30.2%) | 37 (69.8%) |
| Education Instruction & Library | 331 (17.8%) | 1,526 (82.2%) |
| Arts, Media & Entertainment | 304 (74.7%) | 103 (25.3%) |
| Health Diagnosing & Treating | 558 (28.2%) | 1,420 (71.8%) |
| Health Technologists | 377 (31.7%) | 811 (68.3%) |
| Total (Category) | 4,402 (41.8%) | 6,140 (58.2%) |
| Total (Overall) | 20,566 (56.5%) | 15,845 (43.5%) |
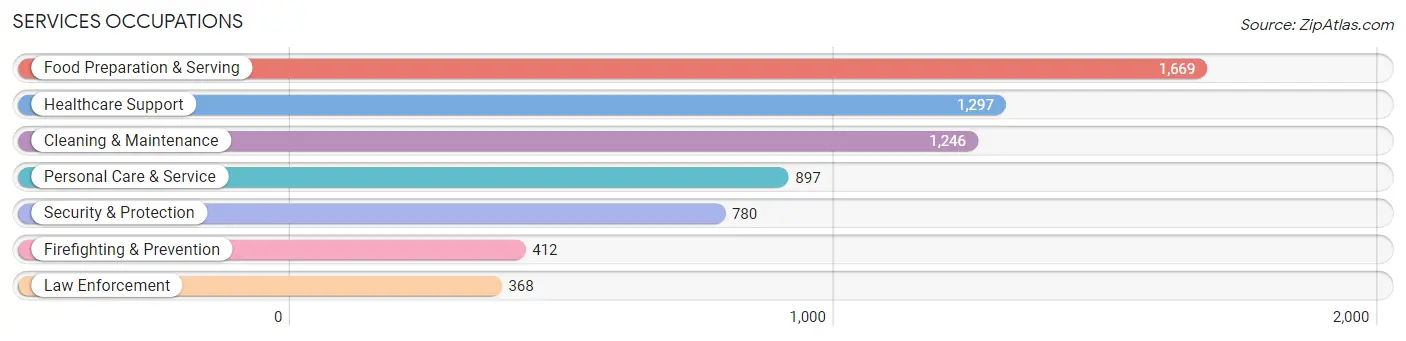
Services Occupations
The most common Services occupations in Manteca are Food Preparation & Serving (1,669 | 4.6%), Healthcare Support (1,297 | 3.6%), Cleaning & Maintenance (1,246 | 3.4%), Personal Care & Service (897 | 2.5%), and Security & Protection (780 | 2.1%).
Services Occupations by Sex
Within the Services occupations in Manteca, the most male-oriented occupations are Law Enforcement (85.3%), Security & Protection (73.5%), and Cleaning & Maintenance (64.4%), while the most female-oriented occupations are Healthcare Support (90.0%), Personal Care & Service (68.7%), and Food Preparation & Serving (52.5%).
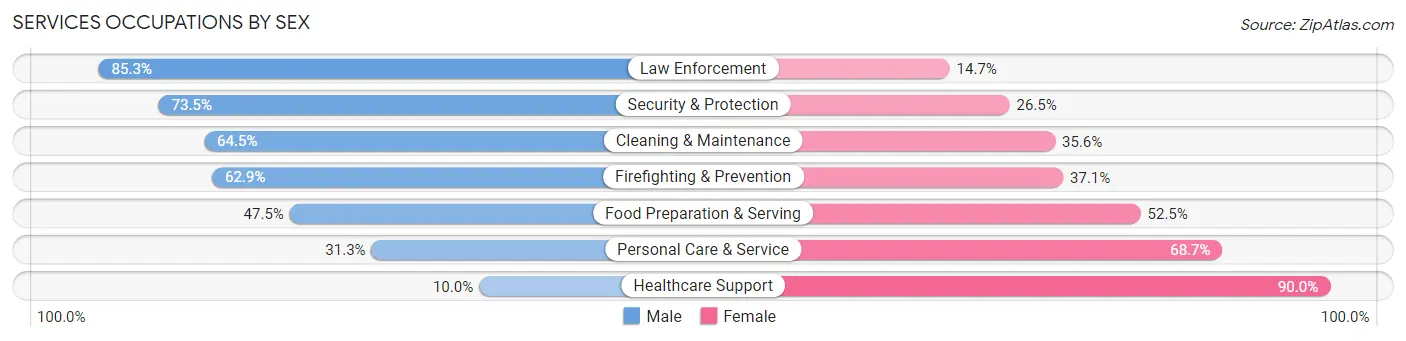
| Occupation | Male | Female |
| Healthcare Support | 130 (10.0%) | 1,167 (90.0%) |
| Security & Protection | 573 (73.5%) | 207 (26.5%) |
| Firefighting & Prevention | 259 (62.9%) | 153 (37.1%) |
| Law Enforcement | 314 (85.3%) | 54 (14.7%) |
| Food Preparation & Serving | 793 (47.5%) | 876 (52.5%) |
| Cleaning & Maintenance | 803 (64.4%) | 443 (35.5%) |
| Personal Care & Service | 281 (31.3%) | 616 (68.7%) |
| Total (Category) | 2,580 (43.8%) | 3,309 (56.2%) |
| Total (Overall) | 20,566 (56.5%) | 15,845 (43.5%) |
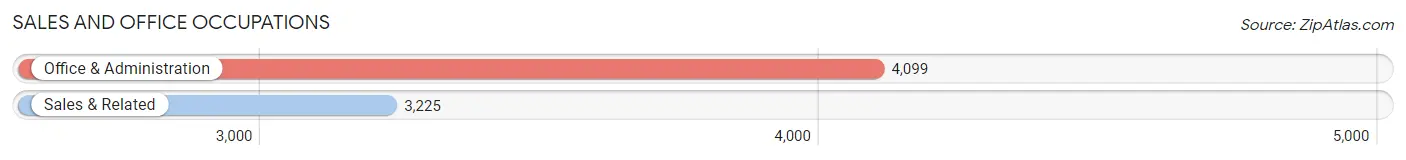
Sales and Office Occupations
The most common Sales and Office occupations in Manteca are Office & Administration (4,099 | 11.3%), and Sales & Related (3,225 | 8.9%).
Sales and Office Occupations by Sex
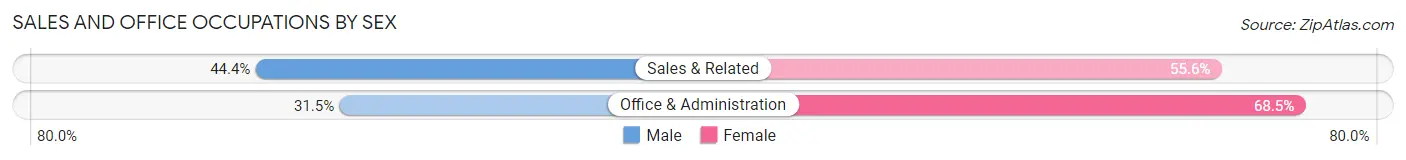
| Occupation | Male | Female |
| Sales & Related | 1,431 (44.4%) | 1,794 (55.6%) |
| Office & Administration | 1,290 (31.5%) | 2,809 (68.5%) |
| Total (Category) | 2,721 (37.1%) | 4,603 (62.8%) |
| Total (Overall) | 20,566 (56.5%) | 15,845 (43.5%) |
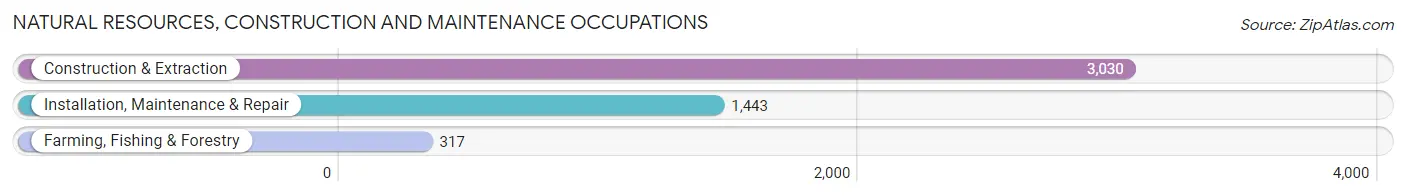
Natural Resources, Construction and Maintenance Occupations
The most common Natural Resources, Construction and Maintenance occupations in Manteca are Construction & Extraction (3,030 | 8.3%), Installation, Maintenance & Repair (1,443 | 4.0%), and Farming, Fishing & Forestry (317 | 0.9%).
Natural Resources, Construction and Maintenance Occupations by Sex
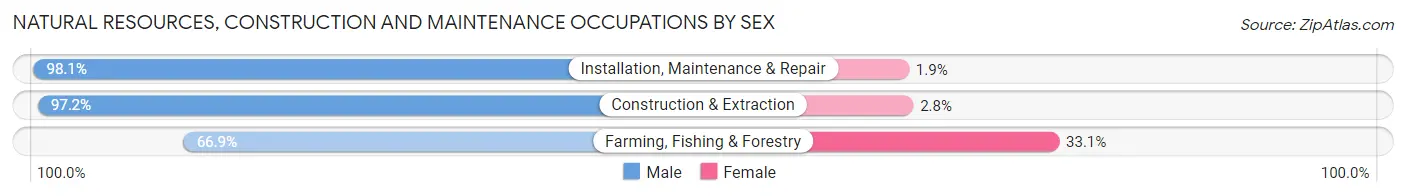
| Occupation | Male | Female |
| Farming, Fishing & Forestry | 212 (66.9%) | 105 (33.1%) |
| Construction & Extraction | 2,946 (97.2%) | 84 (2.8%) |
| Installation, Maintenance & Repair | 1,416 (98.1%) | 27 (1.9%) |
| Total (Category) | 4,574 (95.5%) | 216 (4.5%) |
| Total (Overall) | 20,566 (56.5%) | 15,845 (43.5%) |
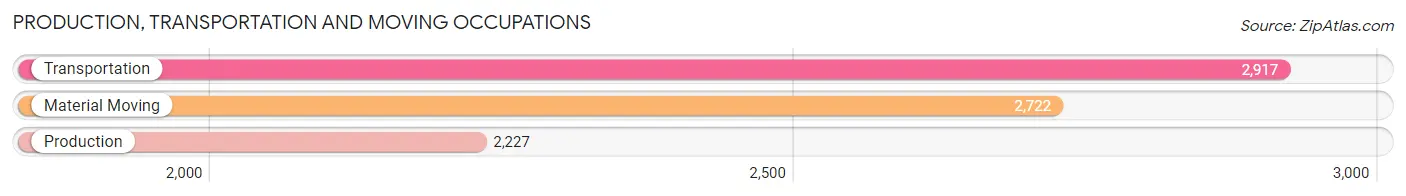
Production, Transportation and Moving Occupations
The most common Production, Transportation and Moving occupations in Manteca are Transportation (2,917 | 8.0%), Material Moving (2,722 | 7.5%), and Production (2,227 | 6.1%).
Production, Transportation and Moving Occupations by Sex
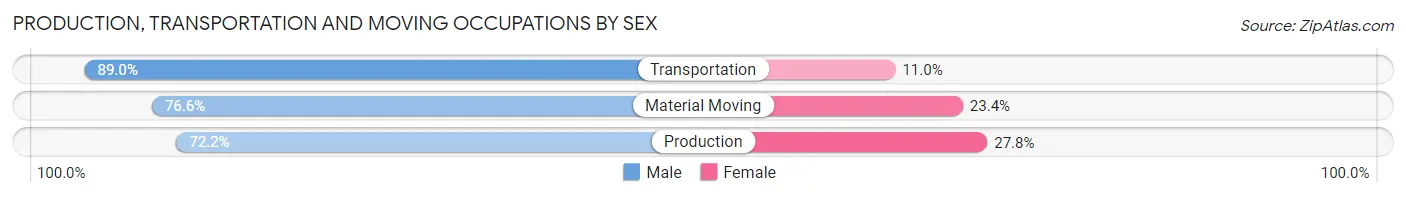
| Occupation | Male | Female |
| Production | 1,607 (72.2%) | 620 (27.8%) |
| Transportation | 2,596 (89.0%) | 321 (11.0%) |
| Material Moving | 2,086 (76.6%) | 636 (23.4%) |
| Total (Category) | 6,289 (79.9%) | 1,577 (20.1%) |
| Total (Overall) | 20,566 (56.5%) | 15,845 (43.5%) |
Employment Industries by Sex in Manteca
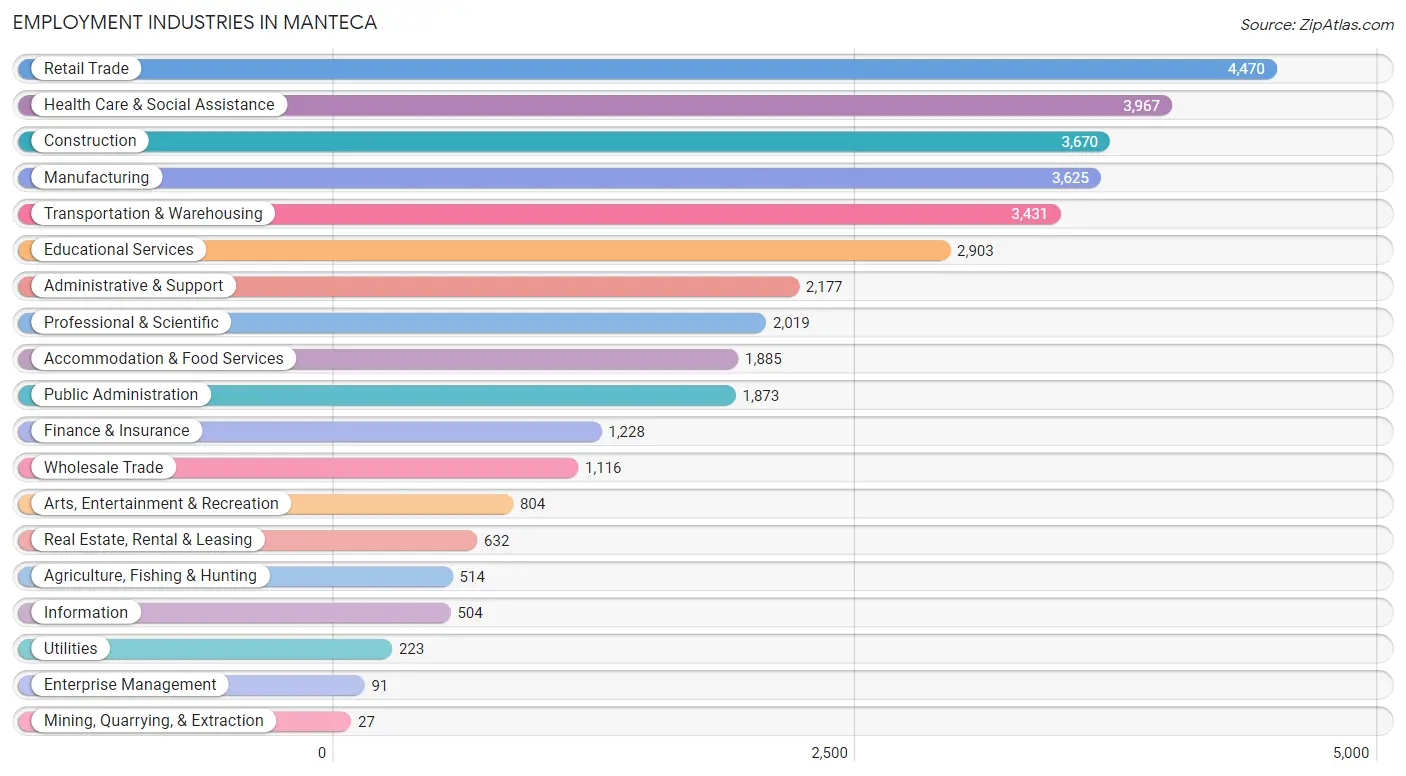
Employment Industries in Manteca
The major employment industries in Manteca include Retail Trade (4,470 | 12.3%), Health Care & Social Assistance (3,967 | 10.9%), Construction (3,670 | 10.1%), Manufacturing (3,625 | 10.0%), and Transportation & Warehousing (3,431 | 9.4%).
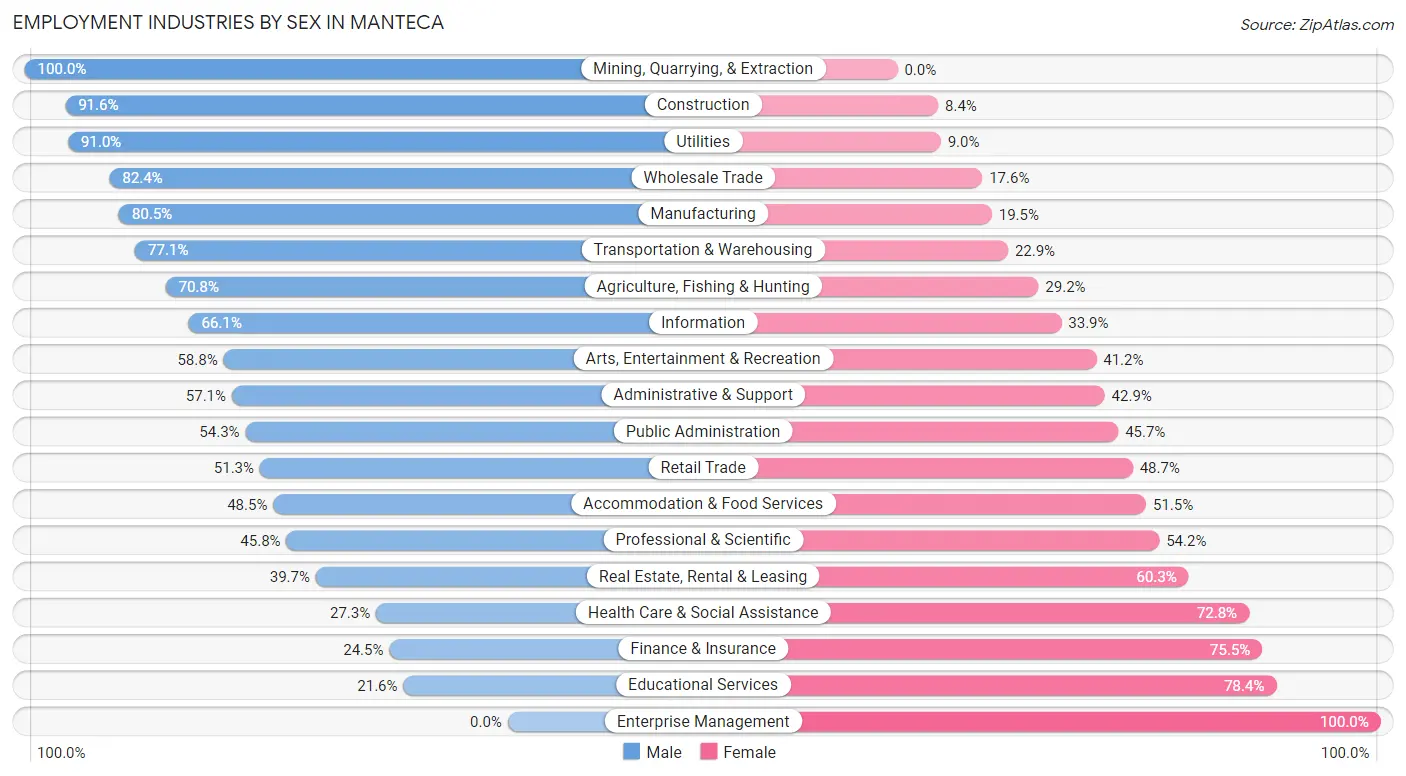
Employment Industries by Sex in Manteca
The Manteca industries that see more men than women are Mining, Quarrying, & Extraction (100.0%), Construction (91.6%), and Utilities (91.0%), whereas the industries that tend to have a higher number of women are Enterprise Management (100.0%), Educational Services (78.4%), and Finance & Insurance (75.5%).
| Industry | Male | Female |
| Agriculture, Fishing & Hunting | 364 (70.8%) | 150 (29.2%) |
| Mining, Quarrying, & Extraction | 27 (100.0%) | 0 (0.0%) |
| Construction | 3,361 (91.6%) | 309 (8.4%) |
| Manufacturing | 2,917 (80.5%) | 708 (19.5%) |
| Wholesale Trade | 920 (82.4%) | 196 (17.6%) |
| Retail Trade | 2,293 (51.3%) | 2,177 (48.7%) |
| Transportation & Warehousing | 2,646 (77.1%) | 785 (22.9%) |
| Utilities | 203 (91.0%) | 20 (9.0%) |
| Information | 333 (66.1%) | 171 (33.9%) |
| Finance & Insurance | 301 (24.5%) | 927 (75.5%) |
| Real Estate, Rental & Leasing | 251 (39.7%) | 381 (60.3%) |
| Professional & Scientific | 925 (45.8%) | 1,094 (54.2%) |
| Enterprise Management | 0 (0.0%) | 91 (100.0%) |
| Administrative & Support | 1,243 (57.1%) | 934 (42.9%) |
| Educational Services | 627 (21.6%) | 2,276 (78.4%) |
| Health Care & Social Assistance | 1,081 (27.3%) | 2,886 (72.8%) |
| Arts, Entertainment & Recreation | 473 (58.8%) | 331 (41.2%) |
| Accommodation & Food Services | 915 (48.5%) | 970 (51.5%) |
| Public Administration | 1,017 (54.3%) | 856 (45.7%) |
| Total | 20,566 (56.5%) | 15,845 (43.5%) |
Education in Manteca
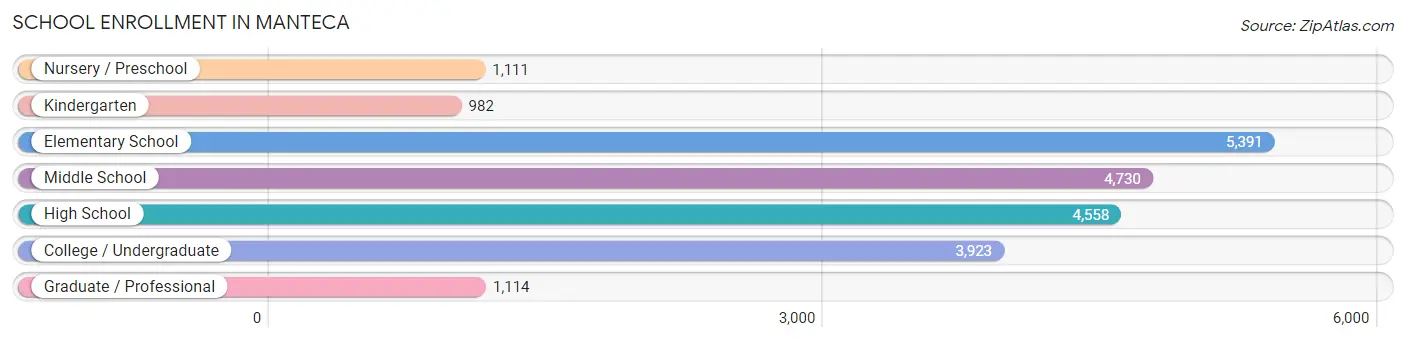
School Enrollment in Manteca
The most common levels of schooling among the 21,809 students in Manteca are elementary school (5,391 | 24.7%), middle school (4,730 | 21.7%), and high school (4,558 | 20.9%).
| School Level | # Students | % Students |
| Nursery / Preschool | 1,111 | 5.1% |
| Kindergarten | 982 | 4.5% |
| Elementary School | 5,391 | 24.7% |
| Middle School | 4,730 | 21.7% |
| High School | 4,558 | 20.9% |
| College / Undergraduate | 3,923 | 18.0% |
| Graduate / Professional | 1,114 | 5.1% |
| Total | 21,809 | 100.0% |
School Enrollment by Age by Funding Source in Manteca
Out of a total of 21,809 students who are enrolled in schools in Manteca, 2,312 (10.6%) attend a private institution, while the remaining 19,497 (89.4%) are enrolled in public schools. The age group of 35 years and over has the highest likelihood of being enrolled in private schools, with 702 (54.6% in the age bracket) enrolled. Conversely, the age group of 15 to 17 year olds has the lowest likelihood of being enrolled in a private school, with 3,002 (95.6% in the age bracket) attending a public institution.
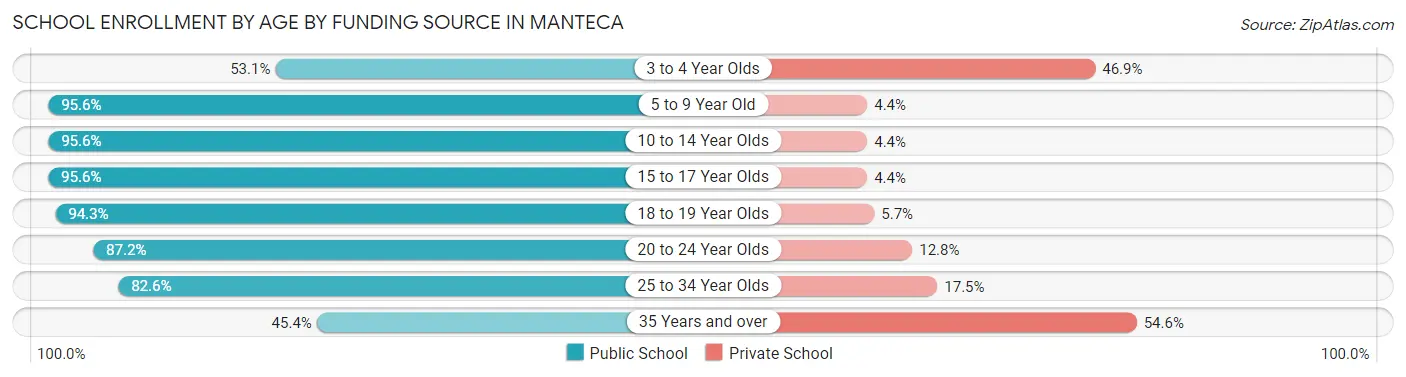
| Age Bracket | Public School | Private School |
| 3 to 4 Year Olds | 416 (53.1%) | 367 (46.9%) |
| 5 to 9 Year Old | 6,104 (95.6%) | 281 (4.4%) |
| 10 to 14 Year Olds | 5,431 (95.6%) | 250 (4.4%) |
| 15 to 17 Year Olds | 3,002 (95.6%) | 138 (4.4%) |
| 18 to 19 Year Olds | 1,072 (94.3%) | 65 (5.7%) |
| 20 to 24 Year Olds | 1,583 (87.2%) | 232 (12.8%) |
| 25 to 34 Year Olds | 1,306 (82.6%) | 276 (17.4%) |
| 35 Years and over | 584 (45.4%) | 702 (54.6%) |
| Total | 19,497 (89.4%) | 2,312 (10.6%) |
Educational Attainment by Field of Study in Manteca
Business (2,210 | 19.5%), science & technology (1,562 | 13.8%), education (1,164 | 10.2%), social sciences (975 | 8.6%), and liberal arts & history (941 | 8.3%) are the most common fields of study among 11,356 individuals in Manteca who have obtained a bachelor's degree or higher.
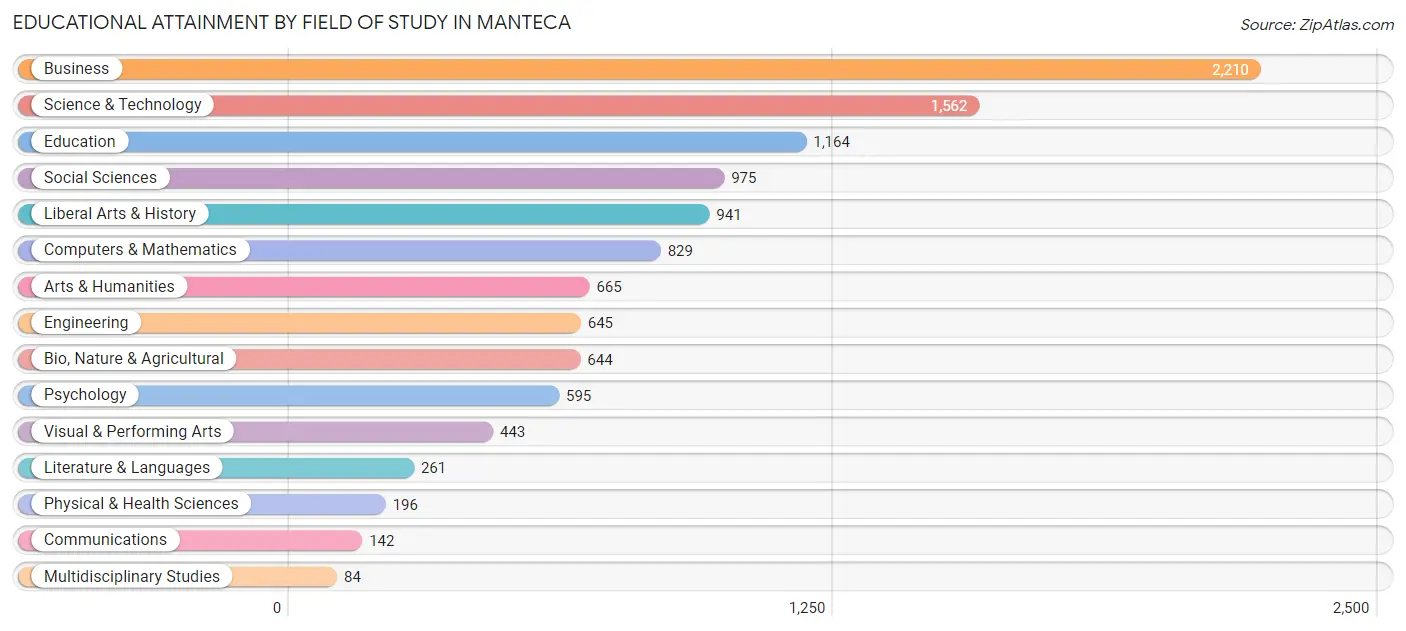
| Field of Study | # Graduates | % Graduates |
| Computers & Mathematics | 829 | 7.3% |
| Bio, Nature & Agricultural | 644 | 5.7% |
| Physical & Health Sciences | 196 | 1.7% |
| Psychology | 595 | 5.2% |
| Social Sciences | 975 | 8.6% |
| Engineering | 645 | 5.7% |
| Multidisciplinary Studies | 84 | 0.7% |
| Science & Technology | 1,562 | 13.8% |
| Business | 2,210 | 19.5% |
| Education | 1,164 | 10.2% |
| Literature & Languages | 261 | 2.3% |
| Liberal Arts & History | 941 | 8.3% |
| Visual & Performing Arts | 443 | 3.9% |
| Communications | 142 | 1.3% |
| Arts & Humanities | 665 | 5.9% |
| Total | 11,356 | 100.0% |
Transportation & Commute in Manteca
Vehicle Availability by Sex in Manteca
The most prevalent vehicle ownership categories in Manteca are males with 2 vehicles (6,821, accounting for 34.0%) and females with 2 vehicles (4,884, making up 44.7%).
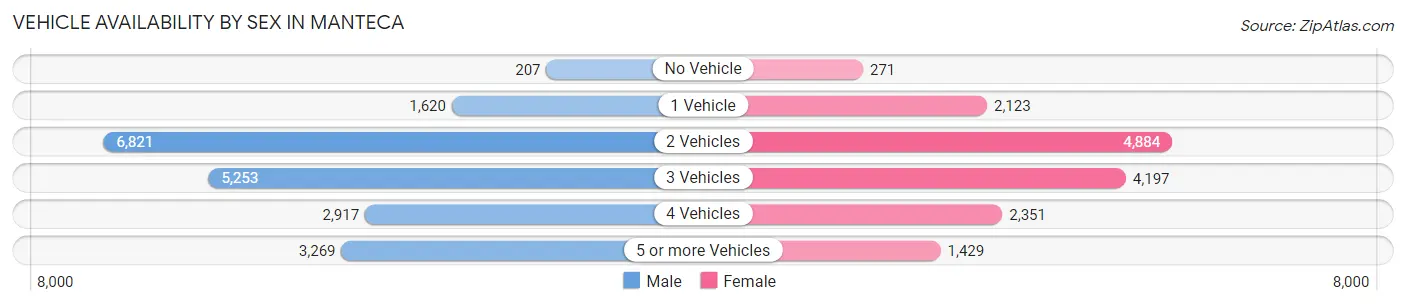
| Vehicles Available | Male | Female |
| No Vehicle | 207 (1.0%) | 271 (1.8%) |
| 1 Vehicle | 1,620 (8.1%) | 2,123 (13.9%) |
| 2 Vehicles | 6,821 (34.0%) | 4,884 (32.0%) |
| 3 Vehicles | 5,253 (26.2%) | 4,197 (27.5%) |
| 4 Vehicles | 2,917 (14.5%) | 2,351 (15.4%) |
| 5 or more Vehicles | 3,269 (16.3%) | 1,429 (9.4%) |
| Total | 20,087 (100.0%) | 15,255 (100.0%) |
Commute Time in Manteca
The most frequently occuring commute durations in Manteca are 90 or more minutes (4,743 commuters, 14.7%), 60 to 89 minutes (4,459 commuters, 13.8%), and 15 to 19 minutes (4,409 commuters, 13.6%).
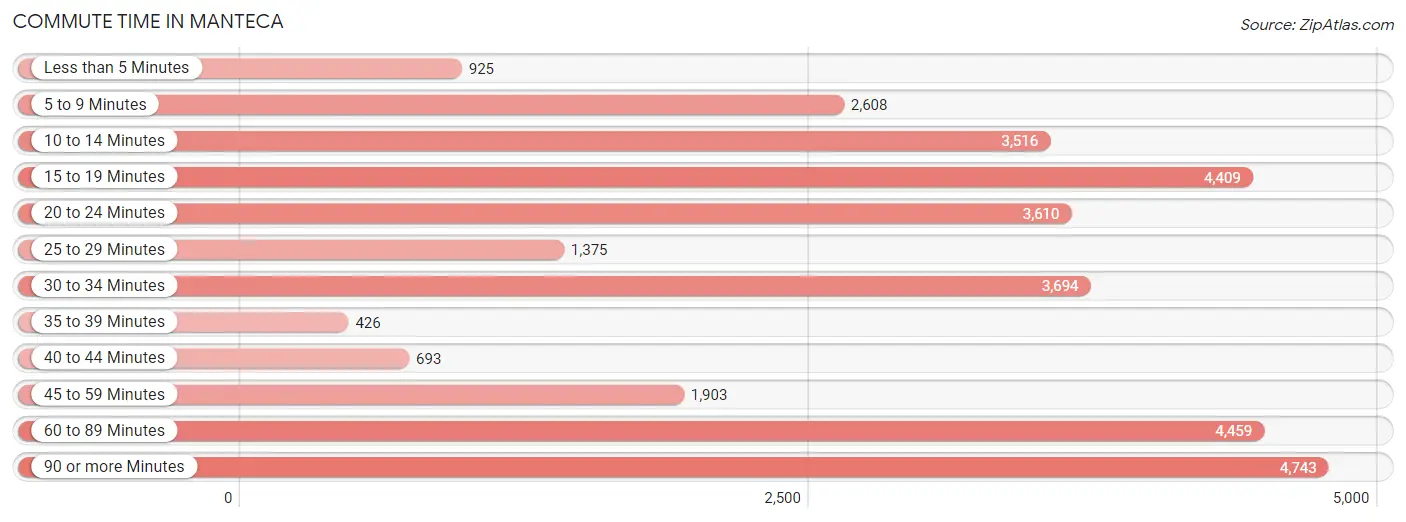
| Commute Time | # Commuters | % Commuters |
| Less than 5 Minutes | 925 | 2.9% |
| 5 to 9 Minutes | 2,608 | 8.1% |
| 10 to 14 Minutes | 3,516 | 10.9% |
| 15 to 19 Minutes | 4,409 | 13.6% |
| 20 to 24 Minutes | 3,610 | 11.2% |
| 25 to 29 Minutes | 1,375 | 4.3% |
| 30 to 34 Minutes | 3,694 | 11.4% |
| 35 to 39 Minutes | 426 | 1.3% |
| 40 to 44 Minutes | 693 | 2.1% |
| 45 to 59 Minutes | 1,903 | 5.9% |
| 60 to 89 Minutes | 4,459 | 13.8% |
| 90 or more Minutes | 4,743 | 14.7% |
Commute Time by Sex in Manteca
The most common commute times in Manteca are 90 or more minutes (3,415 commuters, 18.2%) for males and 10 to 14 minutes (2,034 commuters, 15.0%) for females.
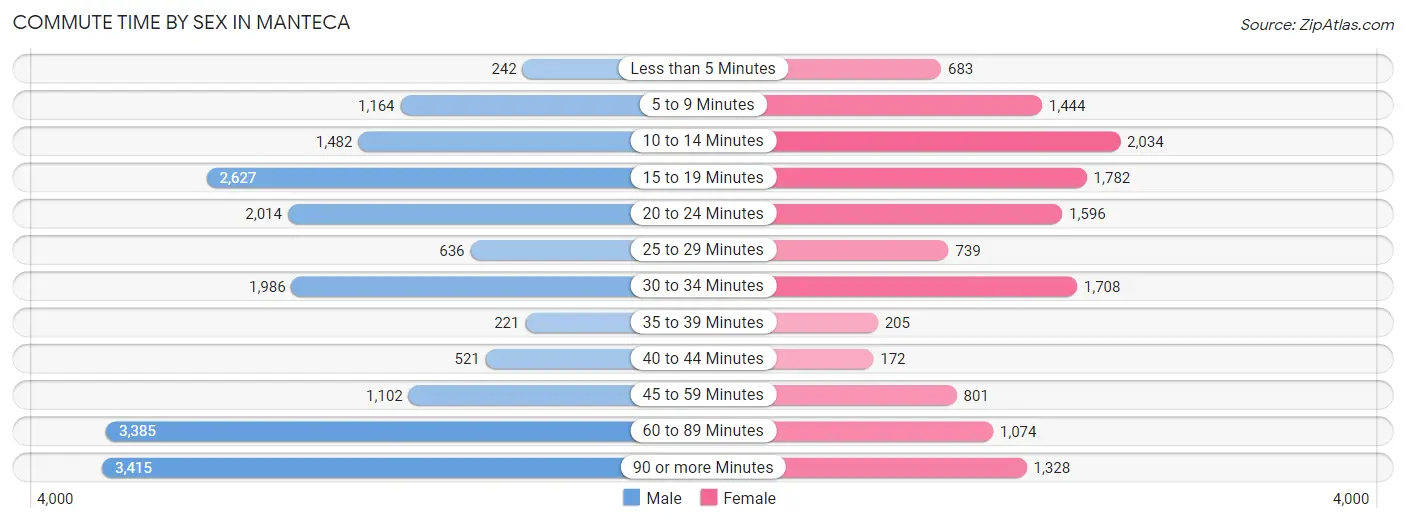
| Commute Time | Male | Female |
| Less than 5 Minutes | 242 (1.3%) | 683 (5.0%) |
| 5 to 9 Minutes | 1,164 (6.2%) | 1,444 (10.6%) |
| 10 to 14 Minutes | 1,482 (7.9%) | 2,034 (15.0%) |
| 15 to 19 Minutes | 2,627 (14.0%) | 1,782 (13.1%) |
| 20 to 24 Minutes | 2,014 (10.7%) | 1,596 (11.8%) |
| 25 to 29 Minutes | 636 (3.4%) | 739 (5.4%) |
| 30 to 34 Minutes | 1,986 (10.6%) | 1,708 (12.6%) |
| 35 to 39 Minutes | 221 (1.2%) | 205 (1.5%) |
| 40 to 44 Minutes | 521 (2.8%) | 172 (1.3%) |
| 45 to 59 Minutes | 1,102 (5.9%) | 801 (5.9%) |
| 60 to 89 Minutes | 3,385 (18.0%) | 1,074 (7.9%) |
| 90 or more Minutes | 3,415 (18.2%) | 1,328 (9.8%) |
Time of Departure to Work by Sex in Manteca
The most frequent times of departure to work in Manteca are 12:00 AM to 4:59 AM (4,012, 21.3%) for males and 7:00 AM to 7:29 AM (1,687, 12.4%) for females.
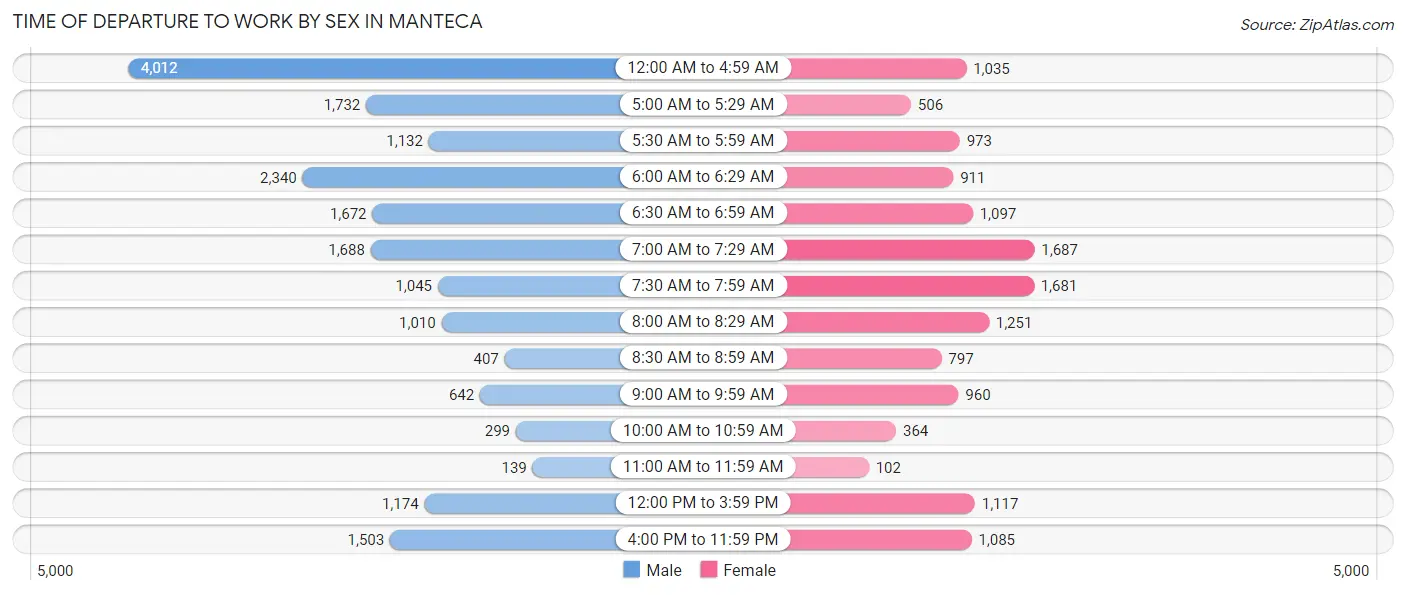
| Time of Departure | Male | Female |
| 12:00 AM to 4:59 AM | 4,012 (21.3%) | 1,035 (7.6%) |
| 5:00 AM to 5:29 AM | 1,732 (9.2%) | 506 (3.7%) |
| 5:30 AM to 5:59 AM | 1,132 (6.0%) | 973 (7.2%) |
| 6:00 AM to 6:29 AM | 2,340 (12.4%) | 911 (6.7%) |
| 6:30 AM to 6:59 AM | 1,672 (8.9%) | 1,097 (8.1%) |
| 7:00 AM to 7:29 AM | 1,688 (9.0%) | 1,687 (12.4%) |
| 7:30 AM to 7:59 AM | 1,045 (5.6%) | 1,681 (12.4%) |
| 8:00 AM to 8:29 AM | 1,010 (5.4%) | 1,251 (9.2%) |
| 8:30 AM to 8:59 AM | 407 (2.2%) | 797 (5.9%) |
| 9:00 AM to 9:59 AM | 642 (3.4%) | 960 (7.1%) |
| 10:00 AM to 10:59 AM | 299 (1.6%) | 364 (2.7%) |
| 11:00 AM to 11:59 AM | 139 (0.7%) | 102 (0.7%) |
| 12:00 PM to 3:59 PM | 1,174 (6.2%) | 1,117 (8.2%) |
| 4:00 PM to 11:59 PM | 1,503 (8.0%) | 1,085 (8.0%) |
| Total | 18,795 (100.0%) | 13,566 (100.0%) |
Housing Occupancy in Manteca
Occupancy by Ownership in Manteca
Of the total 26,217 dwellings in Manteca, owner-occupied units account for 18,115 (69.1%), while renter-occupied units make up 8,102 (30.9%).
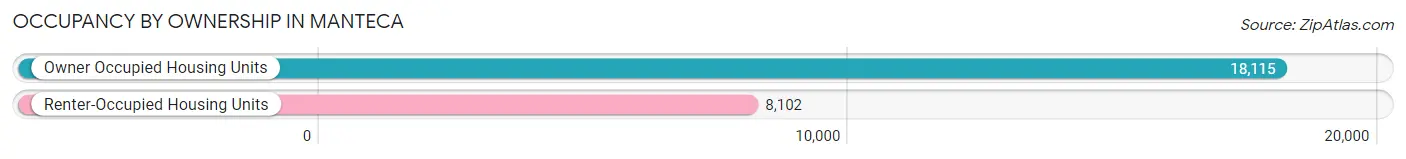
| Occupancy | # Housing Units | % Housing Units |
| Owner Occupied Housing Units | 18,115 | 69.1% |
| Renter-Occupied Housing Units | 8,102 | 30.9% |
| Total Occupied Housing Units | 26,217 | 100.0% |
Occupancy by Household Size in Manteca
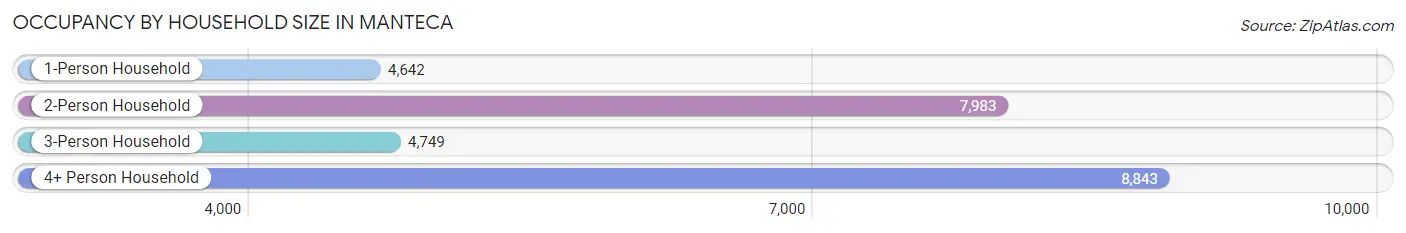
| Household Size | # Housing Units | % Housing Units |
| 1-Person Household | 4,642 | 17.7% |
| 2-Person Household | 7,983 | 30.4% |
| 3-Person Household | 4,749 | 18.1% |
| 4+ Person Household | 8,843 | 33.7% |
| Total Housing Units | 26,217 | 100.0% |
Occupancy by Ownership by Household Size in Manteca
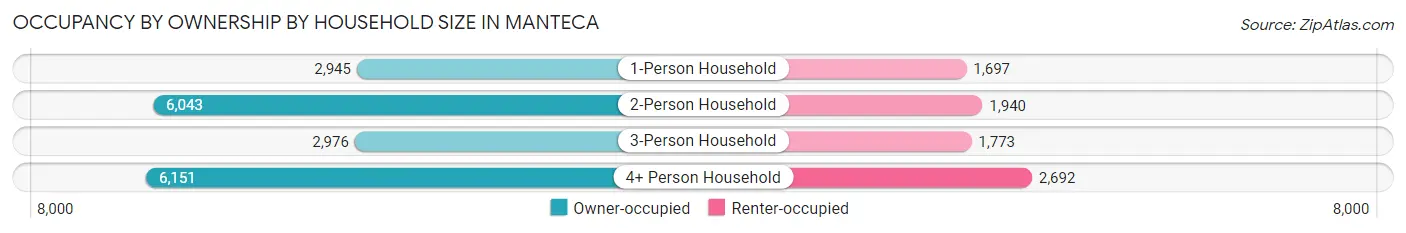
| Household Size | Owner-occupied | Renter-occupied |
| 1-Person Household | 2,945 (63.4%) | 1,697 (36.6%) |
| 2-Person Household | 6,043 (75.7%) | 1,940 (24.3%) |
| 3-Person Household | 2,976 (62.7%) | 1,773 (37.3%) |
| 4+ Person Household | 6,151 (69.6%) | 2,692 (30.4%) |
| Total Housing Units | 18,115 (69.1%) | 8,102 (30.9%) |
Occupancy by Educational Attainment in Manteca
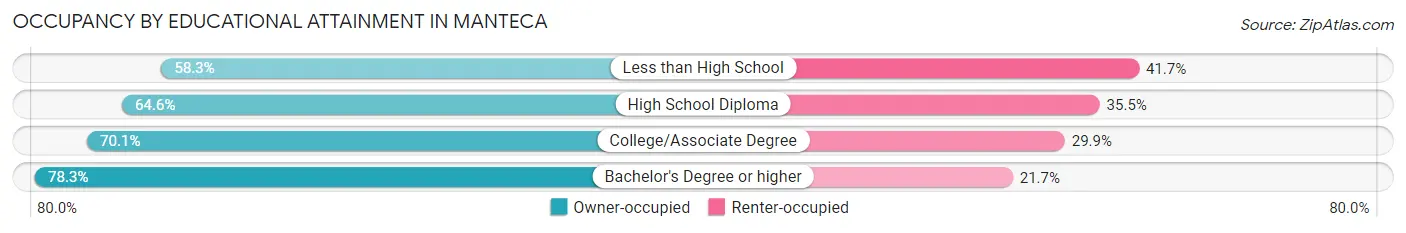
| Household Size | Owner-occupied | Renter-occupied |
| Less than High School | 1,792 (58.3%) | 1,282 (41.7%) |
| High School Diploma | 4,387 (64.5%) | 2,409 (35.4%) |
| College/Associate Degree | 7,374 (70.1%) | 3,149 (29.9%) |
| Bachelor's Degree or higher | 4,562 (78.3%) | 1,262 (21.7%) |
Occupancy by Age of Householder in Manteca
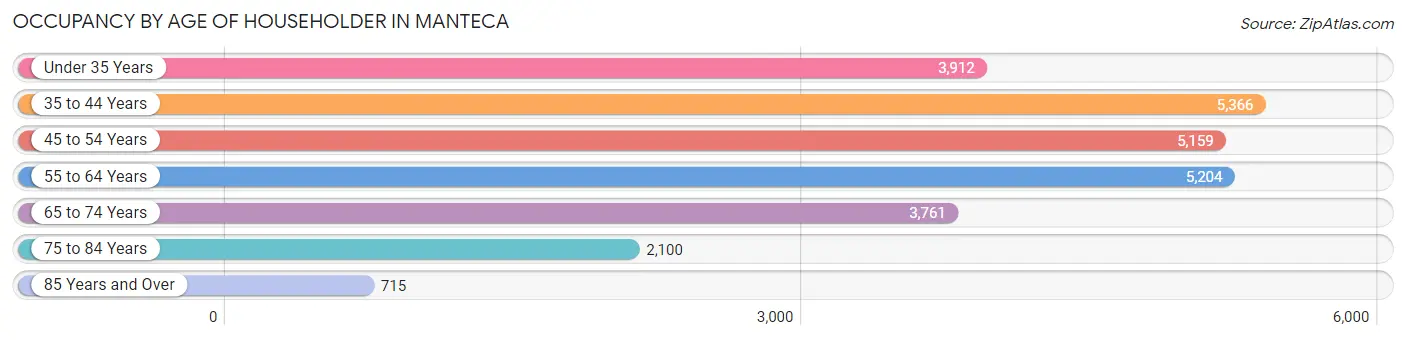
| Age Bracket | # Households | % Households |
| Under 35 Years | 3,912 | 14.9% |
| 35 to 44 Years | 5,366 | 20.5% |
| 45 to 54 Years | 5,159 | 19.7% |
| 55 to 64 Years | 5,204 | 19.9% |
| 65 to 74 Years | 3,761 | 14.3% |
| 75 to 84 Years | 2,100 | 8.0% |
| 85 Years and Over | 715 | 2.7% |
| Total | 26,217 | 100.0% |
Housing Finances in Manteca
Median Income by Occupancy in Manteca
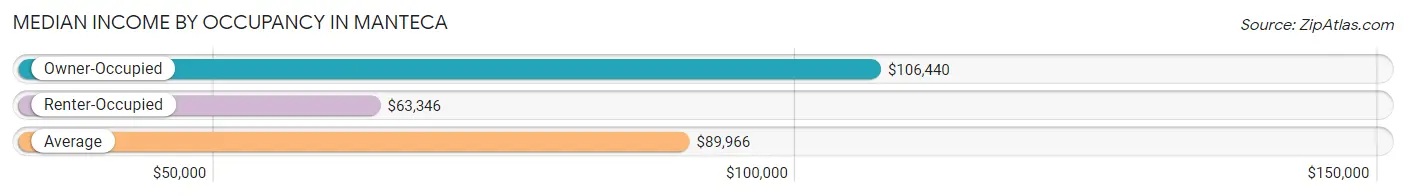
| Occupancy Type | # Households | Median Income |
| Owner-Occupied | 18,115 (69.1%) | $106,440 |
| Renter-Occupied | 8,102 (30.9%) | $63,346 |
| Average | 26,217 (100.0%) | $89,966 |
Occupancy by Householder Income Bracket in Manteca
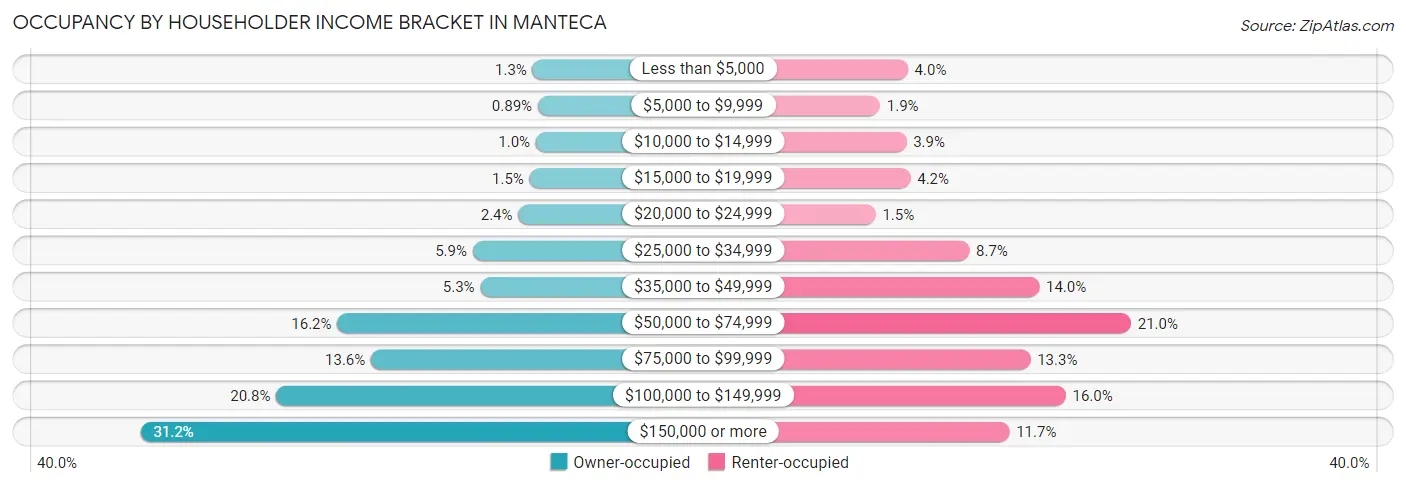
| Income Bracket | Owner-occupied | Renter-occupied |
| Less than $5,000 | 233 (1.3%) | 322 (4.0%) |
| $5,000 to $9,999 | 161 (0.9%) | 150 (1.8%) |
| $10,000 to $14,999 | 189 (1.0%) | 313 (3.9%) |
| $15,000 to $19,999 | 276 (1.5%) | 338 (4.2%) |
| $20,000 to $24,999 | 431 (2.4%) | 123 (1.5%) |
| $25,000 to $34,999 | 1,059 (5.9%) | 701 (8.6%) |
| $35,000 to $49,999 | 955 (5.3%) | 1,133 (14.0%) |
| $50,000 to $74,999 | 2,930 (16.2%) | 1,699 (21.0%) |
| $75,000 to $99,999 | 2,463 (13.6%) | 1,078 (13.3%) |
| $100,000 to $149,999 | 3,771 (20.8%) | 1,296 (16.0%) |
| $150,000 or more | 5,647 (31.2%) | 949 (11.7%) |
| Total | 18,115 (100.0%) | 8,102 (100.0%) |
Monthly Housing Cost Tiers in Manteca
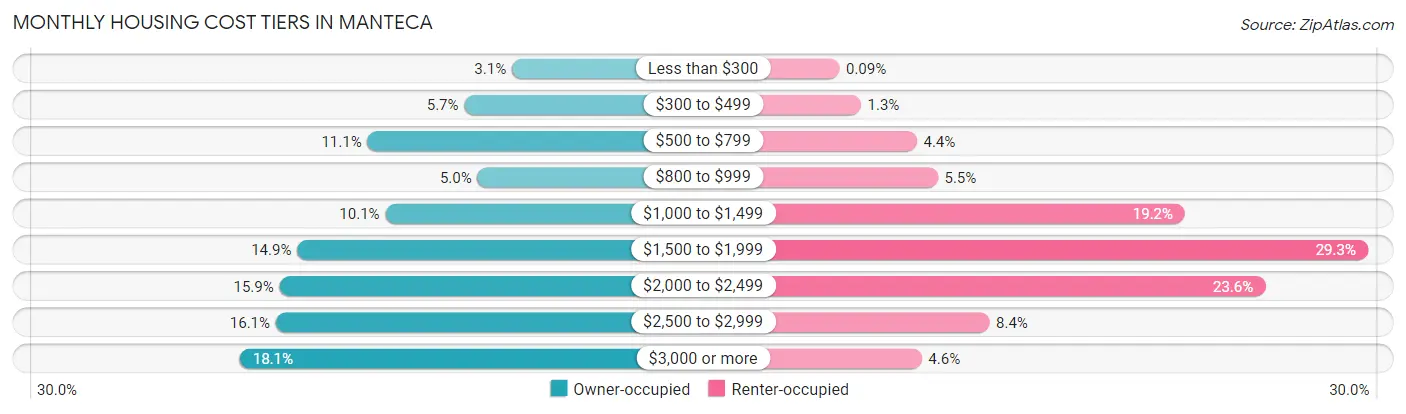
| Monthly Cost | Owner-occupied | Renter-occupied |
| Less than $300 | 558 (3.1%) | 7 (0.1%) |
| $300 to $499 | 1,034 (5.7%) | 104 (1.3%) |
| $500 to $799 | 2,003 (11.1%) | 354 (4.4%) |
| $800 to $999 | 903 (5.0%) | 448 (5.5%) |
| $1,000 to $1,499 | 1,824 (10.1%) | 1,555 (19.2%) |
| $1,500 to $1,999 | 2,707 (14.9%) | 2,373 (29.3%) |
| $2,000 to $2,499 | 2,884 (15.9%) | 1,914 (23.6%) |
| $2,500 to $2,999 | 2,921 (16.1%) | 679 (8.4%) |
| $3,000 or more | 3,281 (18.1%) | 376 (4.6%) |
| Total | 18,115 (100.0%) | 8,102 (100.0%) |
Physical Housing Characteristics in Manteca
Housing Structures in Manteca
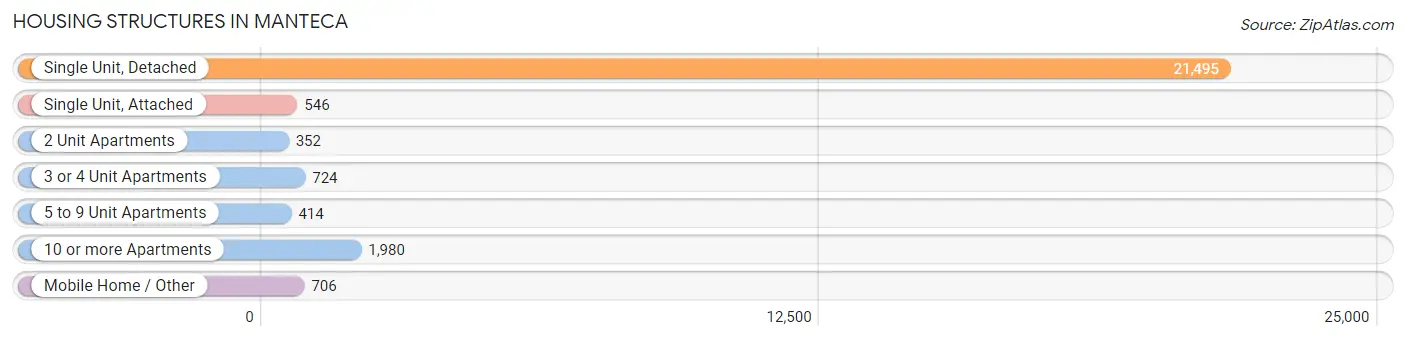
| Structure Type | # Housing Units | % Housing Units |
| Single Unit, Detached | 21,495 | 82.0% |
| Single Unit, Attached | 546 | 2.1% |
| 2 Unit Apartments | 352 | 1.3% |
| 3 or 4 Unit Apartments | 724 | 2.8% |
| 5 to 9 Unit Apartments | 414 | 1.6% |
| 10 or more Apartments | 1,980 | 7.5% |
| Mobile Home / Other | 706 | 2.7% |
| Total | 26,217 | 100.0% |
Housing Structures by Occupancy in Manteca
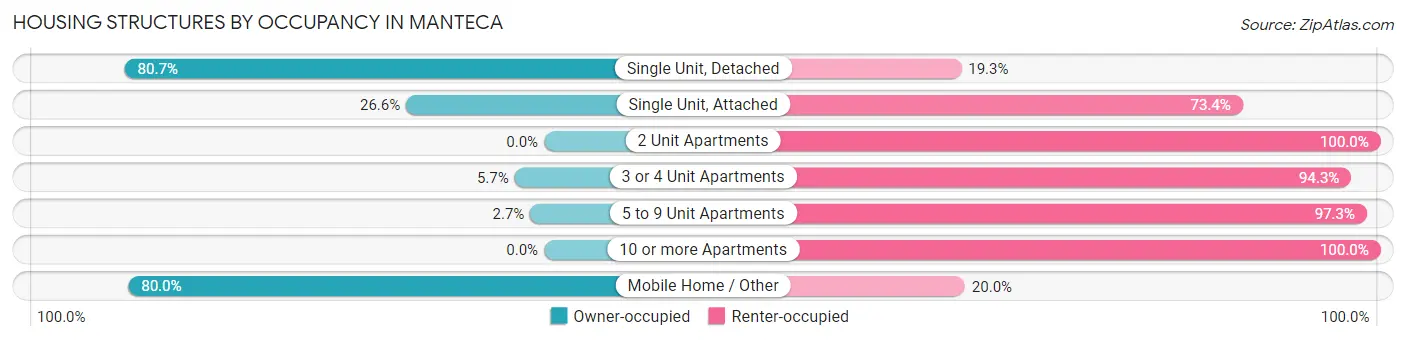
| Structure Type | Owner-occupied | Renter-occupied |
| Single Unit, Detached | 17,353 (80.7%) | 4,142 (19.3%) |
| Single Unit, Attached | 145 (26.6%) | 401 (73.4%) |
| 2 Unit Apartments | 0 (0.0%) | 352 (100.0%) |
| 3 or 4 Unit Apartments | 41 (5.7%) | 683 (94.3%) |
| 5 to 9 Unit Apartments | 11 (2.7%) | 403 (97.3%) |
| 10 or more Apartments | 0 (0.0%) | 1,980 (100.0%) |
| Mobile Home / Other | 565 (80.0%) | 141 (20.0%) |
| Total | 18,115 (69.1%) | 8,102 (30.9%) |
Housing Structures by Number of Rooms in Manteca
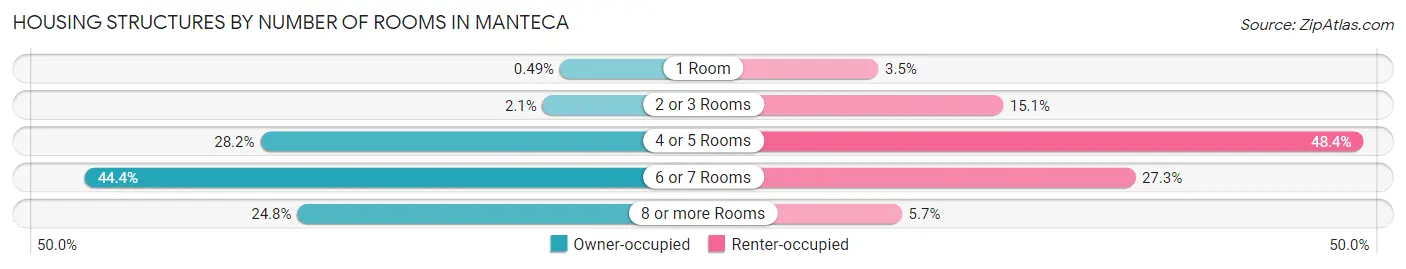
| Number of Rooms | Owner-occupied | Renter-occupied |
| 1 Room | 89 (0.5%) | 286 (3.5%) |
| 2 or 3 Rooms | 380 (2.1%) | 1,220 (15.1%) |
| 4 or 5 Rooms | 5,108 (28.2%) | 3,922 (48.4%) |
| 6 or 7 Rooms | 8,050 (44.4%) | 2,211 (27.3%) |
| 8 or more Rooms | 4,488 (24.8%) | 463 (5.7%) |
| Total | 18,115 (100.0%) | 8,102 (100.0%) |
Housing Structure by Heating Type in Manteca
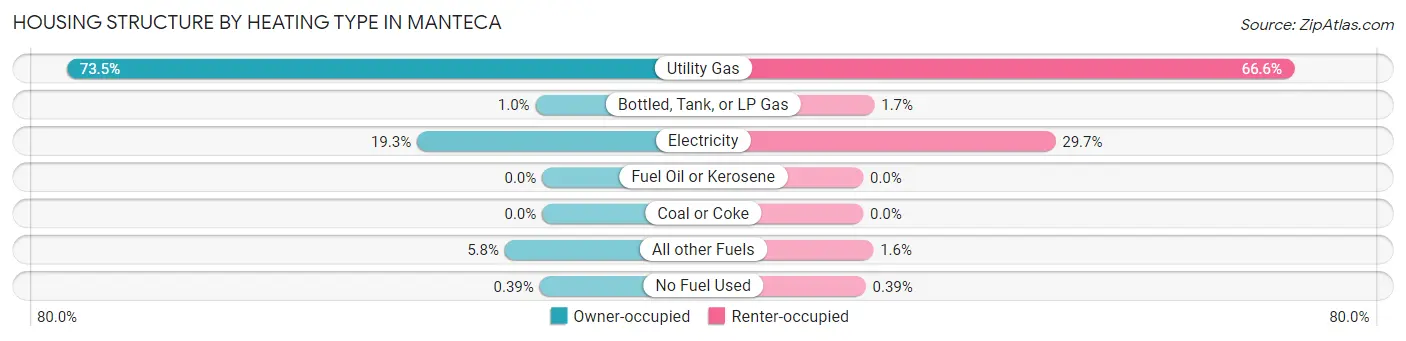
| Heating Type | Owner-occupied | Renter-occupied |
| Utility Gas | 13,309 (73.5%) | 5,394 (66.6%) |
| Bottled, Tank, or LP Gas | 187 (1.0%) | 141 (1.7%) |
| Electricity | 3,503 (19.3%) | 2,408 (29.7%) |
| Fuel Oil or Kerosene | 0 (0.0%) | 0 (0.0%) |
| Coal or Coke | 0 (0.0%) | 0 (0.0%) |
| All other Fuels | 1,045 (5.8%) | 127 (1.6%) |
| No Fuel Used | 71 (0.4%) | 32 (0.4%) |
| Total | 18,115 (100.0%) | 8,102 (100.0%) |
Household Vehicle Usage in Manteca
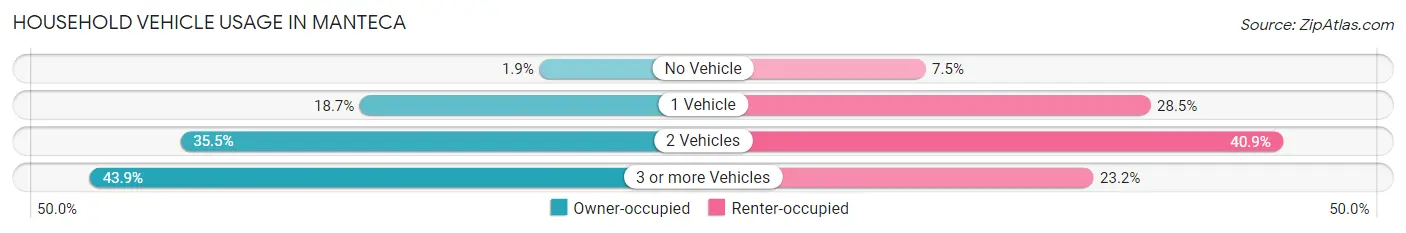
| Vehicles per Household | Owner-occupied | Renter-occupied |
| No Vehicle | 350 (1.9%) | 607 (7.5%) |
| 1 Vehicle | 3,384 (18.7%) | 2,308 (28.5%) |
| 2 Vehicles | 6,425 (35.5%) | 3,310 (40.8%) |
| 3 or more Vehicles | 7,956 (43.9%) | 1,877 (23.2%) |
| Total | 18,115 (100.0%) | 8,102 (100.0%) |
Real Estate & Mortgages in Manteca
Real Estate and Mortgage Overview in Manteca
| Characteristic | Without Mortgage | With Mortgage |
| Housing Units | 4,955 | 13,160 |
| Median Property Value | $466,200 | $527,100 |
| Median Household Income | $76,330 | $4,649 |
| Monthly Housing Costs | $643 | $3,273 |
| Real Estate Taxes | $3,217 | $174 |
Property Value by Mortgage Status in Manteca
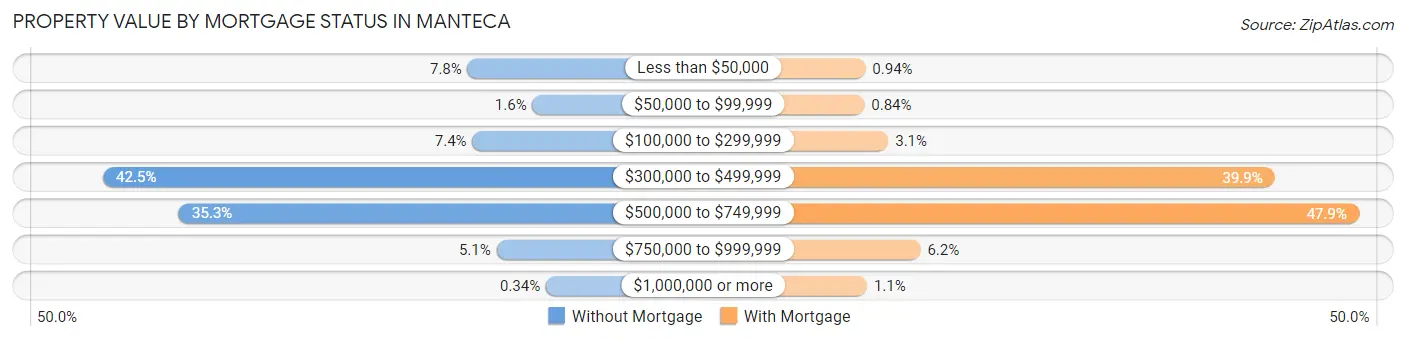
| Property Value | Without Mortgage | With Mortgage |
| Less than $50,000 | 387 (7.8%) | 124 (0.9%) |
| $50,000 to $99,999 | 81 (1.6%) | 110 (0.8%) |
| $100,000 to $299,999 | 364 (7.3%) | 411 (3.1%) |
| $300,000 to $499,999 | 2,107 (42.5%) | 5,252 (39.9%) |
| $500,000 to $749,999 | 1,749 (35.3%) | 6,306 (47.9%) |
| $750,000 to $999,999 | 250 (5.1%) | 813 (6.2%) |
| $1,000,000 or more | 17 (0.3%) | 144 (1.1%) |
| Total | 4,955 (100.0%) | 13,160 (100.0%) |
Household Income by Mortgage Status in Manteca
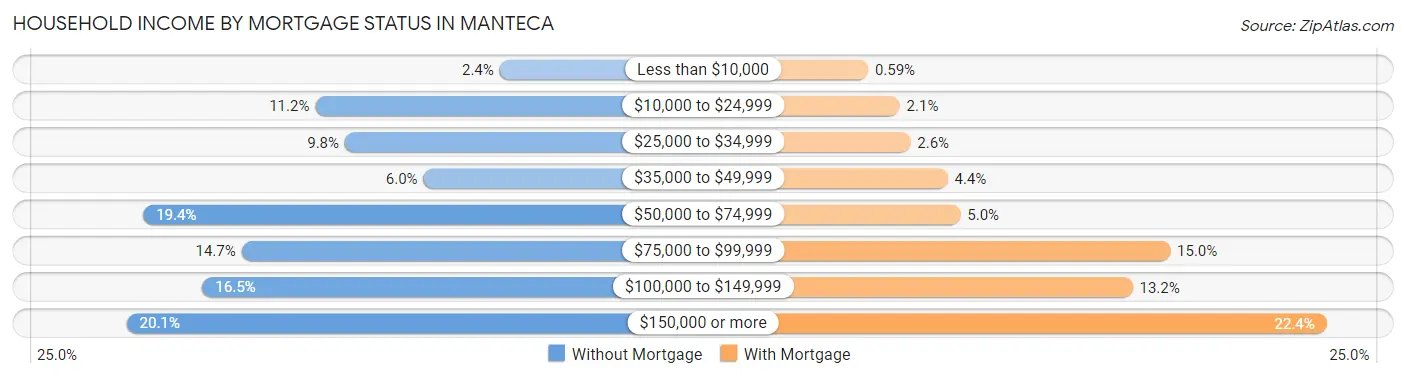
| Household Income | Without Mortgage | With Mortgage |
| Less than $10,000 | 118 (2.4%) | 78 (0.6%) |
| $10,000 to $24,999 | 553 (11.2%) | 276 (2.1%) |
| $25,000 to $34,999 | 483 (9.8%) | 343 (2.6%) |
| $35,000 to $49,999 | 298 (6.0%) | 576 (4.4%) |
| $50,000 to $74,999 | 959 (19.4%) | 657 (5.0%) |
| $75,000 to $99,999 | 727 (14.7%) | 1,971 (15.0%) |
| $100,000 to $149,999 | 819 (16.5%) | 1,736 (13.2%) |
| $150,000 or more | 998 (20.1%) | 2,952 (22.4%) |
| Total | 4,955 (100.0%) | 13,160 (100.0%) |
Property Value to Household Income Ratio in Manteca
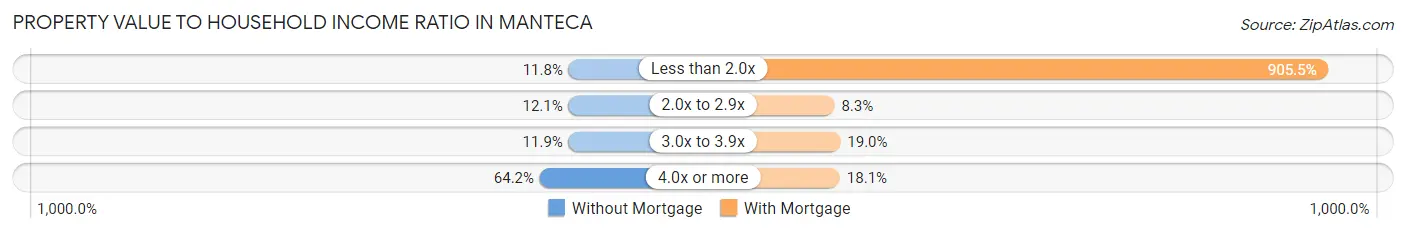
| Value-to-Income Ratio | Without Mortgage | With Mortgage |
| Less than 2.0x | 583 (11.8%) | 119,164 (905.5%) |
| 2.0x to 2.9x | 601 (12.1%) | 1,088 (8.3%) |
| 3.0x to 3.9x | 591 (11.9%) | 2,500 (19.0%) |
| 4.0x or more | 3,180 (64.2%) | 2,387 (18.1%) |
| Total | 4,955 (100.0%) | 13,160 (100.0%) |
Real Estate Taxes by Mortgage Status in Manteca
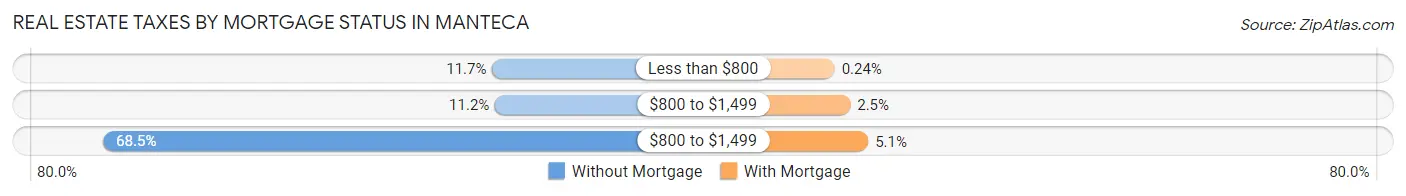
| Property Taxes | Without Mortgage | With Mortgage |
| Less than $800 | 578 (11.7%) | 31 (0.2%) |
| $800 to $1,499 | 557 (11.2%) | 331 (2.5%) |
| $800 to $1,499 | 3,395 (68.5%) | 676 (5.1%) |
| Total | 4,955 (100.0%) | 13,160 (100.0%) |
Health & Disability in Manteca
Health Insurance Coverage by Age in Manteca
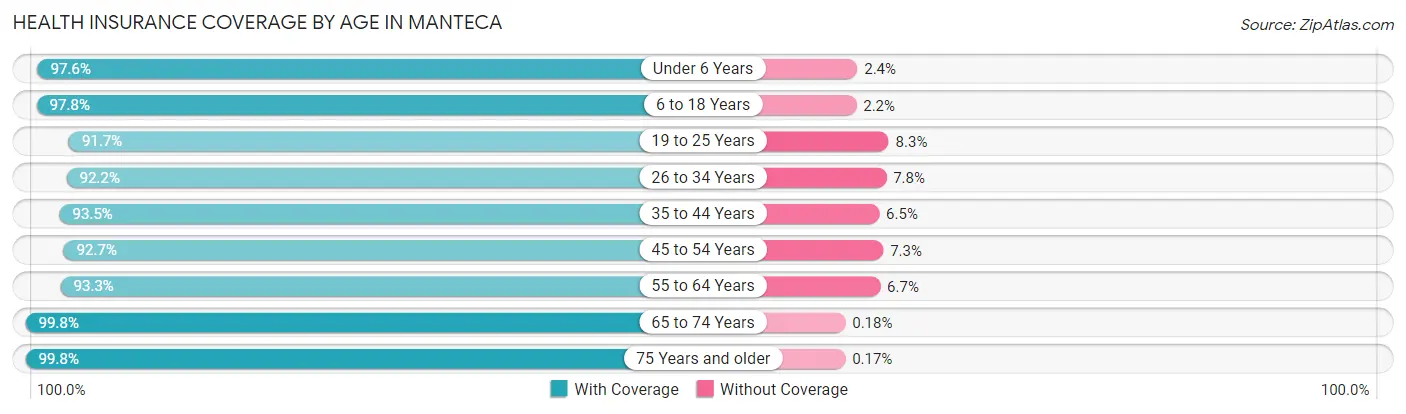
| Age Bracket | With Coverage | Without Coverage |
| Under 6 Years | 6,778 (97.6%) | 168 (2.4%) |
| 6 to 18 Years | 14,831 (97.8%) | 338 (2.2%) |
| 19 to 25 Years | 6,158 (91.7%) | 555 (8.3%) |
| 26 to 34 Years | 10,087 (92.2%) | 856 (7.8%) |
| 35 to 44 Years | 10,751 (93.5%) | 747 (6.5%) |
| 45 to 54 Years | 9,950 (92.7%) | 779 (7.3%) |
| 55 to 64 Years | 9,660 (93.3%) | 693 (6.7%) |
| 65 to 74 Years | 6,597 (99.8%) | 12 (0.2%) |
| 75 Years and older | 4,564 (99.8%) | 8 (0.2%) |
| Total | 79,376 (95.0%) | 4,156 (5.0%) |
Health Insurance Coverage by Citizenship Status in Manteca
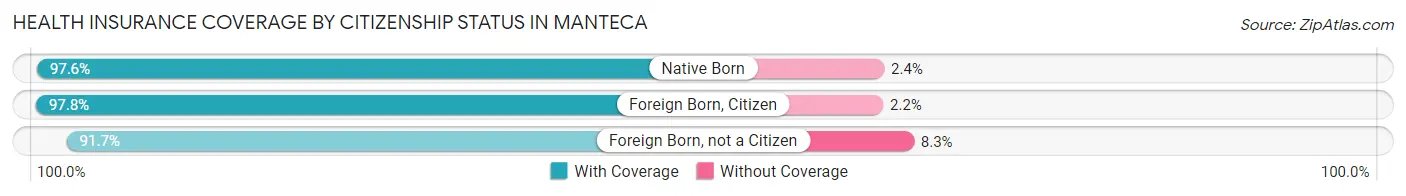
| Citizenship Status | With Coverage | Without Coverage |
| Native Born | 6,778 (97.6%) | 168 (2.4%) |
| Foreign Born, Citizen | 14,831 (97.8%) | 338 (2.2%) |
| Foreign Born, not a Citizen | 6,158 (91.7%) | 555 (8.3%) |
Health Insurance Coverage by Household Income in Manteca
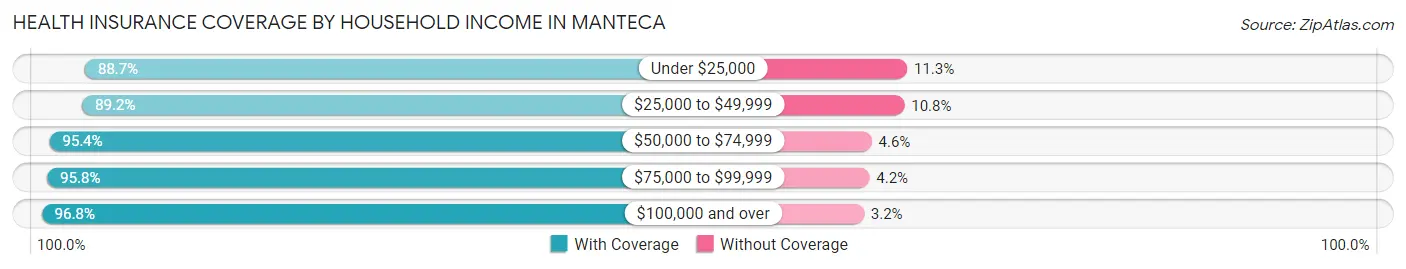
| Household Income | With Coverage | Without Coverage |
| Under $25,000 | 4,637 (88.7%) | 590 (11.3%) |
| $25,000 to $49,999 | 9,136 (89.2%) | 1,104 (10.8%) |
| $50,000 to $74,999 | 12,000 (95.4%) | 584 (4.6%) |
| $75,000 to $99,999 | 10,922 (95.8%) | 482 (4.2%) |
| $100,000 and over | 42,216 (96.8%) | 1,391 (3.2%) |
Public vs Private Health Insurance Coverage by Age in Manteca
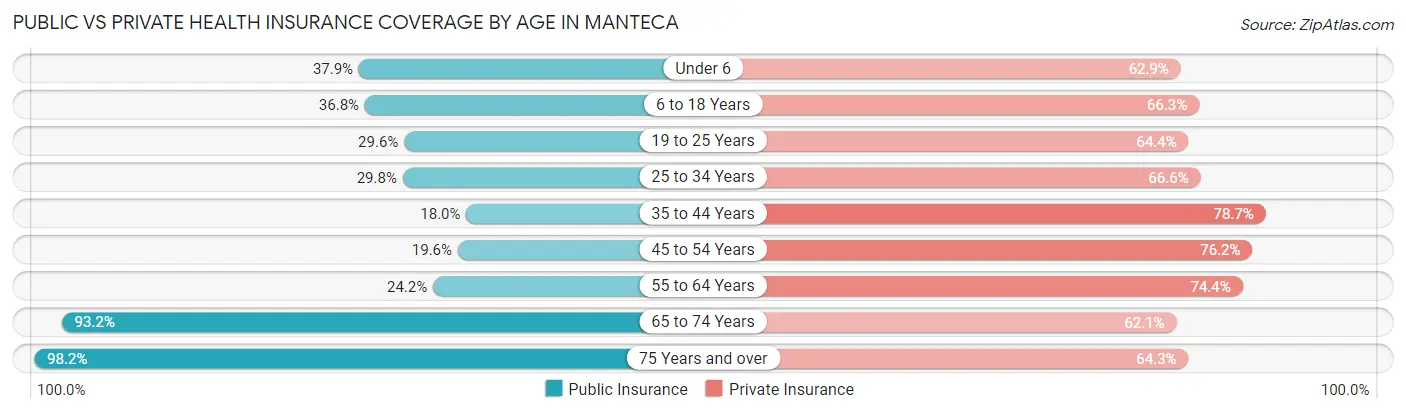
| Age Bracket | Public Insurance | Private Insurance |
| Under 6 | 2,635 (37.9%) | 4,369 (62.9%) |
| 6 to 18 Years | 5,587 (36.8%) | 10,058 (66.3%) |
| 19 to 25 Years | 1,984 (29.5%) | 4,320 (64.3%) |
| 25 to 34 Years | 3,262 (29.8%) | 7,287 (66.6%) |
| 35 to 44 Years | 2,070 (18.0%) | 9,045 (78.7%) |
| 45 to 54 Years | 2,101 (19.6%) | 8,176 (76.2%) |
| 55 to 64 Years | 2,504 (24.2%) | 7,701 (74.4%) |
| 65 to 74 Years | 6,156 (93.1%) | 4,105 (62.1%) |
| 75 Years and over | 4,491 (98.2%) | 2,941 (64.3%) |
| Total | 30,790 (36.9%) | 58,002 (69.4%) |
Disability Status by Sex by Age in Manteca
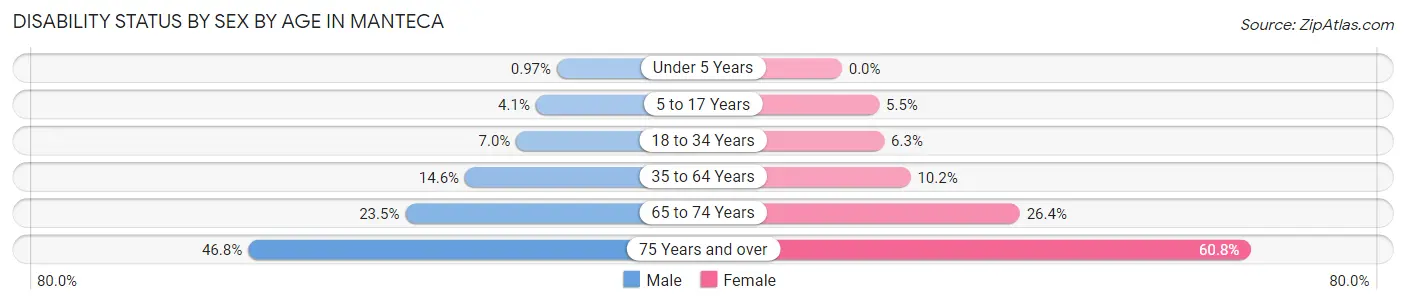
| Age Bracket | Male | Female |
| Under 5 Years | 33 (1.0%) | 0 (0.0%) |
| 5 to 17 Years | 323 (4.1%) | 422 (5.5%) |
| 18 to 34 Years | 674 (7.0%) | 562 (6.3%) |
| 35 to 64 Years | 2,448 (14.6%) | 1,616 (10.2%) |
| 65 to 74 Years | 695 (23.5%) | 964 (26.4%) |
| 75 Years and over | 879 (46.8%) | 1,638 (60.8%) |
Disability Class by Sex by Age in Manteca
Disability Class: Hearing Difficulty
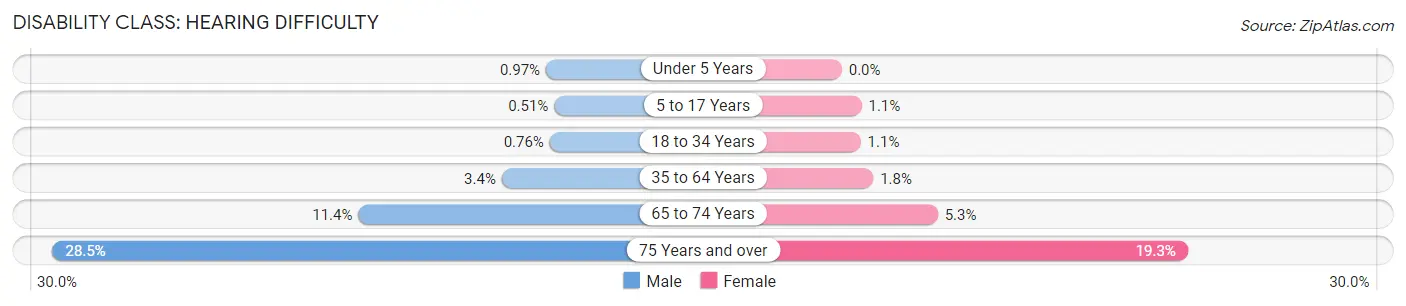
| Age Bracket | Male | Female |
| Under 5 Years | 33 (1.0%) | 0 (0.0%) |
| 5 to 17 Years | 40 (0.5%) | 84 (1.1%) |
| 18 to 34 Years | 73 (0.8%) | 94 (1.1%) |
| 35 to 64 Years | 574 (3.4%) | 277 (1.8%) |
| 65 to 74 Years | 338 (11.4%) | 195 (5.3%) |
| 75 Years and over | 534 (28.4%) | 519 (19.3%) |
Disability Class: Vision Difficulty
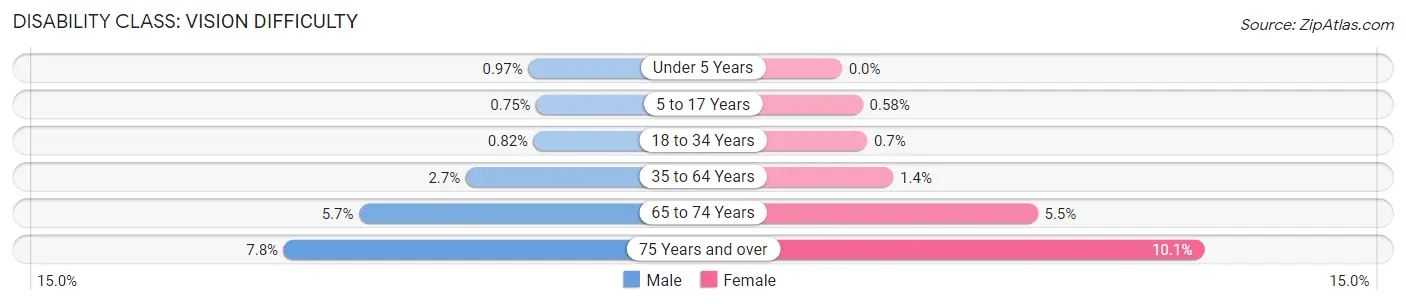
| Age Bracket | Male | Female |
| Under 5 Years | 33 (1.0%) | 0 (0.0%) |
| 5 to 17 Years | 59 (0.7%) | 44 (0.6%) |
| 18 to 34 Years | 79 (0.8%) | 63 (0.7%) |
| 35 to 64 Years | 453 (2.7%) | 226 (1.4%) |
| 65 to 74 Years | 168 (5.7%) | 199 (5.4%) |
| 75 Years and over | 146 (7.8%) | 272 (10.1%) |
Disability Class: Cognitive Difficulty
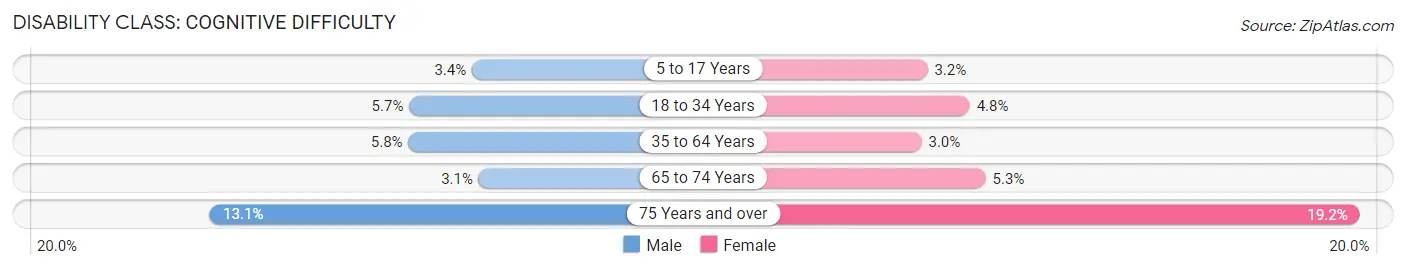
| Age Bracket | Male | Female |
| 5 to 17 Years | 267 (3.4%) | 242 (3.2%) |
| 18 to 34 Years | 551 (5.7%) | 425 (4.8%) |
| 35 to 64 Years | 962 (5.8%) | 469 (3.0%) |
| 65 to 74 Years | 93 (3.1%) | 195 (5.3%) |
| 75 Years and over | 246 (13.1%) | 518 (19.2%) |
Disability Class: Ambulatory Difficulty
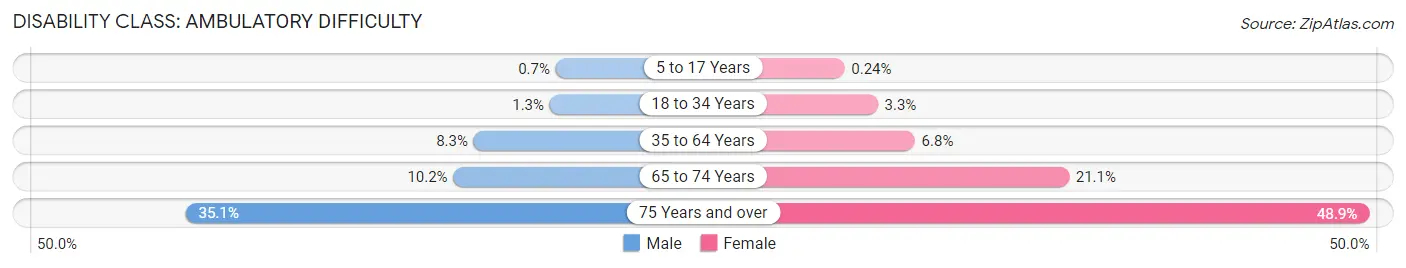
| Age Bracket | Male | Female |
| 5 to 17 Years | 55 (0.7%) | 18 (0.2%) |
| 18 to 34 Years | 120 (1.3%) | 297 (3.3%) |
| 35 to 64 Years | 1,391 (8.3%) | 1,071 (6.8%) |
| 65 to 74 Years | 302 (10.2%) | 769 (21.1%) |
| 75 Years and over | 658 (35.1%) | 1,319 (48.9%) |
Disability Class: Self-Care Difficulty
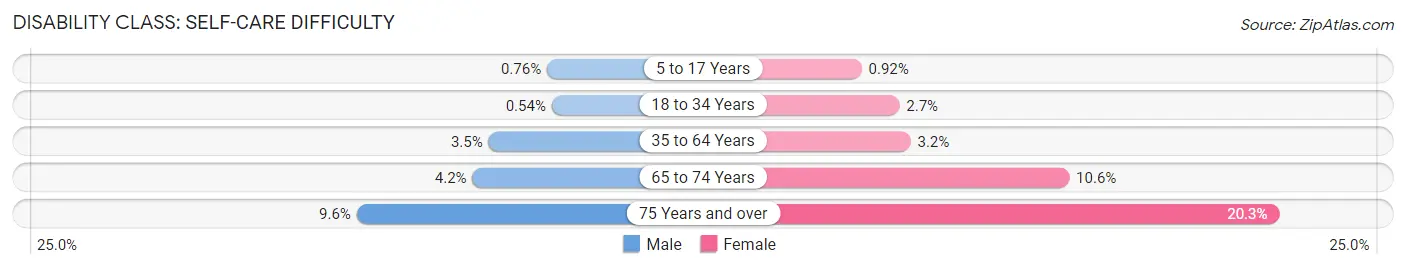
| Age Bracket | Male | Female |
| 5 to 17 Years | 60 (0.8%) | 70 (0.9%) |
| 18 to 34 Years | 52 (0.5%) | 239 (2.7%) |
| 35 to 64 Years | 581 (3.5%) | 505 (3.2%) |
| 65 to 74 Years | 125 (4.2%) | 385 (10.5%) |
| 75 Years and over | 180 (9.6%) | 547 (20.3%) |
Technology Access in Manteca
Computing Device Access in Manteca
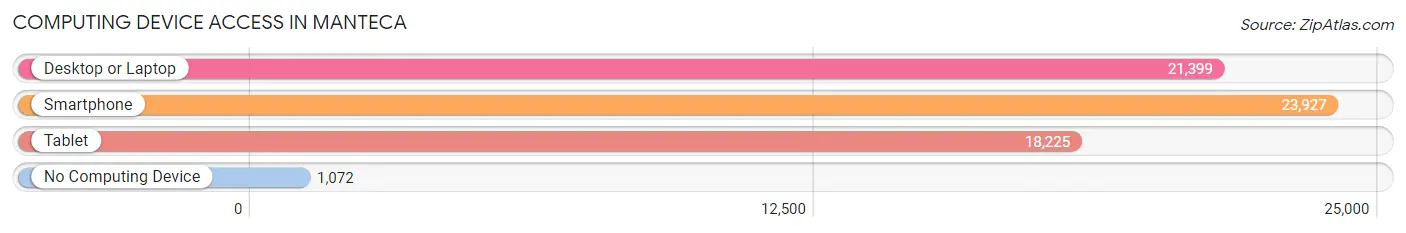
| Device Type | # Households | % Households |
| Desktop or Laptop | 21,399 | 81.6% |
| Smartphone | 23,927 | 91.3% |
| Tablet | 18,225 | 69.5% |
| No Computing Device | 1,072 | 4.1% |
| Total | 26,217 | 100.0% |
Internet Access in Manteca
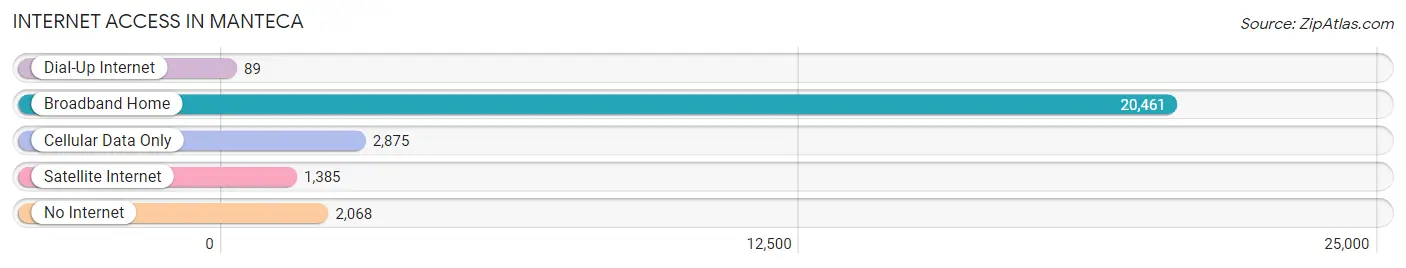
| Internet Type | # Households | % Households |
| Dial-Up Internet | 89 | 0.3% |
| Broadband Home | 20,461 | 78.0% |
| Cellular Data Only | 2,875 | 11.0% |
| Satellite Internet | 1,385 | 5.3% |
| No Internet | 2,068 | 7.9% |
| Total | 26,217 | 100.0% |
Manteca Summary
Manteca, California is a city located in San Joaquin County in the Central Valley of California. It is situated in the northern part of the county, about 80 miles east of San Francisco and 40 miles south of Sacramento. The city is part of the Stockton-Lodi metropolitan area and has a population of approximately 70,000 people.
History
Manteca was founded in 1861 by Joshua Cowell, a rancher from the nearby town of Ripon. Cowell purchased a large tract of land in the area and began to develop it for agricultural purposes. The city was named after the Spanish word for lard, which was used to make soap and candles. The city grew slowly over the next few decades, but it was not until the early 20th century that it began to experience significant growth.
In the 1920s, the city was transformed by the construction of the Central Pacific Railroad, which connected Manteca to the rest of the state. This allowed for the development of the city’s agricultural industry, which included the production of fruits, vegetables, and nuts. The city also became a major hub for the transportation of goods throughout the Central Valley.
In the 1950s, Manteca experienced a population boom as people moved to the area in search of employment opportunities. This growth was fueled by the construction of the nearby Interstate 5 freeway, which connected the city to the rest of the state. The city’s population continued to grow throughout the rest of the 20th century, and it is now one of the largest cities in San Joaquin County.
Geography
Manteca is located in the Central Valley of California, about 80 miles east of San Francisco and 40 miles south of Sacramento. The city is situated in the northern part of San Joaquin County, and it is bordered by the cities of Stockton, Lathrop, and Tracy. The city covers an area of approximately 20 square miles and is situated at an elevation of about 200 feet above sea level.
The city is located in a semi-arid climate zone, and it experiences hot, dry summers and mild, wet winters. The average annual temperature is around 65 degrees Fahrenheit, and the average annual precipitation is around 18 inches.
Economy
Manteca’s economy is largely based on agriculture and manufacturing. The city is home to a number of large agricultural companies, including Foster Farms, which is one of the largest poultry producers in the United States. The city is also home to a number of manufacturing companies, including the Manteca-based Del Monte Foods.
The city is also home to a number of retail and service businesses, including a number of restaurants, hotels, and shopping centers. The city is also home to a number of medical facilities, including the San Joaquin General Hospital.
Demographics
As of the 2010 census, the population of Manteca was 70,454. The city has a diverse population, with the largest ethnic groups being White (47.3%), Hispanic or Latino (37.2%), and Asian (7.2%). The median household income in the city is $60,845, and the median home value is $269,000.
Manteca is a diverse and vibrant city that has experienced significant growth over the past few decades. The city is home to a number of businesses and industries, and it is a popular destination for tourists and visitors. The city is also home to a number of cultural and recreational attractions, including the Manteca Historical Museum and the Manteca Skate Park.
Common Questions
What is Per Capita Income in Manteca?
Per Capita income in Manteca is $36,000.
What is the Median Family Income in Manteca?
Median Family Income in Manteca is $95,730.
What is the Median Household income in Manteca?
Median Household Income in Manteca is $89,966.
What is Income or Wage Gap in Manteca?
Income or Wage Gap in Manteca is 26.7%.
Women in Manteca earn 73.3 cents for every dollar earned by a man.
What is Family Income Deficit in Manteca?
Family Income Deficit in Manteca is $9,716.
Families that are below poverty line in Manteca earn $9,716 less on average than the poverty threshold level.
What is Inequality or Gini Index in Manteca?
Inequality or Gini Index in Manteca is 0.41.
What is the Total Population of Manteca?
Total Population of Manteca is 83,897.
What is the Total Male Population of Manteca?
Total Male Population of Manteca is 42,697.
What is the Total Female Population of Manteca?
Total Female Population of Manteca is 41,200.
What is the Ratio of Males per 100 Females in Manteca?
There are 103.63 Males per 100 Females in Manteca.
What is the Ratio of Females per 100 Males in Manteca?
There are 96.49 Females per 100 Males in Manteca.
What is the Median Population Age in Manteca?
Median Population Age in Manteca is 37.0 Years.
What is the Average Family Size in Manteca
Average Family Size in Manteca is 3.6 People.
What is the Average Household Size in Manteca
Average Household Size in Manteca is 3.2 People.
How Large is the Labor Force in Manteca?
There are 39,025 People in the Labor Forcein in Manteca.
What is the Percentage of People in the Labor Force in Manteca?
60.2% of People are in the Labor Force in Manteca.
What is the Unemployment Rate in Manteca?
Unemployment Rate in Manteca is 6.4%.