National City, CA Map & Demographics
National City Map
National City Overview
$25,574
PER CAPITA INCOME
$64,630
AVG FAMILY INCOME
$59,850
AVG HOUSEHOLD INCOME
20.9%
WAGE / INCOME GAP [ % ]
79.1¢/ $1
WAGE / INCOME GAP [ $ ]
$10,941
FAMILY INCOME DEFICIT
0.44
INEQUALITY / GINI INDEX
56,345
TOTAL POPULATION
27,181
MALE POPULATION
29,164
FEMALE POPULATION
93.20
MALES / 100 FEMALES
107.30
FEMALES / 100 MALES
36.0
MEDIAN AGE
3.7
AVG FAMILY SIZE
3.1
AVG HOUSEHOLD SIZE
28,873
LABOR FORCE [ PEOPLE ]
63.7%
PERCENT IN LABOR FORCE
8.4%
UNEMPLOYMENT RATE
National City Zip Codes
National City Area Codes
Income in National City
Income Overview in National City
Per Capita Income in National City is $25,574, while median incomes of families and households are $64,630 and $59,850 respectively.
| Characteristic | Number | Measure |
| Per Capita Income | 56,345 | $25,574 |
| Median Family Income | 12,665 | $64,630 |
| Mean Family Income | 12,665 | $79,591 |
| Median Household Income | 17,440 | $59,850 |
| Mean Household Income | 17,440 | $74,926 |
| Income Deficit | 12,665 | $10,941 |
| Wage / Income Gap (%) | 56,345 | 20.91% |
| Wage / Income Gap ($) | 56,345 | 79.09¢ per $1 |
| Gini / Inequality Index | 56,345 | 0.44 |
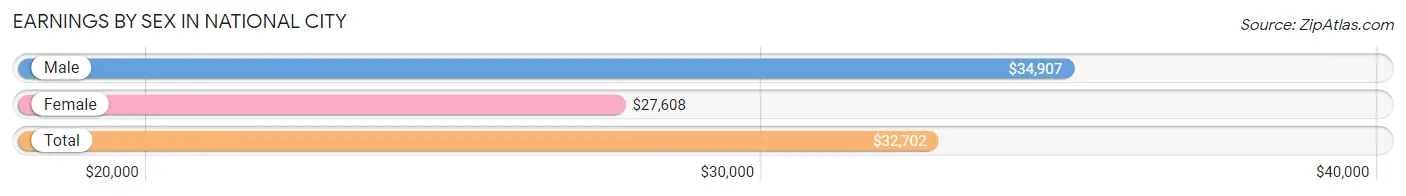
Earnings by Sex in National City
Average Earnings in National City are $32,702, $34,907 for men and $27,608 for women, a difference of 20.9%.
| Sex | Number | Average Earnings |
| Male | 15,409 (54.5%) | $34,907 |
| Female | 12,870 (45.5%) | $27,608 |
| Total | 28,279 (100.0%) | $32,702 |
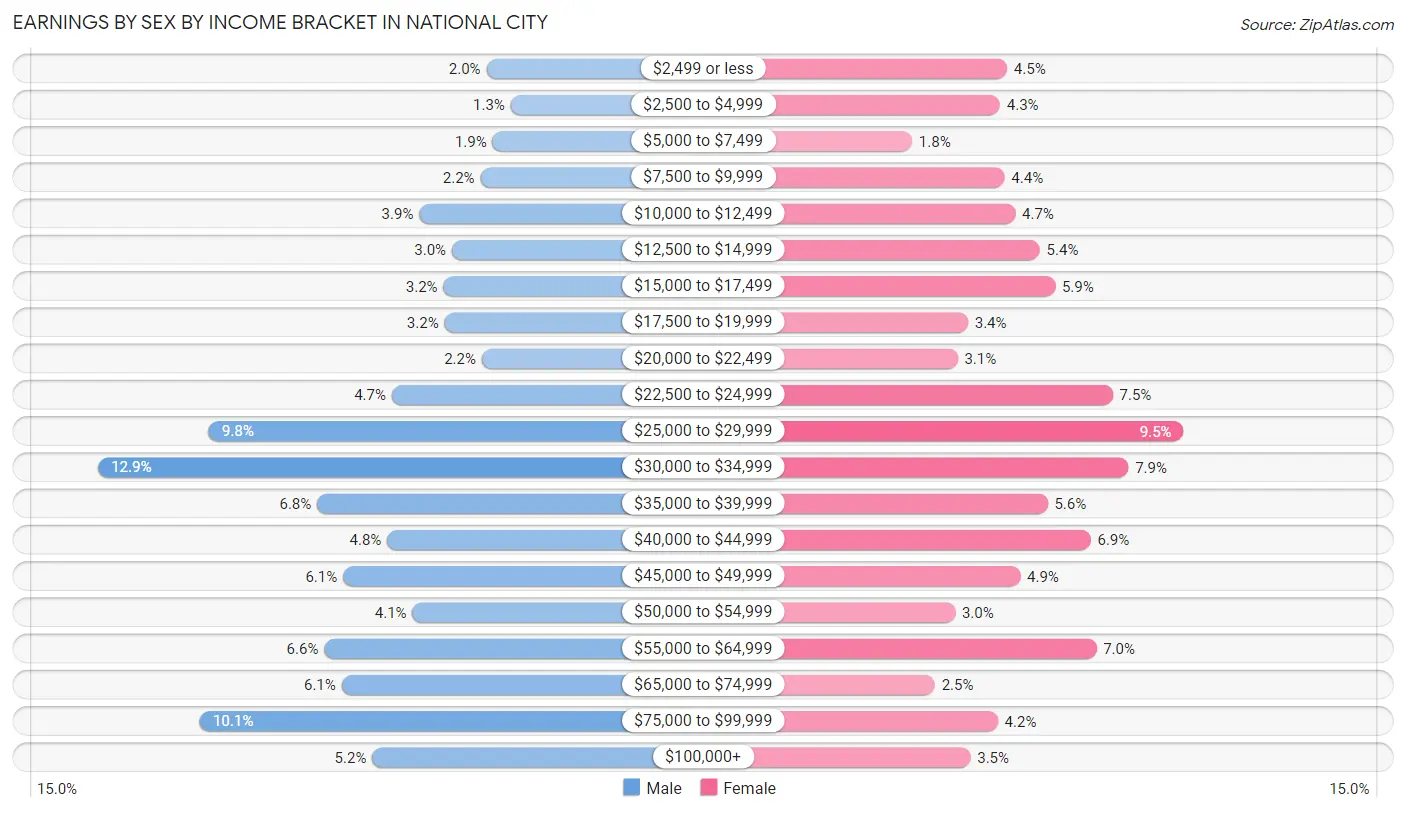
Earnings by Sex by Income Bracket in National City
The most common earnings brackets in National City are $30,000 to $34,999 for men (1,992 | 12.9%) and $25,000 to $29,999 for women (1,218 | 9.5%).
| Income | Male | Female |
| $2,499 or less | 311 (2.0%) | 579 (4.5%) |
| $2,500 to $4,999 | 207 (1.3%) | 554 (4.3%) |
| $5,000 to $7,499 | 285 (1.8%) | 235 (1.8%) |
| $7,500 to $9,999 | 338 (2.2%) | 570 (4.4%) |
| $10,000 to $12,499 | 602 (3.9%) | 609 (4.7%) |
| $12,500 to $14,999 | 460 (3.0%) | 697 (5.4%) |
| $15,000 to $17,499 | 497 (3.2%) | 753 (5.9%) |
| $17,500 to $19,999 | 493 (3.2%) | 437 (3.4%) |
| $20,000 to $22,499 | 331 (2.1%) | 400 (3.1%) |
| $22,500 to $24,999 | 721 (4.7%) | 961 (7.5%) |
| $25,000 to $29,999 | 1,513 (9.8%) | 1,218 (9.5%) |
| $30,000 to $34,999 | 1,992 (12.9%) | 1,018 (7.9%) |
| $35,000 to $39,999 | 1,044 (6.8%) | 726 (5.6%) |
| $40,000 to $44,999 | 741 (4.8%) | 882 (6.9%) |
| $45,000 to $49,999 | 933 (6.0%) | 627 (4.9%) |
| $50,000 to $54,999 | 631 (4.1%) | 391 (3.0%) |
| $55,000 to $64,999 | 1,014 (6.6%) | 902 (7.0%) |
| $65,000 to $74,999 | 939 (6.1%) | 318 (2.5%) |
| $75,000 to $99,999 | 1,551 (10.1%) | 546 (4.2%) |
| $100,000+ | 806 (5.2%) | 447 (3.5%) |
| Total | 15,409 (100.0%) | 12,870 (100.0%) |
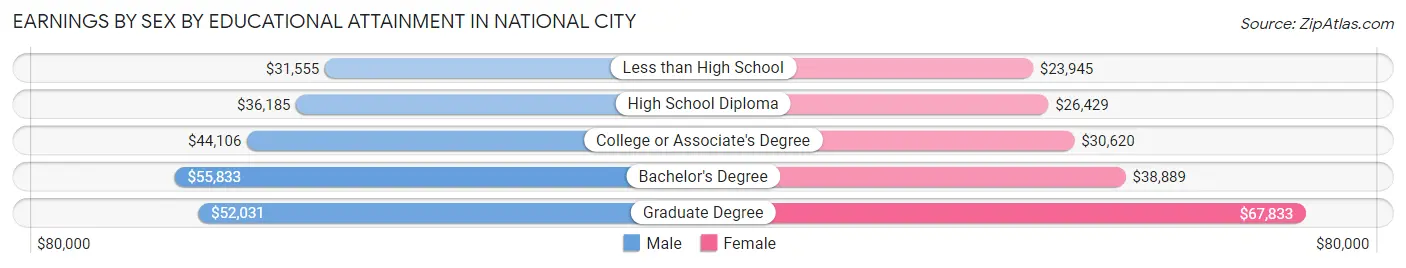
Earnings by Sex by Educational Attainment in National City
Average earnings in National City are $37,663 for men and $29,849 for women, a difference of 20.7%. Men with an educational attainment of bachelor's degree enjoy the highest average annual earnings of $55,833, while those with less than high school education earn the least with $31,555. Women with an educational attainment of graduate degree earn the most with the average annual earnings of $67,833, while those with less than high school education have the smallest earnings of $23,945.
| Educational Attainment | Male Income | Female Income |
| Less than High School | $31,555 | $23,945 |
| High School Diploma | $36,185 | $26,429 |
| College or Associate's Degree | $44,106 | $30,620 |
| Bachelor's Degree | $55,833 | $38,889 |
| Graduate Degree | $52,031 | $67,833 |
| Total | $37,663 | $29,849 |
Family Income in National City
Family Income Brackets in National City
According to the National City family income data, there are 2,951 families falling into the $50,000 to $74,999 income range, which is the most common income bracket and makes up 23.3% of all families. Conversely, the $10,000 to $14,999 income bracket is the least frequent group with only 266 families (2.1%) belonging to this category.
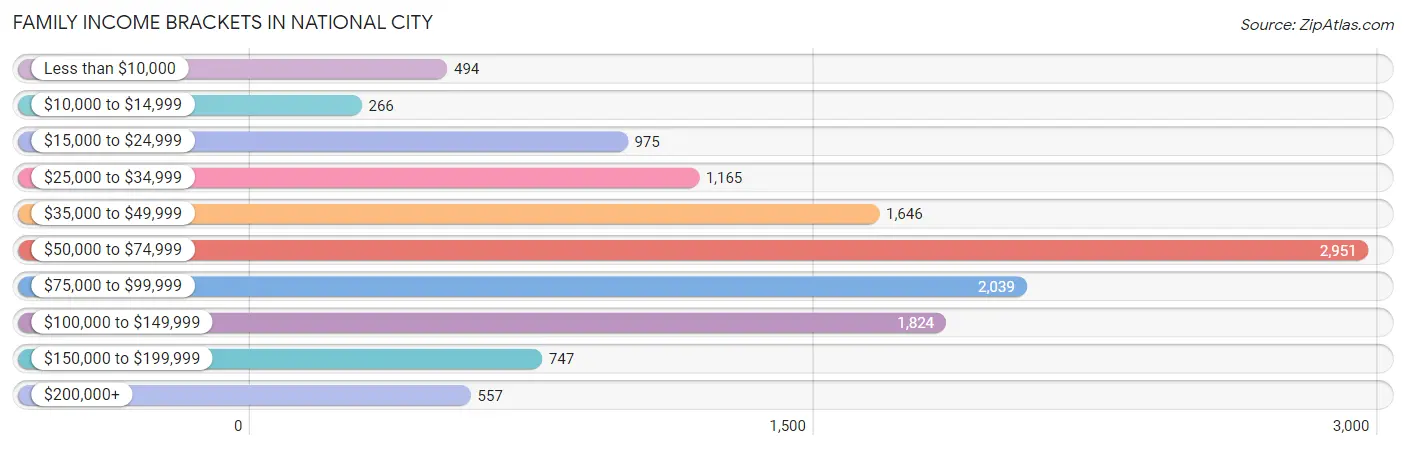
| Income Bracket | # Families | % Families |
| Less than $10,000 | 494 | 3.9% |
| $10,000 to $14,999 | 266 | 2.1% |
| $15,000 to $24,999 | 975 | 7.7% |
| $25,000 to $34,999 | 1,165 | 9.2% |
| $35,000 to $49,999 | 1,646 | 13.0% |
| $50,000 to $74,999 | 2,951 | 23.3% |
| $75,000 to $99,999 | 2,039 | 16.1% |
| $100,000 to $149,999 | 1,824 | 14.4% |
| $150,000 to $199,999 | 747 | 5.9% |
| $200,000+ | 557 | 4.4% |
Family Income by Famaliy Size in National City
7+ person families (469 | 3.7%) account for the highest median family income in National City with $137,443 per family, while 2-person families (4,134 | 32.6%) have the highest median income of $25,645 per family member.
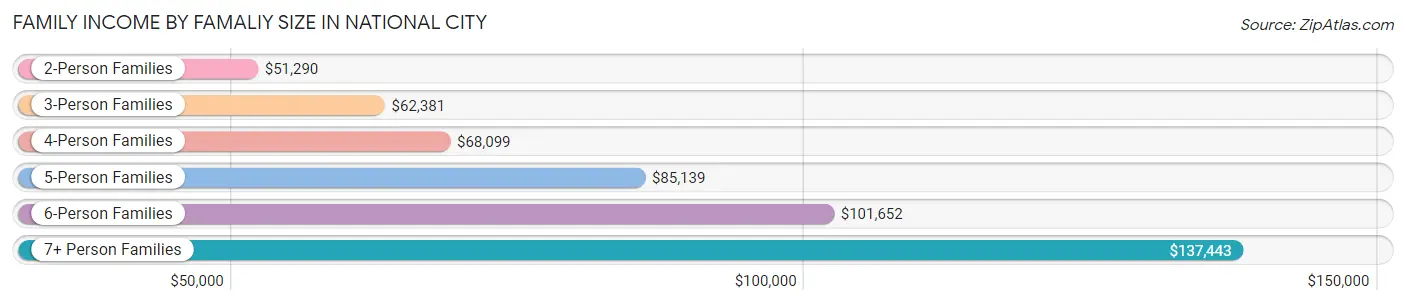
| Income Bracket | # Families | Median Income |
| 2-Person Families | 4,134 (32.6%) | $51,290 |
| 3-Person Families | 3,088 (24.4%) | $62,381 |
| 4-Person Families | 2,817 (22.2%) | $68,099 |
| 5-Person Families | 1,541 (12.2%) | $85,139 |
| 6-Person Families | 616 (4.9%) | $101,652 |
| 7+ Person Families | 469 (3.7%) | $137,443 |
| Total | 12,665 (100.0%) | $64,630 |
Family Income by Number of Earners in National City
The median family income in National City is $64,630, with families comprising 3+ earners (2,325) having the highest median family income of $101,904, while families with no earners (1,565) have the lowest median family income of $24,813, accounting for 18.4% and 12.4% of families, respectively.
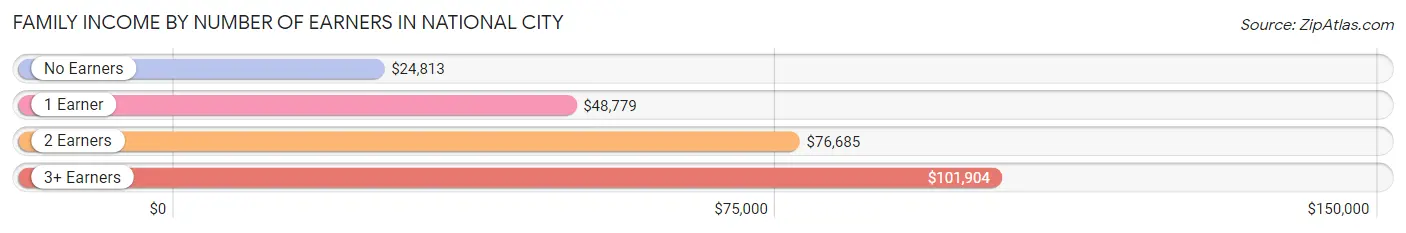
| Number of Earners | # Families | Median Income |
| No Earners | 1,565 (12.4%) | $24,813 |
| 1 Earner | 4,551 (35.9%) | $48,779 |
| 2 Earners | 4,224 (33.4%) | $76,685 |
| 3+ Earners | 2,325 (18.4%) | $101,904 |
| Total | 12,665 (100.0%) | $64,630 |
Household Income in National City
Household Income Brackets in National City
With 3,209 households falling in the category, the $50,000 to $74,999 income range is the most frequent in National City, accounting for 18.4% of all households. In contrast, only 767 households (4.4%) fall into the $200,000+ income bracket, making it the least populous group.
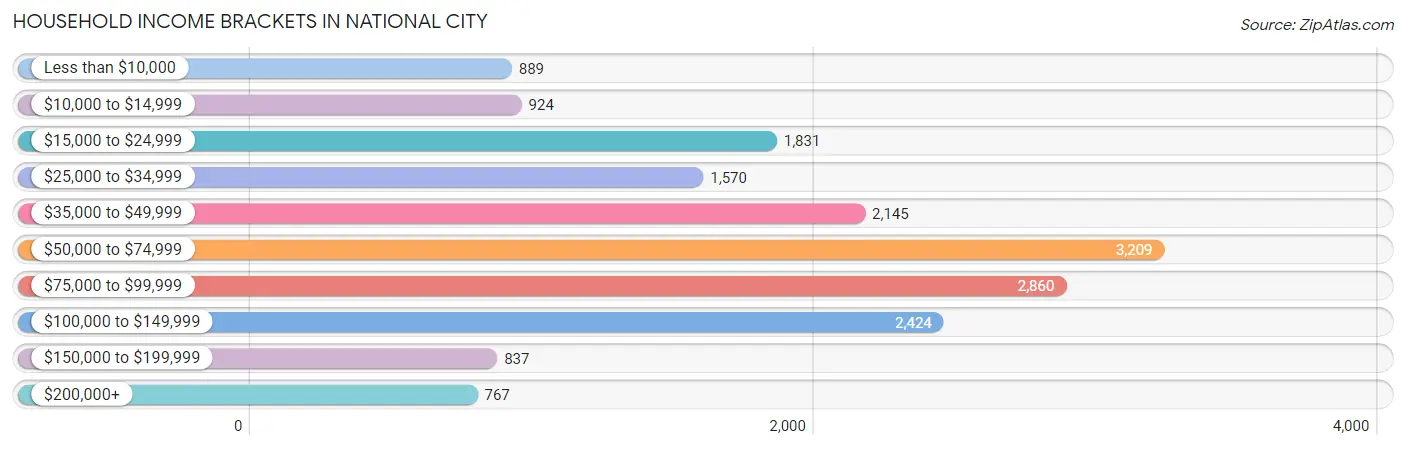
| Income Bracket | # Households | % Households |
| Less than $10,000 | 889 | 5.1% |
| $10,000 to $14,999 | 924 | 5.3% |
| $15,000 to $24,999 | 1,831 | 10.5% |
| $25,000 to $34,999 | 1,570 | 9.0% |
| $35,000 to $49,999 | 2,145 | 12.3% |
| $50,000 to $74,999 | 3,209 | 18.4% |
| $75,000 to $99,999 | 2,860 | 16.4% |
| $100,000 to $149,999 | 2,424 | 13.9% |
| $150,000 to $199,999 | 837 | 4.8% |
| $200,000+ | 767 | 4.4% |
Household Income by Householder Age in National City
The median household income in National City is $59,850, with the highest median household income of $68,700 found in the 45 to 64 years age bracket for the primary householder. A total of 6,780 households (38.9%) fall into this category. Meanwhile, the 65+ years age bracket for the primary householder has the lowest median household income of $40,217, with 4,610 households (26.4%) in this group.
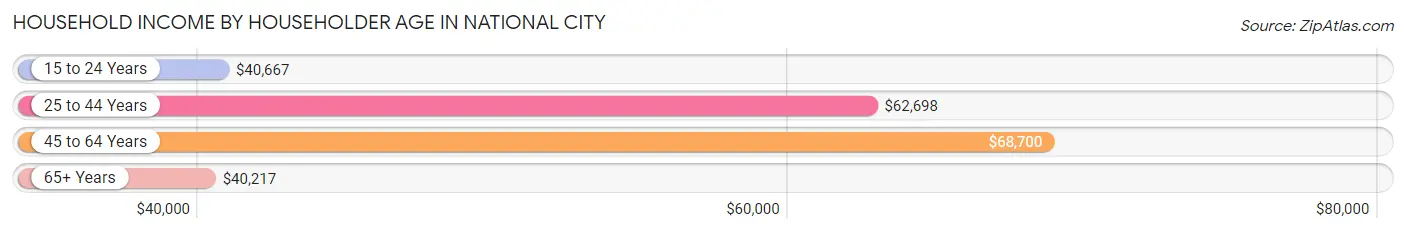
| Income Bracket | # Households | Median Income |
| 15 to 24 Years | 236 (1.3%) | $40,667 |
| 25 to 44 Years | 5,814 (33.3%) | $62,698 |
| 45 to 64 Years | 6,780 (38.9%) | $68,700 |
| 65+ Years | 4,610 (26.4%) | $40,217 |
| Total | 17,440 (100.0%) | $59,850 |
Poverty in National City
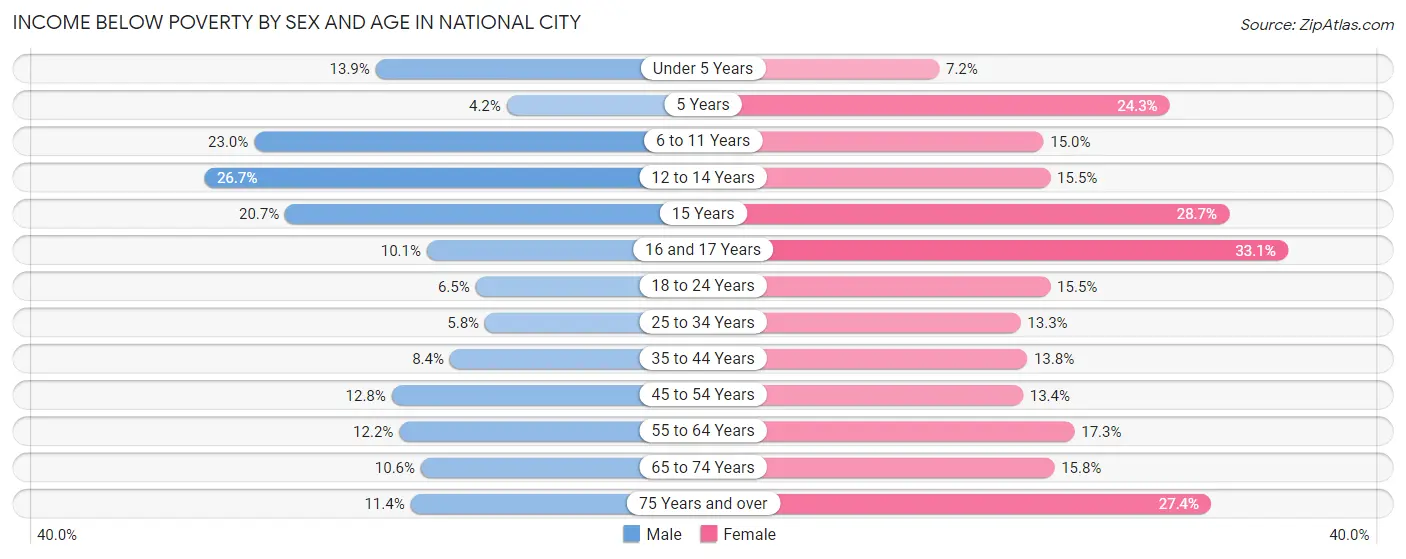
Income Below Poverty by Sex and Age in National City
With 11.7% poverty level for males and 16.3% for females among the residents of National City, 12 to 14 year old males and 16 and 17 year old females are the most vulnerable to poverty, with 354 males (26.7%) and 269 females (33.1%) in their respective age groups living below the poverty level.
| Age Bracket | Male | Female |
| Under 5 Years | 213 (13.9%) | 111 (7.2%) |
| 5 Years | 11 (4.2%) | 89 (24.3%) |
| 6 to 11 Years | 511 (23.0%) | 255 (15.0%) |
| 12 to 14 Years | 354 (26.7%) | 225 (15.5%) |
| 15 Years | 50 (20.7%) | 79 (28.7%) |
| 16 and 17 Years | 78 (10.1%) | 269 (33.1%) |
| 18 to 24 Years | 151 (6.5%) | 406 (15.5%) |
| 25 to 34 Years | 267 (5.8%) | 585 (13.3%) |
| 35 to 44 Years | 291 (8.4%) | 462 (13.8%) |
| 45 to 54 Years | 423 (12.8%) | 447 (13.4%) |
| 55 to 64 Years | 423 (12.2%) | 624 (17.3%) |
| 65 to 74 Years | 191 (10.6%) | 406 (15.8%) |
| 75 Years and over | 134 (11.4%) | 706 (27.4%) |
| Total | 3,097 (11.7%) | 4,664 (16.3%) |
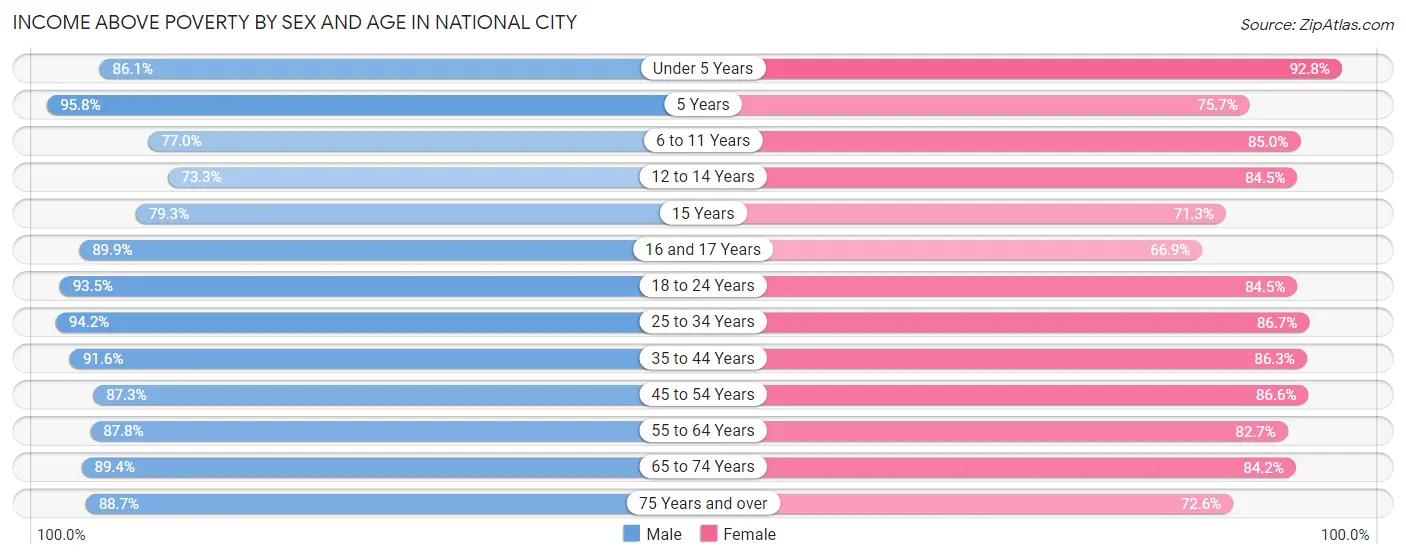
Income Above Poverty by Sex and Age in National City
According to the poverty statistics in National City, males aged 5 years and females aged under 5 years are the age groups that are most secure financially, with 95.8% of males and 92.8% of females in these age groups living above the poverty line.
| Age Bracket | Male | Female |
| Under 5 Years | 1,315 (86.1%) | 1,426 (92.8%) |
| 5 Years | 250 (95.8%) | 277 (75.7%) |
| 6 to 11 Years | 1,715 (77.0%) | 1,450 (85.0%) |
| 12 to 14 Years | 973 (73.3%) | 1,229 (84.5%) |
| 15 Years | 192 (79.3%) | 196 (71.3%) |
| 16 and 17 Years | 691 (89.9%) | 544 (66.9%) |
| 18 to 24 Years | 2,164 (93.5%) | 2,219 (84.5%) |
| 25 to 34 Years | 4,322 (94.2%) | 3,827 (86.7%) |
| 35 to 44 Years | 3,162 (91.6%) | 2,899 (86.3%) |
| 45 to 54 Years | 2,895 (87.3%) | 2,878 (86.6%) |
| 55 to 64 Years | 3,046 (87.8%) | 2,992 (82.7%) |
| 65 to 74 Years | 1,614 (89.4%) | 2,168 (84.2%) |
| 75 Years and over | 1,047 (88.6%) | 1,871 (72.6%) |
| Total | 23,386 (88.3%) | 23,976 (83.7%) |
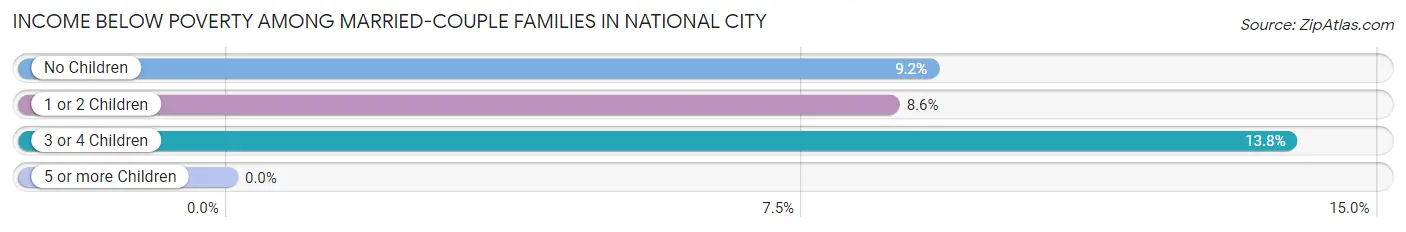
Income Below Poverty Among Married-Couple Families in National City
The poverty statistics for married-couple families in National City show that 9.4% or 716 of the total 7,630 families live below the poverty line. Families with 3 or 4 children have the highest poverty rate of 13.8%, comprising of 104 families. On the other hand, families with 5 or more children have the lowest poverty rate of 0.0%, which includes 0 families.
| Children | Above Poverty | Below Poverty |
| No Children | 3,416 (90.8%) | 344 (9.1%) |
| 1 or 2 Children | 2,835 (91.4%) | 268 (8.6%) |
| 3 or 4 Children | 648 (86.2%) | 104 (13.8%) |
| 5 or more Children | 15 (100.0%) | 0 (0.0%) |
| Total | 6,914 (90.6%) | 716 (9.4%) |
Income Below Poverty Among Single-Parent Households in National City
According to the poverty data in National City, 11.2% or 131 single-father households and 18.7% or 724 single-mother households are living below the poverty line. Among single-father households, those with 3 or 4 children have the highest poverty rate, with 32 households (39.0%) experiencing poverty. Likewise, among single-mother households, those with 3 or 4 children have the highest poverty rate, with 132 households (40.5%) falling below the poverty line.
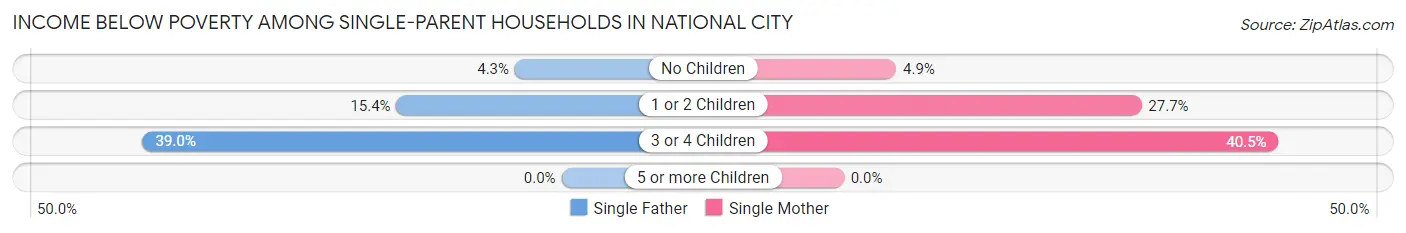
| Children | Single Father | Single Mother |
| No Children | 26 (4.3%) | 81 (4.9%) |
| 1 or 2 Children | 73 (15.4%) | 511 (27.7%) |
| 3 or 4 Children | 32 (39.0%) | 132 (40.5%) |
| 5 or more Children | 0 (0.0%) | 0 (0.0%) |
| Total | 131 (11.2%) | 724 (18.7%) |
Income Below Poverty Among Married-Couple vs Single-Parent Households in National City
The poverty data for National City shows that 716 of the married-couple family households (9.4%) and 855 of the single-parent households (17.0%) are living below the poverty level. Within the married-couple family households, those with 3 or 4 children have the highest poverty rate, with 104 households (13.8%) falling below the poverty line. Among the single-parent households, those with 3 or 4 children have the highest poverty rate, with 164 household (40.2%) living below poverty.
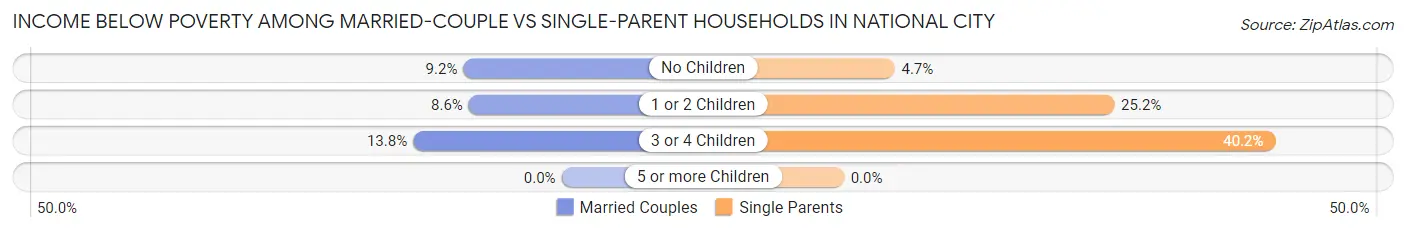
| Children | Married-Couple Families | Single-Parent Households |
| No Children | 344 (9.1%) | 107 (4.7%) |
| 1 or 2 Children | 268 (8.6%) | 584 (25.2%) |
| 3 or 4 Children | 104 (13.8%) | 164 (40.2%) |
| 5 or more Children | 0 (0.0%) | 0 (0.0%) |
| Total | 716 (9.4%) | 855 (17.0%) |
Race in National City
The most populous races in National City are Hispanic or Latino (36,575 | 64.9%), White / Caucasian (24,834 | 44.1%), and Asian (9,618 | 17.1%).
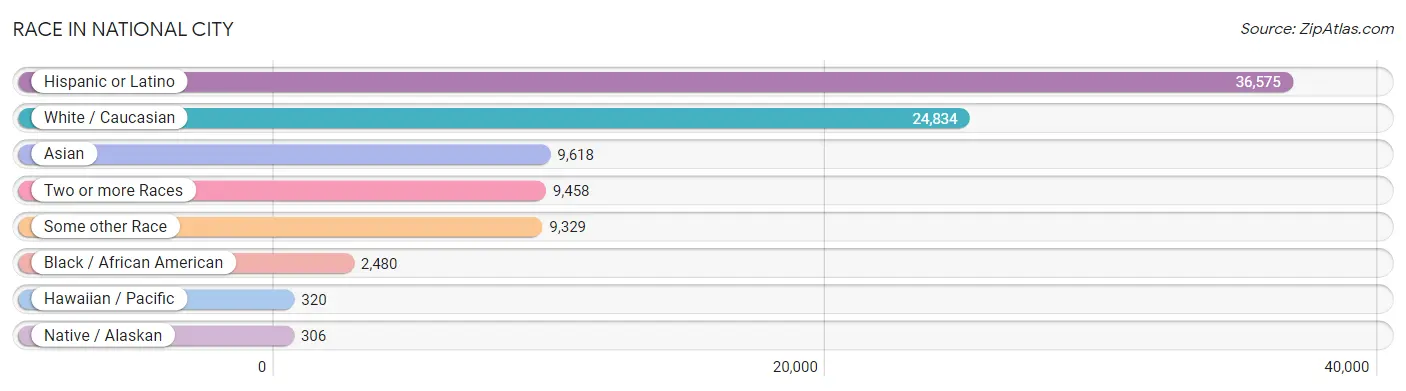
| Race | # Population | % Population |
| Asian | 9,618 | 17.1% |
| Black / African American | 2,480 | 4.4% |
| Hawaiian / Pacific | 320 | 0.6% |
| Hispanic or Latino | 36,575 | 64.9% |
| Native / Alaskan | 306 | 0.5% |
| White / Caucasian | 24,834 | 44.1% |
| Two or more Races | 9,458 | 16.8% |
| Some other Race | 9,329 | 16.6% |
| Total | 56,345 | 100.0% |
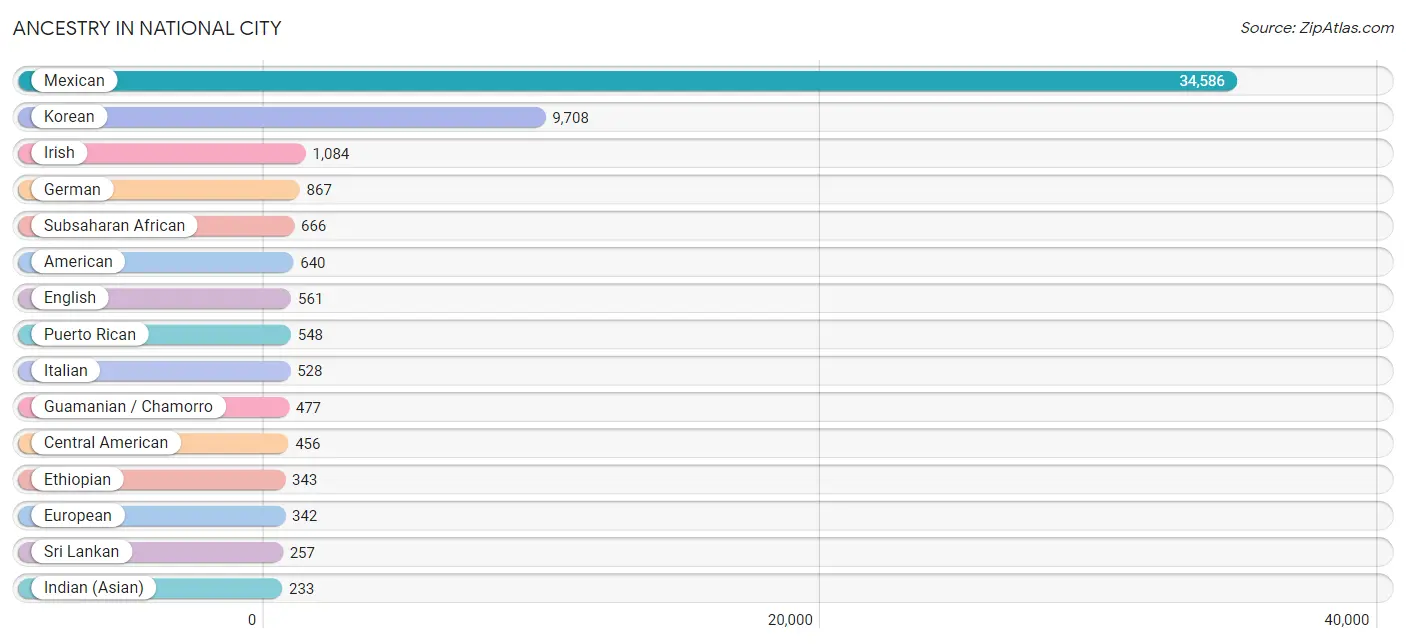
Ancestry in National City
The most populous ancestries reported in National City are Mexican (34,586 | 61.4%), Korean (9,708 | 17.2%), Irish (1,084 | 1.9%), German (867 | 1.5%), and Subsaharan African (666 | 1.2%), together accounting for 83.3% of all National City residents.
| Ancestry | # Population | % Population |
| African | 229 | 0.4% |
| American | 640 | 1.1% |
| Apache | 28 | 0.1% |
| Arab | 66 | 0.1% |
| Assyrian / Chaldean / Syriac | 3 | 0.0% |
| Austrian | 22 | 0.0% |
| Bahamian | 3 | 0.0% |
| Belgian | 5 | 0.0% |
| Bhutanese | 223 | 0.4% |
| Blackfeet | 16 | 0.0% |
| Bolivian | 11 | 0.0% |
| British | 58 | 0.1% |
| Bulgarian | 2 | 0.0% |
| Burmese | 76 | 0.1% |
| Canadian | 16 | 0.0% |
| Central American | 456 | 0.8% |
| Central American Indian | 159 | 0.3% |
| Cherokee | 28 | 0.1% |
| Chickasaw | 16 | 0.0% |
| Chilean | 6 | 0.0% |
| Choctaw | 3 | 0.0% |
| Colombian | 65 | 0.1% |
| Costa Rican | 14 | 0.0% |
| Cuban | 95 | 0.2% |
| Czech | 11 | 0.0% |
| Danish | 19 | 0.0% |
| Dominican | 27 | 0.1% |
| Dutch | 66 | 0.1% |
| Eastern European | 4 | 0.0% |
| Ecuadorian | 79 | 0.1% |
| English | 561 | 1.0% |
| Ethiopian | 343 | 0.6% |
| European | 342 | 0.6% |
| Finnish | 21 | 0.0% |
| French | 106 | 0.2% |
| French Canadian | 49 | 0.1% |
| German | 867 | 1.5% |
| Greek | 14 | 0.0% |
| Guamanian / Chamorro | 477 | 0.9% |
| Guatemalan | 102 | 0.2% |
| Haitian | 2 | 0.0% |
| Honduran | 115 | 0.2% |
| Hungarian | 22 | 0.0% |
| Indian (Asian) | 233 | 0.4% |
| Iranian | 44 | 0.1% |
| Iraqi | 53 | 0.1% |
| Irish | 1,084 | 1.9% |
| Italian | 528 | 0.9% |
| Jamaican | 168 | 0.3% |
| Japanese | 28 | 0.1% |
| Kenyan | 32 | 0.1% |
| Korean | 9,708 | 17.2% |
| Lithuanian | 15 | 0.0% |
| Lumbee | 37 | 0.1% |
| Macedonian | 2 | 0.0% |
| Malaysian | 93 | 0.2% |
| Mexican | 34,586 | 61.4% |
| Mexican American Indian | 116 | 0.2% |
| Native Hawaiian | 10 | 0.0% |
| Navajo | 9 | 0.0% |
| Nicaraguan | 24 | 0.0% |
| Northern European | 68 | 0.1% |
| Norwegian | 115 | 0.2% |
| Pakistani | 50 | 0.1% |
| Pennsylvania German | 4 | 0.0% |
| Peruvian | 25 | 0.0% |
| Pima | 3 | 0.0% |
| Polish | 102 | 0.2% |
| Portuguese | 20 | 0.0% |
| Puerto Rican | 548 | 1.0% |
| Russian | 90 | 0.2% |
| Salvadoran | 201 | 0.4% |
| Samoan | 60 | 0.1% |
| Scandinavian | 35 | 0.1% |
| Scotch-Irish | 53 | 0.1% |
| Scottish | 131 | 0.2% |
| Somali | 84 | 0.2% |
| South American | 186 | 0.3% |
| Spaniard | 94 | 0.2% |
| Spanish | 47 | 0.1% |
| Sri Lankan | 257 | 0.5% |
| Subsaharan African | 666 | 1.2% |
| Swedish | 124 | 0.2% |
| Swiss | 4 | 0.0% |
| Thai | 46 | 0.1% |
| Trinidadian and Tobagonian | 10 | 0.0% |
| Turkish | 38 | 0.1% |
| Ugandan | 10 | 0.0% |
| Ukrainian | 62 | 0.1% |
| Welsh | 14 | 0.0% |
| Yaqui | 47 | 0.1% | View All 91 Rows |
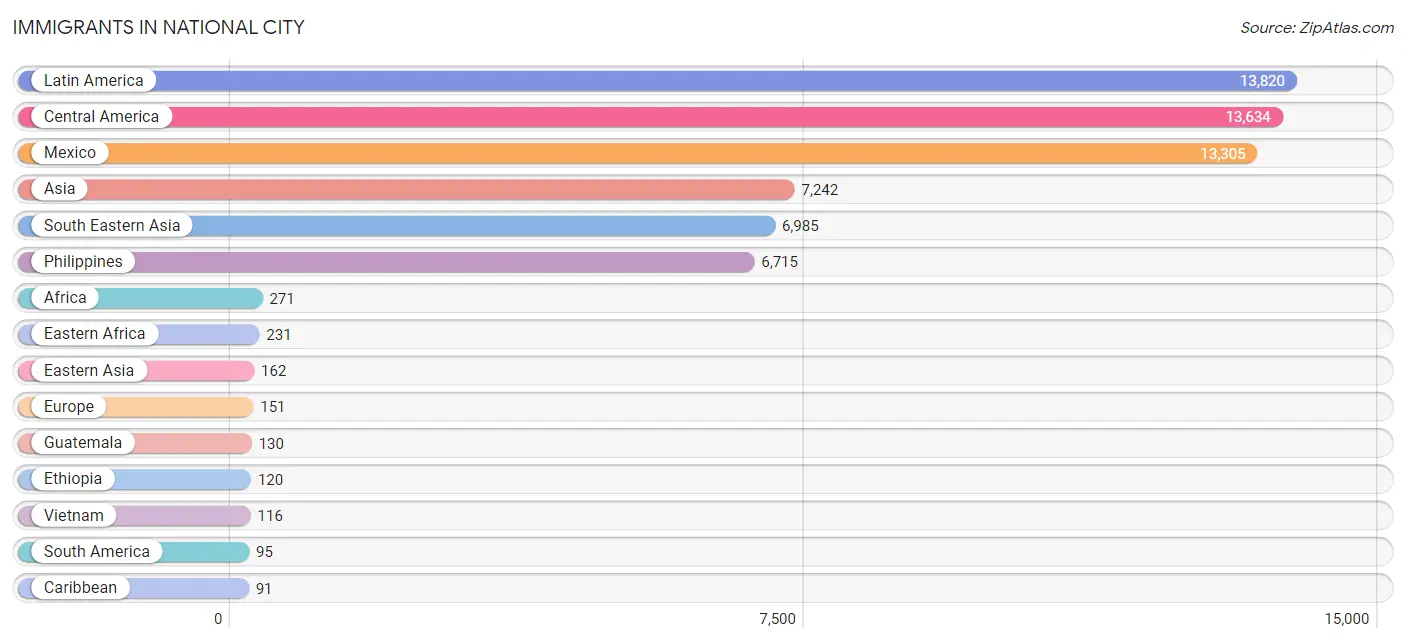
Immigrants in National City
The most numerous immigrant groups reported in National City came from Latin America (13,820 | 24.5%), Central America (13,634 | 24.2%), Mexico (13,305 | 23.6%), Asia (7,242 | 12.9%), and South Eastern Asia (6,985 | 12.4%), together accounting for 97.6% of all National City residents.
| Immigration Origin | # Population | % Population |
| Africa | 271 | 0.5% |
| Asia | 7,242 | 12.9% |
| Bahamas | 12 | 0.0% |
| Belize | 8 | 0.0% |
| Bolivia | 11 | 0.0% |
| Bulgaria | 2 | 0.0% |
| Cambodia | 3 | 0.0% |
| Canada | 49 | 0.1% |
| Caribbean | 91 | 0.2% |
| Central America | 13,634 | 24.2% |
| Chile | 6 | 0.0% |
| China | 47 | 0.1% |
| Colombia | 30 | 0.1% |
| Costa Rica | 14 | 0.0% |
| Cuba | 16 | 0.0% |
| Eastern Africa | 231 | 0.4% |
| Eastern Asia | 162 | 0.3% |
| Eastern Europe | 5 | 0.0% |
| Ecuador | 38 | 0.1% |
| Egypt | 7 | 0.0% |
| El Salvador | 85 | 0.2% |
| Ethiopia | 120 | 0.2% |
| Europe | 151 | 0.3% |
| France | 19 | 0.0% |
| Germany | 52 | 0.1% |
| Ghana | 33 | 0.1% |
| Guatemala | 130 | 0.2% |
| Haiti | 2 | 0.0% |
| Honduras | 68 | 0.1% |
| Hungary | 3 | 0.0% |
| India | 10 | 0.0% |
| Indonesia | 7 | 0.0% |
| Iran | 13 | 0.0% |
| Iraq | 58 | 0.1% |
| Italy | 18 | 0.0% |
| Jamaica | 51 | 0.1% |
| Japan | 90 | 0.2% |
| Kazakhstan | 7 | 0.0% |
| Kenya | 44 | 0.1% |
| Korea | 25 | 0.0% |
| Laos | 68 | 0.1% |
| Latin America | 13,820 | 24.5% |
| Mexico | 13,305 | 23.6% |
| Nicaragua | 24 | 0.0% |
| Northern Africa | 7 | 0.0% |
| Northern Europe | 54 | 0.1% |
| Oceania | 35 | 0.1% |
| Peru | 10 | 0.0% |
| Philippines | 6,715 | 11.9% |
| Singapore | 42 | 0.1% |
| Somalia | 55 | 0.1% |
| South America | 95 | 0.2% |
| South Central Asia | 30 | 0.1% |
| South Eastern Asia | 6,985 | 12.4% |
| Southern Europe | 21 | 0.0% |
| Taiwan | 14 | 0.0% |
| Thailand | 34 | 0.1% |
| Trinidad and Tobago | 10 | 0.0% |
| Turkey | 7 | 0.0% |
| Uganda | 10 | 0.0% |
| Vietnam | 116 | 0.2% |
| Western Africa | 33 | 0.1% |
| Western Asia | 65 | 0.1% |
| Western Europe | 71 | 0.1% | View All 64 Rows |
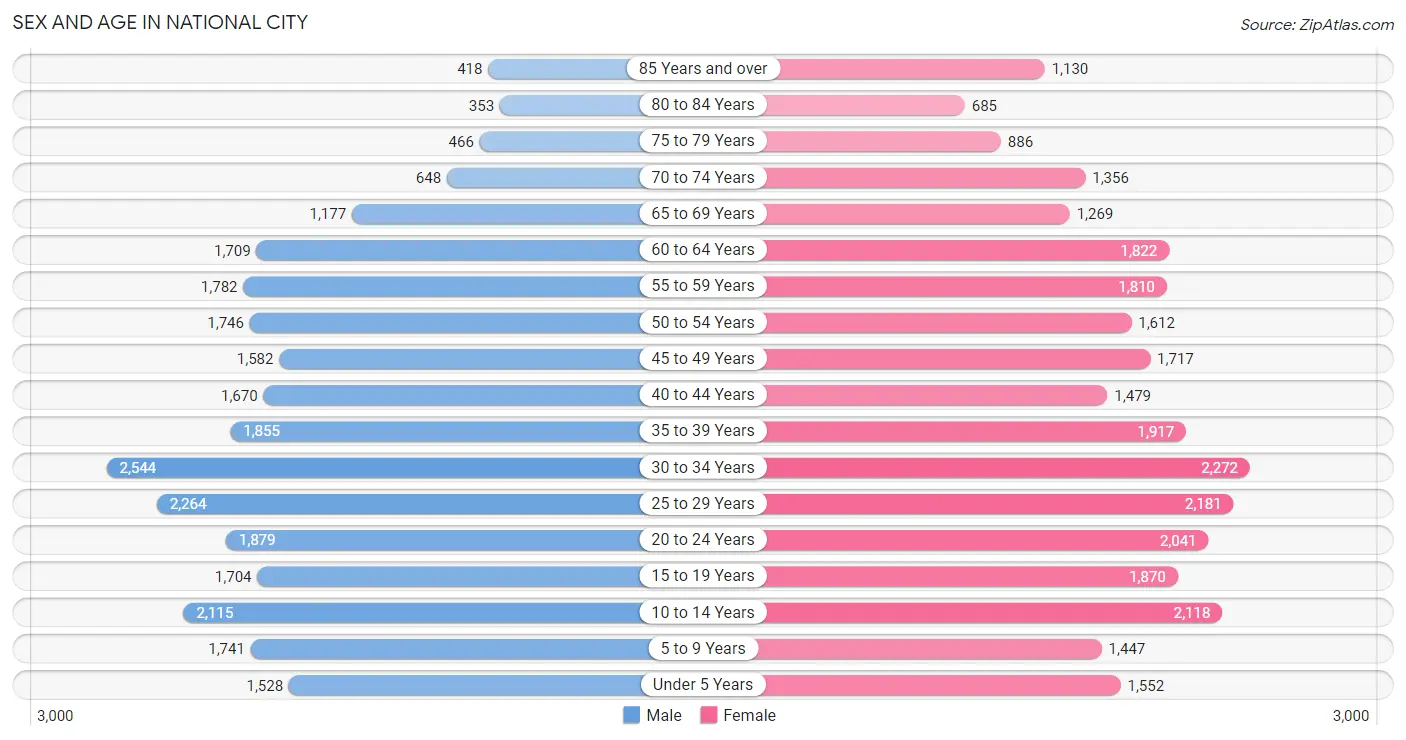
Sex and Age in National City
Sex and Age in National City
The most populous age groups in National City are 30 to 34 Years (2,544 | 9.4%) for men and 30 to 34 Years (2,272 | 7.8%) for women.
| Age Bracket | Male | Female |
| Under 5 Years | 1,528 (5.6%) | 1,552 (5.3%) |
| 5 to 9 Years | 1,741 (6.4%) | 1,447 (5.0%) |
| 10 to 14 Years | 2,115 (7.8%) | 2,118 (7.3%) |
| 15 to 19 Years | 1,704 (6.3%) | 1,870 (6.4%) |
| 20 to 24 Years | 1,879 (6.9%) | 2,041 (7.0%) |
| 25 to 29 Years | 2,264 (8.3%) | 2,181 (7.5%) |
| 30 to 34 Years | 2,544 (9.4%) | 2,272 (7.8%) |
| 35 to 39 Years | 1,855 (6.8%) | 1,917 (6.6%) |
| 40 to 44 Years | 1,670 (6.1%) | 1,479 (5.1%) |
| 45 to 49 Years | 1,582 (5.8%) | 1,717 (5.9%) |
| 50 to 54 Years | 1,746 (6.4%) | 1,612 (5.5%) |
| 55 to 59 Years | 1,782 (6.6%) | 1,810 (6.2%) |
| 60 to 64 Years | 1,709 (6.3%) | 1,822 (6.2%) |
| 65 to 69 Years | 1,177 (4.3%) | 1,269 (4.3%) |
| 70 to 74 Years | 648 (2.4%) | 1,356 (4.6%) |
| 75 to 79 Years | 466 (1.7%) | 886 (3.0%) |
| 80 to 84 Years | 353 (1.3%) | 685 (2.4%) |
| 85 Years and over | 418 (1.5%) | 1,130 (3.9%) |
| Total | 27,181 (100.0%) | 29,164 (100.0%) |
Families and Households in National City
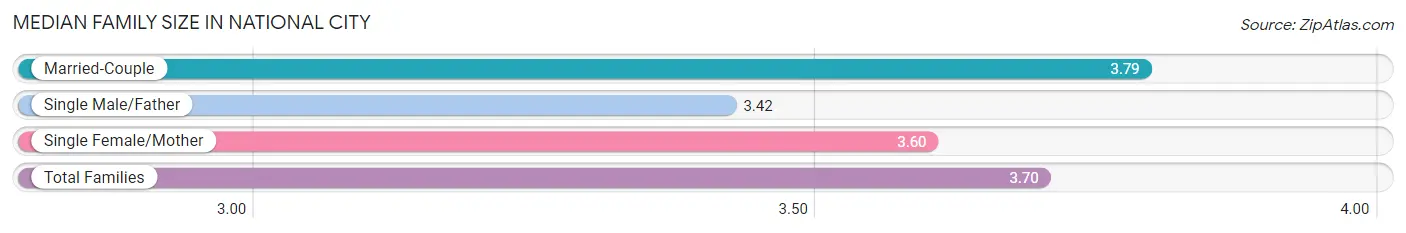
Median Family Size in National City
The median family size in National City is 3.70 persons per family, with married-couple families (7,630 | 60.2%) accounting for the largest median family size of 3.79 persons per family. On the other hand, single male/father families (1,166 | 9.2%) represent the smallest median family size with 3.42 persons per family.
| Family Type | # Families | Family Size |
| Married-Couple | 7,630 (60.2%) | 3.79 |
| Single Male/Father | 1,166 (9.2%) | 3.42 |
| Single Female/Mother | 3,869 (30.5%) | 3.60 |
| Total Families | 12,665 (100.0%) | 3.70 |
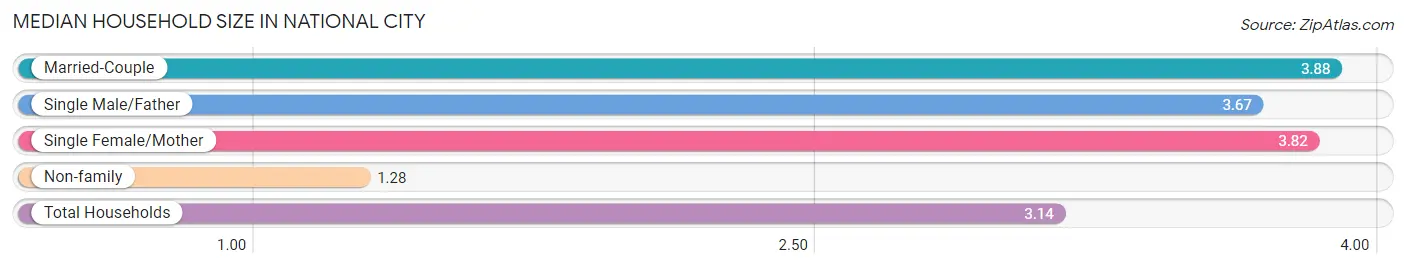
Median Household Size in National City
The median household size in National City is 3.14 persons per household, with married-couple households (7,630 | 43.8%) accounting for the largest median household size of 3.88 persons per household. non-family households (4,775 | 27.4%) represent the smallest median household size with 1.28 persons per household.
| Household Type | # Households | Household Size |
| Married-Couple | 7,630 (43.8%) | 3.88 |
| Single Male/Father | 1,166 (6.7%) | 3.67 |
| Single Female/Mother | 3,869 (22.2%) | 3.82 |
| Non-family | 4,775 (27.4%) | 1.28 |
| Total Households | 17,440 (100.0%) | 3.14 |
Household Size by Marriage Status in National City
Out of a total of 17,440 households in National City, 12,665 (72.6%) are family households, while 4,775 (27.4%) are nonfamily households. The most numerous type of family households are 2-person households, comprising 3,894, and the most common type of nonfamily households are 1-person households, comprising 3,921.
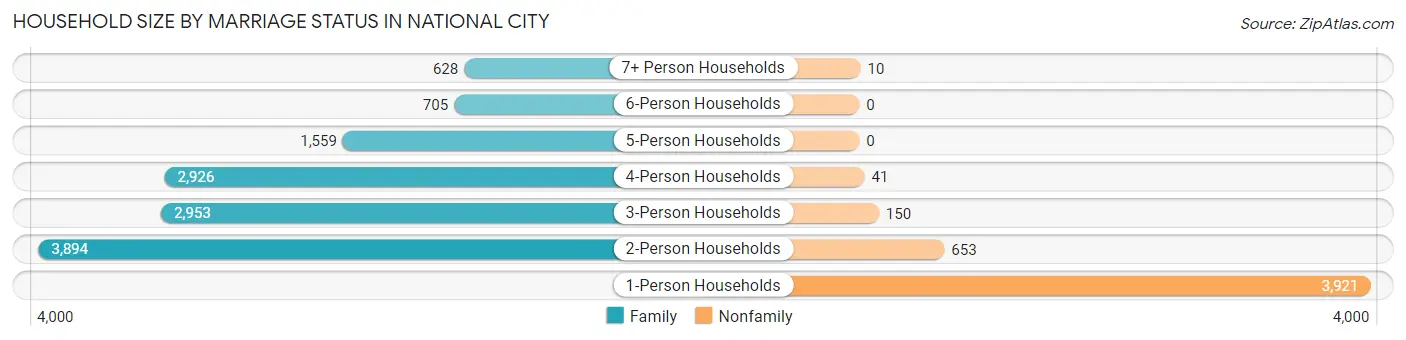
| Household Size | Family Households | Nonfamily Households |
| 1-Person Households | - | 3,921 (22.5%) |
| 2-Person Households | 3,894 (22.3%) | 653 (3.7%) |
| 3-Person Households | 2,953 (16.9%) | 150 (0.9%) |
| 4-Person Households | 2,926 (16.8%) | 41 (0.2%) |
| 5-Person Households | 1,559 (8.9%) | 0 (0.0%) |
| 6-Person Households | 705 (4.0%) | 0 (0.0%) |
| 7+ Person Households | 628 (3.6%) | 10 (0.1%) |
| Total | 12,665 (72.6%) | 4,775 (27.4%) |
Female Fertility in National City
Fertility by Age in National City
Average fertility rate in National City is 43.0 births per 1,000 women. Women in the age bracket of 20 to 34 years have the highest fertility rate with 74.0 births per 1,000 women. Women in the age bracket of 20 to 34 years acount for 79.4% of all women with births.
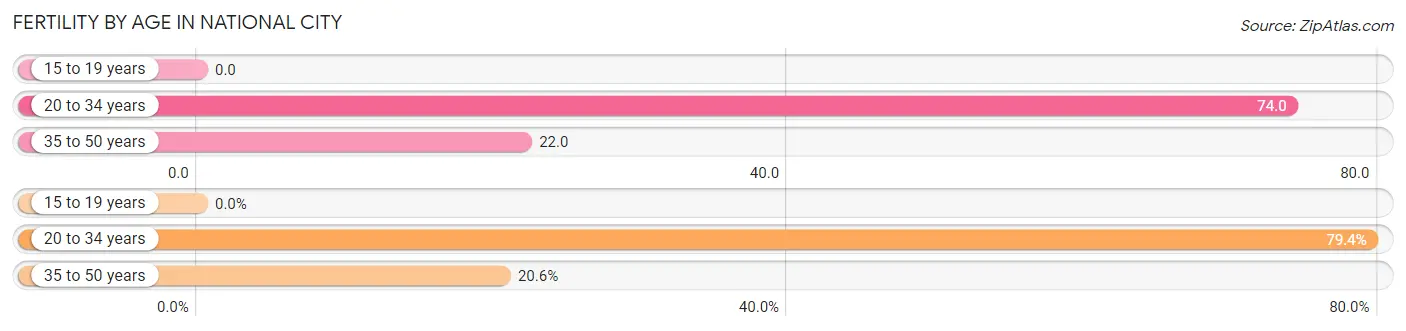
| Age Bracket | Women with Births | Births / 1,000 Women |
| 15 to 19 years | 0 (0.0%) | 0.0 |
| 20 to 34 years | 479 (79.4%) | 74.0 |
| 35 to 50 years | 124 (20.6%) | 22.0 |
| Total | 603 (100.0%) | 43.0 |
Fertility by Age by Marriage Status in National City
45.9% of women with births (603) in National City are married. The highest percentage of unmarried women with births falls into 20 to 34 years age bracket with 59.7% of them unmarried at the time of birth, while the lowest percentage of unmarried women with births belong to 35 to 50 years age bracket with 32.3% of them unmarried.
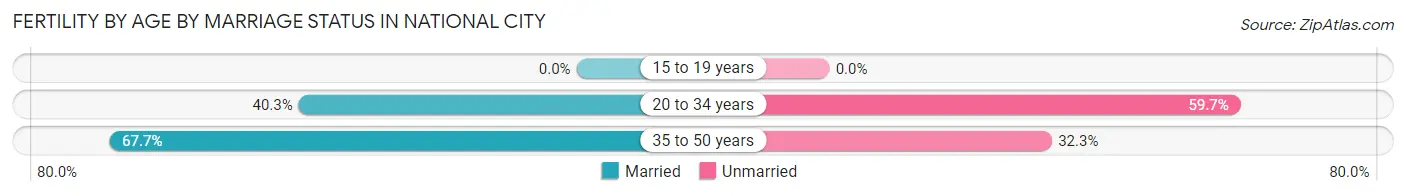
| Age Bracket | Married | Unmarried |
| 15 to 19 years | 0 (0.0%) | 0 (0.0%) |
| 20 to 34 years | 193 (40.3%) | 286 (59.7%) |
| 35 to 50 years | 84 (67.7%) | 40 (32.3%) |
| Total | 277 (45.9%) | 326 (54.1%) |
Fertility by Education in National City
Average fertility rate in National City is 43.0 births per 1,000 women. Women with the education attainment of college or associate's degree have the highest fertility rate of 58.0 births per 1,000 women, while women with the education attainment of less than high school have the lowest fertility at 17.0 births per 1,000 women. Women with the education attainment of college or associate's degree represent 47.4% of all women with births.
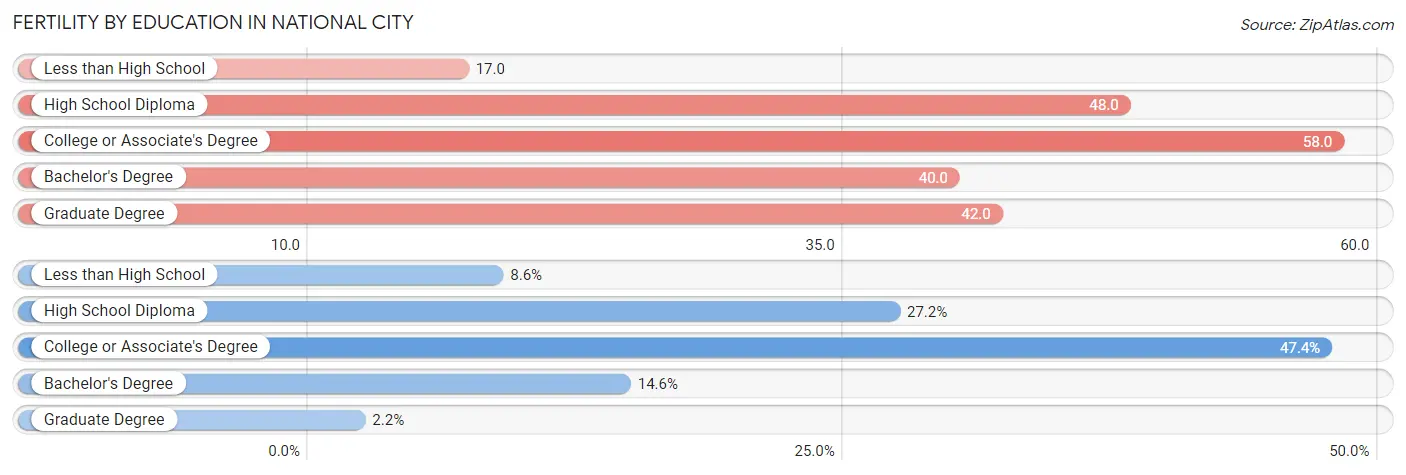
| Educational Attainment | Women with Births | Births / 1,000 Women |
| Less than High School | 52 (8.6%) | 17.0 |
| High School Diploma | 164 (27.2%) | 48.0 |
| College or Associate's Degree | 286 (47.4%) | 58.0 |
| Bachelor's Degree | 88 (14.6%) | 40.0 |
| Graduate Degree | 13 (2.2%) | 42.0 |
| Total | 603 (100.0%) | 43.0 |
Fertility by Education by Marriage Status in National City
54.1% of women with births in National City are unmarried. Women with the educational attainment of graduate degree are most likely to be married with 100.0% of them married at childbirth, while women with the educational attainment of college or associate's degree are least likely to be married with 60.8% of them unmarried at childbirth.
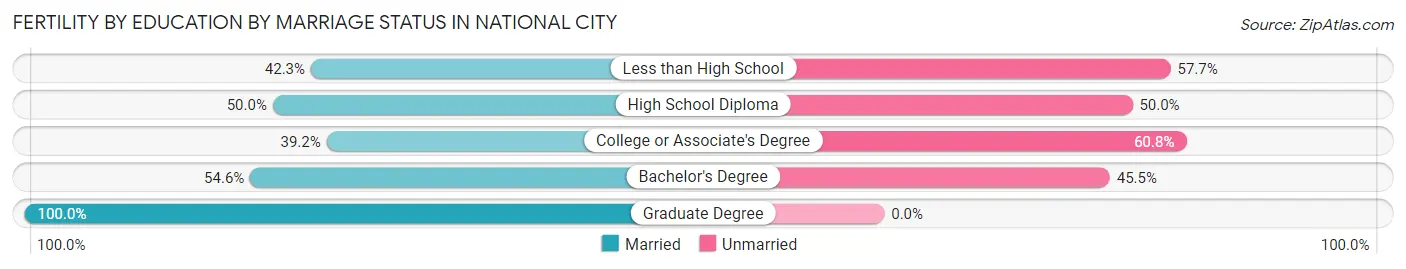
| Educational Attainment | Married | Unmarried |
| Less than High School | 22 (42.3%) | 30 (57.7%) |
| High School Diploma | 82 (50.0%) | 82 (50.0%) |
| College or Associate's Degree | 112 (39.2%) | 174 (60.8%) |
| Bachelor's Degree | 48 (54.5%) | 40 (45.5%) |
| Graduate Degree | 13 (100.0%) | 0 (0.0%) |
| Total | 277 (45.9%) | 326 (54.1%) |
Employment Characteristics in National City
Employment by Class of Employer in National City
Among the 26,081 employed individuals in National City, private company employees (17,824 | 68.3%), federal government employees (2,166 | 8.3%), and local government employees (1,699 | 6.5%) make up the most common classes of employment.
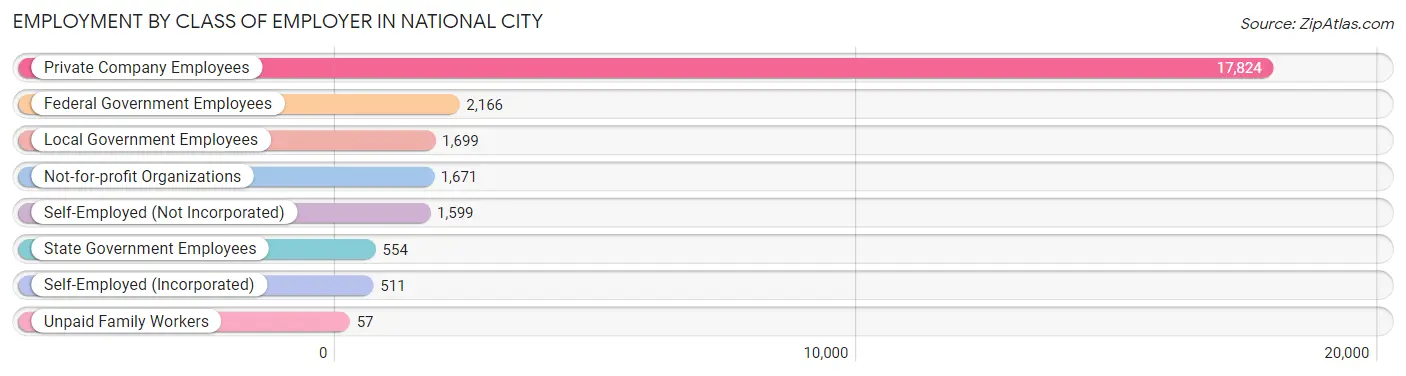
| Employer Class | # Employees | % Employees |
| Private Company Employees | 17,824 | 68.3% |
| Self-Employed (Incorporated) | 511 | 2.0% |
| Self-Employed (Not Incorporated) | 1,599 | 6.1% |
| Not-for-profit Organizations | 1,671 | 6.4% |
| Local Government Employees | 1,699 | 6.5% |
| State Government Employees | 554 | 2.1% |
| Federal Government Employees | 2,166 | 8.3% |
| Unpaid Family Workers | 57 | 0.2% |
| Total | 26,081 | 100.0% |
Employment Status by Age in National City
According to the labor force statistics for National City, out of the total population over 16 years of age (45,327), 63.7% or 28,873 individuals are in the labor force, with 8.4% or 2,425 of them unemployed. The age group with the highest labor force participation rate is 25 to 29 years, with 86.8% or 3,858 individuals in the labor force. Within the labor force, the 16 to 19 years age range has the highest percentage of unemployed individuals, with 25.1% or 226 of them being unemployed.
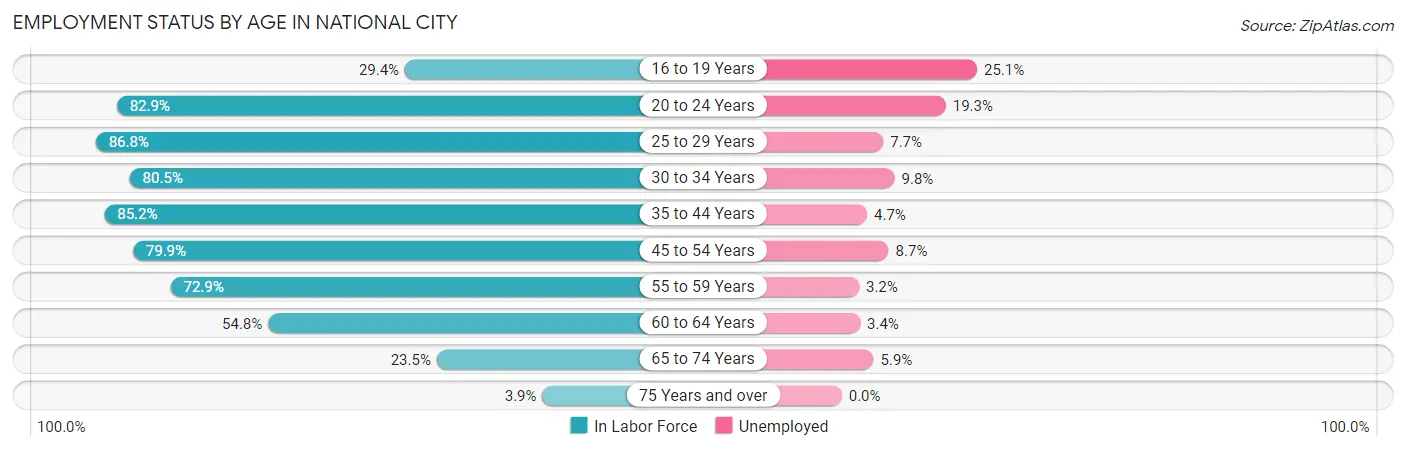
| Age Bracket | In Labor Force | Unemployed |
| 16 to 19 Years | 899 (29.4%) | 226 (25.1%) |
| 20 to 24 Years | 3,250 (82.9%) | 627 (19.3%) |
| 25 to 29 Years | 3,858 (86.8%) | 297 (7.7%) |
| 30 to 34 Years | 3,877 (80.5%) | 380 (9.8%) |
| 35 to 44 Years | 5,897 (85.2%) | 277 (4.7%) |
| 45 to 54 Years | 5,319 (79.9%) | 463 (8.7%) |
| 55 to 59 Years | 2,619 (72.9%) | 84 (3.2%) |
| 60 to 64 Years | 1,935 (54.8%) | 66 (3.4%) |
| 65 to 74 Years | 1,046 (23.5%) | 62 (5.9%) |
| 75 Years and over | 154 (3.9%) | 0 (0.0%) |
| Total | 28,873 (63.7%) | 2,425 (8.4%) |
Employment Status by Educational Attainment in National City
According to labor force statistics for National City, 78.4% of individuals (23,490) out of the total population between 25 and 64 years of age (29,962) are in the labor force, with 6.6% or 1,550 of them being unemployed. The group with the highest labor force participation rate are those with the educational attainment of college / associate degree, with 84.3% or 8,167 individuals in the labor force. Within the labor force, individuals with less than high school education have the highest percentage of unemployment, with 10.6% or 503 of them being unemployed.
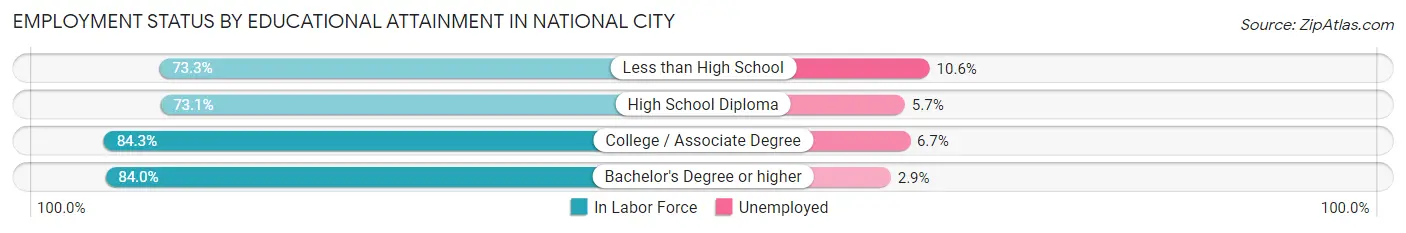
| Educational Attainment | In Labor Force | Unemployed |
| Less than High School | 4,747 (73.3%) | 686 (10.6%) |
| High School Diploma | 6,675 (73.1%) | 521 (5.7%) |
| College / Associate Degree | 8,167 (84.3%) | 649 (6.7%) |
| Bachelor's Degree or higher | 3,919 (84.0%) | 135 (2.9%) |
| Total | 23,490 (78.4%) | 1,977 (6.6%) |
Employment Occupations by Sex in National City
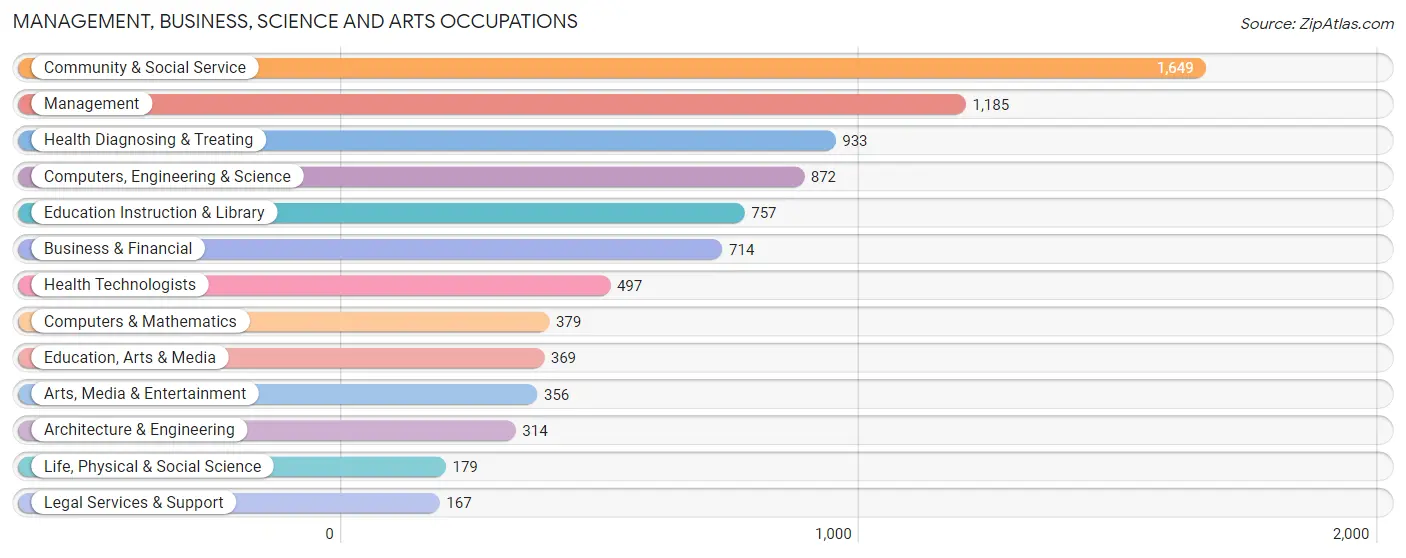
Management, Business, Science and Arts Occupations
The most common Management, Business, Science and Arts occupations in National City are Community & Social Service (1,649 | 6.5%), Management (1,185 | 4.7%), Health Diagnosing & Treating (933 | 3.7%), Computers, Engineering & Science (872 | 3.5%), and Education Instruction & Library (757 | 3.0%).
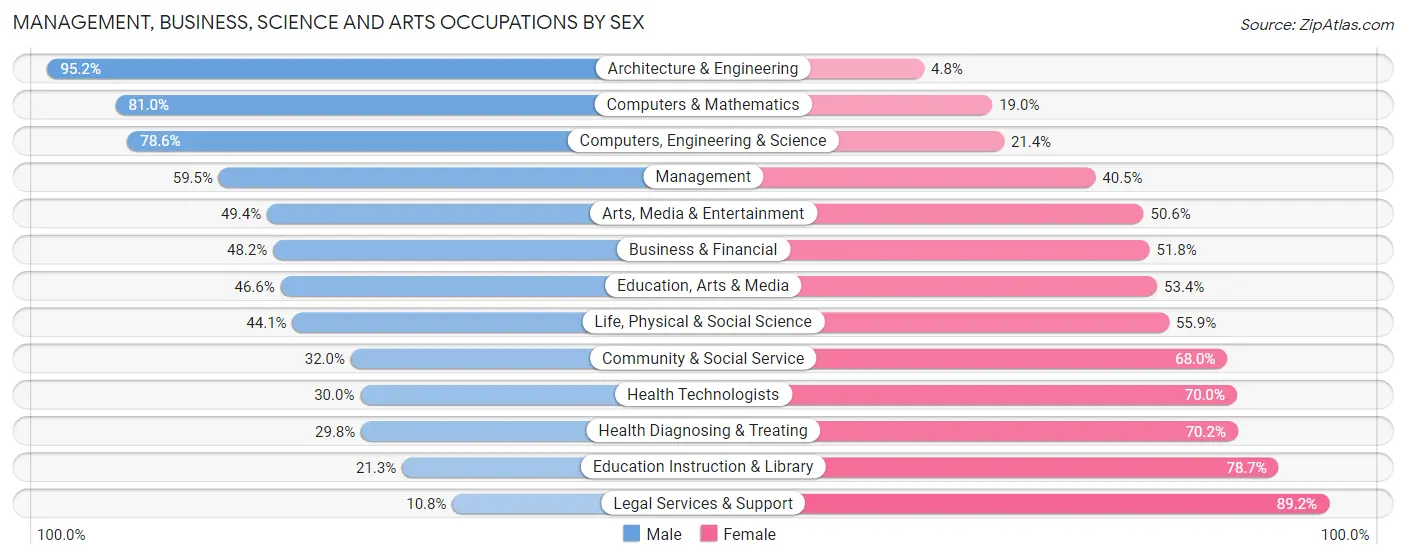
Management, Business, Science and Arts Occupations by Sex
Within the Management, Business, Science and Arts occupations in National City, the most male-oriented occupations are Architecture & Engineering (95.2%), Computers & Mathematics (81.0%), and Computers, Engineering & Science (78.6%), while the most female-oriented occupations are Legal Services & Support (89.2%), Education Instruction & Library (78.7%), and Health Diagnosing & Treating (70.2%).
| Occupation | Male | Female |
| Management | 705 (59.5%) | 480 (40.5%) |
| Business & Financial | 344 (48.2%) | 370 (51.8%) |
| Computers, Engineering & Science | 685 (78.6%) | 187 (21.4%) |
| Computers & Mathematics | 307 (81.0%) | 72 (19.0%) |
| Architecture & Engineering | 299 (95.2%) | 15 (4.8%) |
| Life, Physical & Social Science | 79 (44.1%) | 100 (55.9%) |
| Community & Social Service | 527 (32.0%) | 1,122 (68.0%) |
| Education, Arts & Media | 172 (46.6%) | 197 (53.4%) |
| Legal Services & Support | 18 (10.8%) | 149 (89.2%) |
| Education Instruction & Library | 161 (21.3%) | 596 (78.7%) |
| Arts, Media & Entertainment | 176 (49.4%) | 180 (50.6%) |
| Health Diagnosing & Treating | 278 (29.8%) | 655 (70.2%) |
| Health Technologists | 149 (30.0%) | 348 (70.0%) |
| Total (Category) | 2,539 (47.4%) | 2,814 (52.6%) |
| Total (Overall) | 13,489 (53.5%) | 11,714 (46.5%) |
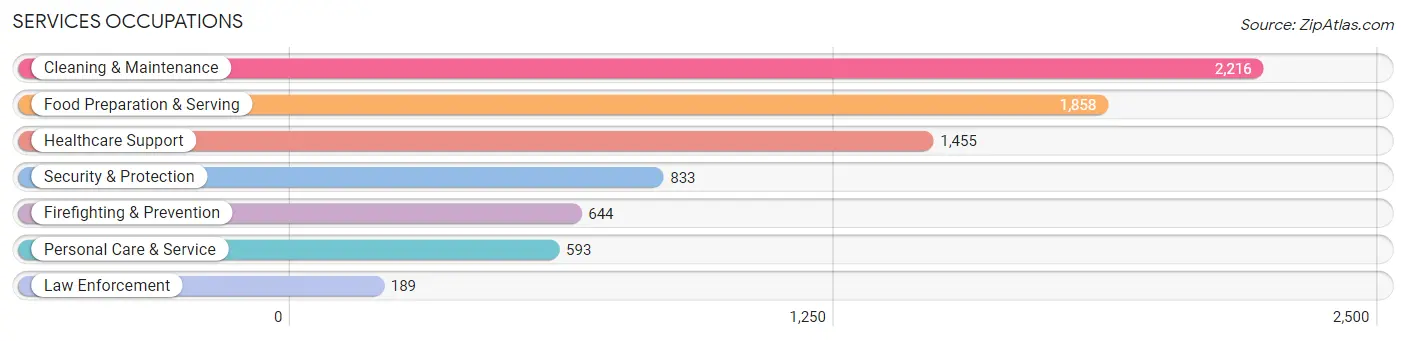
Services Occupations
The most common Services occupations in National City are Cleaning & Maintenance (2,216 | 8.8%), Food Preparation & Serving (1,858 | 7.4%), Healthcare Support (1,455 | 5.8%), Security & Protection (833 | 3.3%), and Firefighting & Prevention (644 | 2.6%).
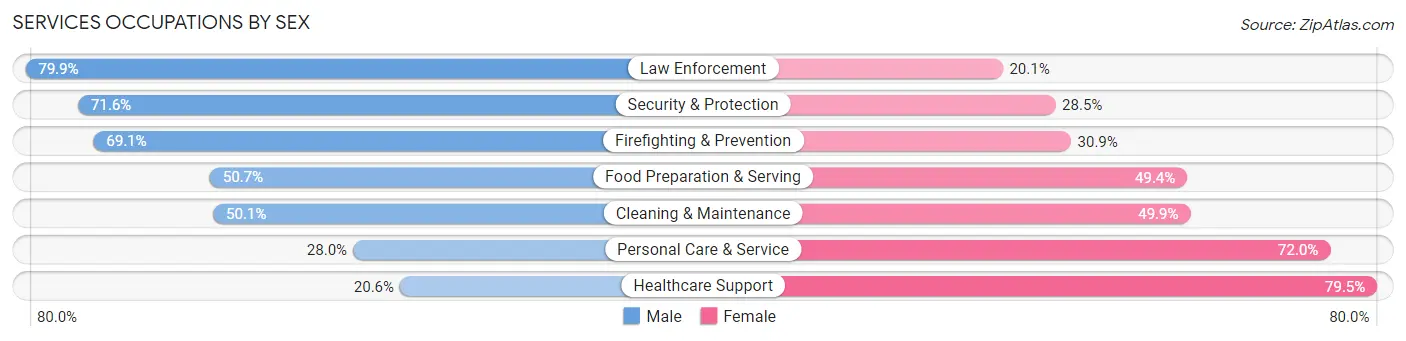
Services Occupations by Sex
Within the Services occupations in National City, the most male-oriented occupations are Law Enforcement (79.9%), Security & Protection (71.6%), and Firefighting & Prevention (69.1%), while the most female-oriented occupations are Healthcare Support (79.4%), Personal Care & Service (72.0%), and Cleaning & Maintenance (49.9%).
| Occupation | Male | Female |
| Healthcare Support | 299 (20.5%) | 1,156 (79.4%) |
| Security & Protection | 596 (71.6%) | 237 (28.4%) |
| Firefighting & Prevention | 445 (69.1%) | 199 (30.9%) |
| Law Enforcement | 151 (79.9%) | 38 (20.1%) |
| Food Preparation & Serving | 941 (50.6%) | 917 (49.3%) |
| Cleaning & Maintenance | 1,111 (50.1%) | 1,105 (49.9%) |
| Personal Care & Service | 166 (28.0%) | 427 (72.0%) |
| Total (Category) | 3,113 (44.8%) | 3,842 (55.2%) |
| Total (Overall) | 13,489 (53.5%) | 11,714 (46.5%) |
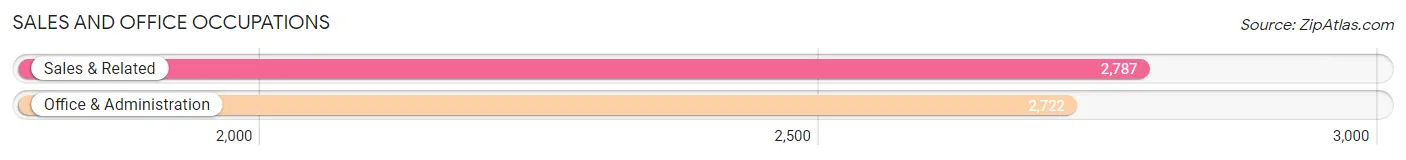
Sales and Office Occupations
The most common Sales and Office occupations in National City are Sales & Related (2,787 | 11.1%), and Office & Administration (2,722 | 10.8%).
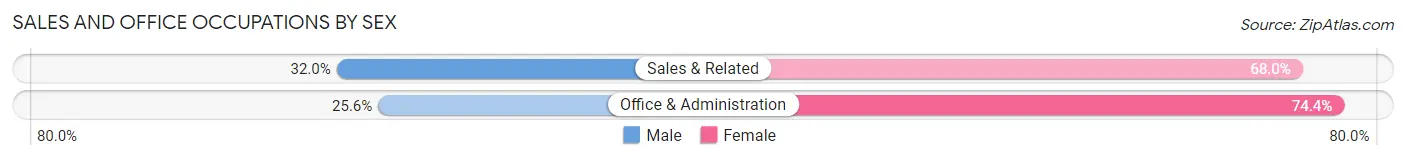
Sales and Office Occupations by Sex
| Occupation | Male | Female |
| Sales & Related | 892 (32.0%) | 1,895 (68.0%) |
| Office & Administration | 697 (25.6%) | 2,025 (74.4%) |
| Total (Category) | 1,589 (28.8%) | 3,920 (71.2%) |
| Total (Overall) | 13,489 (53.5%) | 11,714 (46.5%) |
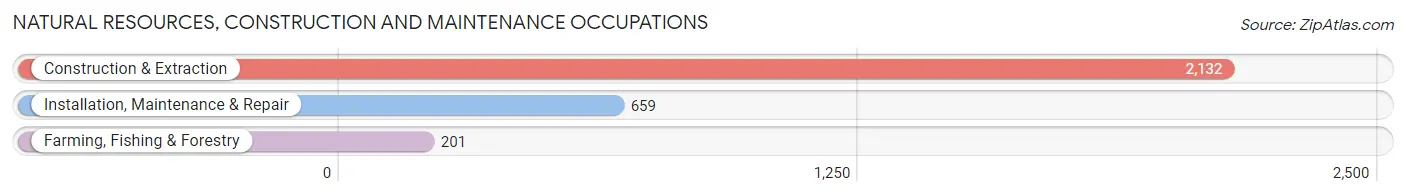
Natural Resources, Construction and Maintenance Occupations
The most common Natural Resources, Construction and Maintenance occupations in National City are Construction & Extraction (2,132 | 8.5%), Installation, Maintenance & Repair (659 | 2.6%), and Farming, Fishing & Forestry (201 | 0.8%).
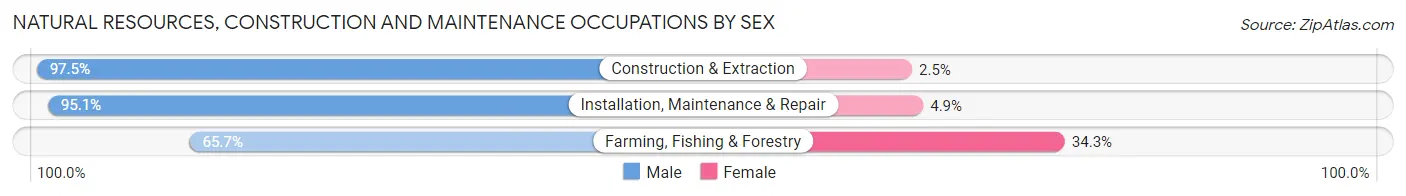
Natural Resources, Construction and Maintenance Occupations by Sex
| Occupation | Male | Female |
| Farming, Fishing & Forestry | 132 (65.7%) | 69 (34.3%) |
| Construction & Extraction | 2,078 (97.5%) | 54 (2.5%) |
| Installation, Maintenance & Repair | 627 (95.1%) | 32 (4.9%) |
| Total (Category) | 2,837 (94.8%) | 155 (5.2%) |
| Total (Overall) | 13,489 (53.5%) | 11,714 (46.5%) |
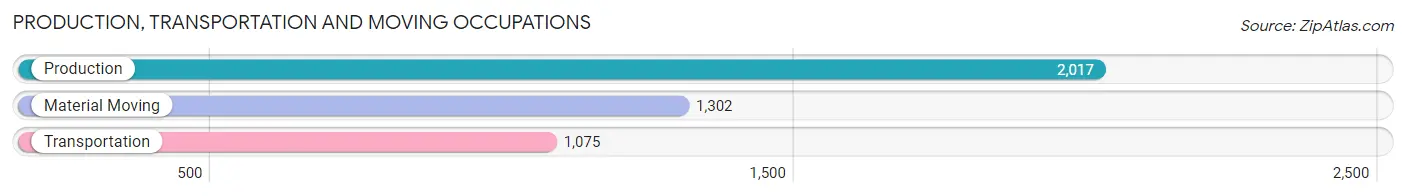
Production, Transportation and Moving Occupations
The most common Production, Transportation and Moving occupations in National City are Production (2,017 | 8.0%), Material Moving (1,302 | 5.2%), and Transportation (1,075 | 4.3%).
Production, Transportation and Moving Occupations by Sex
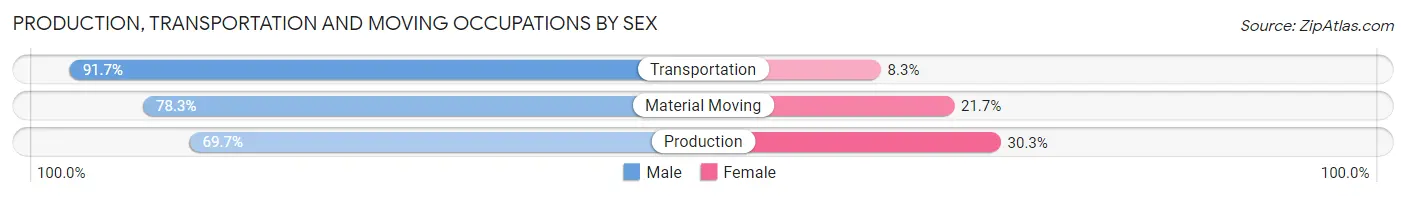
| Occupation | Male | Female |
| Production | 1,406 (69.7%) | 611 (30.3%) |
| Transportation | 986 (91.7%) | 89 (8.3%) |
| Material Moving | 1,019 (78.3%) | 283 (21.7%) |
| Total (Category) | 3,411 (77.6%) | 983 (22.4%) |
| Total (Overall) | 13,489 (53.5%) | 11,714 (46.5%) |
Employment Industries by Sex in National City
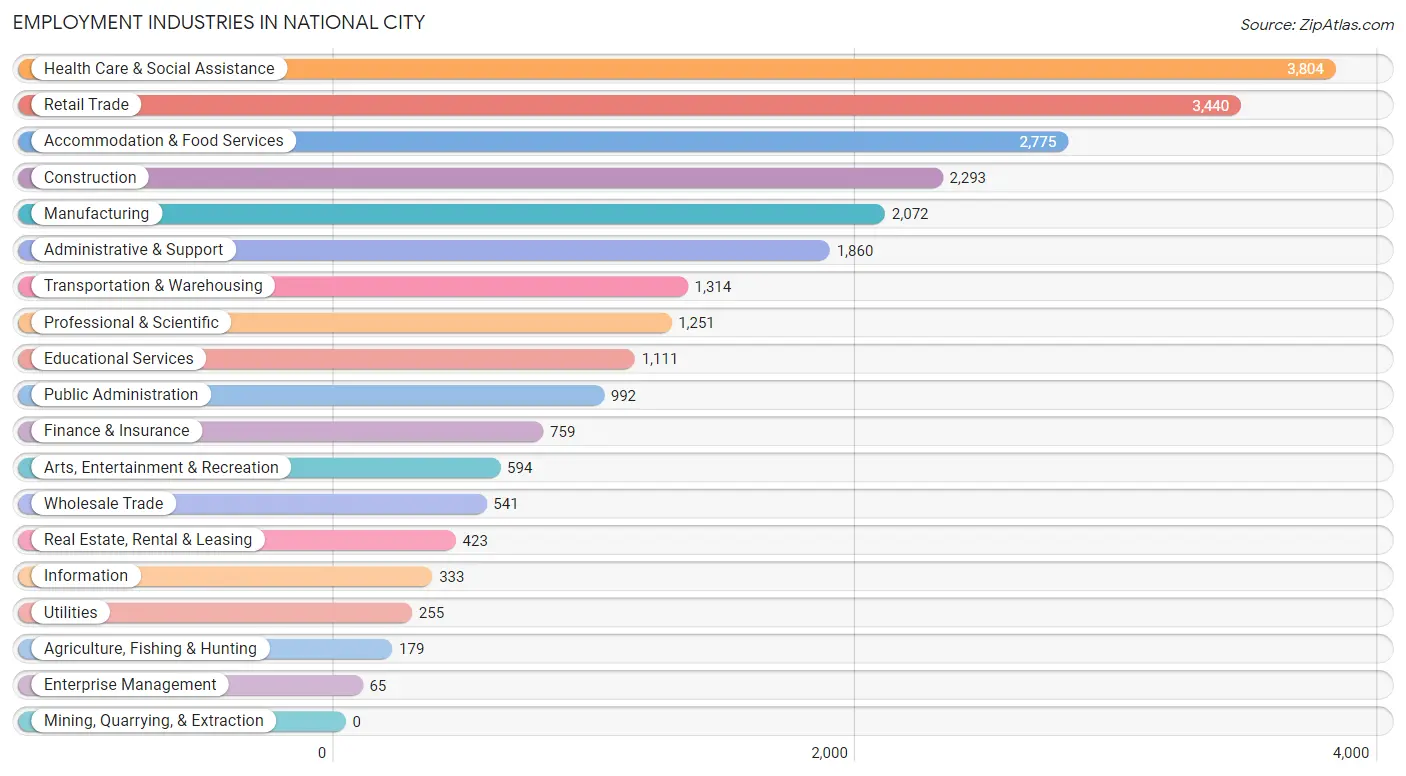
Employment Industries in National City
The major employment industries in National City include Health Care & Social Assistance (3,804 | 15.1%), Retail Trade (3,440 | 13.7%), Accommodation & Food Services (2,775 | 11.0%), Construction (2,293 | 9.1%), and Manufacturing (2,072 | 8.2%).
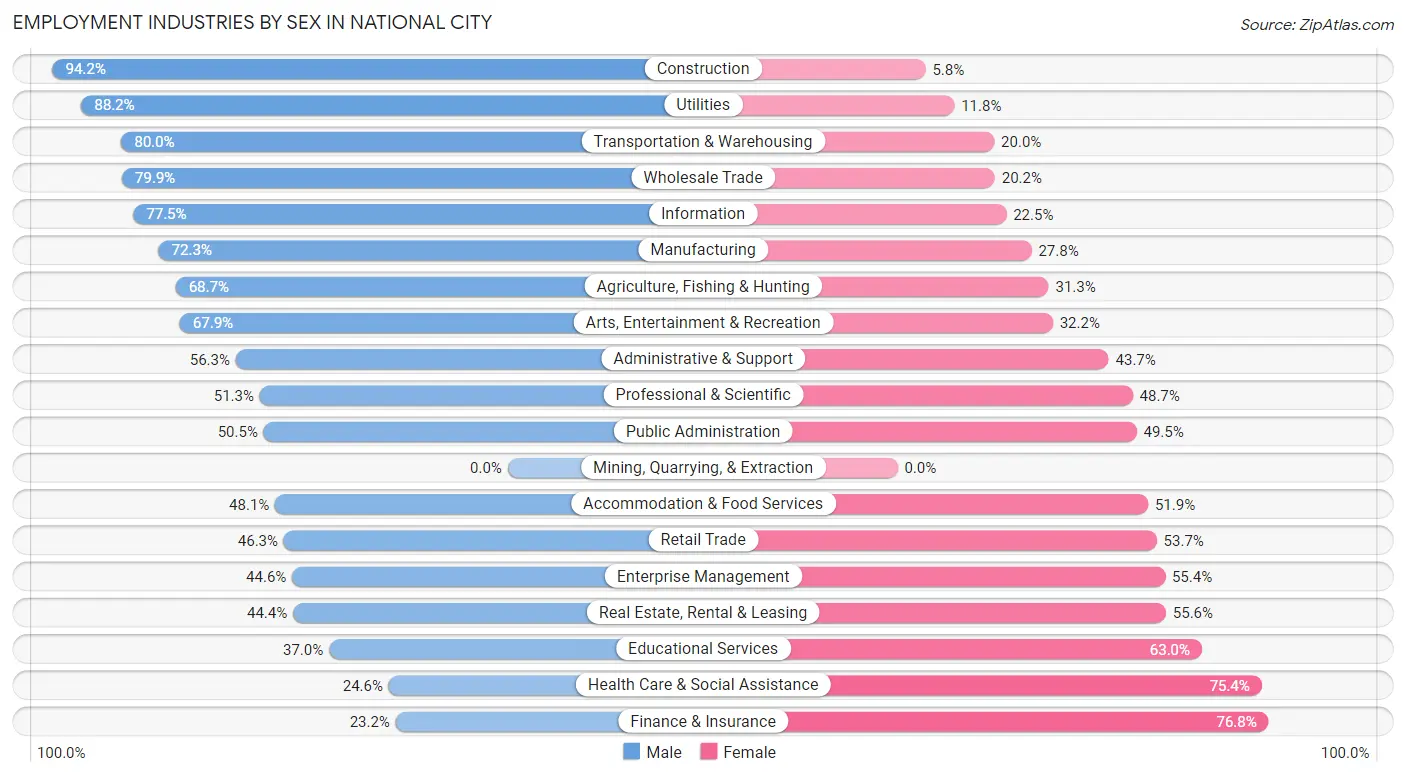
Employment Industries by Sex in National City
The National City industries that see more men than women are Construction (94.2%), Utilities (88.2%), and Transportation & Warehousing (80.0%), whereas the industries that tend to have a higher number of women are Finance & Insurance (76.8%), Health Care & Social Assistance (75.4%), and Educational Services (63.0%).
| Industry | Male | Female |
| Agriculture, Fishing & Hunting | 123 (68.7%) | 56 (31.3%) |
| Mining, Quarrying, & Extraction | 0 (0.0%) | 0 (0.0%) |
| Construction | 2,160 (94.2%) | 133 (5.8%) |
| Manufacturing | 1,497 (72.3%) | 575 (27.8%) |
| Wholesale Trade | 432 (79.8%) | 109 (20.2%) |
| Retail Trade | 1,594 (46.3%) | 1,846 (53.7%) |
| Transportation & Warehousing | 1,051 (80.0%) | 263 (20.0%) |
| Utilities | 225 (88.2%) | 30 (11.8%) |
| Information | 258 (77.5%) | 75 (22.5%) |
| Finance & Insurance | 176 (23.2%) | 583 (76.8%) |
| Real Estate, Rental & Leasing | 188 (44.4%) | 235 (55.6%) |
| Professional & Scientific | 642 (51.3%) | 609 (48.7%) |
| Enterprise Management | 29 (44.6%) | 36 (55.4%) |
| Administrative & Support | 1,047 (56.3%) | 813 (43.7%) |
| Educational Services | 411 (37.0%) | 700 (63.0%) |
| Health Care & Social Assistance | 936 (24.6%) | 2,868 (75.4%) |
| Arts, Entertainment & Recreation | 403 (67.8%) | 191 (32.2%) |
| Accommodation & Food Services | 1,336 (48.1%) | 1,439 (51.9%) |
| Public Administration | 501 (50.5%) | 491 (49.5%) |
| Total | 13,489 (53.5%) | 11,714 (46.5%) |
Education in National City
School Enrollment in National City
The most common levels of schooling among the 14,531 students in National City are college / undergraduate (3,735 | 25.7%), high school (3,526 | 24.3%), and middle school (3,211 | 22.1%).
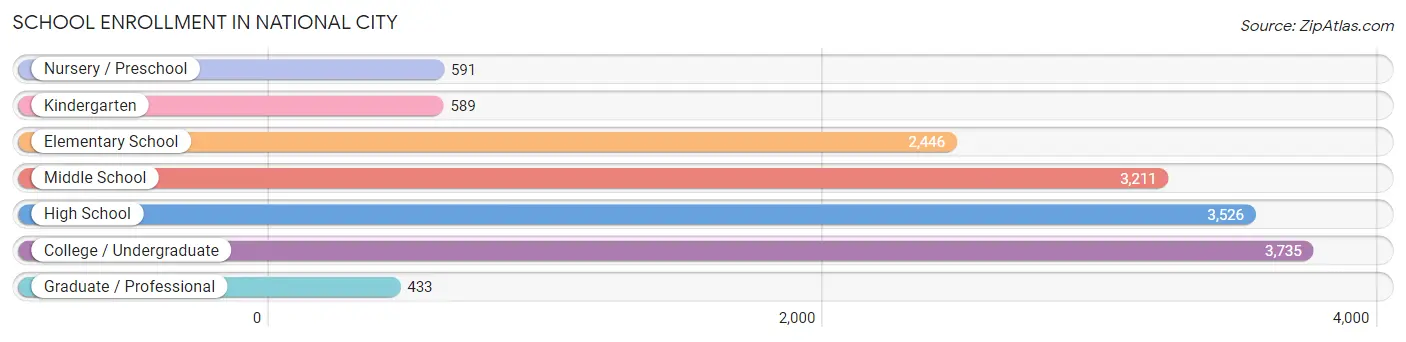
| School Level | # Students | % Students |
| Nursery / Preschool | 591 | 4.1% |
| Kindergarten | 589 | 4.1% |
| Elementary School | 2,446 | 16.8% |
| Middle School | 3,211 | 22.1% |
| High School | 3,526 | 24.3% |
| College / Undergraduate | 3,735 | 25.7% |
| Graduate / Professional | 433 | 3.0% |
| Total | 14,531 | 100.0% |
School Enrollment by Age by Funding Source in National City
Out of a total of 14,531 students who are enrolled in schools in National City, 1,090 (7.5%) attend a private institution, while the remaining 13,441 (92.5%) are enrolled in public schools. The age group of 25 to 34 year olds has the highest likelihood of being enrolled in private schools, with 352 (33.4% in the age bracket) enrolled. Conversely, the age group of 15 to 17 year olds has the lowest likelihood of being enrolled in a private school, with 2,045 (99.4% in the age bracket) attending a public institution.
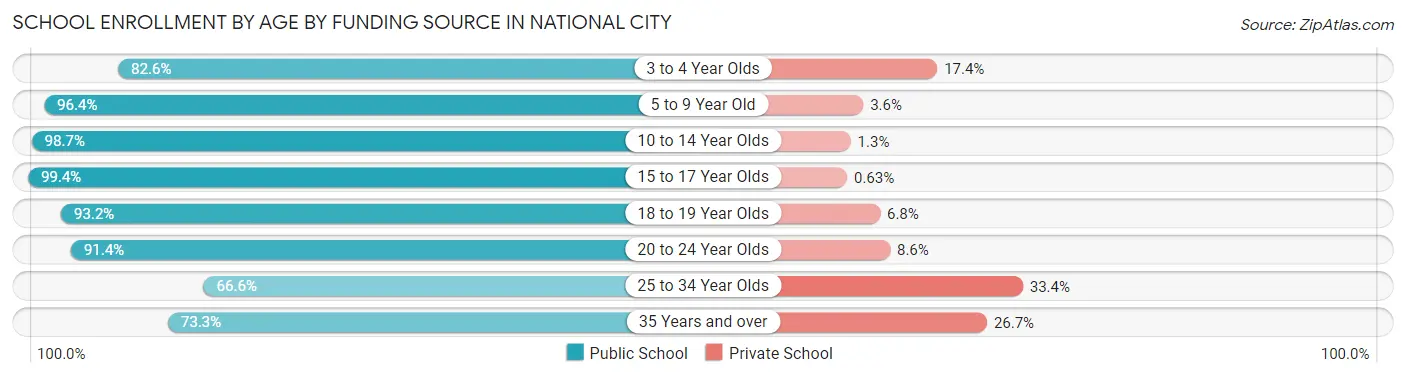
| Age Bracket | Public School | Private School |
| 3 to 4 Year Olds | 422 (82.6%) | 89 (17.4%) |
| 5 to 9 Year Old | 2,882 (96.4%) | 109 (3.6%) |
| 10 to 14 Year Olds | 4,110 (98.7%) | 54 (1.3%) |
| 15 to 17 Year Olds | 2,045 (99.4%) | 13 (0.6%) |
| 18 to 19 Year Olds | 1,047 (93.2%) | 76 (6.8%) |
| 20 to 24 Year Olds | 1,577 (91.4%) | 149 (8.6%) |
| 25 to 34 Year Olds | 703 (66.6%) | 352 (33.4%) |
| 35 Years and over | 662 (73.3%) | 241 (26.7%) |
| Total | 13,441 (92.5%) | 1,090 (7.5%) |
Educational Attainment by Field of Study in National City
Business (1,475 | 22.8%), science & technology (1,013 | 15.7%), social sciences (709 | 11.0%), education (621 | 9.6%), and arts & humanities (508 | 7.9%) are the most common fields of study among 6,463 individuals in National City who have obtained a bachelor's degree or higher.
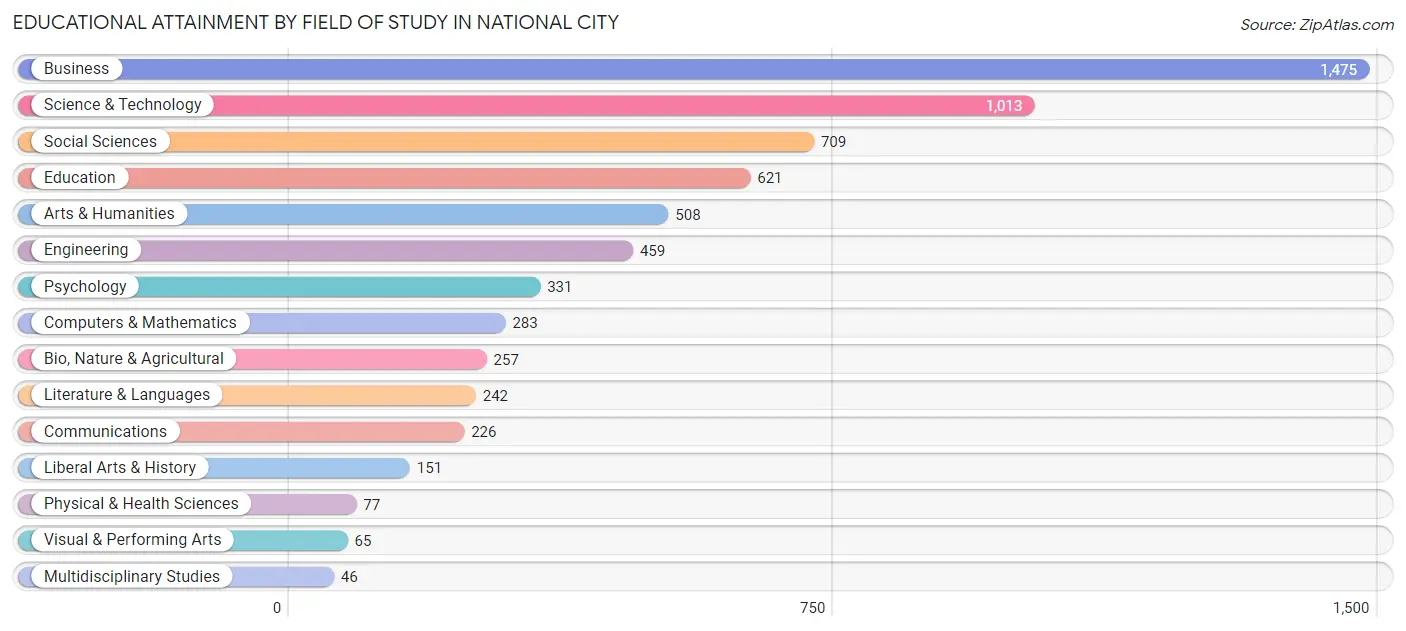
| Field of Study | # Graduates | % Graduates |
| Computers & Mathematics | 283 | 4.4% |
| Bio, Nature & Agricultural | 257 | 4.0% |
| Physical & Health Sciences | 77 | 1.2% |
| Psychology | 331 | 5.1% |
| Social Sciences | 709 | 11.0% |
| Engineering | 459 | 7.1% |
| Multidisciplinary Studies | 46 | 0.7% |
| Science & Technology | 1,013 | 15.7% |
| Business | 1,475 | 22.8% |
| Education | 621 | 9.6% |
| Literature & Languages | 242 | 3.7% |
| Liberal Arts & History | 151 | 2.3% |
| Visual & Performing Arts | 65 | 1.0% |
| Communications | 226 | 3.5% |
| Arts & Humanities | 508 | 7.9% |
| Total | 6,463 | 100.0% |
Transportation & Commute in National City
Vehicle Availability by Sex in National City
The most prevalent vehicle ownership categories in National City are males with 2 vehicles (4,903, accounting for 35.6%) and females with 2 vehicles (4,223, making up 42.6%).
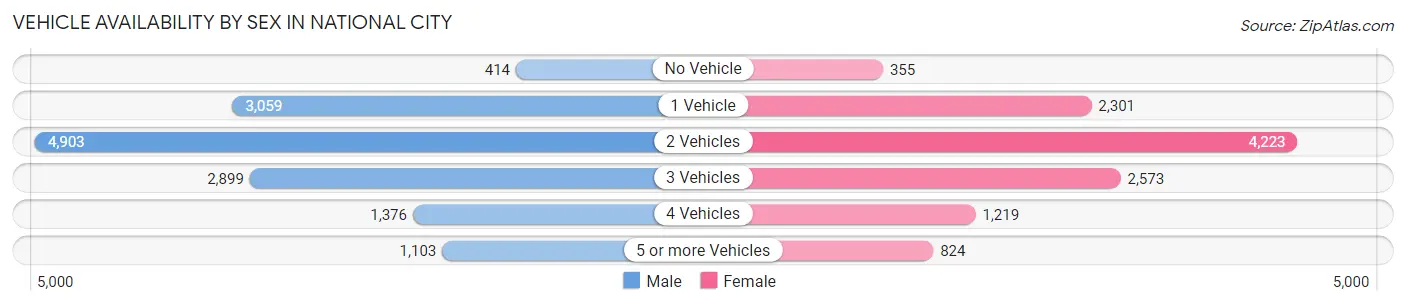
| Vehicles Available | Male | Female |
| No Vehicle | 414 (3.0%) | 355 (3.1%) |
| 1 Vehicle | 3,059 (22.2%) | 2,301 (20.0%) |
| 2 Vehicles | 4,903 (35.6%) | 4,223 (36.7%) |
| 3 Vehicles | 2,899 (21.1%) | 2,573 (22.4%) |
| 4 Vehicles | 1,376 (10.0%) | 1,219 (10.6%) |
| 5 or more Vehicles | 1,103 (8.0%) | 824 (7.2%) |
| Total | 13,754 (100.0%) | 11,495 (100.0%) |
Commute Time in National City
The most frequently occuring commute durations in National City are 15 to 19 minutes (4,519 commuters, 18.3%), 20 to 24 minutes (4,508 commuters, 18.3%), and 30 to 34 minutes (3,864 commuters, 15.7%).
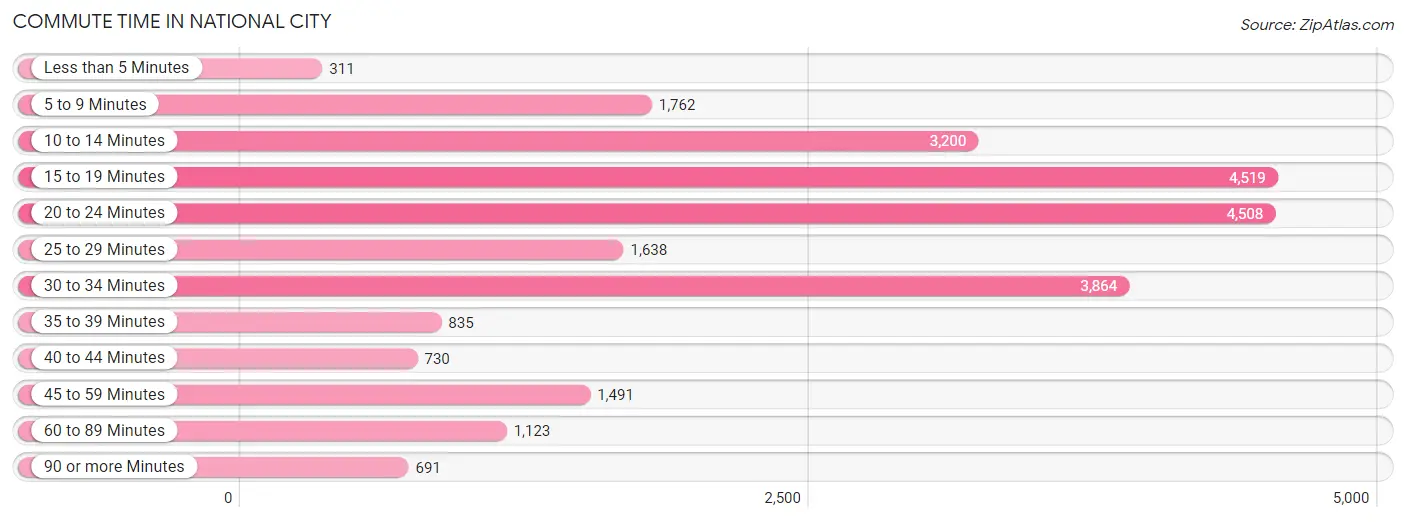
| Commute Time | # Commuters | % Commuters |
| Less than 5 Minutes | 311 | 1.3% |
| 5 to 9 Minutes | 1,762 | 7.1% |
| 10 to 14 Minutes | 3,200 | 13.0% |
| 15 to 19 Minutes | 4,519 | 18.3% |
| 20 to 24 Minutes | 4,508 | 18.3% |
| 25 to 29 Minutes | 1,638 | 6.6% |
| 30 to 34 Minutes | 3,864 | 15.7% |
| 35 to 39 Minutes | 835 | 3.4% |
| 40 to 44 Minutes | 730 | 3.0% |
| 45 to 59 Minutes | 1,491 | 6.0% |
| 60 to 89 Minutes | 1,123 | 4.5% |
| 90 or more Minutes | 691 | 2.8% |
Commute Time by Sex in National City
The most common commute times in National City are 20 to 24 minutes (2,718 commuters, 20.0%) for males and 15 to 19 minutes (2,213 commuters, 20.0%) for females.
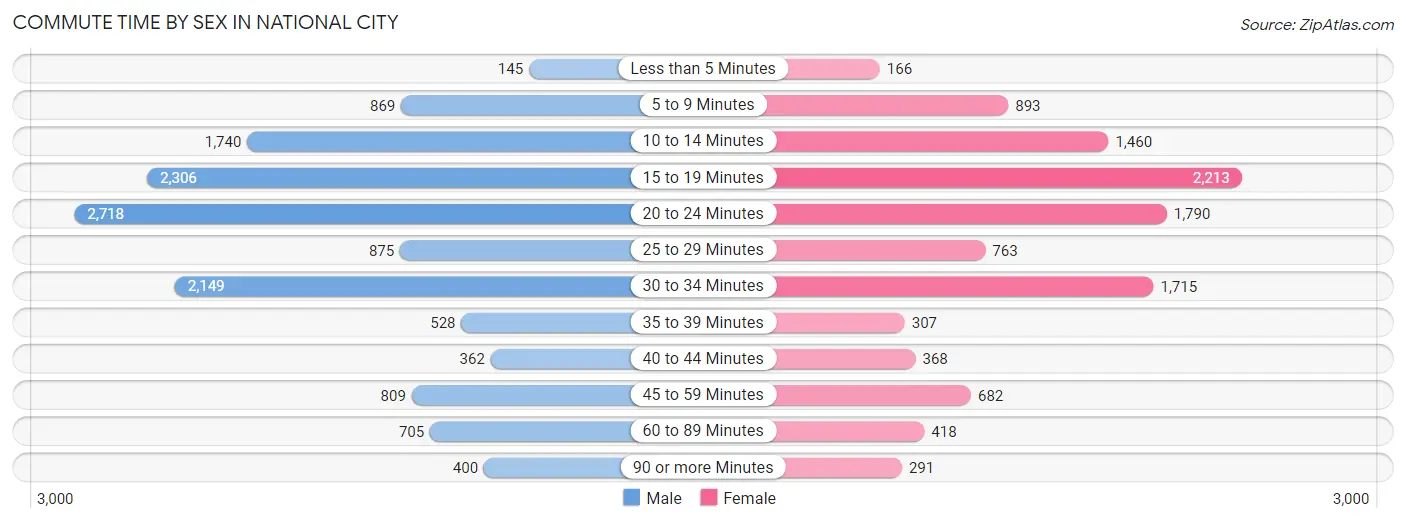
| Commute Time | Male | Female |
| Less than 5 Minutes | 145 (1.1%) | 166 (1.5%) |
| 5 to 9 Minutes | 869 (6.4%) | 893 (8.1%) |
| 10 to 14 Minutes | 1,740 (12.8%) | 1,460 (13.2%) |
| 15 to 19 Minutes | 2,306 (17.0%) | 2,213 (20.0%) |
| 20 to 24 Minutes | 2,718 (20.0%) | 1,790 (16.2%) |
| 25 to 29 Minutes | 875 (6.4%) | 763 (6.9%) |
| 30 to 34 Minutes | 2,149 (15.8%) | 1,715 (15.5%) |
| 35 to 39 Minutes | 528 (3.9%) | 307 (2.8%) |
| 40 to 44 Minutes | 362 (2.7%) | 368 (3.3%) |
| 45 to 59 Minutes | 809 (5.9%) | 682 (6.2%) |
| 60 to 89 Minutes | 705 (5.2%) | 418 (3.8%) |
| 90 or more Minutes | 400 (2.9%) | 291 (2.6%) |
Time of Departure to Work by Sex in National City
The most frequent times of departure to work in National City are 7:00 AM to 7:29 AM (2,128, 15.6%) for males and 8:00 AM to 8:29 AM (1,418, 12.8%) for females.
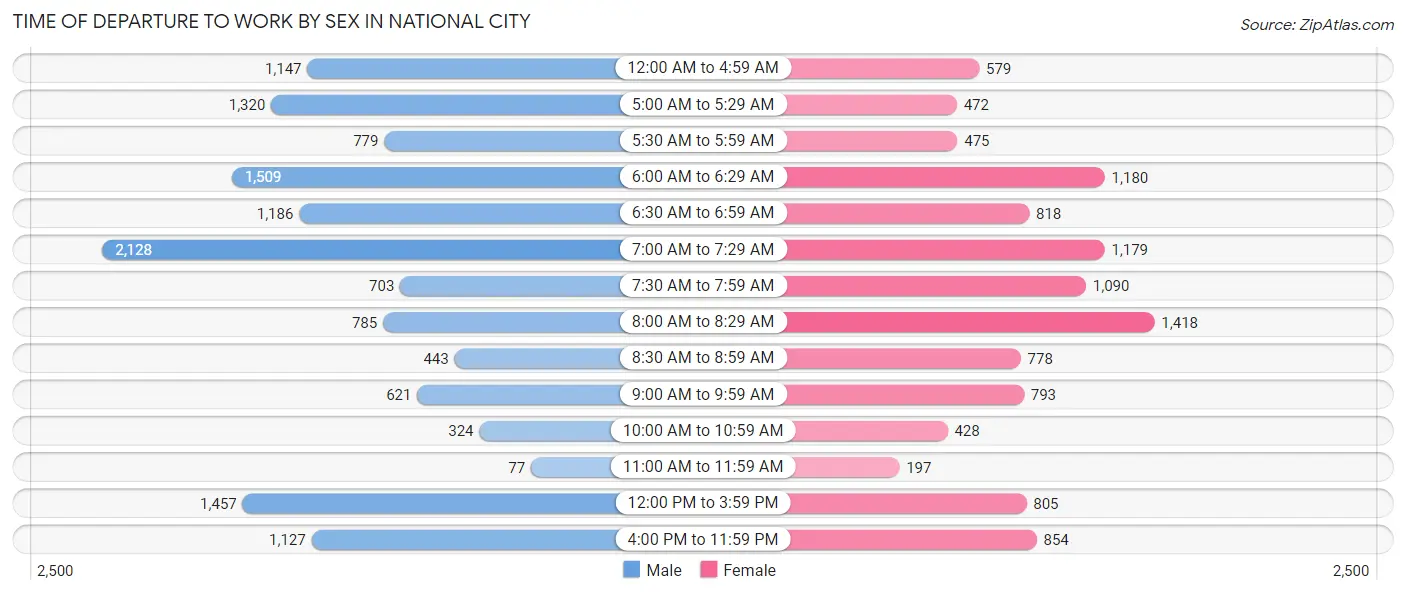
| Time of Departure | Male | Female |
| 12:00 AM to 4:59 AM | 1,147 (8.4%) | 579 (5.2%) |
| 5:00 AM to 5:29 AM | 1,320 (9.7%) | 472 (4.3%) |
| 5:30 AM to 5:59 AM | 779 (5.7%) | 475 (4.3%) |
| 6:00 AM to 6:29 AM | 1,509 (11.1%) | 1,180 (10.7%) |
| 6:30 AM to 6:59 AM | 1,186 (8.7%) | 818 (7.4%) |
| 7:00 AM to 7:29 AM | 2,128 (15.6%) | 1,179 (10.6%) |
| 7:30 AM to 7:59 AM | 703 (5.2%) | 1,090 (9.9%) |
| 8:00 AM to 8:29 AM | 785 (5.8%) | 1,418 (12.8%) |
| 8:30 AM to 8:59 AM | 443 (3.3%) | 778 (7.0%) |
| 9:00 AM to 9:59 AM | 621 (4.6%) | 793 (7.2%) |
| 10:00 AM to 10:59 AM | 324 (2.4%) | 428 (3.9%) |
| 11:00 AM to 11:59 AM | 77 (0.6%) | 197 (1.8%) |
| 12:00 PM to 3:59 PM | 1,457 (10.7%) | 805 (7.3%) |
| 4:00 PM to 11:59 PM | 1,127 (8.3%) | 854 (7.7%) |
| Total | 13,606 (100.0%) | 11,066 (100.0%) |
Housing Occupancy in National City
Occupancy by Ownership in National City
Of the total 17,440 dwellings in National City, owner-occupied units account for 5,722 (32.8%), while renter-occupied units make up 11,718 (67.2%).
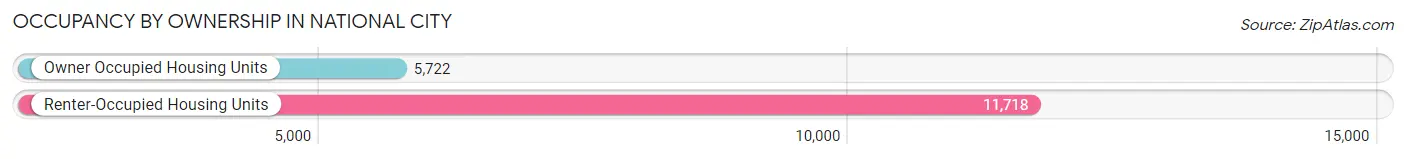
| Occupancy | # Housing Units | % Housing Units |
| Owner Occupied Housing Units | 5,722 | 32.8% |
| Renter-Occupied Housing Units | 11,718 | 67.2% |
| Total Occupied Housing Units | 17,440 | 100.0% |
Occupancy by Household Size in National City
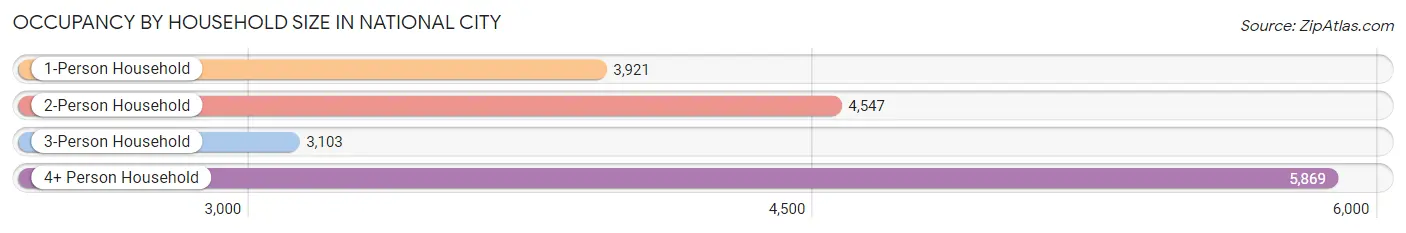
| Household Size | # Housing Units | % Housing Units |
| 1-Person Household | 3,921 | 22.5% |
| 2-Person Household | 4,547 | 26.1% |
| 3-Person Household | 3,103 | 17.8% |
| 4+ Person Household | 5,869 | 33.7% |
| Total Housing Units | 17,440 | 100.0% |
Occupancy by Ownership by Household Size in National City
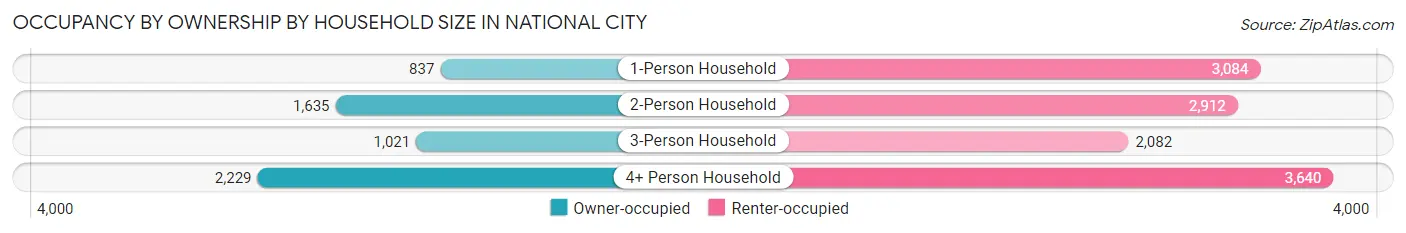
| Household Size | Owner-occupied | Renter-occupied |
| 1-Person Household | 837 (21.3%) | 3,084 (78.6%) |
| 2-Person Household | 1,635 (36.0%) | 2,912 (64.0%) |
| 3-Person Household | 1,021 (32.9%) | 2,082 (67.1%) |
| 4+ Person Household | 2,229 (38.0%) | 3,640 (62.0%) |
| Total Housing Units | 5,722 (32.8%) | 11,718 (67.2%) |
Occupancy by Educational Attainment in National City
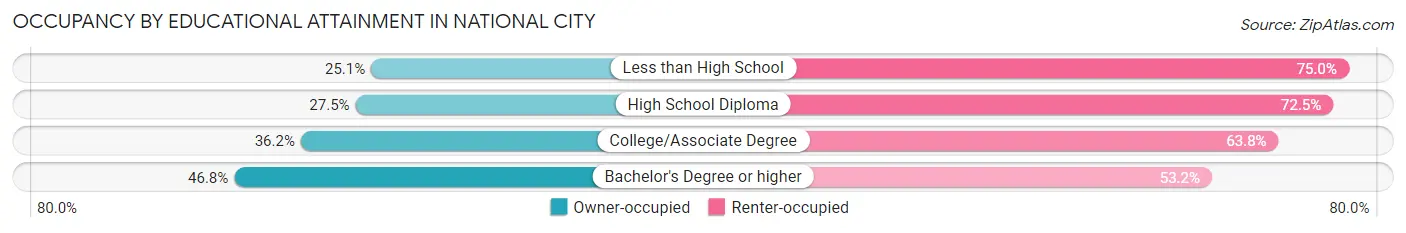
| Household Size | Owner-occupied | Renter-occupied |
| Less than High School | 1,095 (25.1%) | 3,276 (75.0%) |
| High School Diploma | 1,286 (27.5%) | 3,385 (72.5%) |
| College/Associate Degree | 2,010 (36.2%) | 3,542 (63.8%) |
| Bachelor's Degree or higher | 1,331 (46.8%) | 1,515 (53.2%) |
Occupancy by Age of Householder in National City
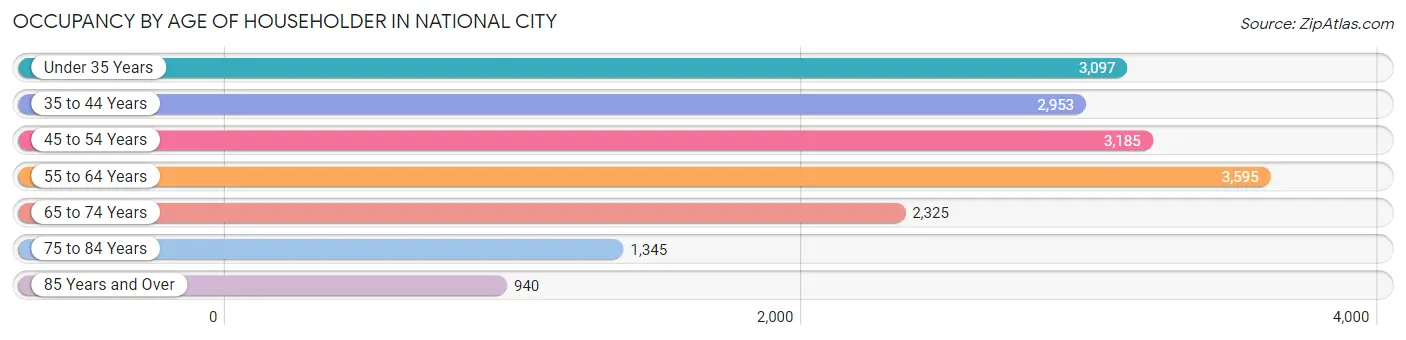
| Age Bracket | # Households | % Households |
| Under 35 Years | 3,097 | 17.8% |
| 35 to 44 Years | 2,953 | 16.9% |
| 45 to 54 Years | 3,185 | 18.3% |
| 55 to 64 Years | 3,595 | 20.6% |
| 65 to 74 Years | 2,325 | 13.3% |
| 75 to 84 Years | 1,345 | 7.7% |
| 85 Years and Over | 940 | 5.4% |
| Total | 17,440 | 100.0% |
Housing Finances in National City
Median Income by Occupancy in National City
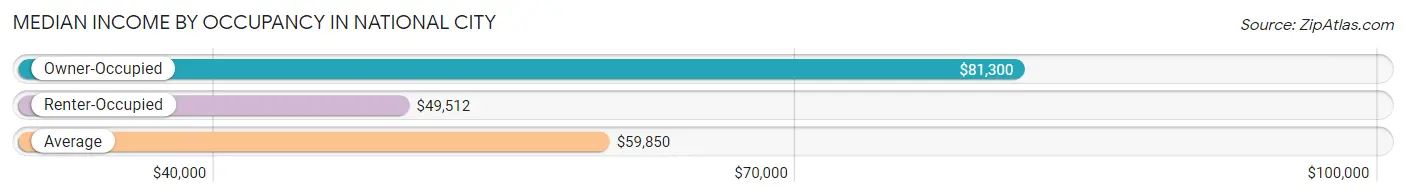
| Occupancy Type | # Households | Median Income |
| Owner-Occupied | 5,722 (32.8%) | $81,300 |
| Renter-Occupied | 11,718 (67.2%) | $49,512 |
| Average | 17,440 (100.0%) | $59,850 |
Occupancy by Householder Income Bracket in National City
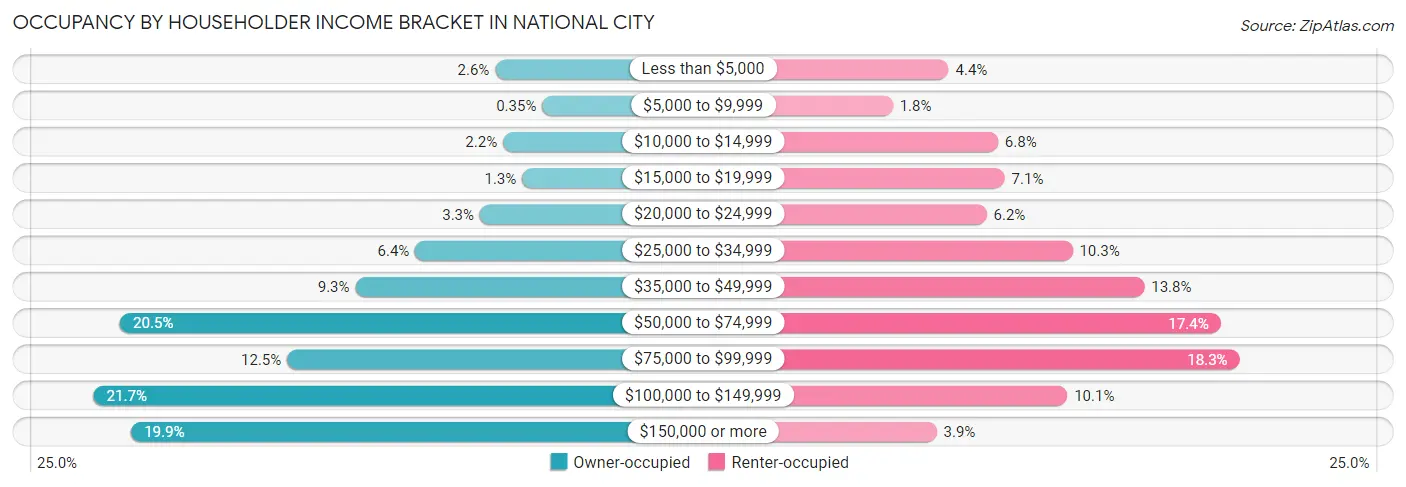
| Income Bracket | Owner-occupied | Renter-occupied |
| Less than $5,000 | 148 (2.6%) | 519 (4.4%) |
| $5,000 to $9,999 | 20 (0.4%) | 207 (1.8%) |
| $10,000 to $14,999 | 127 (2.2%) | 795 (6.8%) |
| $15,000 to $19,999 | 75 (1.3%) | 832 (7.1%) |
| $20,000 to $24,999 | 190 (3.3%) | 731 (6.2%) |
| $25,000 to $34,999 | 366 (6.4%) | 1,211 (10.3%) |
| $35,000 to $49,999 | 529 (9.2%) | 1,611 (13.8%) |
| $50,000 to $74,999 | 1,170 (20.4%) | 2,037 (17.4%) |
| $75,000 to $99,999 | 715 (12.5%) | 2,142 (18.3%) |
| $100,000 to $149,999 | 1,242 (21.7%) | 1,181 (10.1%) |
| $150,000 or more | 1,140 (19.9%) | 452 (3.9%) |
| Total | 5,722 (100.0%) | 11,718 (100.0%) |
Monthly Housing Cost Tiers in National City
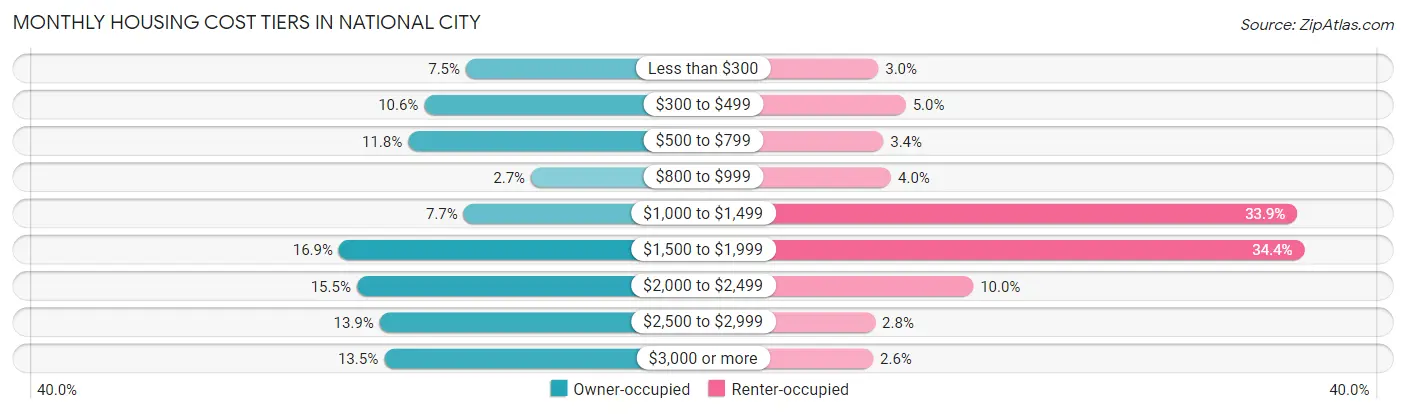
| Monthly Cost | Owner-occupied | Renter-occupied |
| Less than $300 | 429 (7.5%) | 353 (3.0%) |
| $300 to $499 | 605 (10.6%) | 590 (5.0%) |
| $500 to $799 | 673 (11.8%) | 396 (3.4%) |
| $800 to $999 | 155 (2.7%) | 463 (4.0%) |
| $1,000 to $1,499 | 439 (7.7%) | 3,968 (33.9%) |
| $1,500 to $1,999 | 965 (16.9%) | 4,030 (34.4%) |
| $2,000 to $2,499 | 889 (15.5%) | 1,172 (10.0%) |
| $2,500 to $2,999 | 793 (13.9%) | 326 (2.8%) |
| $3,000 or more | 774 (13.5%) | 308 (2.6%) |
| Total | 5,722 (100.0%) | 11,718 (100.0%) |
Physical Housing Characteristics in National City
Housing Structures in National City
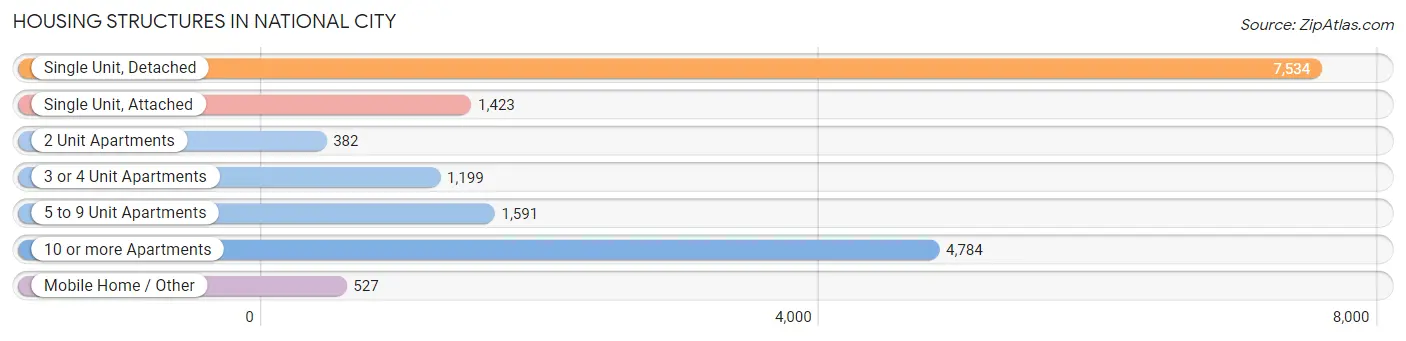
| Structure Type | # Housing Units | % Housing Units |
| Single Unit, Detached | 7,534 | 43.2% |
| Single Unit, Attached | 1,423 | 8.2% |
| 2 Unit Apartments | 382 | 2.2% |
| 3 or 4 Unit Apartments | 1,199 | 6.9% |
| 5 to 9 Unit Apartments | 1,591 | 9.1% |
| 10 or more Apartments | 4,784 | 27.4% |
| Mobile Home / Other | 527 | 3.0% |
| Total | 17,440 | 100.0% |
Housing Structures by Occupancy in National City
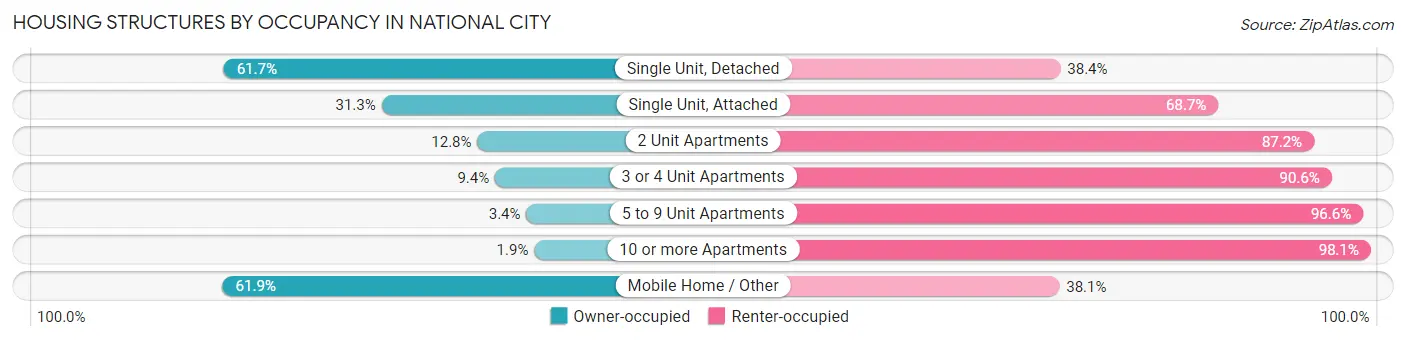
| Structure Type | Owner-occupied | Renter-occupied |
| Single Unit, Detached | 4,645 (61.7%) | 2,889 (38.4%) |
| Single Unit, Attached | 445 (31.3%) | 978 (68.7%) |
| 2 Unit Apartments | 49 (12.8%) | 333 (87.2%) |
| 3 or 4 Unit Apartments | 113 (9.4%) | 1,086 (90.6%) |
| 5 to 9 Unit Apartments | 54 (3.4%) | 1,537 (96.6%) |
| 10 or more Apartments | 90 (1.9%) | 4,694 (98.1%) |
| Mobile Home / Other | 326 (61.9%) | 201 (38.1%) |
| Total | 5,722 (32.8%) | 11,718 (67.2%) |
Housing Structures by Number of Rooms in National City
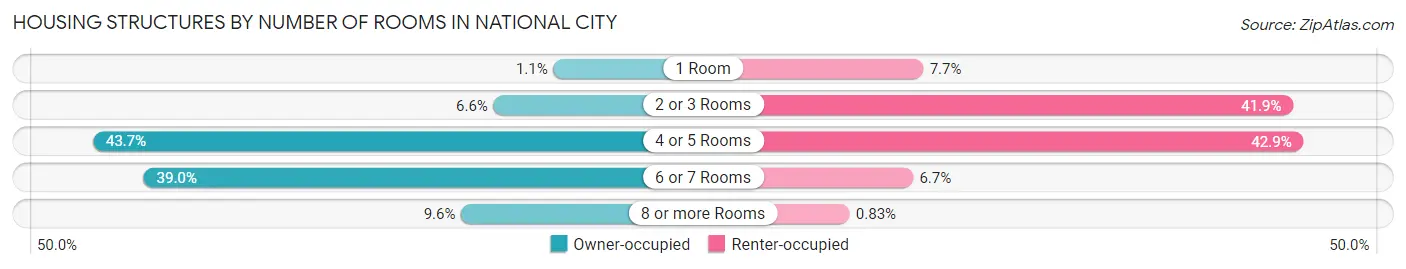
| Number of Rooms | Owner-occupied | Renter-occupied |
| 1 Room | 62 (1.1%) | 898 (7.7%) |
| 2 or 3 Rooms | 379 (6.6%) | 4,913 (41.9%) |
| 4 or 5 Rooms | 2,500 (43.7%) | 5,024 (42.9%) |
| 6 or 7 Rooms | 2,231 (39.0%) | 786 (6.7%) |
| 8 or more Rooms | 550 (9.6%) | 97 (0.8%) |
| Total | 5,722 (100.0%) | 11,718 (100.0%) |
Housing Structure by Heating Type in National City
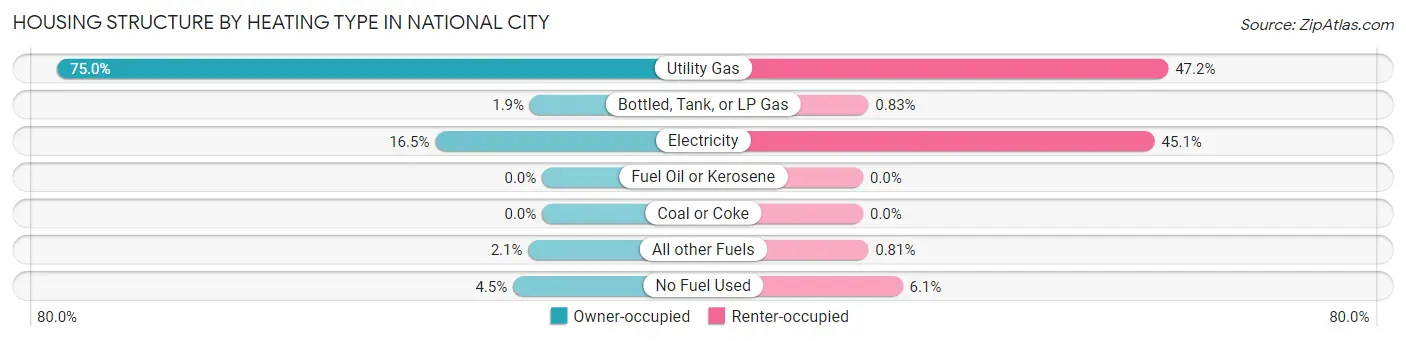
| Heating Type | Owner-occupied | Renter-occupied |
| Utility Gas | 4,290 (75.0%) | 5,529 (47.2%) |
| Bottled, Tank, or LP Gas | 108 (1.9%) | 97 (0.8%) |
| Electricity | 945 (16.5%) | 5,282 (45.1%) |
| Fuel Oil or Kerosene | 0 (0.0%) | 0 (0.0%) |
| Coal or Coke | 0 (0.0%) | 0 (0.0%) |
| All other Fuels | 122 (2.1%) | 95 (0.8%) |
| No Fuel Used | 257 (4.5%) | 715 (6.1%) |
| Total | 5,722 (100.0%) | 11,718 (100.0%) |
Household Vehicle Usage in National City
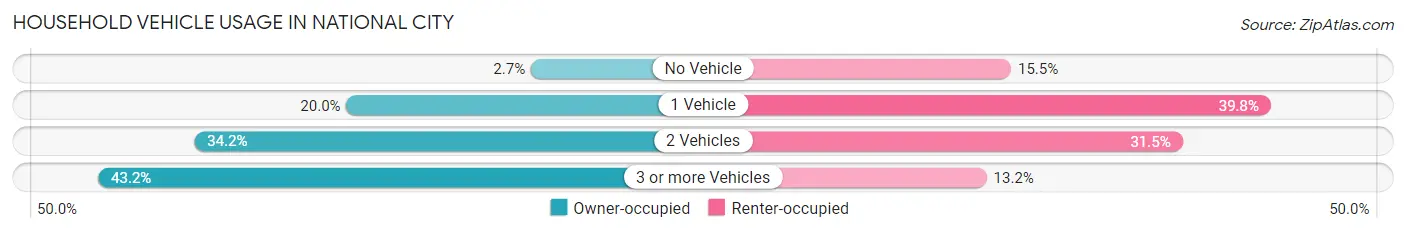
| Vehicles per Household | Owner-occupied | Renter-occupied |
| No Vehicle | 156 (2.7%) | 1,818 (15.5%) |
| 1 Vehicle | 1,142 (20.0%) | 4,658 (39.8%) |
| 2 Vehicles | 1,955 (34.2%) | 3,692 (31.5%) |
| 3 or more Vehicles | 2,469 (43.1%) | 1,550 (13.2%) |
| Total | 5,722 (100.0%) | 11,718 (100.0%) |
Real Estate & Mortgages in National City
Real Estate and Mortgage Overview in National City
| Characteristic | Without Mortgage | With Mortgage |
| Housing Units | 1,908 | 3,814 |
| Median Property Value | $472,200 | $529,200 |
| Median Household Income | $65,795 | $905 |
| Monthly Housing Costs | $482 | $774 |
| Real Estate Taxes | $2,361 | $114 |
Property Value by Mortgage Status in National City
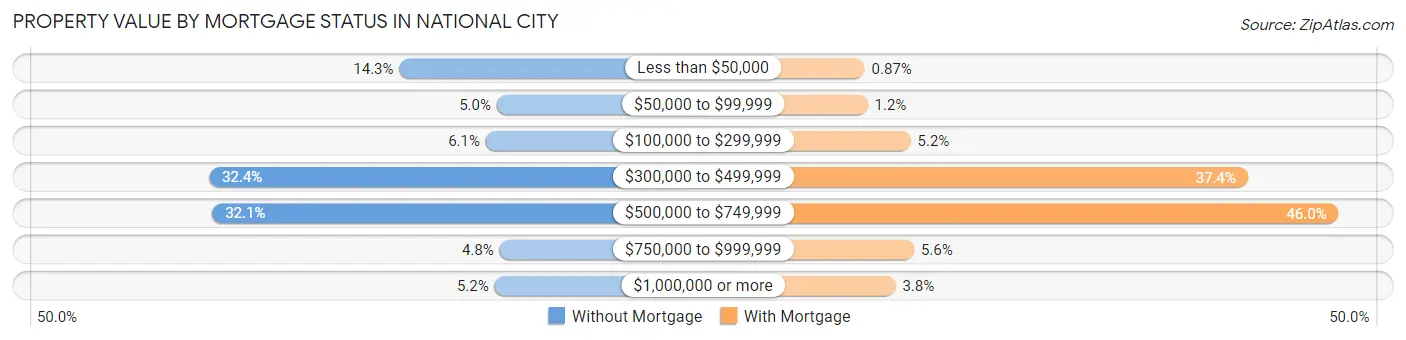
| Property Value | Without Mortgage | With Mortgage |
| Less than $50,000 | 273 (14.3%) | 33 (0.9%) |
| $50,000 to $99,999 | 96 (5.0%) | 44 (1.1%) |
| $100,000 to $299,999 | 116 (6.1%) | 200 (5.2%) |
| $300,000 to $499,999 | 619 (32.4%) | 1,425 (37.4%) |
| $500,000 to $749,999 | 613 (32.1%) | 1,755 (46.0%) |
| $750,000 to $999,999 | 91 (4.8%) | 212 (5.6%) |
| $1,000,000 or more | 100 (5.2%) | 145 (3.8%) |
| Total | 1,908 (100.0%) | 3,814 (100.0%) |
Household Income by Mortgage Status in National City
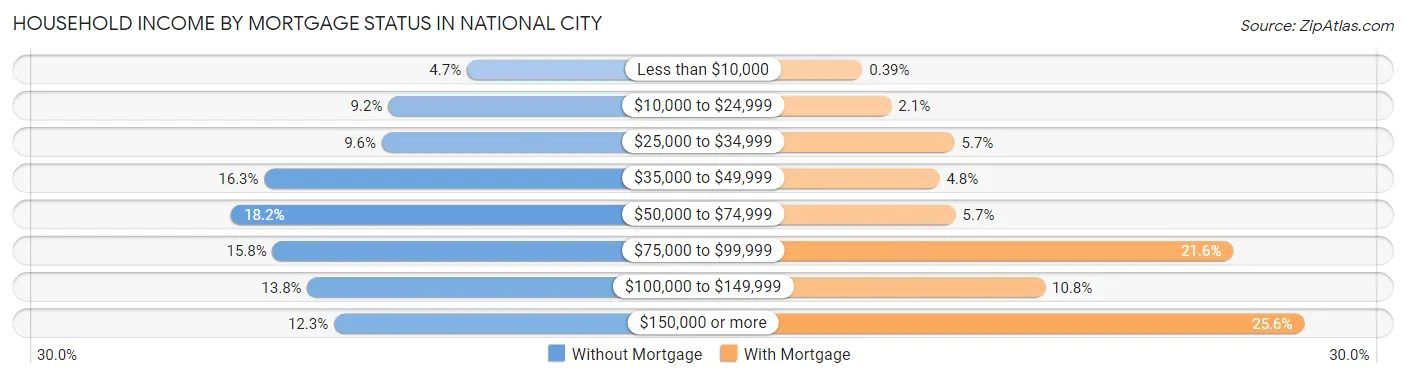
| Household Income | Without Mortgage | With Mortgage |
| Less than $10,000 | 90 (4.7%) | 15 (0.4%) |
| $10,000 to $24,999 | 176 (9.2%) | 78 (2.1%) |
| $25,000 to $34,999 | 183 (9.6%) | 216 (5.7%) |
| $35,000 to $49,999 | 311 (16.3%) | 183 (4.8%) |
| $50,000 to $74,999 | 347 (18.2%) | 218 (5.7%) |
| $75,000 to $99,999 | 302 (15.8%) | 823 (21.6%) |
| $100,000 to $149,999 | 264 (13.8%) | 413 (10.8%) |
| $150,000 or more | 235 (12.3%) | 978 (25.6%) |
| Total | 1,908 (100.0%) | 3,814 (100.0%) |
Property Value to Household Income Ratio in National City
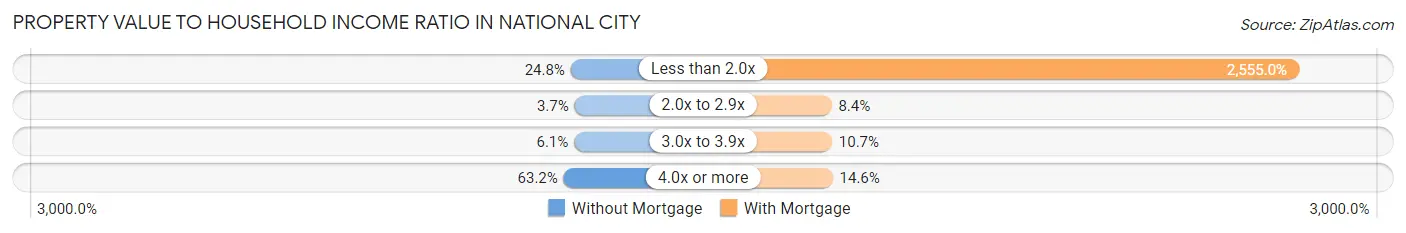
| Value-to-Income Ratio | Without Mortgage | With Mortgage |
| Less than 2.0x | 473 (24.8%) | 97,447 (2,555.0%) |
| 2.0x to 2.9x | 70 (3.7%) | 321 (8.4%) |
| 3.0x to 3.9x | 117 (6.1%) | 408 (10.7%) |
| 4.0x or more | 1,205 (63.2%) | 555 (14.5%) |
| Total | 1,908 (100.0%) | 3,814 (100.0%) |
Real Estate Taxes by Mortgage Status in National City
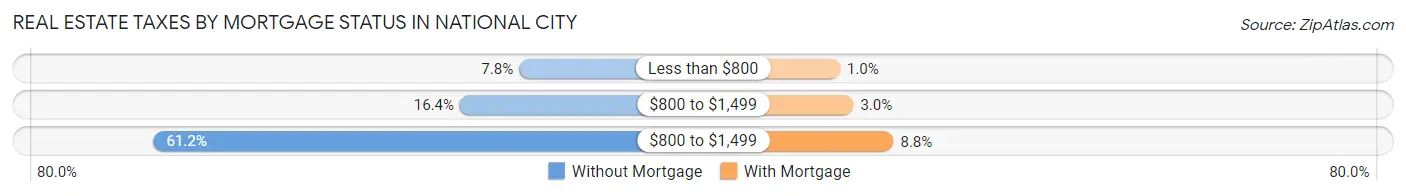
| Property Taxes | Without Mortgage | With Mortgage |
| Less than $800 | 148 (7.8%) | 39 (1.0%) |
| $800 to $1,499 | 313 (16.4%) | 114 (3.0%) |
| $800 to $1,499 | 1,167 (61.2%) | 337 (8.8%) |
| Total | 1,908 (100.0%) | 3,814 (100.0%) |
Health & Disability in National City
Health Insurance Coverage by Age in National City
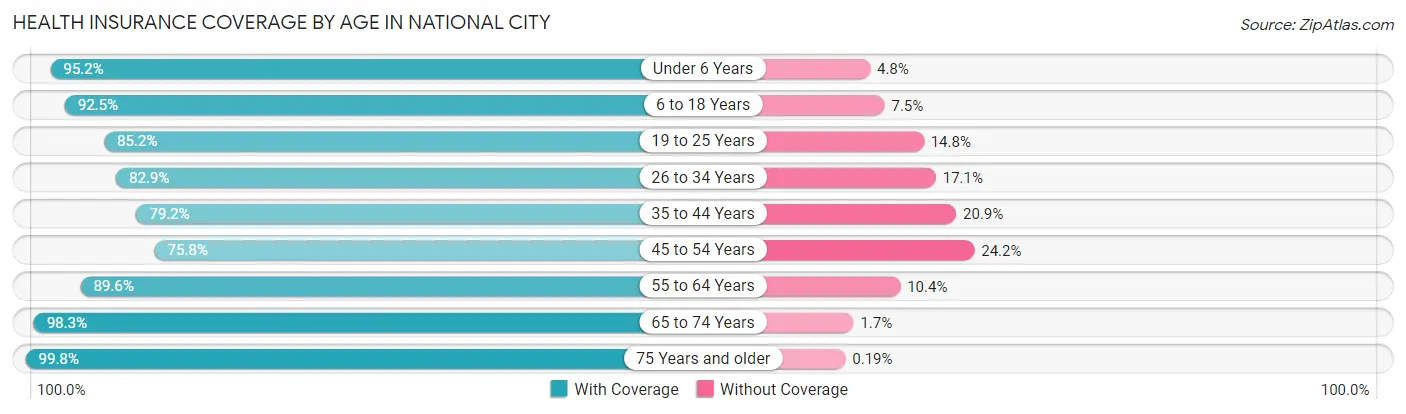
| Age Bracket | With Coverage | Without Coverage |
| Under 6 Years | 3,529 (95.2%) | 178 (4.8%) |
| 6 to 18 Years | 8,822 (92.5%) | 716 (7.5%) |
| 19 to 25 Years | 4,223 (85.2%) | 734 (14.8%) |
| 26 to 34 Years | 6,538 (82.9%) | 1,346 (17.1%) |
| 35 to 44 Years | 5,314 (79.1%) | 1,400 (20.8%) |
| 45 to 54 Years | 5,033 (75.8%) | 1,610 (24.2%) |
| 55 to 64 Years | 6,330 (89.6%) | 737 (10.4%) |
| 65 to 74 Years | 4,304 (98.3%) | 75 (1.7%) |
| 75 Years and older | 3,751 (99.8%) | 7 (0.2%) |
| Total | 47,844 (87.5%) | 6,803 (12.4%) |
Health Insurance Coverage by Citizenship Status in National City
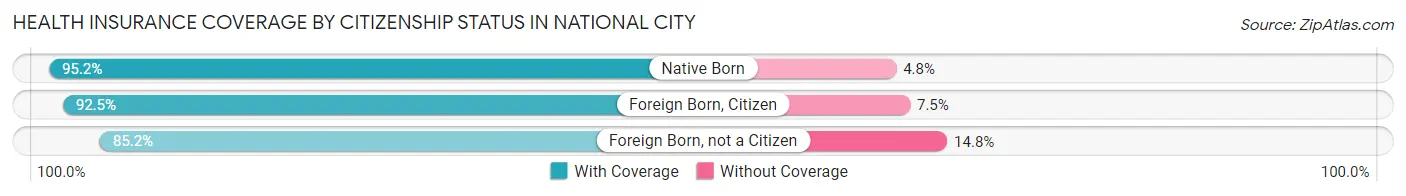
| Citizenship Status | With Coverage | Without Coverage |
| Native Born | 3,529 (95.2%) | 178 (4.8%) |
| Foreign Born, Citizen | 8,822 (92.5%) | 716 (7.5%) |
| Foreign Born, not a Citizen | 4,223 (85.2%) | 734 (14.8%) |
Health Insurance Coverage by Household Income in National City
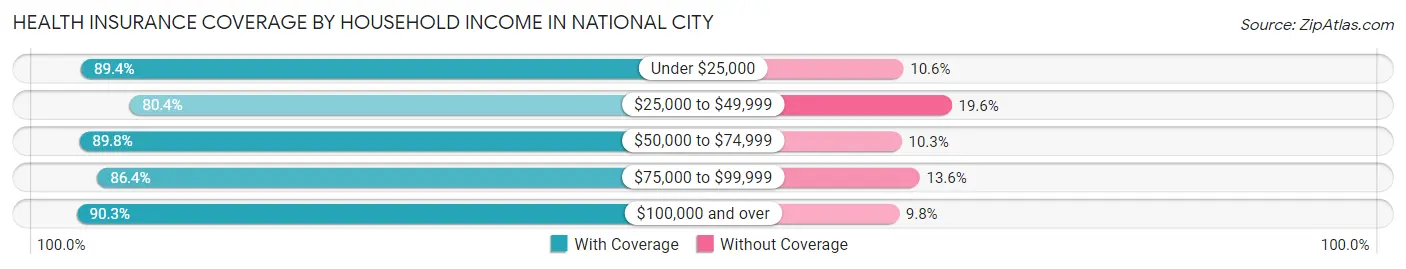
| Household Income | With Coverage | Without Coverage |
| Under $25,000 | 6,052 (89.4%) | 717 (10.6%) |
| $25,000 to $49,999 | 8,258 (80.4%) | 2,017 (19.6%) |
| $50,000 to $74,999 | 9,185 (89.7%) | 1,049 (10.2%) |
| $75,000 to $99,999 | 7,756 (86.4%) | 1,224 (13.6%) |
| $100,000 and over | 16,224 (90.2%) | 1,753 (9.8%) |
Public vs Private Health Insurance Coverage by Age in National City
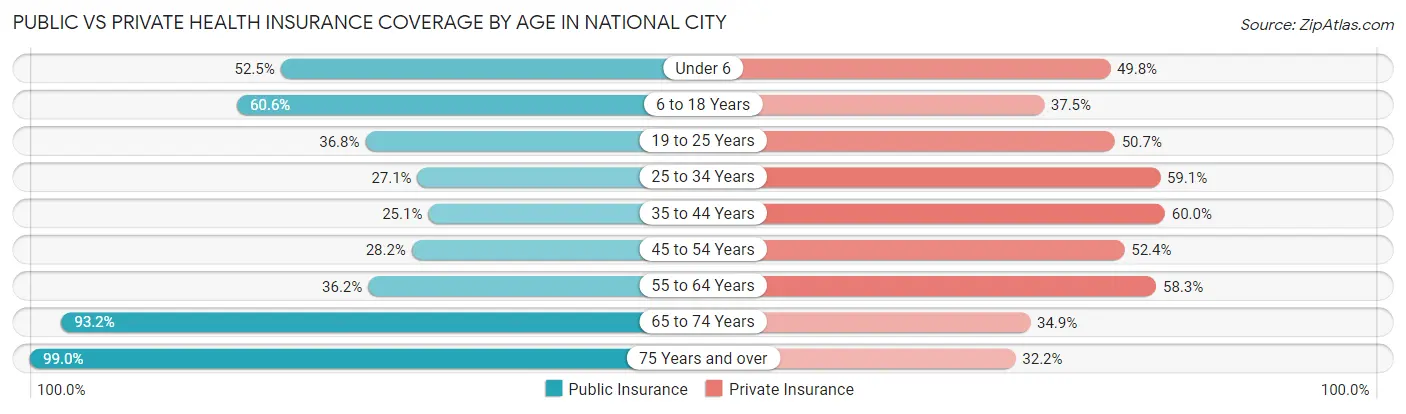
| Age Bracket | Public Insurance | Private Insurance |
| Under 6 | 1,946 (52.5%) | 1,845 (49.8%) |
| 6 to 18 Years | 5,778 (60.6%) | 3,577 (37.5%) |
| 19 to 25 Years | 1,822 (36.8%) | 2,511 (50.7%) |
| 25 to 34 Years | 2,135 (27.1%) | 4,656 (59.1%) |
| 35 to 44 Years | 1,684 (25.1%) | 4,025 (60.0%) |
| 45 to 54 Years | 1,870 (28.1%) | 3,483 (52.4%) |
| 55 to 64 Years | 2,561 (36.2%) | 4,122 (58.3%) |
| 65 to 74 Years | 4,080 (93.2%) | 1,530 (34.9%) |
| 75 Years and over | 3,719 (99.0%) | 1,211 (32.2%) |
| Total | 25,595 (46.8%) | 26,960 (49.3%) |
Disability Status by Sex by Age in National City
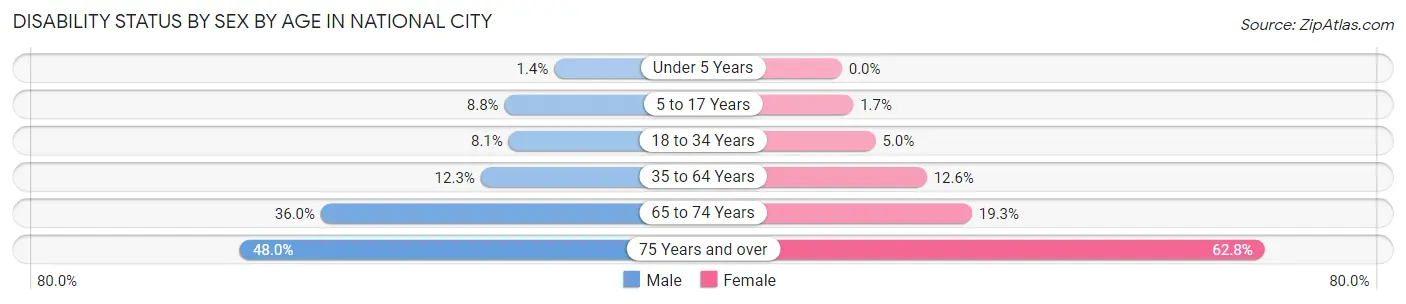
| Age Bracket | Male | Female |
| Under 5 Years | 21 (1.4%) | 0 (0.0%) |
| 5 to 17 Years | 426 (8.7%) | 79 (1.7%) |
| 18 to 34 Years | 530 (8.1%) | 349 (5.0%) |
| 35 to 64 Years | 1,243 (12.3%) | 1,299 (12.6%) |
| 65 to 74 Years | 650 (36.0%) | 497 (19.3%) |
| 75 Years and over | 567 (48.0%) | 1,618 (62.8%) |
Disability Class by Sex by Age in National City
Disability Class: Hearing Difficulty
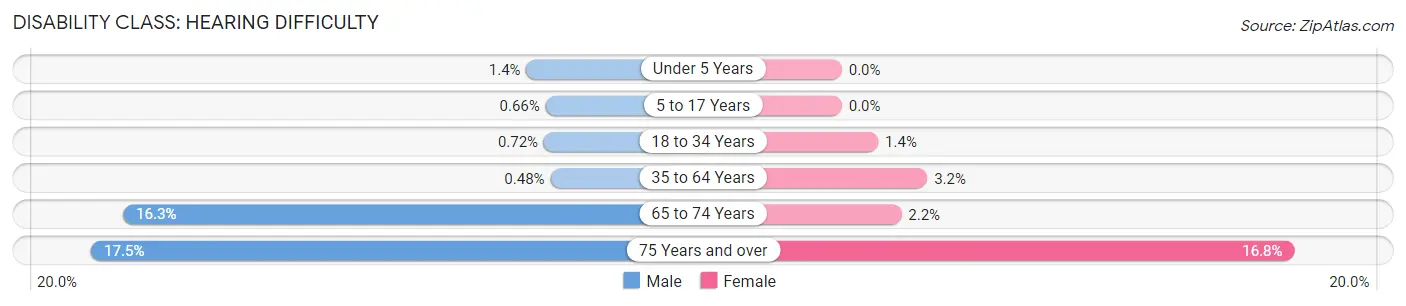
| Age Bracket | Male | Female |
| Under 5 Years | 21 (1.4%) | 0 (0.0%) |
| 5 to 17 Years | 32 (0.7%) | 0 (0.0%) |
| 18 to 34 Years | 47 (0.7%) | 94 (1.3%) |
| 35 to 64 Years | 49 (0.5%) | 327 (3.2%) |
| 65 to 74 Years | 295 (16.3%) | 57 (2.2%) |
| 75 Years and over | 207 (17.5%) | 433 (16.8%) |
Disability Class: Vision Difficulty
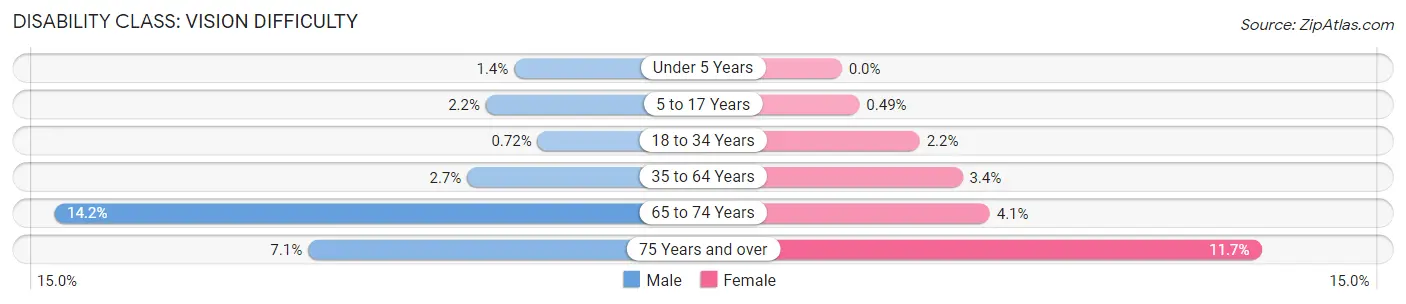
| Age Bracket | Male | Female |
| Under 5 Years | 21 (1.4%) | 0 (0.0%) |
| 5 to 17 Years | 105 (2.2%) | 23 (0.5%) |
| 18 to 34 Years | 47 (0.7%) | 151 (2.2%) |
| 35 to 64 Years | 271 (2.7%) | 346 (3.4%) |
| 65 to 74 Years | 256 (14.2%) | 106 (4.1%) |
| 75 Years and over | 84 (7.1%) | 301 (11.7%) |
Disability Class: Cognitive Difficulty
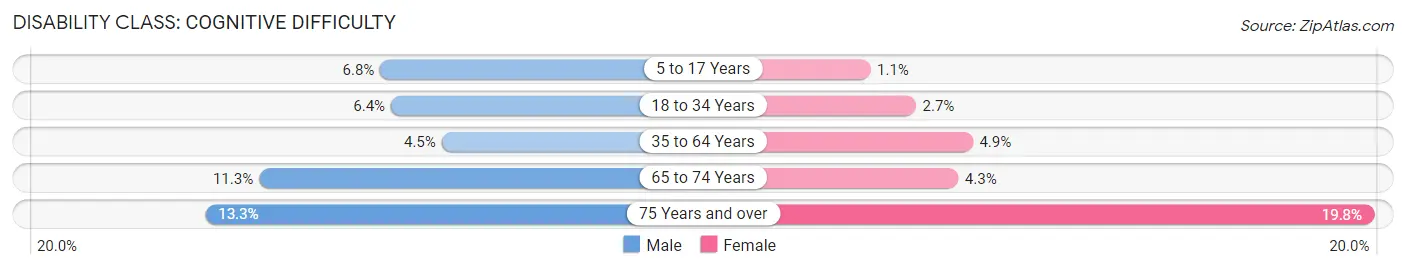
| Age Bracket | Male | Female |
| 5 to 17 Years | 331 (6.8%) | 49 (1.1%) |
| 18 to 34 Years | 417 (6.4%) | 191 (2.7%) |
| 35 to 64 Years | 458 (4.5%) | 500 (4.9%) |
| 65 to 74 Years | 204 (11.3%) | 111 (4.3%) |
| 75 Years and over | 157 (13.3%) | 509 (19.8%) |
Disability Class: Ambulatory Difficulty
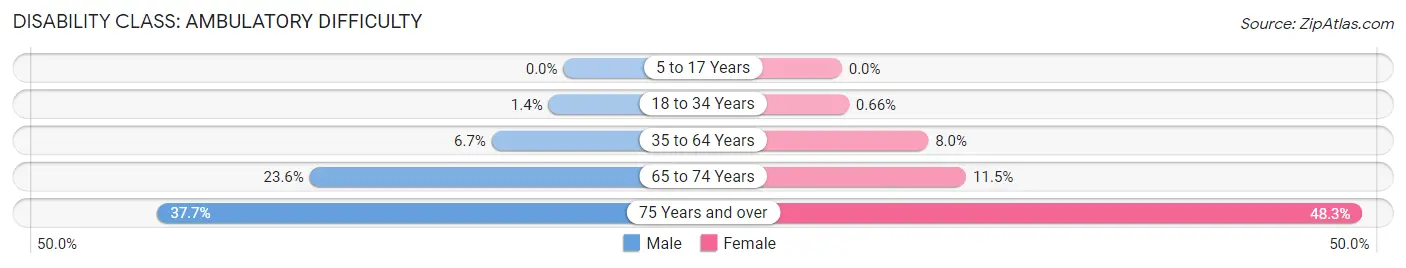
| Age Bracket | Male | Female |
| 5 to 17 Years | 0 (0.0%) | 0 (0.0%) |
| 18 to 34 Years | 90 (1.4%) | 46 (0.7%) |
| 35 to 64 Years | 673 (6.7%) | 826 (8.0%) |
| 65 to 74 Years | 425 (23.5%) | 297 (11.5%) |
| 75 Years and over | 445 (37.7%) | 1,245 (48.3%) |
Disability Class: Self-Care Difficulty
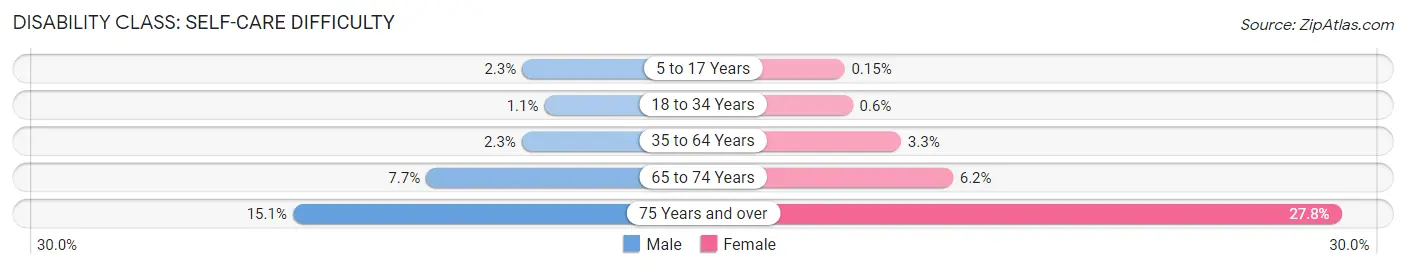
| Age Bracket | Male | Female |
| 5 to 17 Years | 112 (2.3%) | 7 (0.2%) |
| 18 to 34 Years | 69 (1.1%) | 42 (0.6%) |
| 35 to 64 Years | 235 (2.3%) | 339 (3.3%) |
| 65 to 74 Years | 138 (7.6%) | 159 (6.2%) |
| 75 Years and over | 178 (15.1%) | 717 (27.8%) |
Technology Access in National City
Computing Device Access in National City
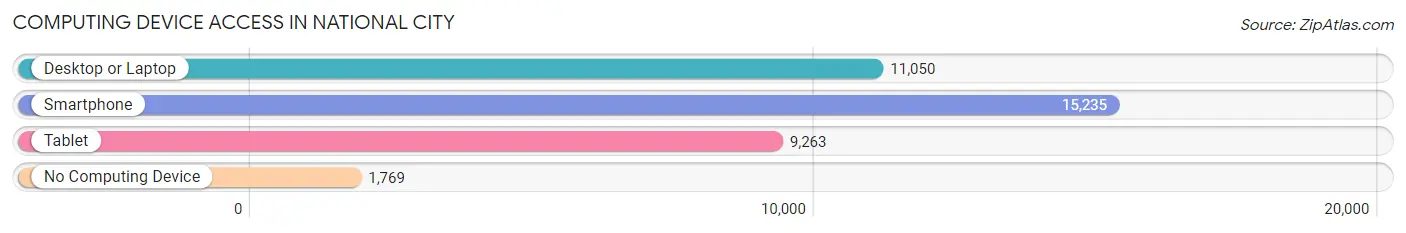
| Device Type | # Households | % Households |
| Desktop or Laptop | 11,050 | 63.4% |
| Smartphone | 15,235 | 87.4% |
| Tablet | 9,263 | 53.1% |
| No Computing Device | 1,769 | 10.1% |
| Total | 17,440 | 100.0% |
Internet Access in National City
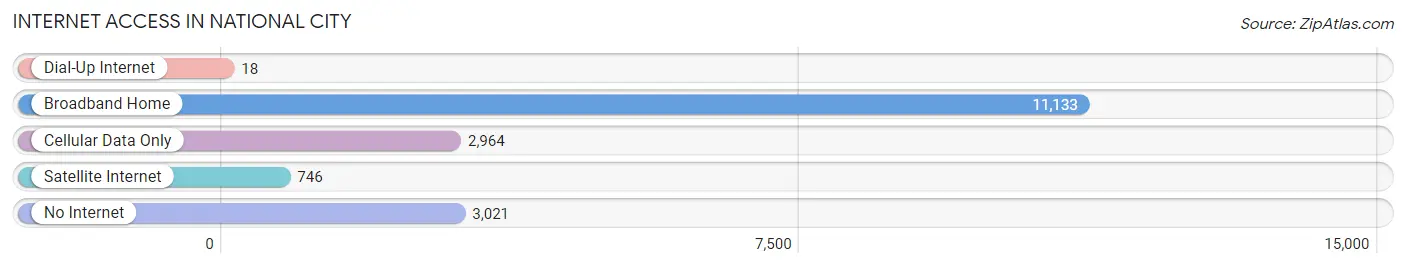
| Internet Type | # Households | % Households |
| Dial-Up Internet | 18 | 0.1% |
| Broadband Home | 11,133 | 63.8% |
| Cellular Data Only | 2,964 | 17.0% |
| Satellite Internet | 746 | 4.3% |
| No Internet | 3,021 | 17.3% |
| Total | 17,440 | 100.0% |
National City Summary
City of National City
National City is a city located in San Diego County, California, United States. It is located just south of San Diego and is part of the South Bay region of the San Diego metropolitan area. The population was 58,582 at the 2010 census, up from 54,260 at the 2000 census. With a population of over 60,000, National City is the second most populous city in San Diego County, after San Diego.
History
National City was founded in 1868 by developer Frank Kimball. He purchased the land from the former Rancho de la Nación, a Mexican land grant, and named it for the National City Company, a real estate development firm he founded with his brothers, Warren and Levi. The city was incorporated in 1887.
The city's economy was largely based on agriculture until the 1950s, when the military and defense industries began to move into the area. National City is now home to a number of military facilities, including the Naval Base San Diego, the Marine Corps Recruit Depot San Diego, and the Naval Air Station North Island.
Geography
National City is located at 32°40′15″N 117°5′34″W (32.6709, -117.0927). According to the United States Census Bureau, the city has a total area of 9.1 square miles (23.6 km2), all land.
National City is bounded by San Diego to the north and northeast, Bonita to the southeast, and Chula Vista to the south across the Sweetwater River. It is also bordered by unincorporated areas of San Diego County to the south and east, and by the city of Coronado to the west.
Economy
National City's economy is largely based on the military and defense industries, as well as tourism and retail. The city is home to a number of military facilities, including the Naval Base San Diego, the Marine Corps Recruit Depot San Diego, and the Naval Air Station North Island.
The city is also home to a number of retail and entertainment venues, including the Plaza Bonita Mall, the Mile of Cars, and the National City Mile of Cars. The city is also home to a number of restaurants, bars, and other entertainment venues.
Demographics
As of the 2010 census, there were 58,582 people, 19,467 households, and 13,012 families residing in the city. The population density was 6,421.3 people per square mile (2,478.2/km2). There were 20,726 housing units at an average density of 2,279.9 per square mile (882.2/km2). The racial makeup of the city was 43.2% White, 4.1% African American, 1.0% Native American, 8.5% Asian, 0.7% Pacific Islander, 34.6% from other races, and 7.9% from two or more races. Hispanic or Latino of any race were 66.1% of the population.
There were 19,467 households, out of which 37.2% had children under the age of 18 living with them, 43.2% were married couples living together, 17.4% had a female householder with no husband present, and 30.9% were non-families. 24.2% of all households were made up of individuals, and 8.4% had someone living alone who was 65 years of age or older. The average household size was 3.00 and the average family size was 3.51.
In the city, the population was spread out, with 28.3% under the age of 18, 10.2% from 18 to 24, 30.5% from 25 to 44, 19.9% from 45 to 64, and 11.1% who were 65 years of age or older. The median age was 32 years. For every 100 females, there were 94.1 males. For every 100 females age 18 and over, there were 90.7 males.
The median income for a household in the city was $45,735, and the median income for a family was $49,711. Males had a median income of $35,945 versus $30,858 for females. The per capita income for the city was $18,837. About 11.2% of families and 14.4% of the population were below the poverty line, including 19.2% of those under age 18 and 9.2% of those age 65 or over.
Common Questions
What is Per Capita Income in National City?
Per Capita income in National City is $25,574.
What is the Median Family Income in National City?
Median Family Income in National City is $64,630.
What is the Median Household income in National City?
Median Household Income in National City is $59,850.
What is Income or Wage Gap in National City?
Income or Wage Gap in National City is 20.9%.
Women in National City earn 79.1 cents for every dollar earned by a man.
What is Family Income Deficit in National City?
Family Income Deficit in National City is $10,941.
Families that are below poverty line in National City earn $10,941 less on average than the poverty threshold level.
What is Inequality or Gini Index in National City?
Inequality or Gini Index in National City is 0.44.
What is the Total Population of National City?
Total Population of National City is 56,345.
What is the Total Male Population of National City?
Total Male Population of National City is 27,181.
What is the Total Female Population of National City?
Total Female Population of National City is 29,164.
What is the Ratio of Males per 100 Females in National City?
There are 93.20 Males per 100 Females in National City.
What is the Ratio of Females per 100 Males in National City?
There are 107.30 Females per 100 Males in National City.
What is the Median Population Age in National City?
Median Population Age in National City is 36.0 Years.
What is the Average Family Size in National City
Average Family Size in National City is 3.7 People.
What is the Average Household Size in National City
Average Household Size in National City is 3.1 People.
How Large is the Labor Force in National City?
There are 28,873 People in the Labor Forcein in National City.
What is the Percentage of People in the Labor Force in National City?
63.7% of People are in the Labor Force in National City.
What is the Unemployment Rate in National City?
Unemployment Rate in National City is 8.4%.