Pittsburg, CA Map & Demographics
Pittsburg Map
Pittsburg Overview
$36,333
PER CAPITA INCOME
$105,261
AVG FAMILY INCOME
$98,408
AVG HOUSEHOLD INCOME
26.5%
WAGE / INCOME GAP [ % ]
73.5¢/ $1
WAGE / INCOME GAP [ $ ]
$10,587
FAMILY INCOME DEFICIT
0.41
INEQUALITY / GINI INDEX
76,419
TOTAL POPULATION
37,698
MALE POPULATION
38,721
FEMALE POPULATION
97.36
MALES / 100 FEMALES
102.71
FEMALES / 100 MALES
35.2
MEDIAN AGE
3.6
AVG FAMILY SIZE
3.3
AVG HOUSEHOLD SIZE
40,035
LABOR FORCE [ PEOPLE ]
65.4%
PERCENT IN LABOR FORCE
7.1%
UNEMPLOYMENT RATE
Pittsburg Zip Codes
Pittsburg Area Codes
Income in Pittsburg
Income Overview in Pittsburg
Per Capita Income in Pittsburg is $36,333, while median incomes of families and households are $105,261 and $98,408 respectively.
| Characteristic | Number | Measure |
| Per Capita Income | 76,419 | $36,333 |
| Median Family Income | 17,944 | $105,261 |
| Mean Family Income | 17,944 | $119,877 |
| Median Household Income | 23,254 | $98,408 |
| Mean Household Income | 23,254 | $115,945 |
| Income Deficit | 17,944 | $10,587 |
| Wage / Income Gap (%) | 76,419 | 26.54% |
| Wage / Income Gap ($) | 76,419 | 73.46¢ per $1 |
| Gini / Inequality Index | 76,419 | 0.41 |
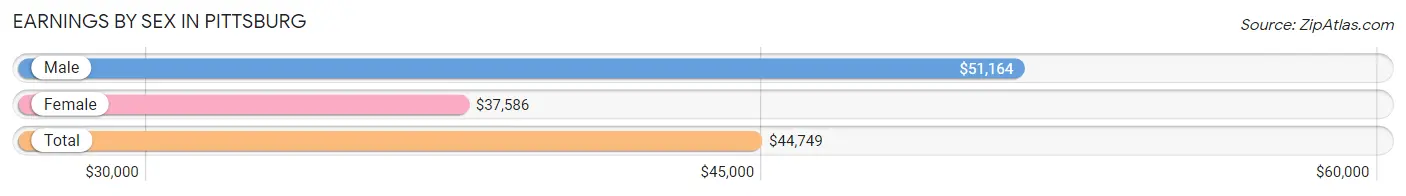
Earnings by Sex in Pittsburg
Average Earnings in Pittsburg are $44,749, $51,164 for men and $37,586 for women, a difference of 26.5%.
| Sex | Number | Average Earnings |
| Male | 20,918 (51.9%) | $51,164 |
| Female | 19,397 (48.1%) | $37,586 |
| Total | 40,315 (100.0%) | $44,749 |
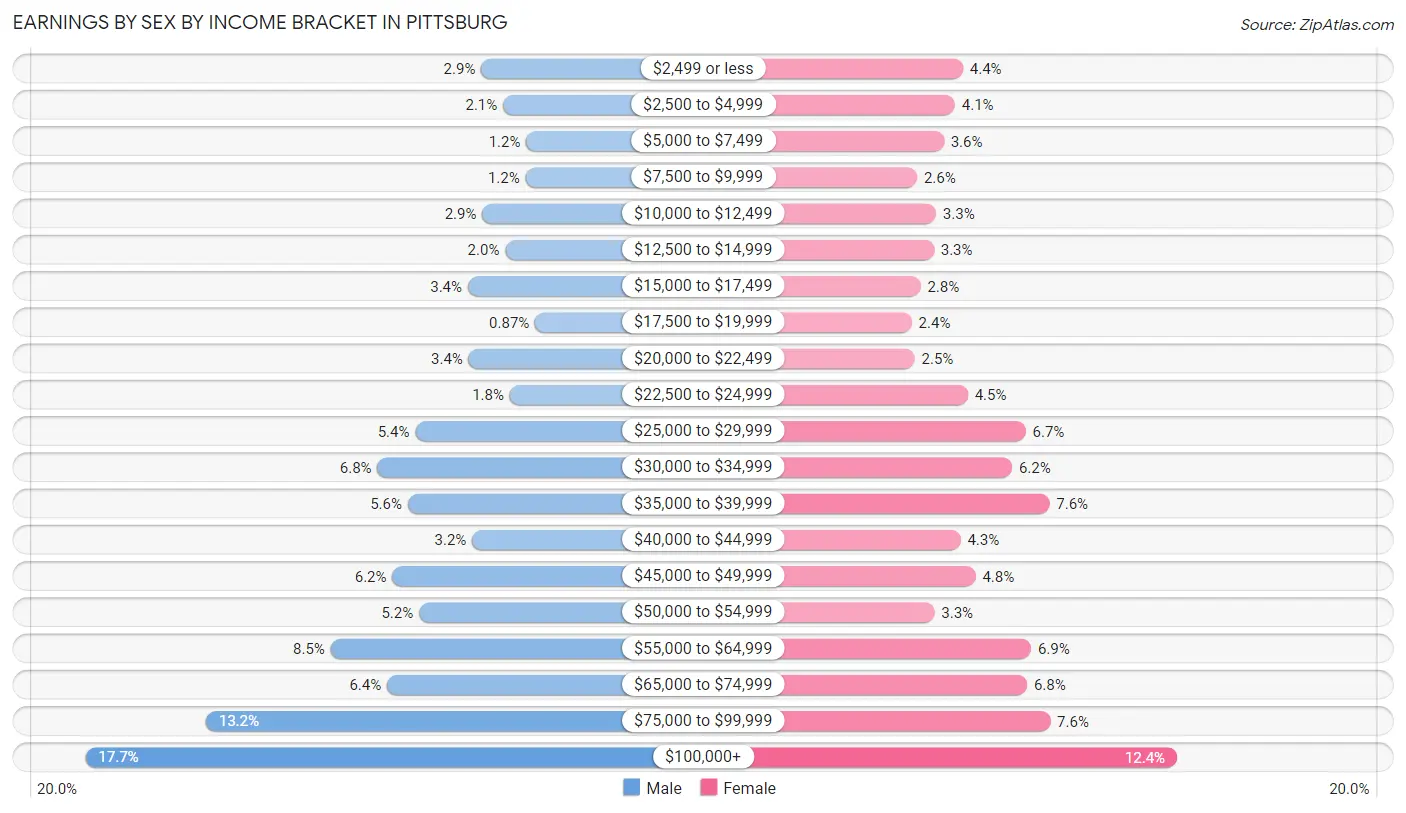
Earnings by Sex by Income Bracket in Pittsburg
The most common earnings brackets in Pittsburg are $100,000+ for men (3,707 | 17.7%) and $100,000+ for women (2,400 | 12.4%).
| Income | Male | Female |
| $2,499 or less | 604 (2.9%) | 843 (4.3%) |
| $2,500 to $4,999 | 434 (2.1%) | 785 (4.1%) |
| $5,000 to $7,499 | 250 (1.2%) | 704 (3.6%) |
| $7,500 to $9,999 | 257 (1.2%) | 510 (2.6%) |
| $10,000 to $12,499 | 597 (2.9%) | 647 (3.3%) |
| $12,500 to $14,999 | 417 (2.0%) | 632 (3.3%) |
| $15,000 to $17,499 | 710 (3.4%) | 536 (2.8%) |
| $17,500 to $19,999 | 181 (0.9%) | 472 (2.4%) |
| $20,000 to $22,499 | 702 (3.4%) | 492 (2.5%) |
| $22,500 to $24,999 | 381 (1.8%) | 878 (4.5%) |
| $25,000 to $29,999 | 1,121 (5.4%) | 1,300 (6.7%) |
| $30,000 to $34,999 | 1,418 (6.8%) | 1,200 (6.2%) |
| $35,000 to $39,999 | 1,180 (5.6%) | 1,473 (7.6%) |
| $40,000 to $44,999 | 676 (3.2%) | 827 (4.3%) |
| $45,000 to $49,999 | 1,302 (6.2%) | 935 (4.8%) |
| $50,000 to $54,999 | 1,091 (5.2%) | 637 (3.3%) |
| $55,000 to $64,999 | 1,784 (8.5%) | 1,338 (6.9%) |
| $65,000 to $74,999 | 1,343 (6.4%) | 1,310 (6.8%) |
| $75,000 to $99,999 | 2,763 (13.2%) | 1,478 (7.6%) |
| $100,000+ | 3,707 (17.7%) | 2,400 (12.4%) |
| Total | 20,918 (100.0%) | 19,397 (100.0%) |
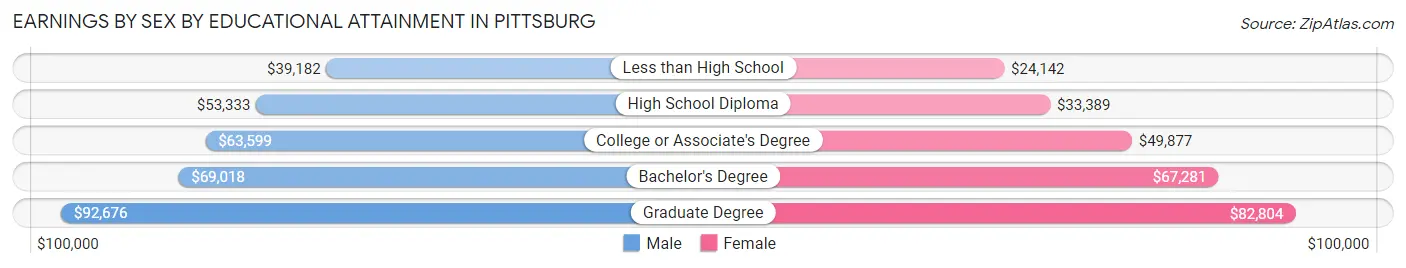
Earnings by Sex by Educational Attainment in Pittsburg
Average earnings in Pittsburg are $56,017 for men and $43,912 for women, a difference of 21.6%. Men with an educational attainment of graduate degree enjoy the highest average annual earnings of $92,676, while those with less than high school education earn the least with $39,182. Women with an educational attainment of graduate degree earn the most with the average annual earnings of $82,804, while those with less than high school education have the smallest earnings of $24,142.
| Educational Attainment | Male Income | Female Income |
| Less than High School | $39,182 | $24,142 |
| High School Diploma | $53,333 | $33,389 |
| College or Associate's Degree | $63,599 | $49,877 |
| Bachelor's Degree | $69,018 | $67,281 |
| Graduate Degree | $92,676 | $82,804 |
| Total | $56,017 | $43,912 |
Family Income in Pittsburg
Family Income Brackets in Pittsburg
According to the Pittsburg family income data, there are 4,647 families falling into the $100,000 to $149,999 income range, which is the most common income bracket and makes up 25.9% of all families. Conversely, the $10,000 to $14,999 income bracket is the least frequent group with only 323 families (1.8%) belonging to this category.
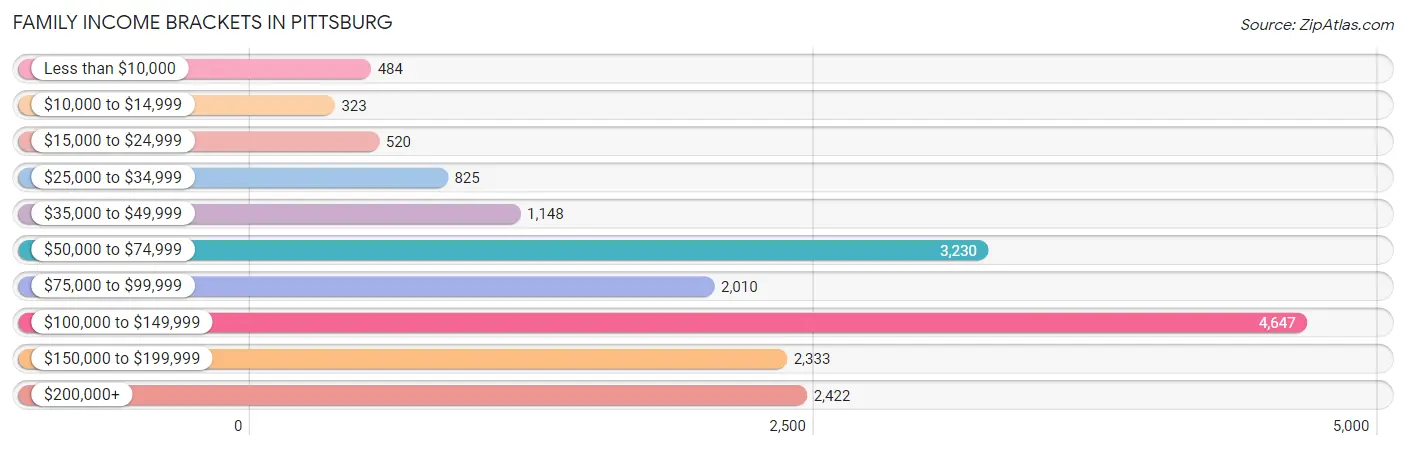
| Income Bracket | # Families | % Families |
| Less than $10,000 | 484 | 2.7% |
| $10,000 to $14,999 | 323 | 1.8% |
| $15,000 to $24,999 | 520 | 2.9% |
| $25,000 to $34,999 | 825 | 4.6% |
| $35,000 to $49,999 | 1,148 | 6.4% |
| $50,000 to $74,999 | 3,230 | 18.0% |
| $75,000 to $99,999 | 2,010 | 11.2% |
| $100,000 to $149,999 | 4,647 | 25.9% |
| $150,000 to $199,999 | 2,333 | 13.0% |
| $200,000+ | 2,422 | 13.5% |
Family Income by Famaliy Size in Pittsburg
7+ person families (945 | 5.3%) account for the highest median family income in Pittsburg with $153,472 per family, while 2-person families (6,232 | 34.7%) have the highest median income of $43,472 per family member.
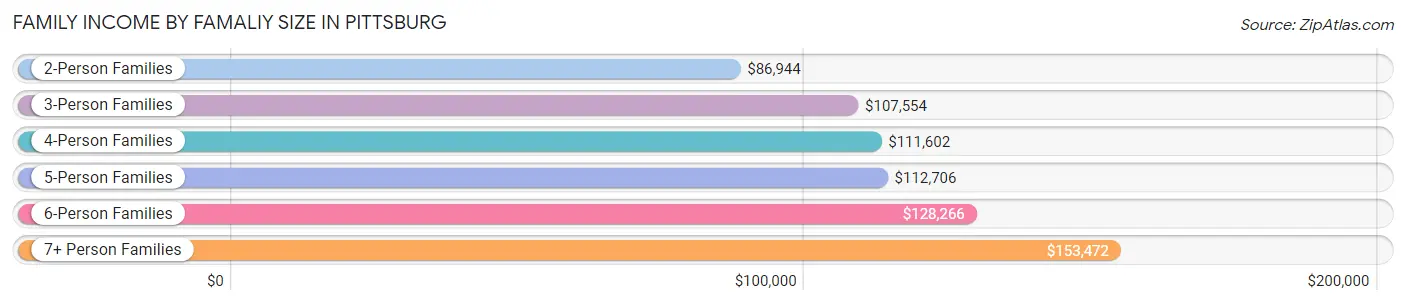
| Income Bracket | # Families | Median Income |
| 2-Person Families | 6,232 (34.7%) | $86,944 |
| 3-Person Families | 3,927 (21.9%) | $107,554 |
| 4-Person Families | 3,385 (18.9%) | $111,602 |
| 5-Person Families | 2,352 (13.1%) | $112,706 |
| 6-Person Families | 1,103 (6.1%) | $128,266 |
| 7+ Person Families | 945 (5.3%) | $153,472 |
| Total | 17,944 (100.0%) | $105,261 |
Family Income by Number of Earners in Pittsburg
The median family income in Pittsburg is $105,261, with families comprising 3+ earners (3,496) having the highest median family income of $164,355, while families with no earners (1,724) have the lowest median family income of $37,037, accounting for 19.5% and 9.6% of families, respectively.
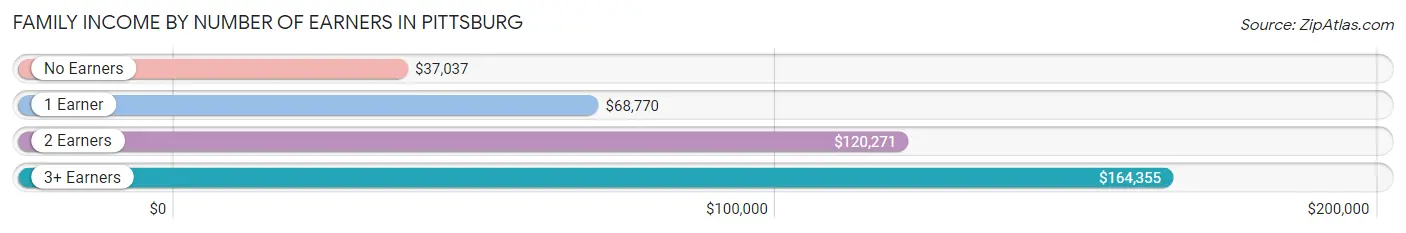
| Number of Earners | # Families | Median Income |
| No Earners | 1,724 (9.6%) | $37,037 |
| 1 Earner | 5,543 (30.9%) | $68,770 |
| 2 Earners | 7,181 (40.0%) | $120,271 |
| 3+ Earners | 3,496 (19.5%) | $164,355 |
| Total | 17,944 (100.0%) | $105,261 |
Household Income in Pittsburg
Household Income Brackets in Pittsburg
With 5,720 households falling in the category, the $100,000 to $149,999 income range is the most frequent in Pittsburg, accounting for 24.6% of all households. In contrast, only 721 households (3.1%) fall into the less than $10,000 income bracket, making it the least populous group.
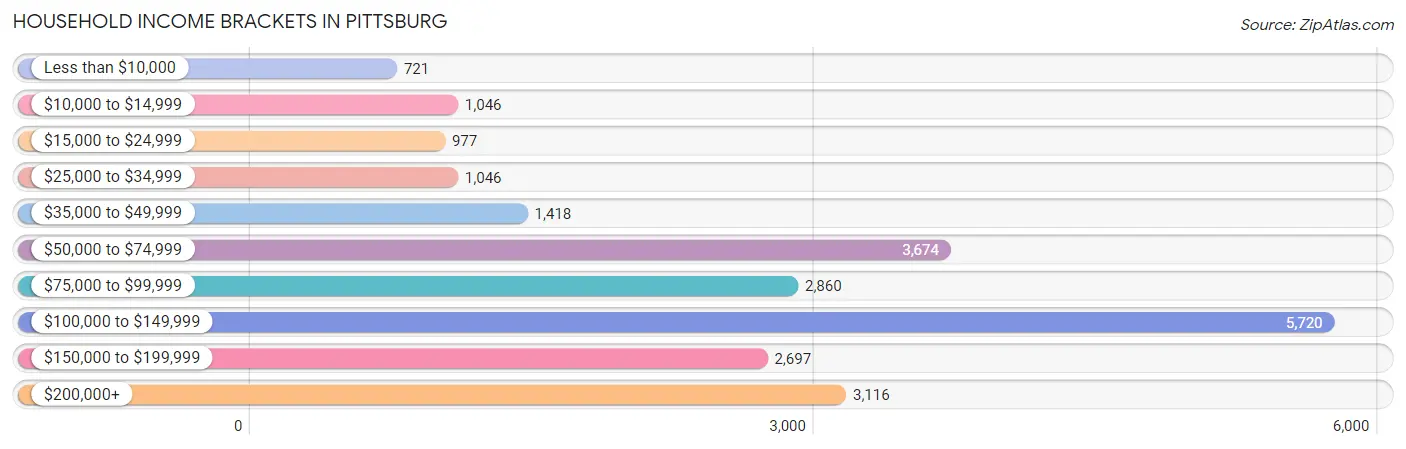
| Income Bracket | # Households | % Households |
| Less than $10,000 | 721 | 3.1% |
| $10,000 to $14,999 | 1,046 | 4.5% |
| $15,000 to $24,999 | 977 | 4.2% |
| $25,000 to $34,999 | 1,046 | 4.5% |
| $35,000 to $49,999 | 1,418 | 6.1% |
| $50,000 to $74,999 | 3,674 | 15.8% |
| $75,000 to $99,999 | 2,860 | 12.3% |
| $100,000 to $149,999 | 5,720 | 24.6% |
| $150,000 to $199,999 | 2,697 | 11.6% |
| $200,000+ | 3,116 | 13.4% |
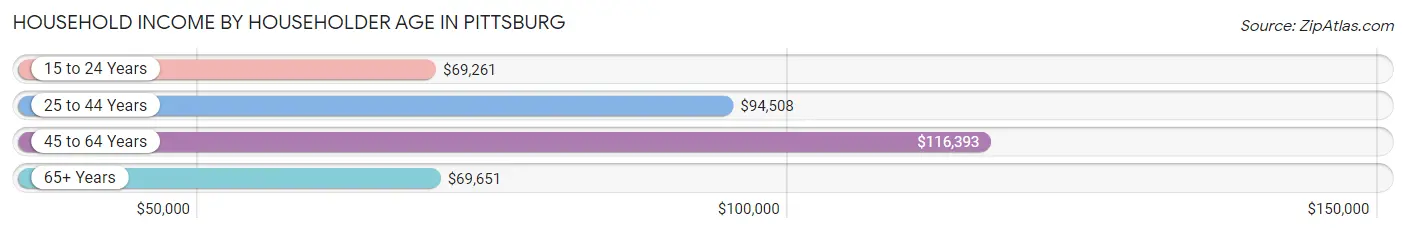
Household Income by Householder Age in Pittsburg
The median household income in Pittsburg is $98,408, with the highest median household income of $116,393 found in the 45 to 64 years age bracket for the primary householder. A total of 9,616 households (41.3%) fall into this category. Meanwhile, the 15 to 24 years age bracket for the primary householder has the lowest median household income of $69,261, with 804 households (3.5%) in this group.
| Income Bracket | # Households | Median Income |
| 15 to 24 Years | 804 (3.5%) | $69,261 |
| 25 to 44 Years | 7,887 (33.9%) | $94,508 |
| 45 to 64 Years | 9,616 (41.3%) | $116,393 |
| 65+ Years | 4,947 (21.3%) | $69,651 |
| Total | 23,254 (100.0%) | $98,408 |
Poverty in Pittsburg
Income Below Poverty by Sex and Age in Pittsburg
With 8.5% poverty level for males and 11.1% for females among the residents of Pittsburg, 12 to 14 year old males and 75 year old and over females are the most vulnerable to poverty, with 288 males (16.8%) and 499 females (21.3%) in their respective age groups living below the poverty level.
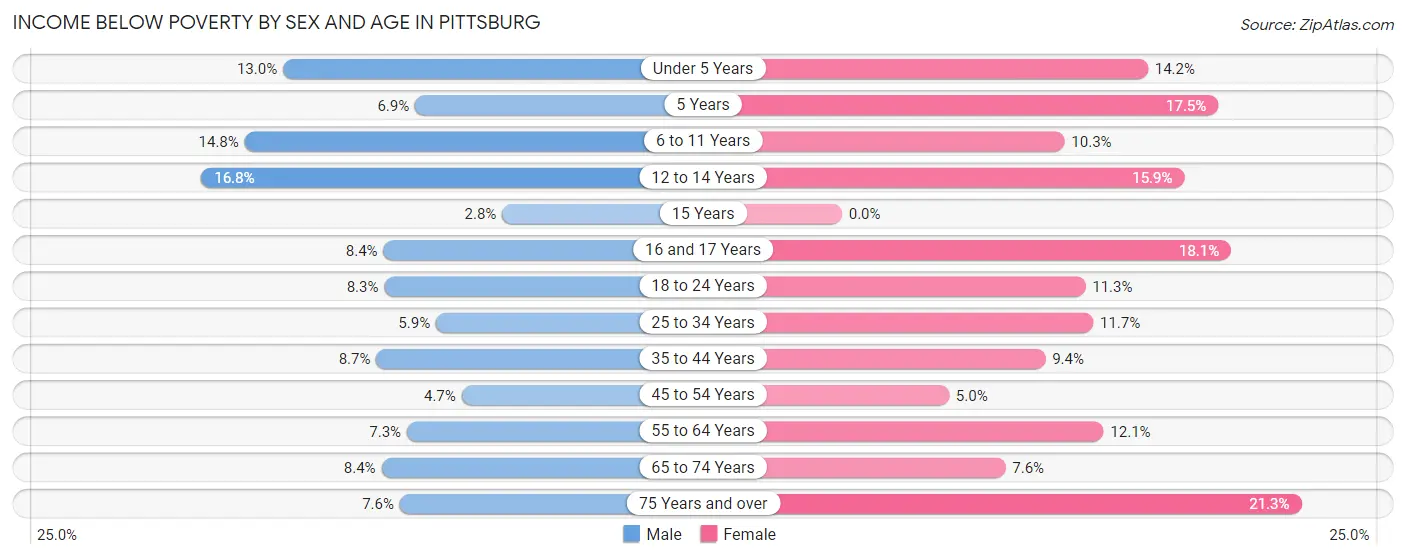
| Age Bracket | Male | Female |
| Under 5 Years | 360 (13.0%) | 313 (14.2%) |
| 5 Years | 19 (6.9%) | 70 (17.5%) |
| 6 to 11 Years | 426 (14.8%) | 263 (10.3%) |
| 12 to 14 Years | 288 (16.8%) | 163 (15.9%) |
| 15 Years | 11 (2.8%) | 0 (0.0%) |
| 16 and 17 Years | 78 (8.4%) | 221 (18.1%) |
| 18 to 24 Years | 335 (8.3%) | 467 (11.3%) |
| 25 to 34 Years | 376 (5.9%) | 710 (11.7%) |
| 35 to 44 Years | 440 (8.7%) | 496 (9.4%) |
| 45 to 54 Years | 222 (4.7%) | 226 (5.0%) |
| 55 to 64 Years | 304 (7.3%) | 574 (12.1%) |
| 65 to 74 Years | 241 (8.4%) | 257 (7.6%) |
| 75 Years and over | 89 (7.6%) | 499 (21.3%) |
| Total | 3,189 (8.5%) | 4,259 (11.1%) |
Income Above Poverty by Sex and Age in Pittsburg
According to the poverty statistics in Pittsburg, males aged 15 years and females aged 15 years are the age groups that are most secure financially, with 97.2% of males and 100.0% of females in these age groups living above the poverty line.
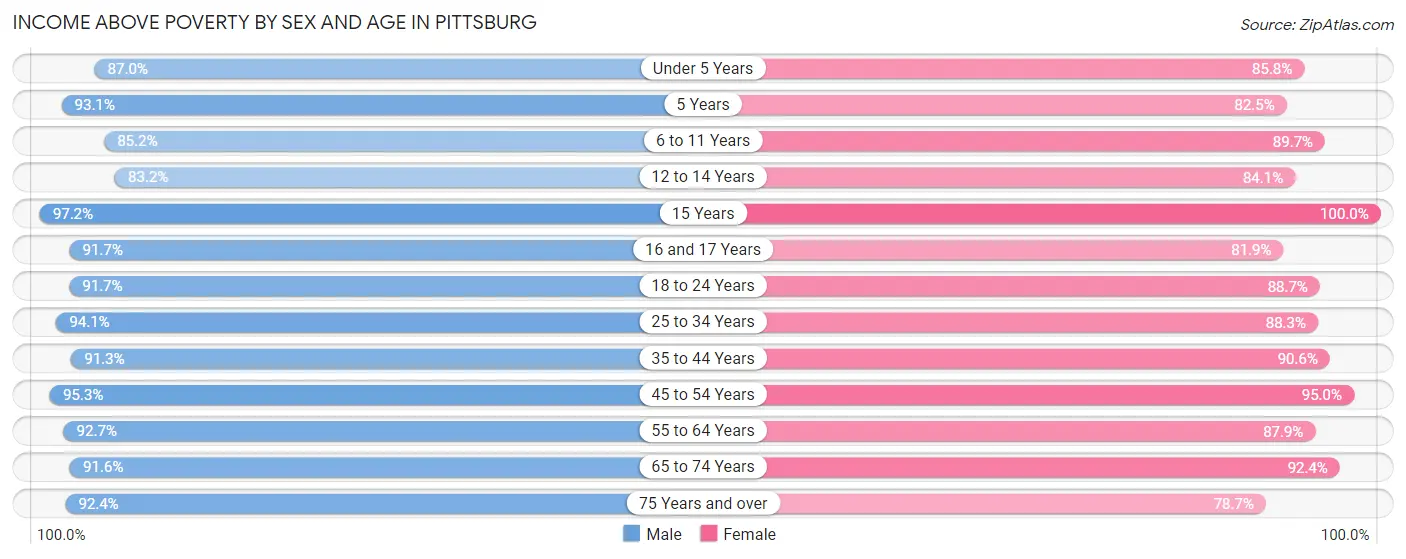
| Age Bracket | Male | Female |
| Under 5 Years | 2,408 (87.0%) | 1,892 (85.8%) |
| 5 Years | 257 (93.1%) | 331 (82.5%) |
| 6 to 11 Years | 2,455 (85.2%) | 2,282 (89.7%) |
| 12 to 14 Years | 1,426 (83.2%) | 863 (84.1%) |
| 15 Years | 376 (97.2%) | 388 (100.0%) |
| 16 and 17 Years | 856 (91.6%) | 1,003 (81.9%) |
| 18 to 24 Years | 3,694 (91.7%) | 3,665 (88.7%) |
| 25 to 34 Years | 5,984 (94.1%) | 5,381 (88.3%) |
| 35 to 44 Years | 4,628 (91.3%) | 4,756 (90.6%) |
| 45 to 54 Years | 4,481 (95.3%) | 4,324 (95.0%) |
| 55 to 64 Years | 3,885 (92.7%) | 4,155 (87.9%) |
| 65 to 74 Years | 2,614 (91.6%) | 3,128 (92.4%) |
| 75 Years and over | 1,083 (92.4%) | 1,842 (78.7%) |
| Total | 34,147 (91.5%) | 34,010 (88.9%) |
Income Below Poverty Among Married-Couple Families in Pittsburg
The poverty statistics for married-couple families in Pittsburg show that 4.3% or 528 of the total 12,208 families live below the poverty line. Families with 5 or more children have the highest poverty rate of 21.0%, comprising of 24 families. On the other hand, families with no children have the lowest poverty rate of 2.6%, which includes 163 families.
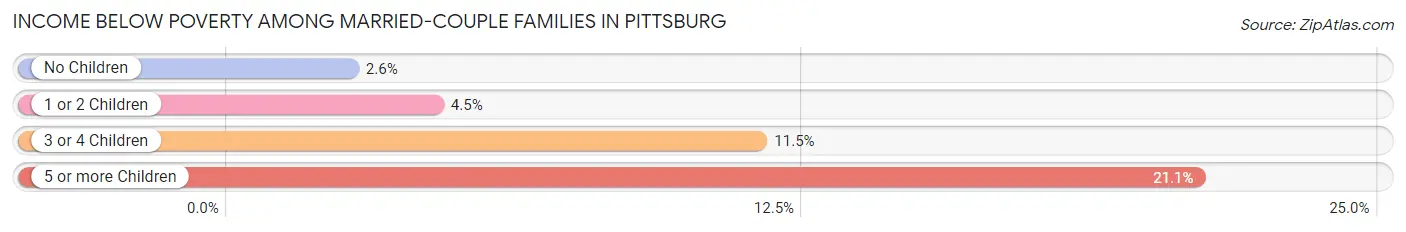
| Children | Above Poverty | Below Poverty |
| No Children | 6,037 (97.4%) | 163 (2.6%) |
| 1 or 2 Children | 4,585 (95.5%) | 215 (4.5%) |
| 3 or 4 Children | 968 (88.5%) | 126 (11.5%) |
| 5 or more Children | 90 (78.9%) | 24 (21.0%) |
| Total | 11,680 (95.7%) | 528 (4.3%) |
Income Below Poverty Among Single-Parent Households in Pittsburg
According to the poverty data in Pittsburg, 15.3% or 298 single-father households and 15.4% or 585 single-mother households are living below the poverty line. Among single-father households, those with 3 or 4 children have the highest poverty rate, with 49 households (39.8%) experiencing poverty. Likewise, among single-mother households, those with 3 or 4 children have the highest poverty rate, with 93 households (33.1%) falling below the poverty line.
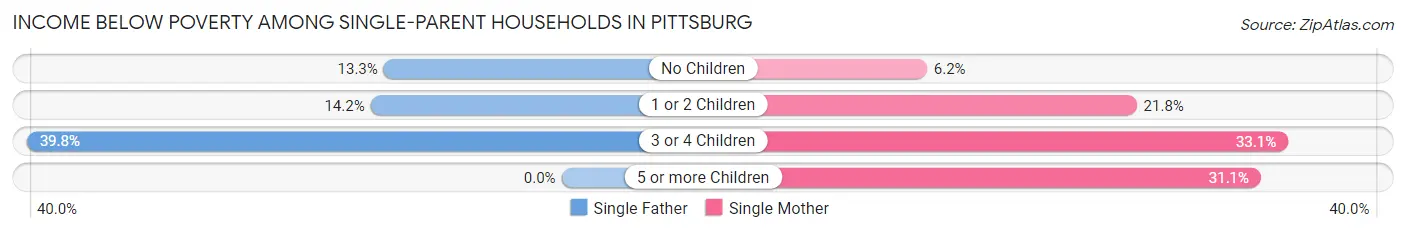
| Children | Single Father | Single Mother |
| No Children | 115 (13.3%) | 111 (6.2%) |
| 1 or 2 Children | 134 (14.2%) | 358 (21.8%) |
| 3 or 4 Children | 49 (39.8%) | 93 (33.1%) |
| 5 or more Children | 0 (0.0%) | 23 (31.1%) |
| Total | 298 (15.3%) | 585 (15.4%) |
Income Below Poverty Among Married-Couple vs Single-Parent Households in Pittsburg
The poverty data for Pittsburg shows that 528 of the married-couple family households (4.3%) and 883 of the single-parent households (15.4%) are living below the poverty level. Within the married-couple family households, those with 5 or more children have the highest poverty rate, with 24 households (21.0%) falling below the poverty line. Among the single-parent households, those with 3 or 4 children have the highest poverty rate, with 142 household (35.1%) living below poverty.
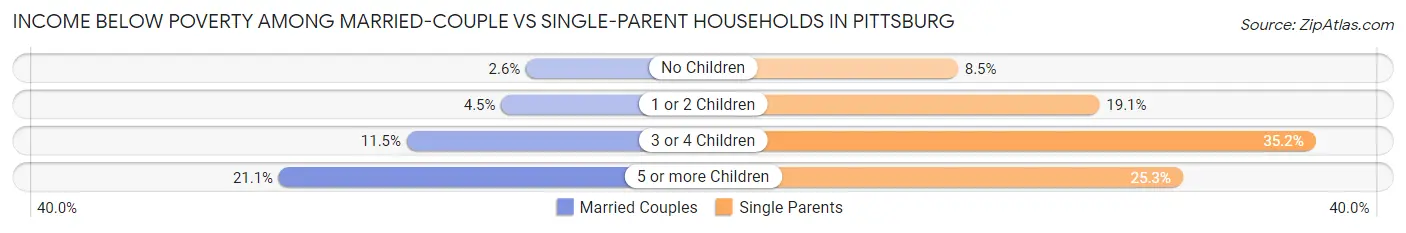
| Children | Married-Couple Families | Single-Parent Households |
| No Children | 163 (2.6%) | 226 (8.5%) |
| 1 or 2 Children | 215 (4.5%) | 492 (19.1%) |
| 3 or 4 Children | 126 (11.5%) | 142 (35.1%) |
| 5 or more Children | 24 (21.0%) | 23 (25.3%) |
| Total | 528 (4.3%) | 883 (15.4%) |
Race in Pittsburg
The most populous races in Pittsburg are Hispanic or Latino (32,985 | 43.2%), White / Caucasian (20,896 | 27.3%), and Some other Race (17,805 | 23.3%).
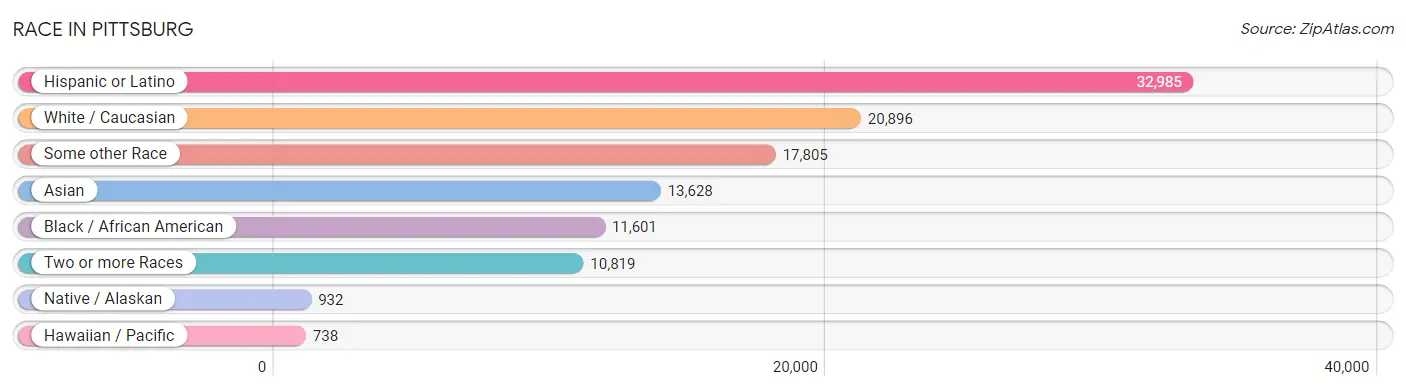
| Race | # Population | % Population |
| Asian | 13,628 | 17.8% |
| Black / African American | 11,601 | 15.2% |
| Hawaiian / Pacific | 738 | 1.0% |
| Hispanic or Latino | 32,985 | 43.2% |
| Native / Alaskan | 932 | 1.2% |
| White / Caucasian | 20,896 | 27.3% |
| Two or more Races | 10,819 | 14.2% |
| Some other Race | 17,805 | 23.3% |
| Total | 76,419 | 100.0% |
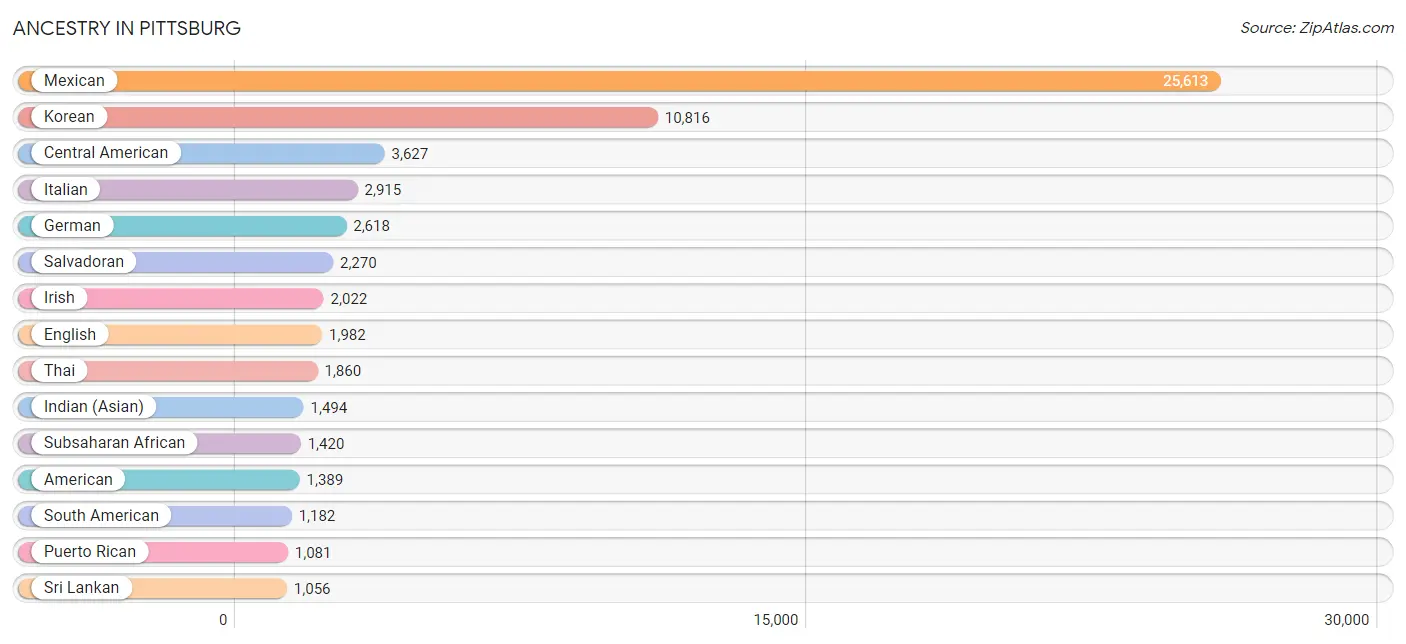
Ancestry in Pittsburg
The most populous ancestries reported in Pittsburg are Mexican (25,613 | 33.5%), Korean (10,816 | 14.1%), Central American (3,627 | 4.8%), Italian (2,915 | 3.8%), and German (2,618 | 3.4%), together accounting for 59.7% of all Pittsburg residents.
| Ancestry | # Population | % Population |
| Afghan | 262 | 0.3% |
| African | 560 | 0.7% |
| American | 1,389 | 1.8% |
| Apache | 131 | 0.2% |
| Arab | 866 | 1.1% |
| Argentinean | 14 | 0.0% |
| Armenian | 87 | 0.1% |
| Australian | 50 | 0.1% |
| Austrian | 103 | 0.1% |
| Belgian | 7 | 0.0% |
| Belizean | 80 | 0.1% |
| Bhutanese | 195 | 0.3% |
| Blackfeet | 70 | 0.1% |
| Brazilian | 3 | 0.0% |
| British | 121 | 0.2% |
| Bulgarian | 23 | 0.0% |
| Burmese | 86 | 0.1% |
| Canadian | 4 | 0.0% |
| Central American | 3,627 | 4.8% |
| Central American Indian | 173 | 0.2% |
| Cherokee | 314 | 0.4% |
| Choctaw | 25 | 0.0% |
| Colombian | 154 | 0.2% |
| Costa Rican | 28 | 0.0% |
| Creek | 106 | 0.1% |
| Croatian | 15 | 0.0% |
| Cuban | 217 | 0.3% |
| Czech | 57 | 0.1% |
| Danish | 102 | 0.1% |
| Dominican | 146 | 0.2% |
| Dutch | 278 | 0.4% |
| Dutch West Indian | 22 | 0.0% |
| Eastern European | 36 | 0.1% |
| Ecuadorian | 66 | 0.1% |
| Egyptian | 245 | 0.3% |
| English | 1,982 | 2.6% |
| Ethiopian | 73 | 0.1% |
| European | 788 | 1.0% |
| Filipino | 33 | 0.0% |
| Finnish | 53 | 0.1% |
| French | 784 | 1.0% |
| French Canadian | 17 | 0.0% |
| German | 2,618 | 3.4% |
| Greek | 119 | 0.2% |
| Guamanian / Chamorro | 21 | 0.0% |
| Guatemalan | 374 | 0.5% |
| Guyanese | 15 | 0.0% |
| Honduran | 75 | 0.1% |
| Houma | 6 | 0.0% |
| Hungarian | 165 | 0.2% |
| Icelander | 17 | 0.0% |
| Indian (Asian) | 1,494 | 2.0% |
| Indonesian | 26 | 0.0% |
| Iranian | 9 | 0.0% |
| Irish | 2,022 | 2.6% |
| Italian | 2,915 | 3.8% |
| Jamaican | 23 | 0.0% |
| Japanese | 58 | 0.1% |
| Jordanian | 27 | 0.0% |
| Kenyan | 184 | 0.2% |
| Korean | 10,816 | 14.1% |
| Laotian | 67 | 0.1% |
| Latvian | 37 | 0.1% |
| Liberian | 100 | 0.1% |
| Lithuanian | 53 | 0.1% |
| Malaysian | 177 | 0.2% |
| Maltese | 21 | 0.0% |
| Mexican | 25,613 | 33.5% |
| Mexican American Indian | 498 | 0.6% |
| Native Hawaiian | 213 | 0.3% |
| Navajo | 36 | 0.1% |
| Nepalese | 45 | 0.1% |
| Nicaraguan | 864 | 1.1% |
| Nigerian | 345 | 0.4% |
| Northern European | 25 | 0.0% |
| Norwegian | 377 | 0.5% |
| Pakistani | 19 | 0.0% |
| Palestinian | 59 | 0.1% |
| Pennsylvania German | 14 | 0.0% |
| Peruvian | 901 | 1.2% |
| Polish | 163 | 0.2% |
| Portuguese | 593 | 0.8% |
| Pueblo | 12 | 0.0% |
| Puerto Rican | 1,081 | 1.4% |
| Romanian | 13 | 0.0% |
| Russian | 133 | 0.2% |
| Salvadoran | 2,270 | 3.0% |
| Samoan | 112 | 0.2% |
| Scandinavian | 80 | 0.1% |
| Scotch-Irish | 219 | 0.3% |
| Scottish | 621 | 0.8% |
| Slovene | 73 | 0.1% |
| South American | 1,182 | 1.5% |
| South American Indian | 8 | 0.0% |
| Spaniard | 391 | 0.5% |
| Spanish | 203 | 0.3% |
| Sri Lankan | 1,056 | 1.4% |
| Subsaharan African | 1,420 | 1.9% |
| Sudanese | 20 | 0.0% |
| Swedish | 165 | 0.2% |
| Swiss | 118 | 0.2% |
| Thai | 1,860 | 2.4% |
| Tongan | 163 | 0.2% |
| Turkish | 172 | 0.2% |
| Ukrainian | 37 | 0.1% |
| Venezuelan | 11 | 0.0% |
| Welsh | 145 | 0.2% |
| West Indian | 20 | 0.0% |
| Yaqui | 9 | 0.0% |
| Yugoslavian | 16 | 0.0% | View All 110 Rows |
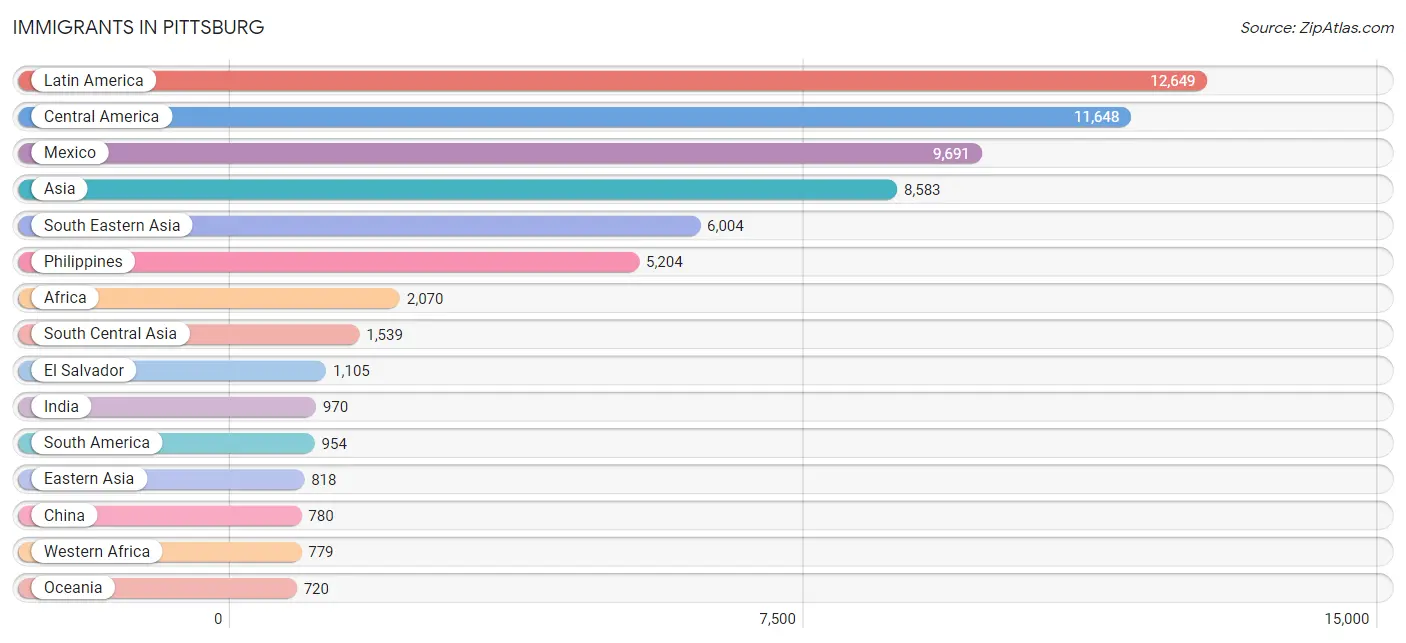
Immigrants in Pittsburg
The most numerous immigrant groups reported in Pittsburg came from Latin America (12,649 | 16.6%), Central America (11,648 | 15.2%), Mexico (9,691 | 12.7%), Asia (8,583 | 11.2%), and South Eastern Asia (6,004 | 7.9%), together accounting for 63.6% of all Pittsburg residents.
| Immigration Origin | # Population | % Population |
| Afghanistan | 373 | 0.5% |
| Africa | 2,070 | 2.7% |
| Asia | 8,583 | 11.2% |
| Australia | 72 | 0.1% |
| Brazil | 65 | 0.1% |
| Bulgaria | 7 | 0.0% |
| Cambodia | 10 | 0.0% |
| Cameroon | 146 | 0.2% |
| Canada | 29 | 0.0% |
| Caribbean | 47 | 0.1% |
| Central America | 11,648 | 15.2% |
| China | 780 | 1.0% |
| Colombia | 120 | 0.2% |
| Cuba | 16 | 0.0% |
| Dominican Republic | 8 | 0.0% |
| Eastern Africa | 564 | 0.7% |
| Eastern Asia | 818 | 1.1% |
| Eastern Europe | 145 | 0.2% |
| Ecuador | 66 | 0.1% |
| Egypt | 454 | 0.6% |
| El Salvador | 1,105 | 1.5% |
| England | 44 | 0.1% |
| Eritrea | 28 | 0.0% |
| Ethiopia | 22 | 0.0% |
| Europe | 461 | 0.6% |
| Fiji | 557 | 0.7% |
| Germany | 75 | 0.1% |
| Ghana | 15 | 0.0% |
| Guatemala | 378 | 0.5% |
| Guyana | 20 | 0.0% |
| Honduras | 48 | 0.1% |
| Hong Kong | 50 | 0.1% |
| Hungary | 57 | 0.1% |
| India | 970 | 1.3% |
| Indonesia | 23 | 0.0% |
| Iran | 14 | 0.0% |
| Ireland | 19 | 0.0% |
| Italy | 5 | 0.0% |
| Jamaica | 23 | 0.0% |
| Japan | 14 | 0.0% |
| Jordan | 27 | 0.0% |
| Kenya | 212 | 0.3% |
| Korea | 24 | 0.0% |
| Kuwait | 43 | 0.1% |
| Laos | 89 | 0.1% |
| Latin America | 12,649 | 16.6% |
| Liberia | 167 | 0.2% |
| Malaysia | 53 | 0.1% |
| Mexico | 9,691 | 12.7% |
| Middle Africa | 146 | 0.2% |
| Nepal | 96 | 0.1% |
| Nicaragua | 395 | 0.5% |
| Nigeria | 583 | 0.8% |
| Northern Africa | 477 | 0.6% |
| Northern Europe | 187 | 0.2% |
| Oceania | 720 | 0.9% |
| Pakistan | 86 | 0.1% |
| Panama | 31 | 0.0% |
| Peru | 675 | 0.9% |
| Philippines | 5,204 | 6.8% |
| Poland | 30 | 0.0% |
| Portugal | 33 | 0.0% |
| Russia | 32 | 0.0% |
| Saudi Arabia | 16 | 0.0% |
| Scotland | 53 | 0.1% |
| Sierra Leone | 14 | 0.0% |
| Singapore | 17 | 0.0% |
| South Africa | 104 | 0.1% |
| South America | 954 | 1.3% |
| South Central Asia | 1,539 | 2.0% |
| South Eastern Asia | 6,004 | 7.9% |
| Southern Europe | 38 | 0.1% |
| Sudan | 23 | 0.0% |
| Switzerland | 16 | 0.0% |
| Taiwan | 64 | 0.1% |
| Thailand | 26 | 0.0% |
| Turkey | 12 | 0.0% |
| Uganda | 207 | 0.3% |
| Ukraine | 19 | 0.0% |
| Venezuela | 8 | 0.0% |
| Vietnam | 573 | 0.7% |
| Western Africa | 779 | 1.0% |
| Western Asia | 166 | 0.2% |
| Western Europe | 91 | 0.1% |
| Yemen | 68 | 0.1% | View All 85 Rows |
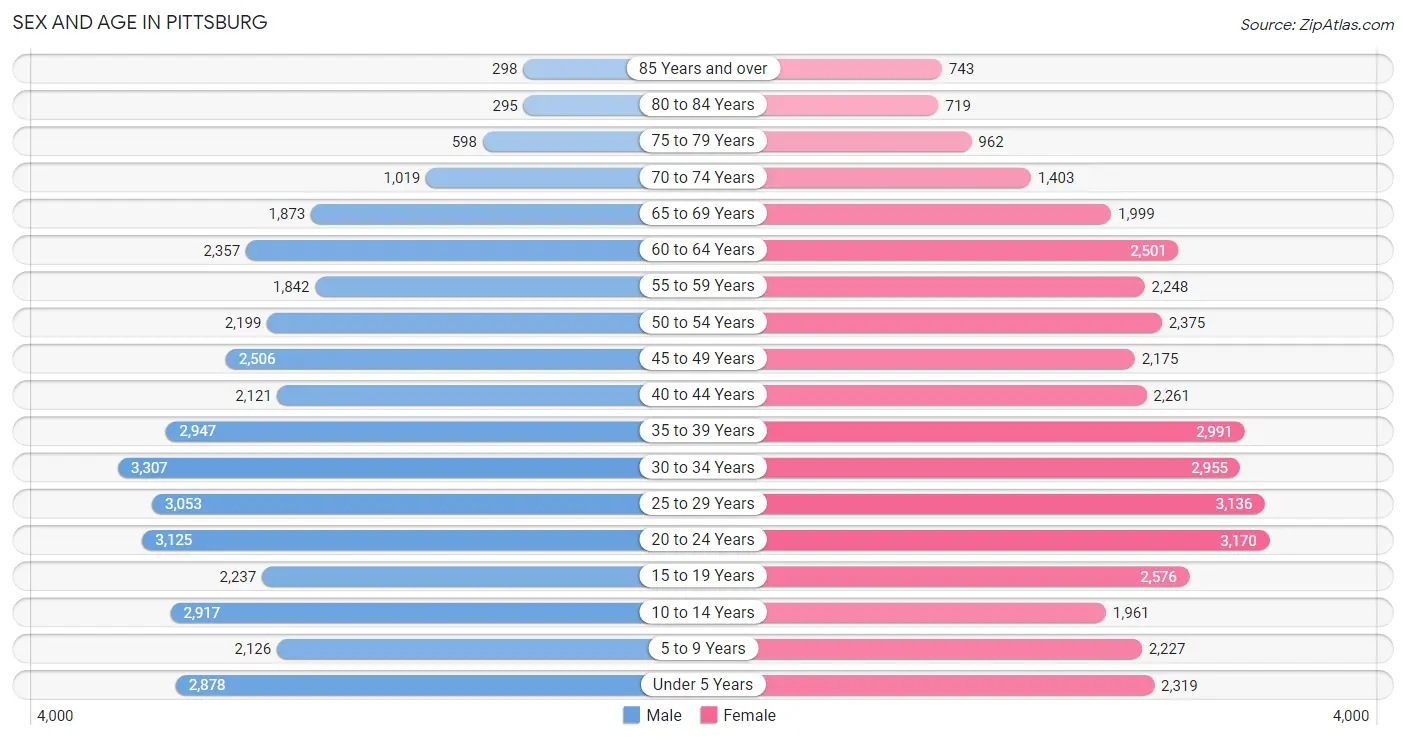
Sex and Age in Pittsburg
Sex and Age in Pittsburg
The most populous age groups in Pittsburg are 30 to 34 Years (3,307 | 8.8%) for men and 20 to 24 Years (3,170 | 8.2%) for women.
| Age Bracket | Male | Female |
| Under 5 Years | 2,878 (7.6%) | 2,319 (6.0%) |
| 5 to 9 Years | 2,126 (5.6%) | 2,227 (5.8%) |
| 10 to 14 Years | 2,917 (7.7%) | 1,961 (5.1%) |
| 15 to 19 Years | 2,237 (5.9%) | 2,576 (6.7%) |
| 20 to 24 Years | 3,125 (8.3%) | 3,170 (8.2%) |
| 25 to 29 Years | 3,053 (8.1%) | 3,136 (8.1%) |
| 30 to 34 Years | 3,307 (8.8%) | 2,955 (7.6%) |
| 35 to 39 Years | 2,947 (7.8%) | 2,991 (7.7%) |
| 40 to 44 Years | 2,121 (5.6%) | 2,261 (5.8%) |
| 45 to 49 Years | 2,506 (6.7%) | 2,175 (5.6%) |
| 50 to 54 Years | 2,199 (5.8%) | 2,375 (6.1%) |
| 55 to 59 Years | 1,842 (4.9%) | 2,248 (5.8%) |
| 60 to 64 Years | 2,357 (6.2%) | 2,501 (6.5%) |
| 65 to 69 Years | 1,873 (5.0%) | 1,999 (5.2%) |
| 70 to 74 Years | 1,019 (2.7%) | 1,403 (3.6%) |
| 75 to 79 Years | 598 (1.6%) | 962 (2.5%) |
| 80 to 84 Years | 295 (0.8%) | 719 (1.9%) |
| 85 Years and over | 298 (0.8%) | 743 (1.9%) |
| Total | 37,698 (100.0%) | 38,721 (100.0%) |
Families and Households in Pittsburg
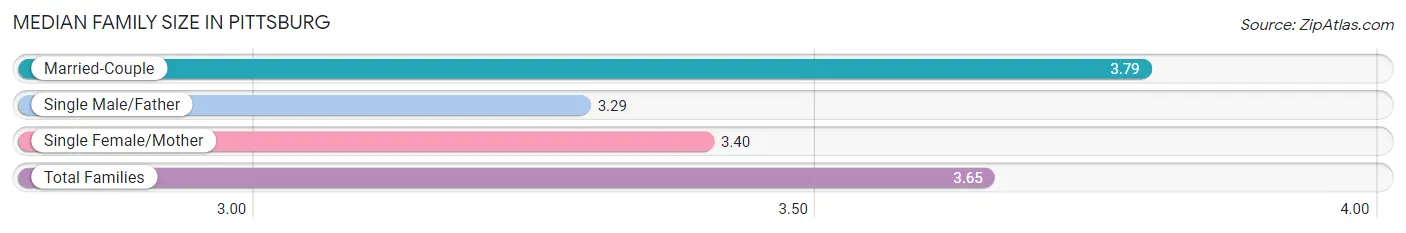
Median Family Size in Pittsburg
The median family size in Pittsburg is 3.65 persons per family, with married-couple families (12,208 | 68.0%) accounting for the largest median family size of 3.79 persons per family. On the other hand, single male/father families (1,950 | 10.9%) represent the smallest median family size with 3.29 persons per family.
| Family Type | # Families | Family Size |
| Married-Couple | 12,208 (68.0%) | 3.79 |
| Single Male/Father | 1,950 (10.9%) | 3.29 |
| Single Female/Mother | 3,786 (21.1%) | 3.40 |
| Total Families | 17,944 (100.0%) | 3.65 |
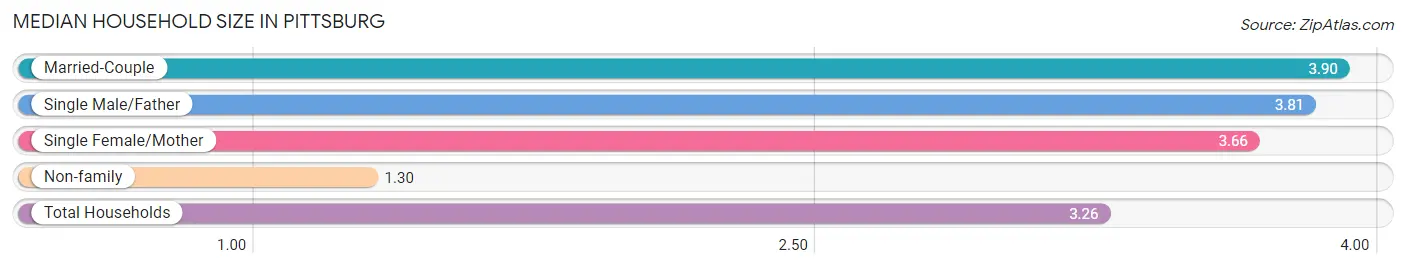
Median Household Size in Pittsburg
The median household size in Pittsburg is 3.26 persons per household, with married-couple households (12,208 | 52.5%) accounting for the largest median household size of 3.9 persons per household. non-family households (5,310 | 22.8%) represent the smallest median household size with 1.30 persons per household.
| Household Type | # Households | Household Size |
| Married-Couple | 12,208 (52.5%) | 3.90 |
| Single Male/Father | 1,950 (8.4%) | 3.81 |
| Single Female/Mother | 3,786 (16.3%) | 3.66 |
| Non-family | 5,310 (22.8%) | 1.30 |
| Total Households | 23,254 (100.0%) | 3.26 |
Household Size by Marriage Status in Pittsburg
Out of a total of 23,254 households in Pittsburg, 17,944 (77.2%) are family households, while 5,310 (22.8%) are nonfamily households. The most numerous type of family households are 2-person households, comprising 5,362, and the most common type of nonfamily households are 1-person households, comprising 4,015.
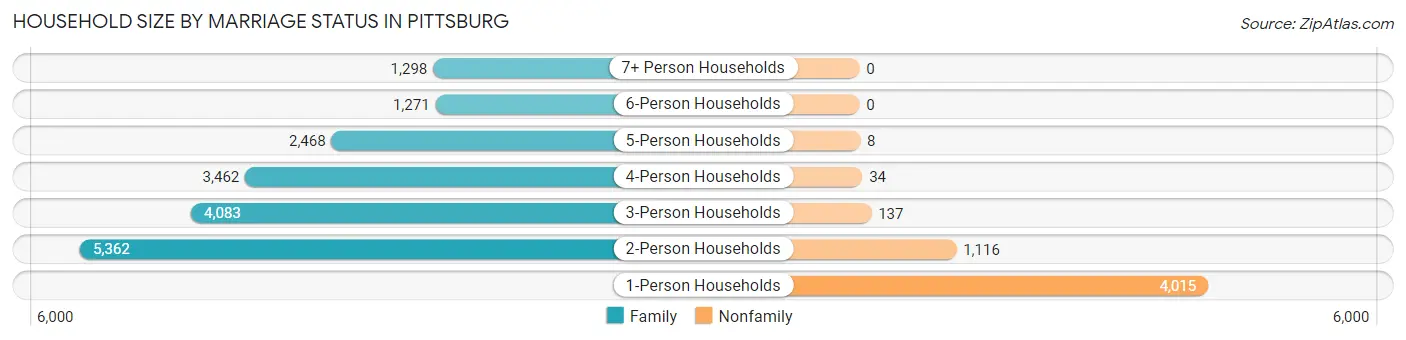
| Household Size | Family Households | Nonfamily Households |
| 1-Person Households | - | 4,015 (17.3%) |
| 2-Person Households | 5,362 (23.1%) | 1,116 (4.8%) |
| 3-Person Households | 4,083 (17.6%) | 137 (0.6%) |
| 4-Person Households | 3,462 (14.9%) | 34 (0.2%) |
| 5-Person Households | 2,468 (10.6%) | 8 (0.0%) |
| 6-Person Households | 1,271 (5.5%) | 0 (0.0%) |
| 7+ Person Households | 1,298 (5.6%) | 0 (0.0%) |
| Total | 17,944 (77.2%) | 5,310 (22.8%) |
Female Fertility in Pittsburg
Fertility by Age in Pittsburg
Average fertility rate in Pittsburg is 58.0 births per 1,000 women. Women in the age bracket of 20 to 34 years have the highest fertility rate with 75.0 births per 1,000 women. Women in the age bracket of 20 to 34 years acount for 60.9% of all women with births.
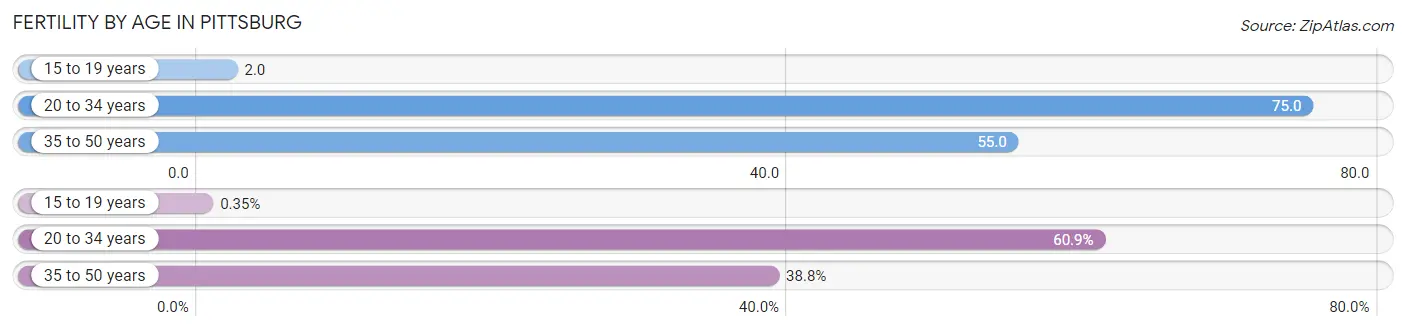
| Age Bracket | Women with Births | Births / 1,000 Women |
| 15 to 19 years | 4 (0.4%) | 2.0 |
| 20 to 34 years | 696 (60.9%) | 75.0 |
| 35 to 50 years | 443 (38.8%) | 55.0 |
| Total | 1,143 (100.0%) | 58.0 |
Fertility by Age by Marriage Status in Pittsburg
72.6% of women with births (1,143) in Pittsburg are married. The highest percentage of unmarried women with births falls into 15 to 19 years age bracket with 100.0% of them unmarried at the time of birth, while the lowest percentage of unmarried women with births belong to 35 to 50 years age bracket with 9.3% of them unmarried.
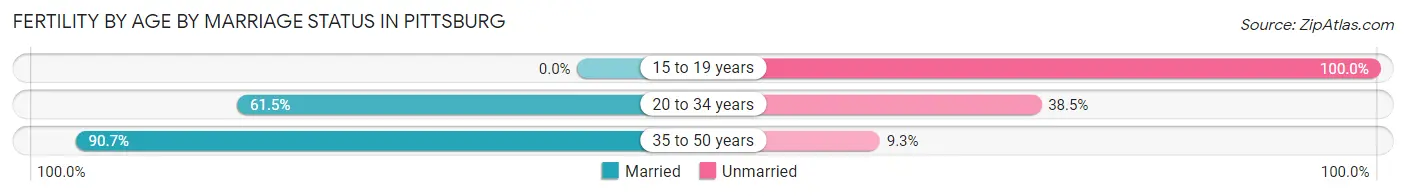
| Age Bracket | Married | Unmarried |
| 15 to 19 years | 0 (0.0%) | 4 (100.0%) |
| 20 to 34 years | 428 (61.5%) | 268 (38.5%) |
| 35 to 50 years | 402 (90.7%) | 41 (9.3%) |
| Total | 830 (72.6%) | 313 (27.4%) |
Fertility by Education in Pittsburg
Average fertility rate in Pittsburg is 58.0 births per 1,000 women. Women with the education attainment of less than high school have the highest fertility rate of 91.0 births per 1,000 women, while women with the education attainment of high school diploma have the lowest fertility at 20.0 births per 1,000 women. Women with the education attainment of less than high school represent 34.0% of all women with births.
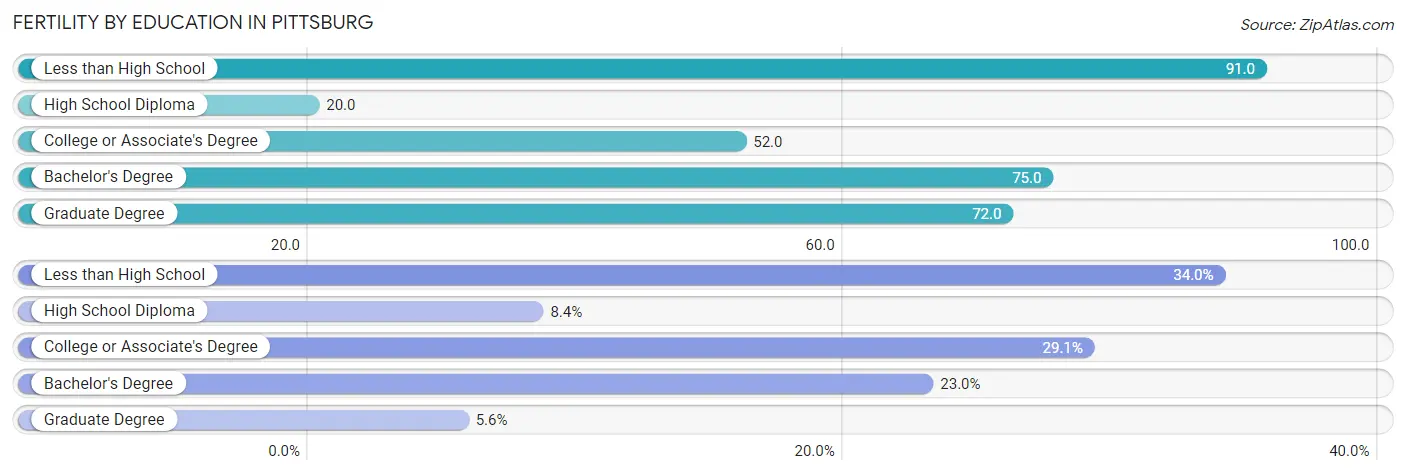
| Educational Attainment | Women with Births | Births / 1,000 Women |
| Less than High School | 388 (34.0%) | 91.0 |
| High School Diploma | 96 (8.4%) | 20.0 |
| College or Associate's Degree | 332 (29.0%) | 52.0 |
| Bachelor's Degree | 263 (23.0%) | 75.0 |
| Graduate Degree | 64 (5.6%) | 72.0 |
| Total | 1,143 (100.0%) | 58.0 |
Fertility by Education by Marriage Status in Pittsburg
27.4% of women with births in Pittsburg are unmarried. Women with the educational attainment of graduate degree are most likely to be married with 100.0% of them married at childbirth, while women with the educational attainment of high school diploma are least likely to be married with 62.5% of them unmarried at childbirth.
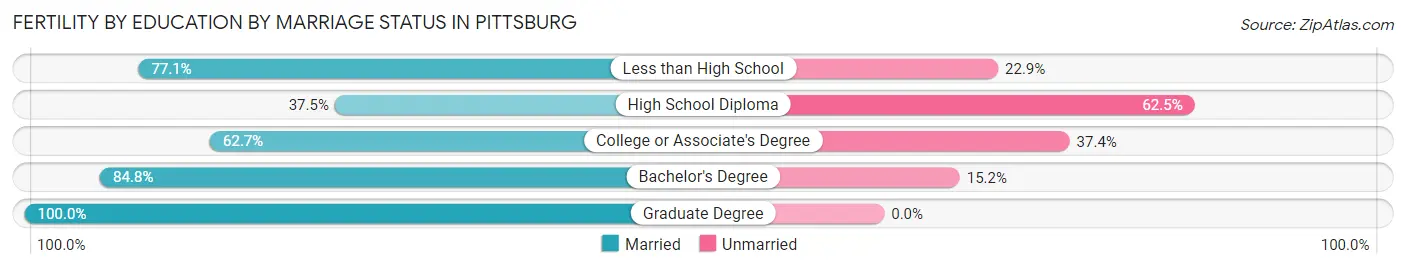
| Educational Attainment | Married | Unmarried |
| Less than High School | 299 (77.1%) | 89 (22.9%) |
| High School Diploma | 36 (37.5%) | 60 (62.5%) |
| College or Associate's Degree | 208 (62.6%) | 124 (37.3%) |
| Bachelor's Degree | 223 (84.8%) | 40 (15.2%) |
| Graduate Degree | 64 (100.0%) | 0 (0.0%) |
| Total | 830 (72.6%) | 313 (27.4%) |
Employment Characteristics in Pittsburg
Employment by Class of Employer in Pittsburg
Among the 35,554 employed individuals in Pittsburg, private company employees (24,848 | 69.9%), local government employees (3,002 | 8.4%), and not-for-profit organizations (2,340 | 6.6%) make up the most common classes of employment.
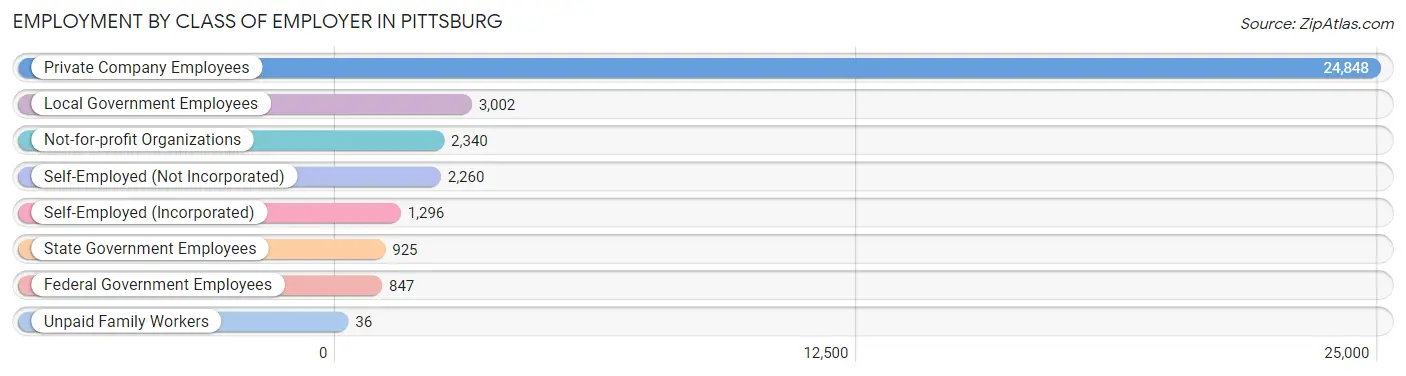
| Employer Class | # Employees | % Employees |
| Private Company Employees | 24,848 | 69.9% |
| Self-Employed (Incorporated) | 1,296 | 3.6% |
| Self-Employed (Not Incorporated) | 2,260 | 6.4% |
| Not-for-profit Organizations | 2,340 | 6.6% |
| Local Government Employees | 3,002 | 8.4% |
| State Government Employees | 925 | 2.6% |
| Federal Government Employees | 847 | 2.4% |
| Unpaid Family Workers | 36 | 0.1% |
| Total | 35,554 | 100.0% |
Employment Status by Age in Pittsburg
According to the labor force statistics for Pittsburg, out of the total population over 16 years of age (61,215), 65.4% or 40,035 individuals are in the labor force, with 7.1% or 2,842 of them unemployed. The age group with the highest labor force participation rate is 30 to 34 years, with 85.1% or 5,329 individuals in the labor force. Within the labor force, the 16 to 19 years age range has the highest percentage of unemployed individuals, with 27.1% or 336 of them being unemployed.
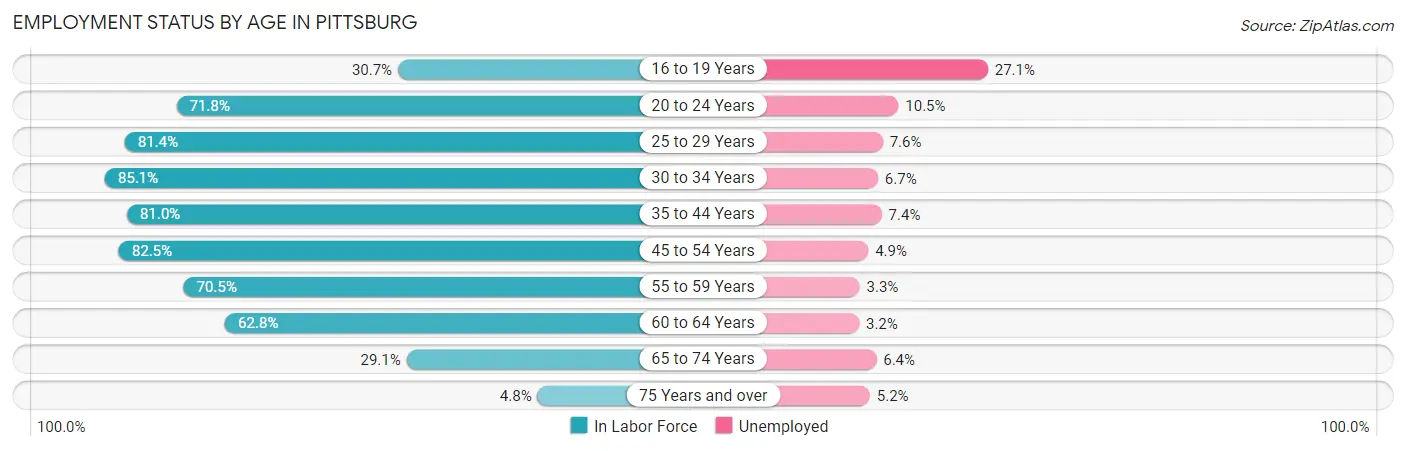
| Age Bracket | In Labor Force | Unemployed |
| 16 to 19 Years | 1,239 (30.7%) | 336 (27.1%) |
| 20 to 24 Years | 4,520 (71.8%) | 475 (10.5%) |
| 25 to 29 Years | 5,038 (81.4%) | 383 (7.6%) |
| 30 to 34 Years | 5,329 (85.1%) | 357 (6.7%) |
| 35 to 44 Years | 8,359 (81.0%) | 619 (7.4%) |
| 45 to 54 Years | 7,635 (82.5%) | 374 (4.9%) |
| 55 to 59 Years | 2,883 (70.5%) | 95 (3.3%) |
| 60 to 64 Years | 3,051 (62.8%) | 98 (3.2%) |
| 65 to 74 Years | 1,832 (29.1%) | 117 (6.4%) |
| 75 Years and over | 174 (4.8%) | 9 (5.2%) |
| Total | 40,035 (65.4%) | 2,842 (7.1%) |
Employment Status by Educational Attainment in Pittsburg
According to labor force statistics for Pittsburg, 78.8% of individuals (32,288) out of the total population between 25 and 64 years of age (40,974) are in the labor force, with 6.0% or 1,937 of them being unemployed. The group with the highest labor force participation rate are those with the educational attainment of bachelor's degree or higher, with 85.2% or 7,734 individuals in the labor force. Within the labor force, individuals with high school diploma education have the highest percentage of unemployment, with 9.1% or 736 of them being unemployed.
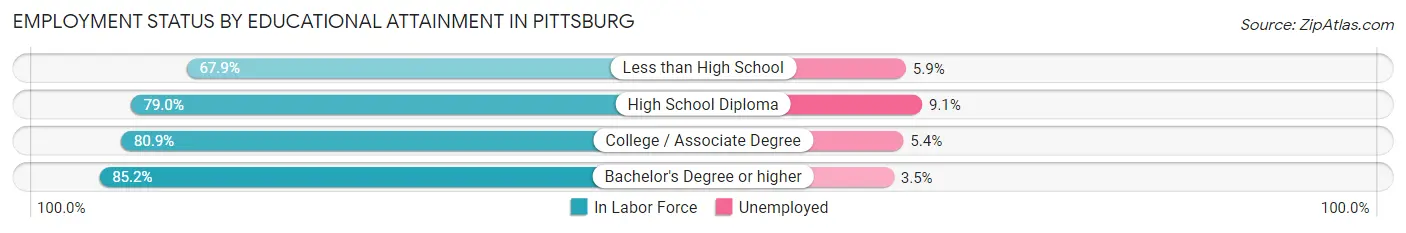
| Educational Attainment | In Labor Force | Unemployed |
| Less than High School | 5,429 (67.9%) | 472 (5.9%) |
| High School Diploma | 8,090 (79.0%) | 932 (9.1%) |
| College / Associate Degree | 11,051 (80.9%) | 738 (5.4%) |
| Bachelor's Degree or higher | 7,734 (85.2%) | 318 (3.5%) |
| Total | 32,288 (78.8%) | 2,458 (6.0%) |
Employment Occupations by Sex in Pittsburg
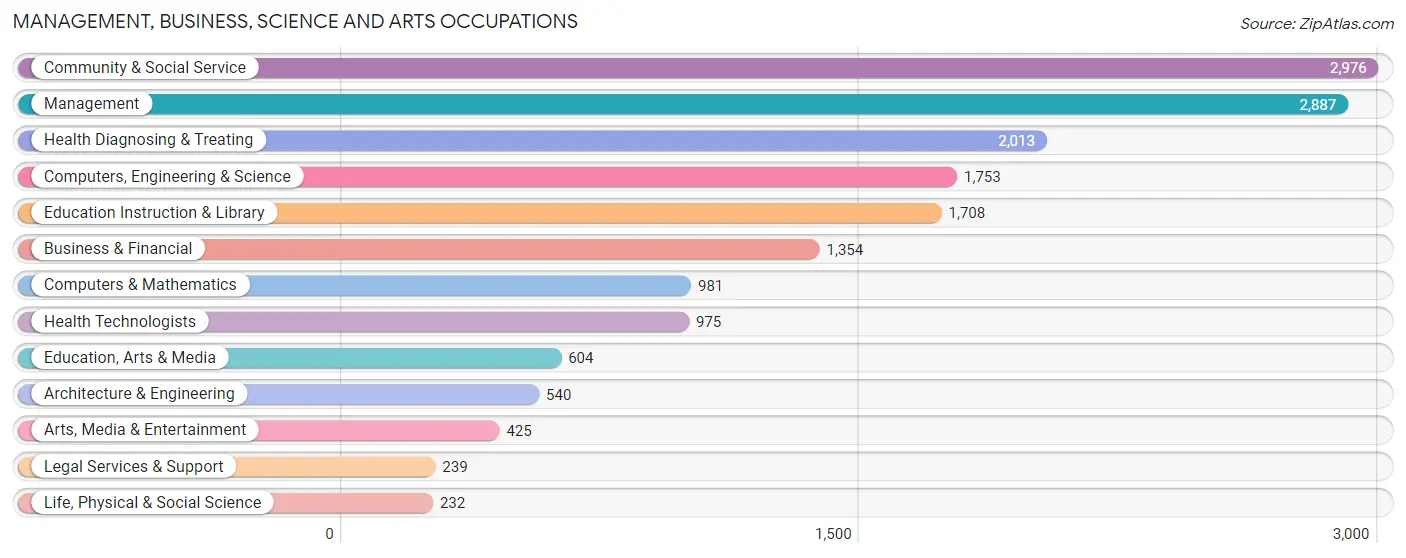
Management, Business, Science and Arts Occupations
The most common Management, Business, Science and Arts occupations in Pittsburg are Community & Social Service (2,976 | 8.0%), Management (2,887 | 7.8%), Health Diagnosing & Treating (2,013 | 5.4%), Computers, Engineering & Science (1,753 | 4.7%), and Education Instruction & Library (1,708 | 4.6%).
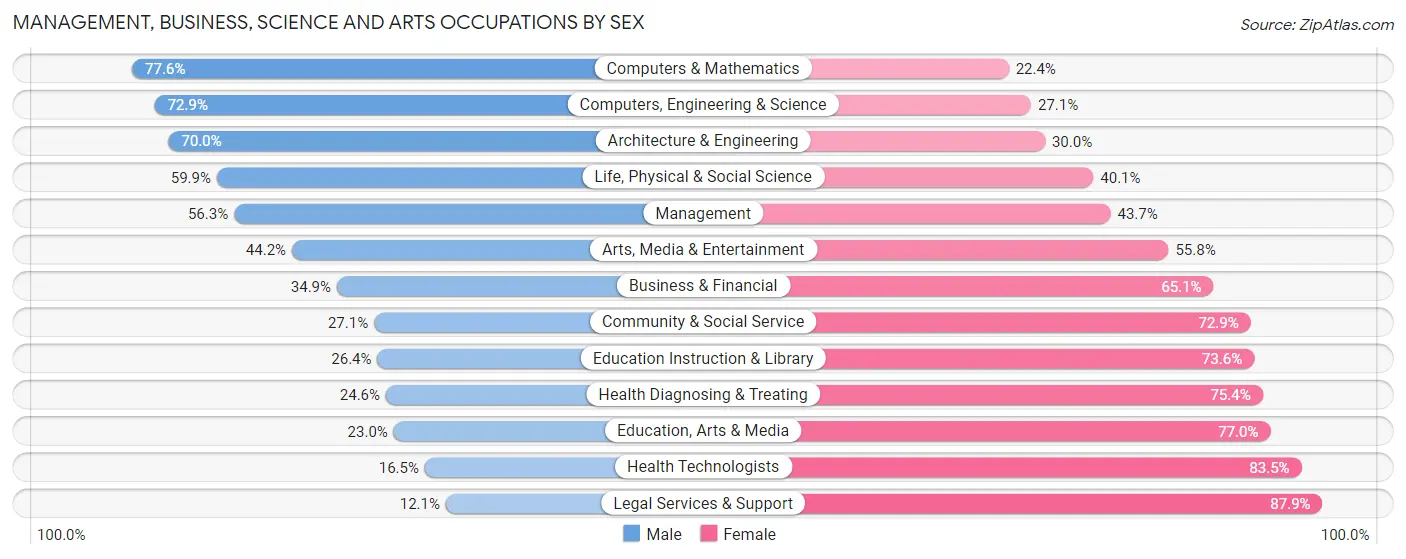
Management, Business, Science and Arts Occupations by Sex
Within the Management, Business, Science and Arts occupations in Pittsburg, the most male-oriented occupations are Computers & Mathematics (77.6%), Computers, Engineering & Science (72.9%), and Architecture & Engineering (70.0%), while the most female-oriented occupations are Legal Services & Support (87.9%), Health Technologists (83.5%), and Education, Arts & Media (77.0%).
| Occupation | Male | Female |
| Management | 1,626 (56.3%) | 1,261 (43.7%) |
| Business & Financial | 472 (34.9%) | 882 (65.1%) |
| Computers, Engineering & Science | 1,278 (72.9%) | 475 (27.1%) |
| Computers & Mathematics | 761 (77.6%) | 220 (22.4%) |
| Architecture & Engineering | 378 (70.0%) | 162 (30.0%) |
| Life, Physical & Social Science | 139 (59.9%) | 93 (40.1%) |
| Community & Social Service | 807 (27.1%) | 2,169 (72.9%) |
| Education, Arts & Media | 139 (23.0%) | 465 (77.0%) |
| Legal Services & Support | 29 (12.1%) | 210 (87.9%) |
| Education Instruction & Library | 451 (26.4%) | 1,257 (73.6%) |
| Arts, Media & Entertainment | 188 (44.2%) | 237 (55.8%) |
| Health Diagnosing & Treating | 496 (24.6%) | 1,517 (75.4%) |
| Health Technologists | 161 (16.5%) | 814 (83.5%) |
| Total (Category) | 4,679 (42.6%) | 6,304 (57.4%) |
| Total (Overall) | 19,496 (52.4%) | 17,675 (47.5%) |
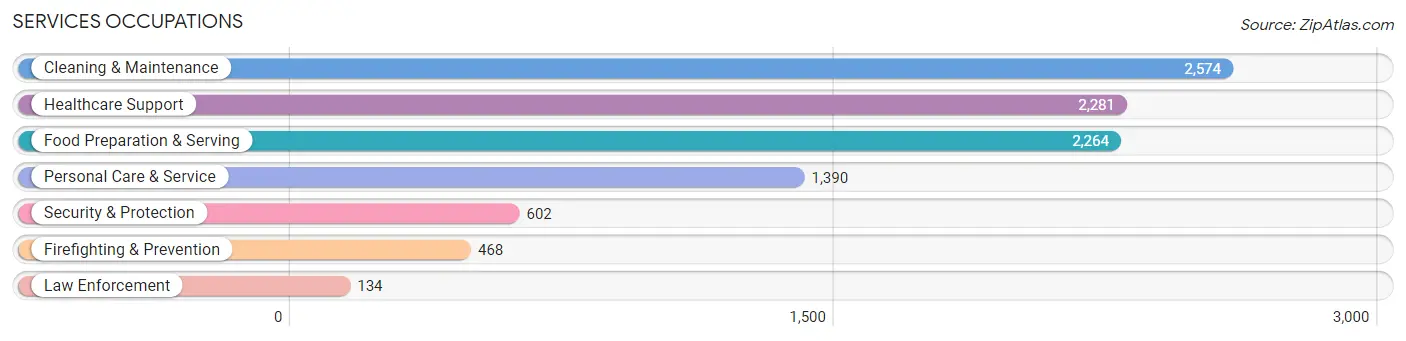
Services Occupations
The most common Services occupations in Pittsburg are Cleaning & Maintenance (2,574 | 6.9%), Healthcare Support (2,281 | 6.1%), Food Preparation & Serving (2,264 | 6.1%), Personal Care & Service (1,390 | 3.7%), and Security & Protection (602 | 1.6%).
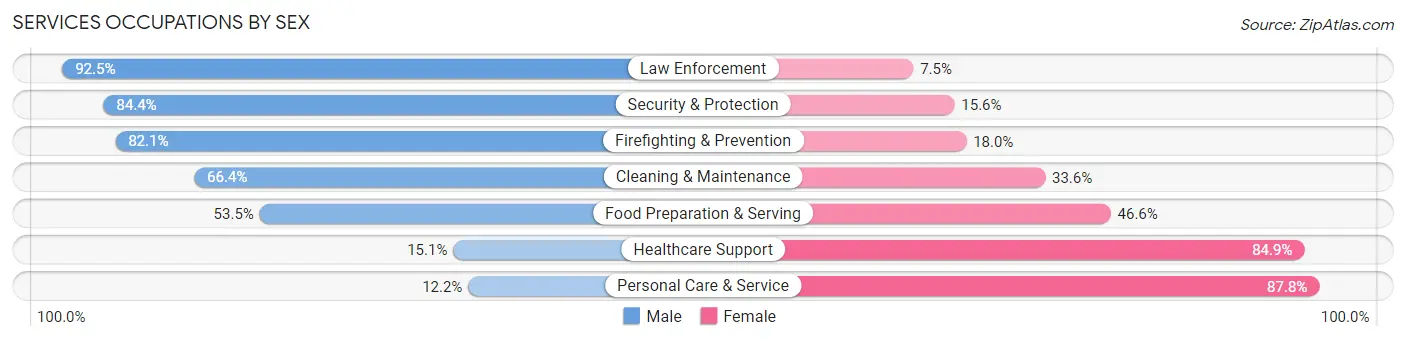
Services Occupations by Sex
Within the Services occupations in Pittsburg, the most male-oriented occupations are Law Enforcement (92.5%), Security & Protection (84.4%), and Firefighting & Prevention (82.1%), while the most female-oriented occupations are Personal Care & Service (87.8%), Healthcare Support (84.9%), and Food Preparation & Serving (46.6%).
| Occupation | Male | Female |
| Healthcare Support | 345 (15.1%) | 1,936 (84.9%) |
| Security & Protection | 508 (84.4%) | 94 (15.6%) |
| Firefighting & Prevention | 384 (82.1%) | 84 (17.9%) |
| Law Enforcement | 124 (92.5%) | 10 (7.5%) |
| Food Preparation & Serving | 1,210 (53.4%) | 1,054 (46.6%) |
| Cleaning & Maintenance | 1,710 (66.4%) | 864 (33.6%) |
| Personal Care & Service | 169 (12.2%) | 1,221 (87.8%) |
| Total (Category) | 3,942 (43.3%) | 5,169 (56.7%) |
| Total (Overall) | 19,496 (52.4%) | 17,675 (47.5%) |
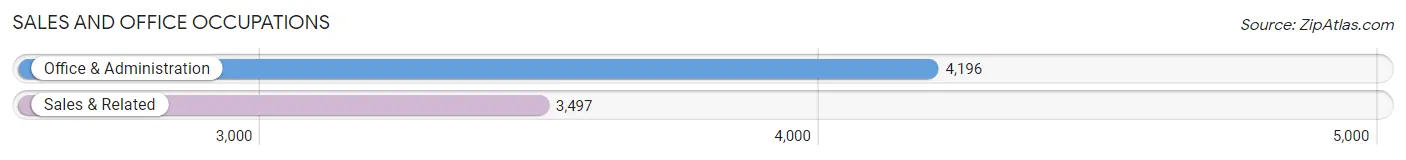
Sales and Office Occupations
The most common Sales and Office occupations in Pittsburg are Office & Administration (4,196 | 11.3%), and Sales & Related (3,497 | 9.4%).
Sales and Office Occupations by Sex
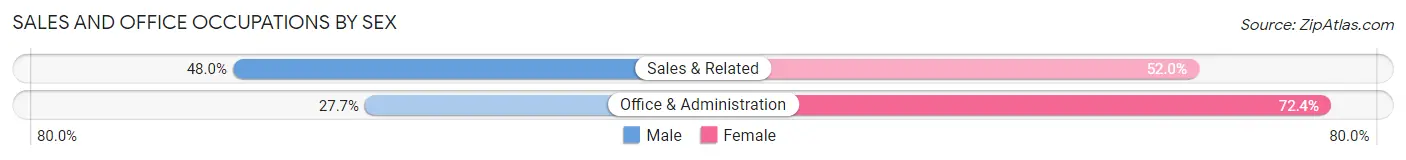
| Occupation | Male | Female |
| Sales & Related | 1,678 (48.0%) | 1,819 (52.0%) |
| Office & Administration | 1,160 (27.7%) | 3,036 (72.4%) |
| Total (Category) | 2,838 (36.9%) | 4,855 (63.1%) |
| Total (Overall) | 19,496 (52.4%) | 17,675 (47.5%) |
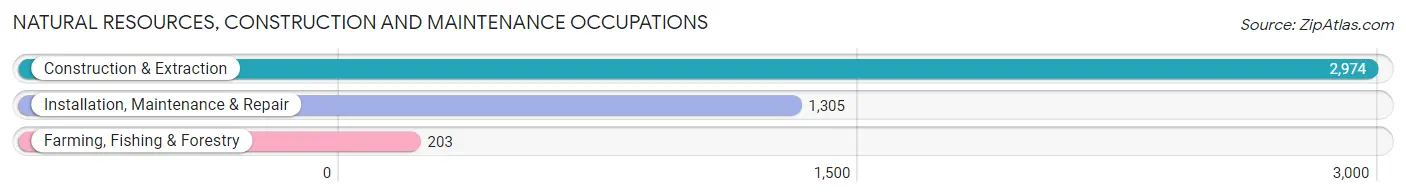
Natural Resources, Construction and Maintenance Occupations
The most common Natural Resources, Construction and Maintenance occupations in Pittsburg are Construction & Extraction (2,974 | 8.0%), Installation, Maintenance & Repair (1,305 | 3.5%), and Farming, Fishing & Forestry (203 | 0.5%).
Natural Resources, Construction and Maintenance Occupations by Sex
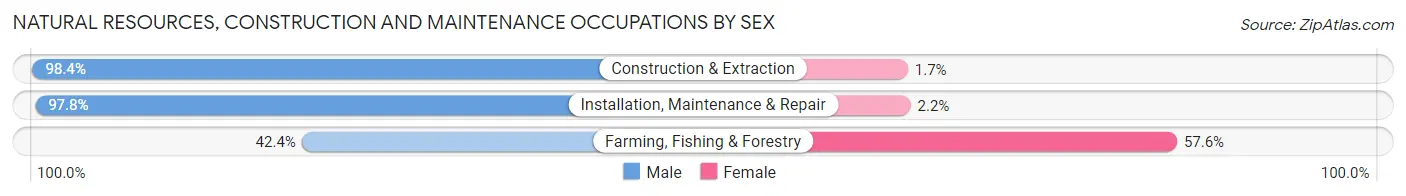
| Occupation | Male | Female |
| Farming, Fishing & Forestry | 86 (42.4%) | 117 (57.6%) |
| Construction & Extraction | 2,925 (98.4%) | 49 (1.7%) |
| Installation, Maintenance & Repair | 1,276 (97.8%) | 29 (2.2%) |
| Total (Category) | 4,287 (95.7%) | 195 (4.3%) |
| Total (Overall) | 19,496 (52.4%) | 17,675 (47.5%) |
Production, Transportation and Moving Occupations
The most common Production, Transportation and Moving occupations in Pittsburg are Transportation (1,643 | 4.4%), Production (1,633 | 4.4%), and Material Moving (1,626 | 4.4%).
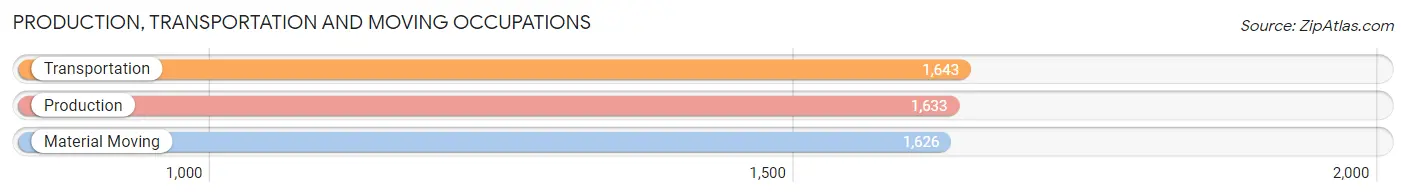
Production, Transportation and Moving Occupations by Sex
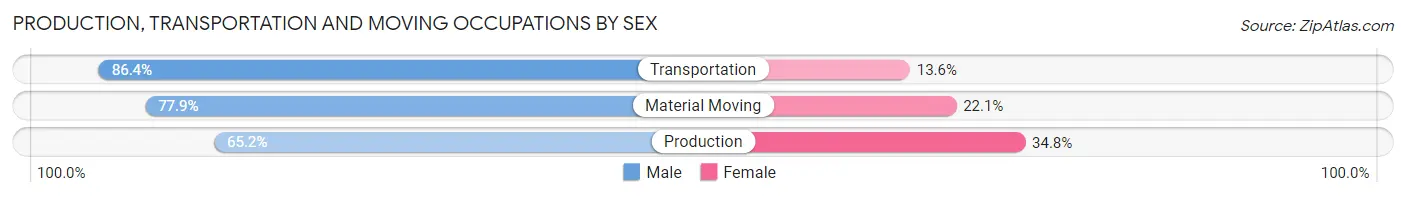
| Occupation | Male | Female |
| Production | 1,065 (65.2%) | 568 (34.8%) |
| Transportation | 1,419 (86.4%) | 224 (13.6%) |
| Material Moving | 1,266 (77.9%) | 360 (22.1%) |
| Total (Category) | 3,750 (76.5%) | 1,152 (23.5%) |
| Total (Overall) | 19,496 (52.4%) | 17,675 (47.5%) |
Employment Industries by Sex in Pittsburg
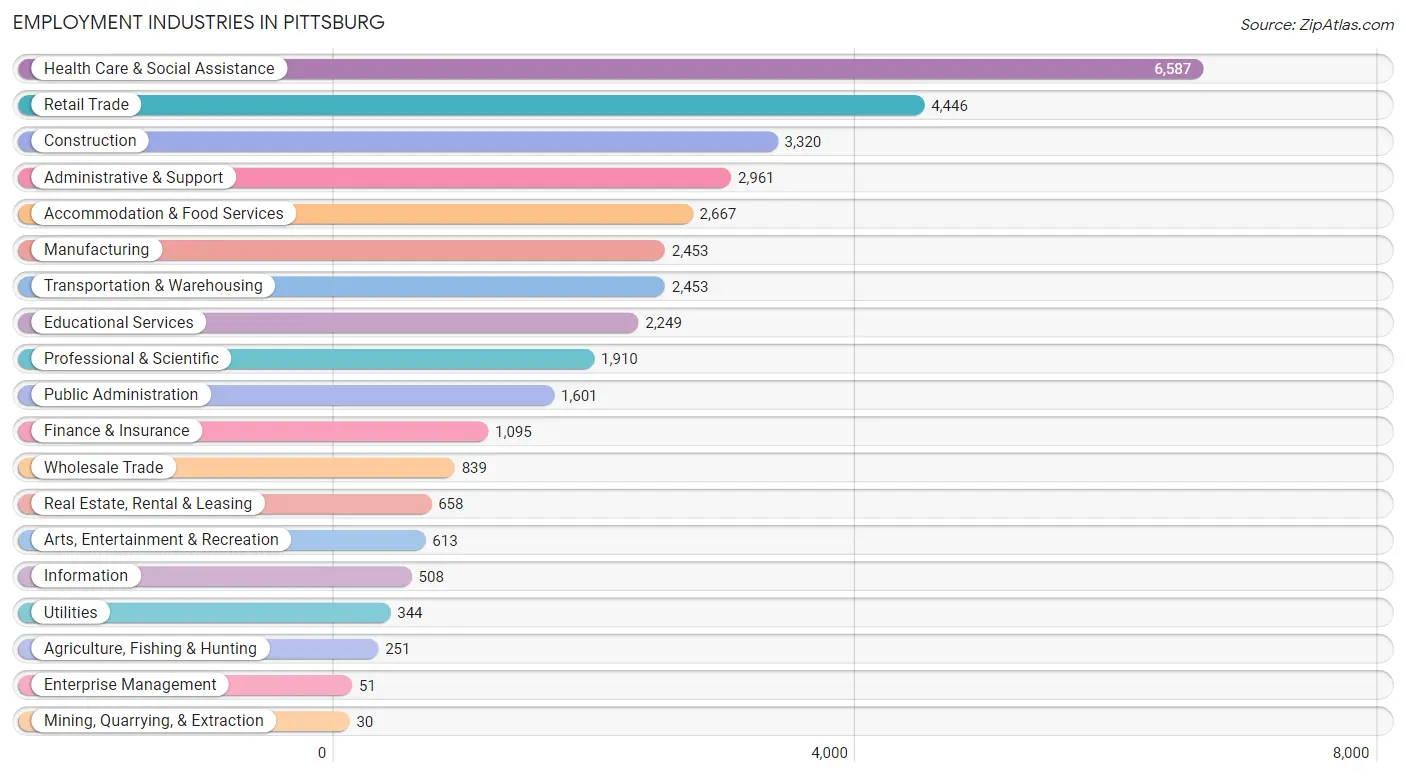
Employment Industries in Pittsburg
The major employment industries in Pittsburg include Health Care & Social Assistance (6,587 | 17.7%), Retail Trade (4,446 | 12.0%), Construction (3,320 | 8.9%), Administrative & Support (2,961 | 8.0%), and Accommodation & Food Services (2,667 | 7.2%).
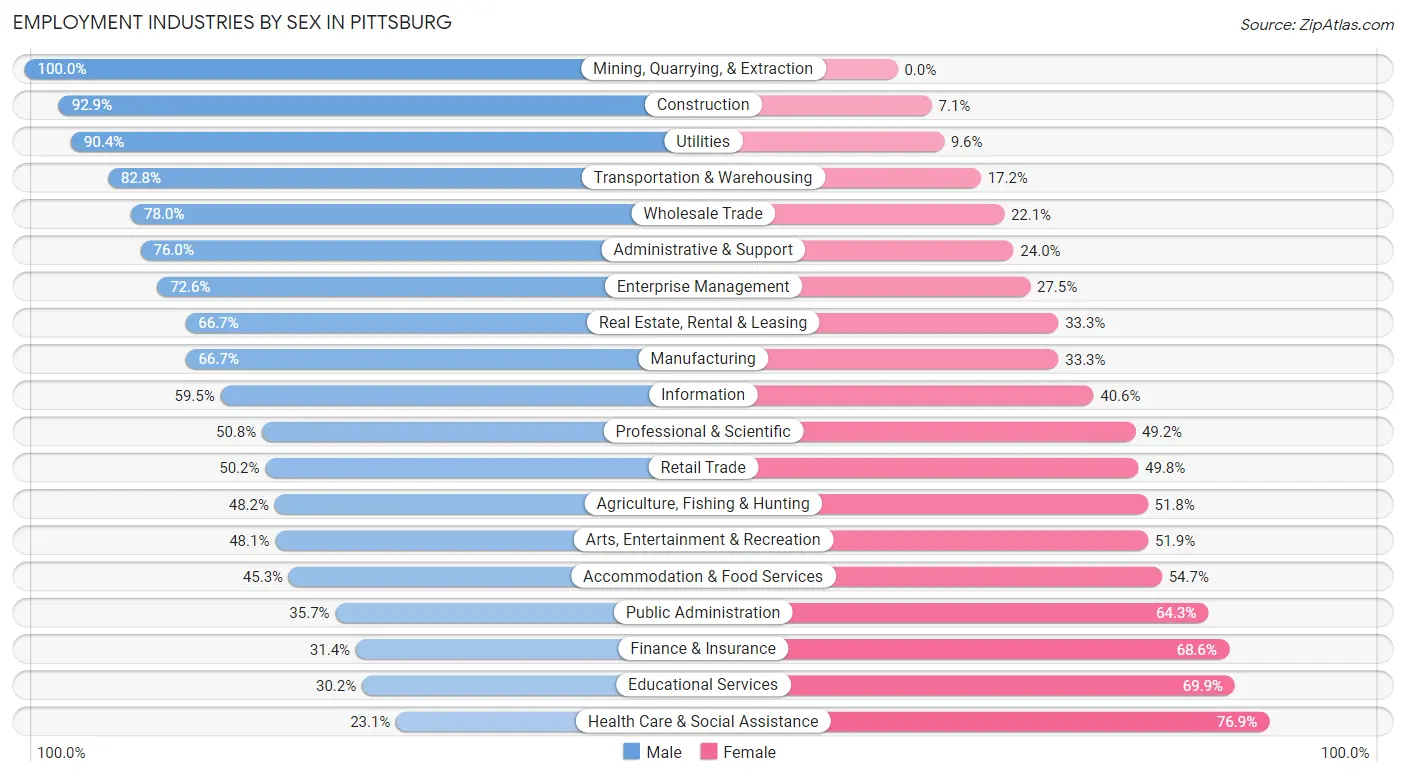
Employment Industries by Sex in Pittsburg
The Pittsburg industries that see more men than women are Mining, Quarrying, & Extraction (100.0%), Construction (92.9%), and Utilities (90.4%), whereas the industries that tend to have a higher number of women are Health Care & Social Assistance (76.9%), Educational Services (69.9%), and Finance & Insurance (68.6%).
| Industry | Male | Female |
| Agriculture, Fishing & Hunting | 121 (48.2%) | 130 (51.8%) |
| Mining, Quarrying, & Extraction | 30 (100.0%) | 0 (0.0%) |
| Construction | 3,085 (92.9%) | 235 (7.1%) |
| Manufacturing | 1,636 (66.7%) | 817 (33.3%) |
| Wholesale Trade | 654 (77.9%) | 185 (22.1%) |
| Retail Trade | 2,231 (50.2%) | 2,215 (49.8%) |
| Transportation & Warehousing | 2,030 (82.8%) | 423 (17.2%) |
| Utilities | 311 (90.4%) | 33 (9.6%) |
| Information | 302 (59.5%) | 206 (40.6%) |
| Finance & Insurance | 344 (31.4%) | 751 (68.6%) |
| Real Estate, Rental & Leasing | 439 (66.7%) | 219 (33.3%) |
| Professional & Scientific | 971 (50.8%) | 939 (49.2%) |
| Enterprise Management | 37 (72.6%) | 14 (27.5%) |
| Administrative & Support | 2,250 (76.0%) | 711 (24.0%) |
| Educational Services | 678 (30.1%) | 1,571 (69.9%) |
| Health Care & Social Assistance | 1,520 (23.1%) | 5,067 (76.9%) |
| Arts, Entertainment & Recreation | 295 (48.1%) | 318 (51.9%) |
| Accommodation & Food Services | 1,208 (45.3%) | 1,459 (54.7%) |
| Public Administration | 571 (35.7%) | 1,030 (64.3%) |
| Total | 19,496 (52.4%) | 17,675 (47.5%) |
Education in Pittsburg
School Enrollment in Pittsburg
The most common levels of schooling among the 20,101 students in Pittsburg are college / undergraduate (5,514 | 27.4%), high school (4,329 | 21.5%), and middle school (3,737 | 18.6%).
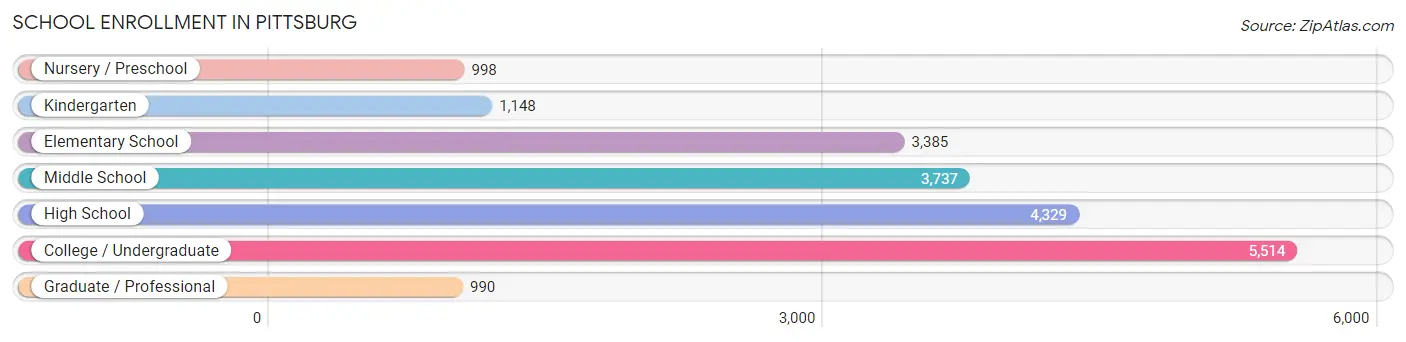
| School Level | # Students | % Students |
| Nursery / Preschool | 998 | 5.0% |
| Kindergarten | 1,148 | 5.7% |
| Elementary School | 3,385 | 16.8% |
| Middle School | 3,737 | 18.6% |
| High School | 4,329 | 21.5% |
| College / Undergraduate | 5,514 | 27.4% |
| Graduate / Professional | 990 | 4.9% |
| Total | 20,101 | 100.0% |
School Enrollment by Age by Funding Source in Pittsburg
Out of a total of 20,101 students who are enrolled in schools in Pittsburg, 2,935 (14.6%) attend a private institution, while the remaining 17,166 (85.4%) are enrolled in public schools. The age group of 35 years and over has the highest likelihood of being enrolled in private schools, with 506 (37.6% in the age bracket) enrolled. Conversely, the age group of 15 to 17 year olds has the lowest likelihood of being enrolled in a private school, with 2,613 (89.9% in the age bracket) attending a public institution.
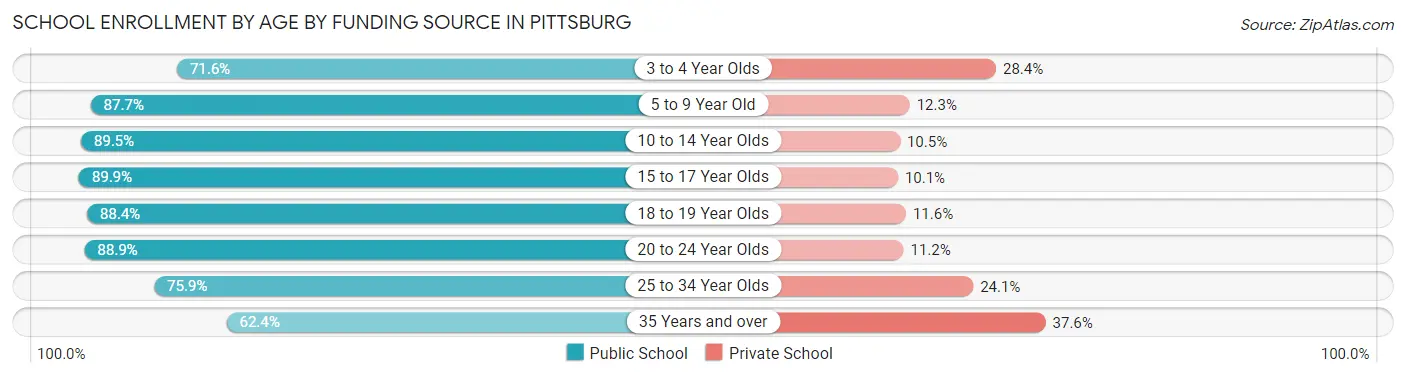
| Age Bracket | Public School | Private School |
| 3 to 4 Year Olds | 709 (71.6%) | 281 (28.4%) |
| 5 to 9 Year Old | 3,685 (87.7%) | 517 (12.3%) |
| 10 to 14 Year Olds | 4,299 (89.5%) | 504 (10.5%) |
| 15 to 17 Year Olds | 2,613 (89.9%) | 294 (10.1%) |
| 18 to 19 Year Olds | 1,264 (88.4%) | 166 (11.6%) |
| 20 to 24 Year Olds | 2,708 (88.8%) | 340 (11.2%) |
| 25 to 34 Year Olds | 1,044 (75.9%) | 332 (24.1%) |
| 35 Years and over | 839 (62.4%) | 506 (37.6%) |
| Total | 17,166 (85.4%) | 2,935 (14.6%) |
Educational Attainment by Field of Study in Pittsburg
Business (2,622 | 21.2%), science & technology (1,193 | 9.6%), liberal arts & history (1,124 | 9.1%), bio, nature & agricultural (993 | 8.0%), and engineering (953 | 7.7%) are the most common fields of study among 12,375 individuals in Pittsburg who have obtained a bachelor's degree or higher.
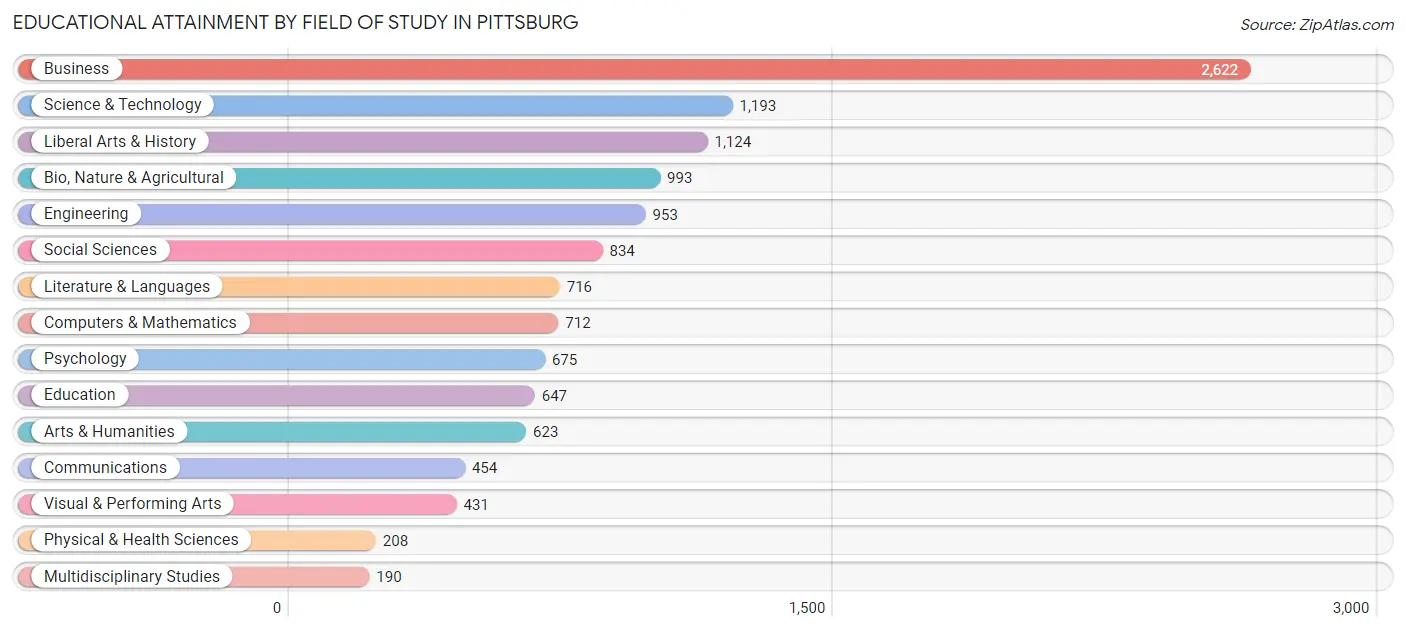
| Field of Study | # Graduates | % Graduates |
| Computers & Mathematics | 712 | 5.8% |
| Bio, Nature & Agricultural | 993 | 8.0% |
| Physical & Health Sciences | 208 | 1.7% |
| Psychology | 675 | 5.4% |
| Social Sciences | 834 | 6.7% |
| Engineering | 953 | 7.7% |
| Multidisciplinary Studies | 190 | 1.5% |
| Science & Technology | 1,193 | 9.6% |
| Business | 2,622 | 21.2% |
| Education | 647 | 5.2% |
| Literature & Languages | 716 | 5.8% |
| Liberal Arts & History | 1,124 | 9.1% |
| Visual & Performing Arts | 431 | 3.5% |
| Communications | 454 | 3.7% |
| Arts & Humanities | 623 | 5.0% |
| Total | 12,375 | 100.0% |
Transportation & Commute in Pittsburg
Vehicle Availability by Sex in Pittsburg
The most prevalent vehicle ownership categories in Pittsburg are males with 2 vehicles (6,382, accounting for 33.7%) and females with 2 vehicles (5,715, making up 38.5%).
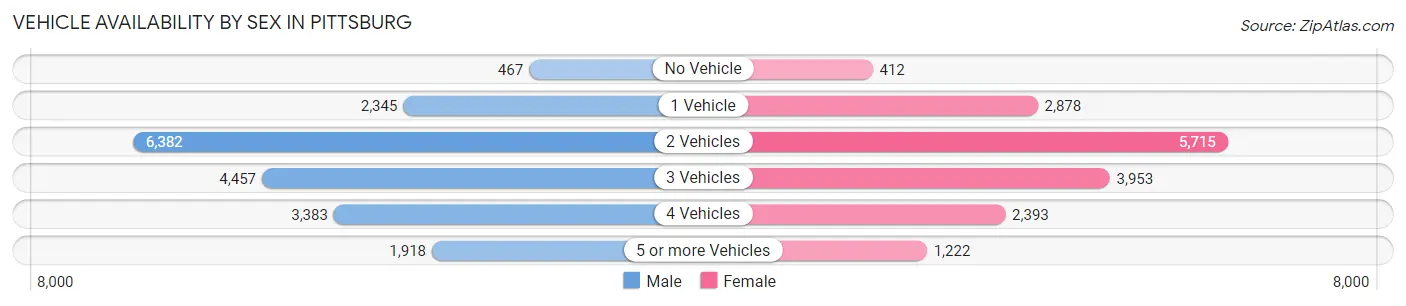
| Vehicles Available | Male | Female |
| No Vehicle | 467 (2.5%) | 412 (2.5%) |
| 1 Vehicle | 2,345 (12.4%) | 2,878 (17.4%) |
| 2 Vehicles | 6,382 (33.7%) | 5,715 (34.5%) |
| 3 Vehicles | 4,457 (23.5%) | 3,953 (23.8%) |
| 4 Vehicles | 3,383 (17.8%) | 2,393 (14.4%) |
| 5 or more Vehicles | 1,918 (10.1%) | 1,222 (7.4%) |
| Total | 18,952 (100.0%) | 16,573 (100.0%) |
Commute Time in Pittsburg
The most frequently occuring commute durations in Pittsburg are 60 to 89 minutes (5,165 commuters, 15.6%), 45 to 59 minutes (4,101 commuters, 12.4%), and 20 to 24 minutes (4,021 commuters, 12.2%).
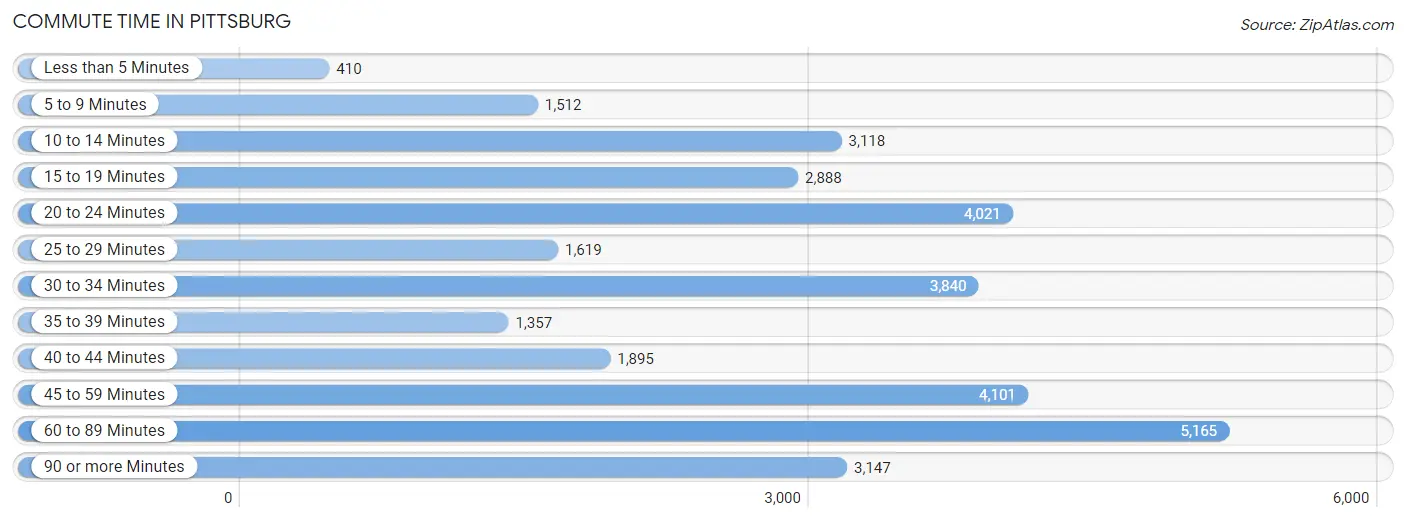
| Commute Time | # Commuters | % Commuters |
| Less than 5 Minutes | 410 | 1.2% |
| 5 to 9 Minutes | 1,512 | 4.6% |
| 10 to 14 Minutes | 3,118 | 9.4% |
| 15 to 19 Minutes | 2,888 | 8.7% |
| 20 to 24 Minutes | 4,021 | 12.2% |
| 25 to 29 Minutes | 1,619 | 4.9% |
| 30 to 34 Minutes | 3,840 | 11.6% |
| 35 to 39 Minutes | 1,357 | 4.1% |
| 40 to 44 Minutes | 1,895 | 5.7% |
| 45 to 59 Minutes | 4,101 | 12.4% |
| 60 to 89 Minutes | 5,165 | 15.6% |
| 90 or more Minutes | 3,147 | 9.5% |
Commute Time by Sex in Pittsburg
The most common commute times in Pittsburg are 60 to 89 minutes (3,431 commuters, 19.3%) for males and 20 to 24 minutes (2,055 commuters, 13.4%) for females.
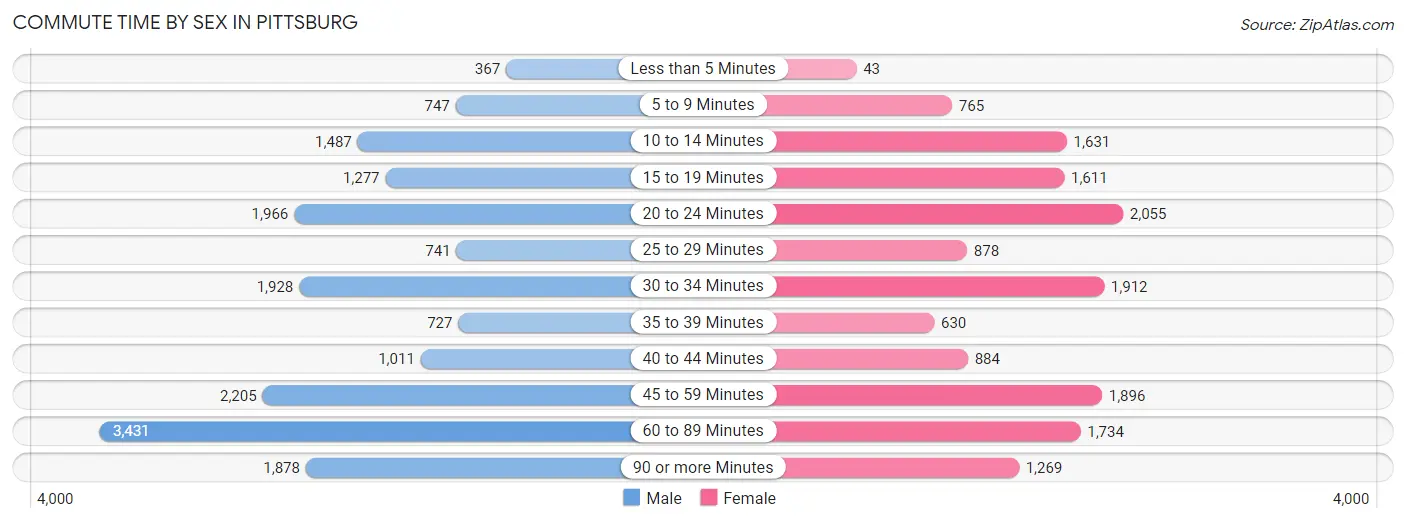
| Commute Time | Male | Female |
| Less than 5 Minutes | 367 (2.1%) | 43 (0.3%) |
| 5 to 9 Minutes | 747 (4.2%) | 765 (5.0%) |
| 10 to 14 Minutes | 1,487 (8.4%) | 1,631 (10.6%) |
| 15 to 19 Minutes | 1,277 (7.2%) | 1,611 (10.5%) |
| 20 to 24 Minutes | 1,966 (11.1%) | 2,055 (13.4%) |
| 25 to 29 Minutes | 741 (4.2%) | 878 (5.7%) |
| 30 to 34 Minutes | 1,928 (10.8%) | 1,912 (12.5%) |
| 35 to 39 Minutes | 727 (4.1%) | 630 (4.1%) |
| 40 to 44 Minutes | 1,011 (5.7%) | 884 (5.8%) |
| 45 to 59 Minutes | 2,205 (12.4%) | 1,896 (12.4%) |
| 60 to 89 Minutes | 3,431 (19.3%) | 1,734 (11.3%) |
| 90 or more Minutes | 1,878 (10.6%) | 1,269 (8.3%) |
Time of Departure to Work by Sex in Pittsburg
The most frequent times of departure to work in Pittsburg are 12:00 AM to 4:59 AM (2,726, 15.3%) for males and 7:00 AM to 7:29 AM (2,046, 13.4%) for females.
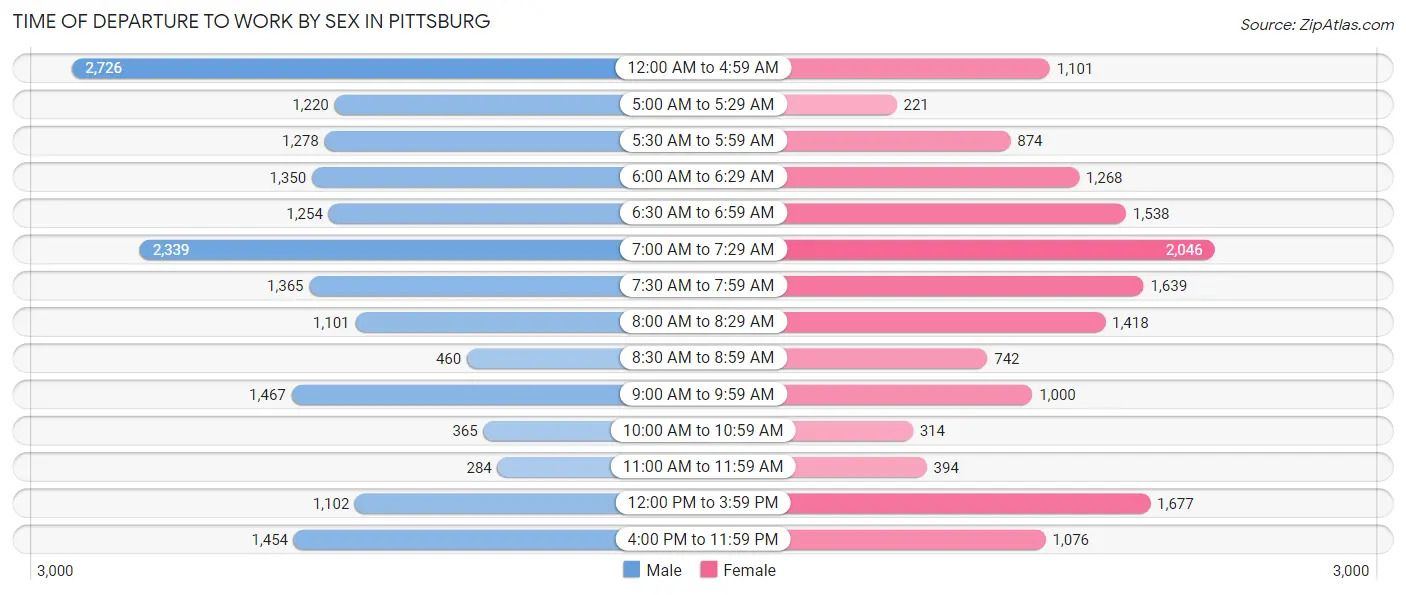
| Time of Departure | Male | Female |
| 12:00 AM to 4:59 AM | 2,726 (15.3%) | 1,101 (7.2%) |
| 5:00 AM to 5:29 AM | 1,220 (6.9%) | 221 (1.4%) |
| 5:30 AM to 5:59 AM | 1,278 (7.2%) | 874 (5.7%) |
| 6:00 AM to 6:29 AM | 1,350 (7.6%) | 1,268 (8.3%) |
| 6:30 AM to 6:59 AM | 1,254 (7.1%) | 1,538 (10.1%) |
| 7:00 AM to 7:29 AM | 2,339 (13.2%) | 2,046 (13.4%) |
| 7:30 AM to 7:59 AM | 1,365 (7.7%) | 1,639 (10.7%) |
| 8:00 AM to 8:29 AM | 1,101 (6.2%) | 1,418 (9.3%) |
| 8:30 AM to 8:59 AM | 460 (2.6%) | 742 (4.9%) |
| 9:00 AM to 9:59 AM | 1,467 (8.3%) | 1,000 (6.5%) |
| 10:00 AM to 10:59 AM | 365 (2.1%) | 314 (2.1%) |
| 11:00 AM to 11:59 AM | 284 (1.6%) | 394 (2.6%) |
| 12:00 PM to 3:59 PM | 1,102 (6.2%) | 1,677 (11.0%) |
| 4:00 PM to 11:59 PM | 1,454 (8.2%) | 1,076 (7.0%) |
| Total | 17,765 (100.0%) | 15,308 (100.0%) |
Housing Occupancy in Pittsburg
Occupancy by Ownership in Pittsburg
Of the total 23,254 dwellings in Pittsburg, owner-occupied units account for 13,835 (59.5%), while renter-occupied units make up 9,419 (40.5%).
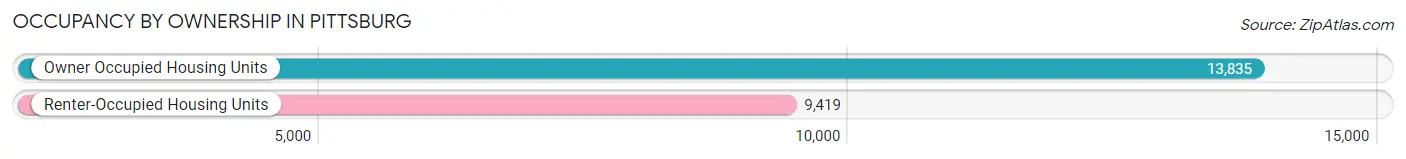
| Occupancy | # Housing Units | % Housing Units |
| Owner Occupied Housing Units | 13,835 | 59.5% |
| Renter-Occupied Housing Units | 9,419 | 40.5% |
| Total Occupied Housing Units | 23,254 | 100.0% |
Occupancy by Household Size in Pittsburg
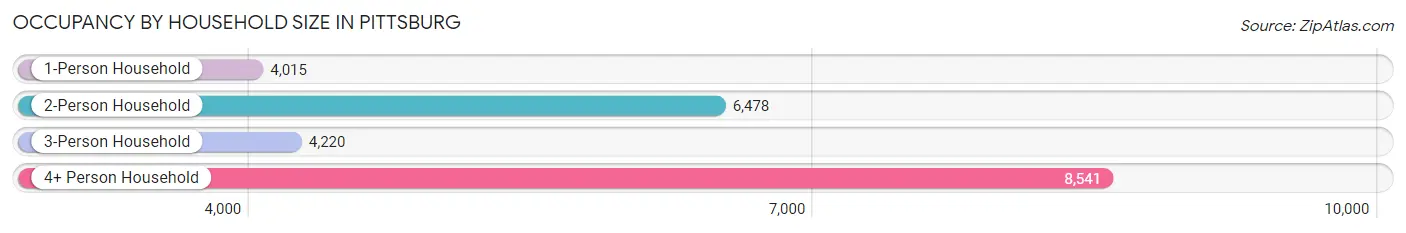
| Household Size | # Housing Units | % Housing Units |
| 1-Person Household | 4,015 | 17.3% |
| 2-Person Household | 6,478 | 27.9% |
| 3-Person Household | 4,220 | 18.1% |
| 4+ Person Household | 8,541 | 36.7% |
| Total Housing Units | 23,254 | 100.0% |
Occupancy by Ownership by Household Size in Pittsburg
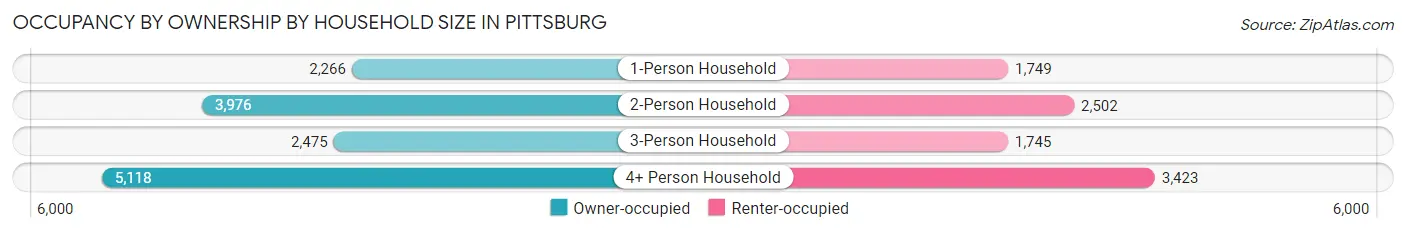
| Household Size | Owner-occupied | Renter-occupied |
| 1-Person Household | 2,266 (56.4%) | 1,749 (43.6%) |
| 2-Person Household | 3,976 (61.4%) | 2,502 (38.6%) |
| 3-Person Household | 2,475 (58.7%) | 1,745 (41.3%) |
| 4+ Person Household | 5,118 (59.9%) | 3,423 (40.1%) |
| Total Housing Units | 13,835 (59.5%) | 9,419 (40.5%) |
Occupancy by Educational Attainment in Pittsburg
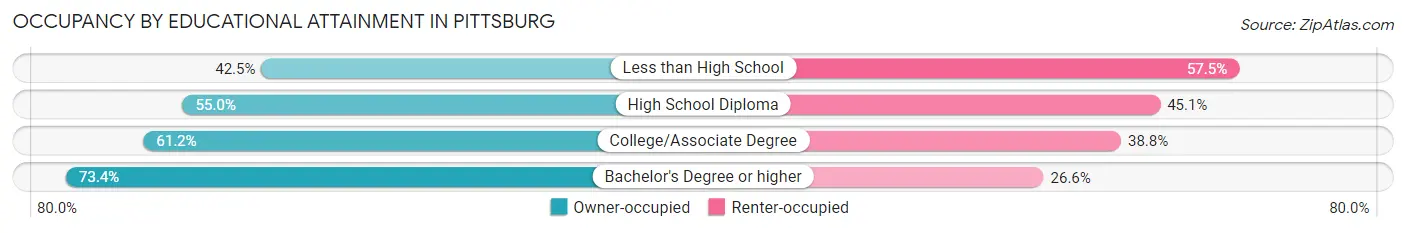
| Household Size | Owner-occupied | Renter-occupied |
| Less than High School | 1,664 (42.5%) | 2,255 (57.5%) |
| High School Diploma | 2,733 (54.9%) | 2,241 (45.1%) |
| College/Associate Degree | 5,525 (61.2%) | 3,508 (38.8%) |
| Bachelor's Degree or higher | 3,913 (73.4%) | 1,415 (26.6%) |
Occupancy by Age of Householder in Pittsburg
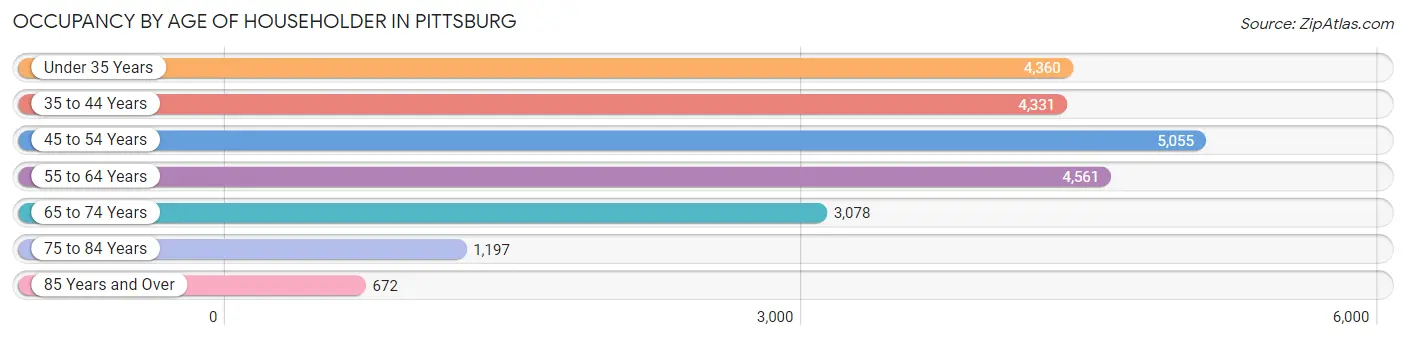
| Age Bracket | # Households | % Households |
| Under 35 Years | 4,360 | 18.8% |
| 35 to 44 Years | 4,331 | 18.6% |
| 45 to 54 Years | 5,055 | 21.7% |
| 55 to 64 Years | 4,561 | 19.6% |
| 65 to 74 Years | 3,078 | 13.2% |
| 75 to 84 Years | 1,197 | 5.1% |
| 85 Years and Over | 672 | 2.9% |
| Total | 23,254 | 100.0% |
Housing Finances in Pittsburg
Median Income by Occupancy in Pittsburg
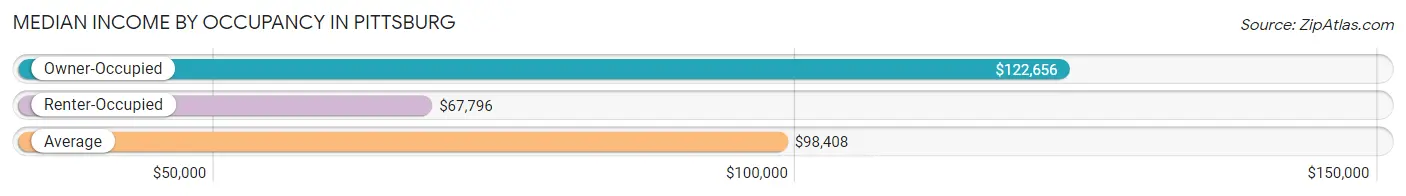
| Occupancy Type | # Households | Median Income |
| Owner-Occupied | 13,835 (59.5%) | $122,656 |
| Renter-Occupied | 9,419 (40.5%) | $67,796 |
| Average | 23,254 (100.0%) | $98,408 |
Occupancy by Householder Income Bracket in Pittsburg
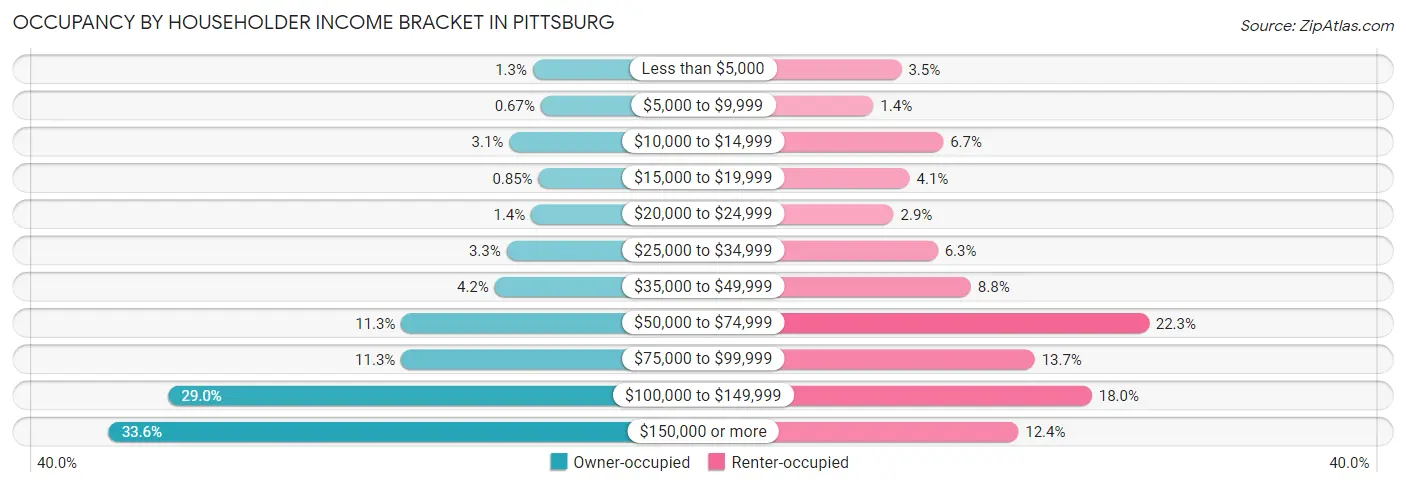
| Income Bracket | Owner-occupied | Renter-occupied |
| Less than $5,000 | 177 (1.3%) | 330 (3.5%) |
| $5,000 to $9,999 | 93 (0.7%) | 128 (1.4%) |
| $10,000 to $14,999 | 426 (3.1%) | 629 (6.7%) |
| $15,000 to $19,999 | 118 (0.9%) | 388 (4.1%) |
| $20,000 to $24,999 | 195 (1.4%) | 273 (2.9%) |
| $25,000 to $34,999 | 454 (3.3%) | 590 (6.3%) |
| $35,000 to $49,999 | 579 (4.2%) | 828 (8.8%) |
| $50,000 to $74,999 | 1,564 (11.3%) | 2,104 (22.3%) |
| $75,000 to $99,999 | 1,565 (11.3%) | 1,286 (13.7%) |
| $100,000 to $149,999 | 4,017 (29.0%) | 1,695 (18.0%) |
| $150,000 or more | 4,647 (33.6%) | 1,168 (12.4%) |
| Total | 13,835 (100.0%) | 9,419 (100.0%) |
Monthly Housing Cost Tiers in Pittsburg
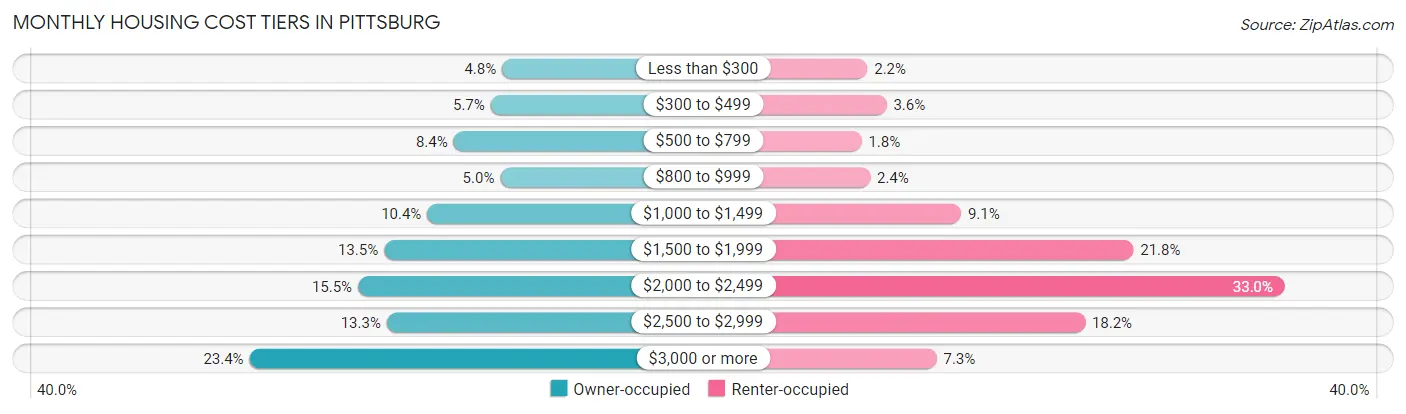
| Monthly Cost | Owner-occupied | Renter-occupied |
| Less than $300 | 670 (4.8%) | 207 (2.2%) |
| $300 to $499 | 786 (5.7%) | 340 (3.6%) |
| $500 to $799 | 1,163 (8.4%) | 167 (1.8%) |
| $800 to $999 | 688 (5.0%) | 226 (2.4%) |
| $1,000 to $1,499 | 1,432 (10.3%) | 857 (9.1%) |
| $1,500 to $1,999 | 1,872 (13.5%) | 2,052 (21.8%) |
| $2,000 to $2,499 | 2,137 (15.4%) | 3,104 (33.0%) |
| $2,500 to $2,999 | 1,844 (13.3%) | 1,717 (18.2%) |
| $3,000 or more | 3,243 (23.4%) | 688 (7.3%) |
| Total | 13,835 (100.0%) | 9,419 (100.0%) |
Physical Housing Characteristics in Pittsburg
Housing Structures in Pittsburg
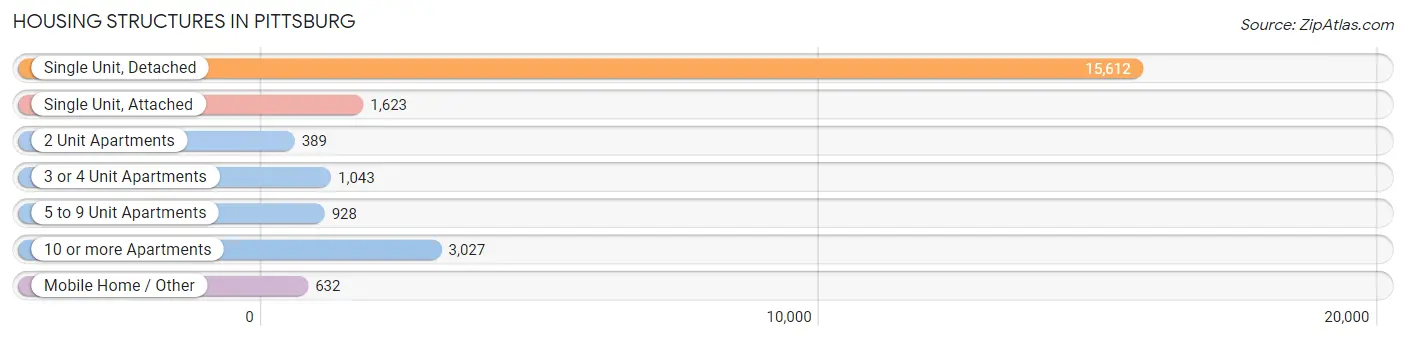
| Structure Type | # Housing Units | % Housing Units |
| Single Unit, Detached | 15,612 | 67.1% |
| Single Unit, Attached | 1,623 | 7.0% |
| 2 Unit Apartments | 389 | 1.7% |
| 3 or 4 Unit Apartments | 1,043 | 4.5% |
| 5 to 9 Unit Apartments | 928 | 4.0% |
| 10 or more Apartments | 3,027 | 13.0% |
| Mobile Home / Other | 632 | 2.7% |
| Total | 23,254 | 100.0% |
Housing Structures by Occupancy in Pittsburg
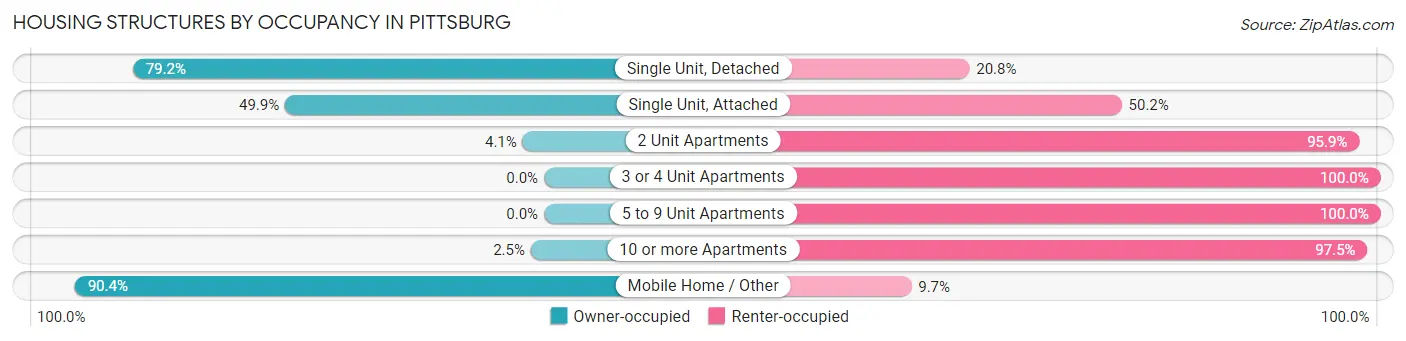
| Structure Type | Owner-occupied | Renter-occupied |
| Single Unit, Detached | 12,362 (79.2%) | 3,250 (20.8%) |
| Single Unit, Attached | 809 (49.8%) | 814 (50.1%) |
| 2 Unit Apartments | 16 (4.1%) | 373 (95.9%) |
| 3 or 4 Unit Apartments | 0 (0.0%) | 1,043 (100.0%) |
| 5 to 9 Unit Apartments | 0 (0.0%) | 928 (100.0%) |
| 10 or more Apartments | 77 (2.5%) | 2,950 (97.5%) |
| Mobile Home / Other | 571 (90.3%) | 61 (9.7%) |
| Total | 13,835 (59.5%) | 9,419 (40.5%) |
Housing Structures by Number of Rooms in Pittsburg
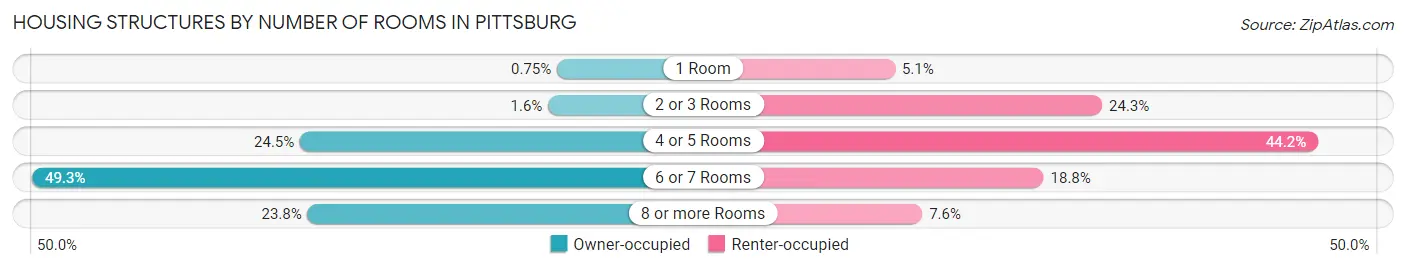
| Number of Rooms | Owner-occupied | Renter-occupied |
| 1 Room | 104 (0.7%) | 479 (5.1%) |
| 2 or 3 Rooms | 219 (1.6%) | 2,284 (24.2%) |
| 4 or 5 Rooms | 3,393 (24.5%) | 4,164 (44.2%) |
| 6 or 7 Rooms | 6,822 (49.3%) | 1,775 (18.8%) |
| 8 or more Rooms | 3,297 (23.8%) | 717 (7.6%) |
| Total | 13,835 (100.0%) | 9,419 (100.0%) |
Housing Structure by Heating Type in Pittsburg
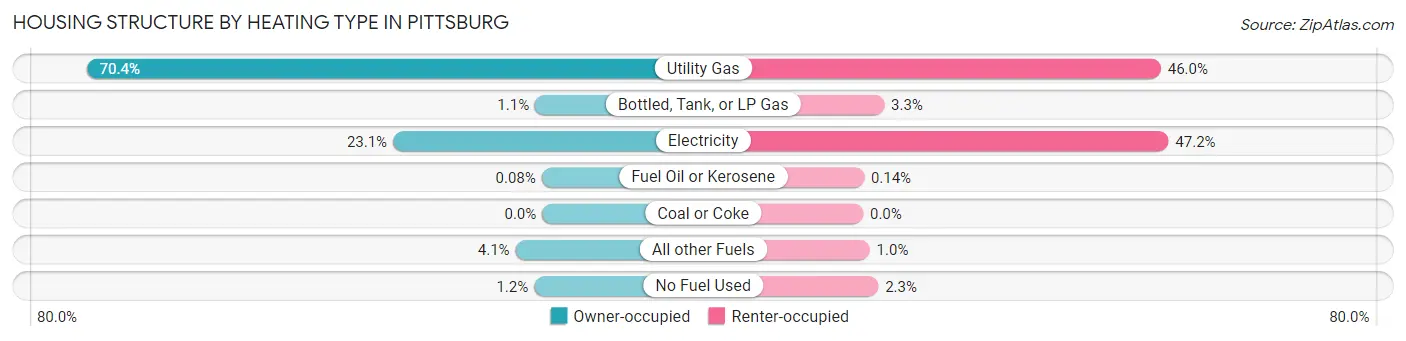
| Heating Type | Owner-occupied | Renter-occupied |
| Utility Gas | 9,740 (70.4%) | 4,336 (46.0%) |
| Bottled, Tank, or LP Gas | 152 (1.1%) | 307 (3.3%) |
| Electricity | 3,191 (23.1%) | 4,447 (47.2%) |
| Fuel Oil or Kerosene | 11 (0.1%) | 13 (0.1%) |
| Coal or Coke | 0 (0.0%) | 0 (0.0%) |
| All other Fuels | 570 (4.1%) | 96 (1.0%) |
| No Fuel Used | 171 (1.2%) | 220 (2.3%) |
| Total | 13,835 (100.0%) | 9,419 (100.0%) |
Household Vehicle Usage in Pittsburg
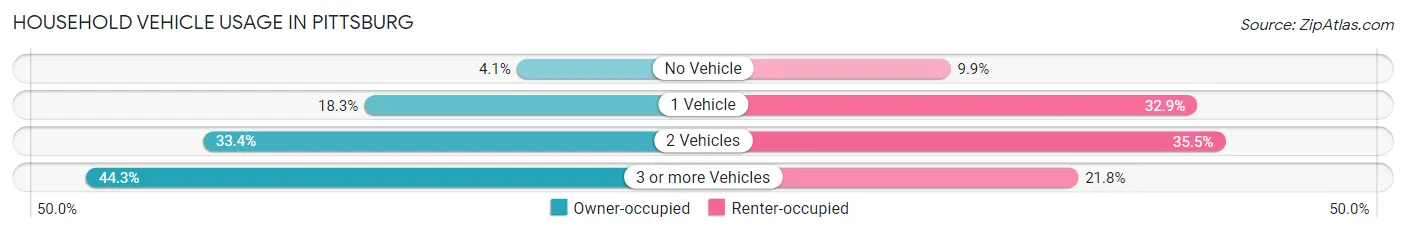
| Vehicles per Household | Owner-occupied | Renter-occupied |
| No Vehicle | 564 (4.1%) | 929 (9.9%) |
| 1 Vehicle | 2,533 (18.3%) | 3,096 (32.9%) |
| 2 Vehicles | 4,615 (33.4%) | 3,343 (35.5%) |
| 3 or more Vehicles | 6,123 (44.3%) | 2,051 (21.8%) |
| Total | 13,835 (100.0%) | 9,419 (100.0%) |
Real Estate & Mortgages in Pittsburg
Real Estate and Mortgage Overview in Pittsburg
| Characteristic | Without Mortgage | With Mortgage |
| Housing Units | 3,819 | 10,016 |
| Median Property Value | $467,600 | $578,300 |
| Median Household Income | $95,054 | $3,665 |
| Monthly Housing Costs | $648 | $3,243 |
| Real Estate Taxes | $3,114 | $163 |
Property Value by Mortgage Status in Pittsburg
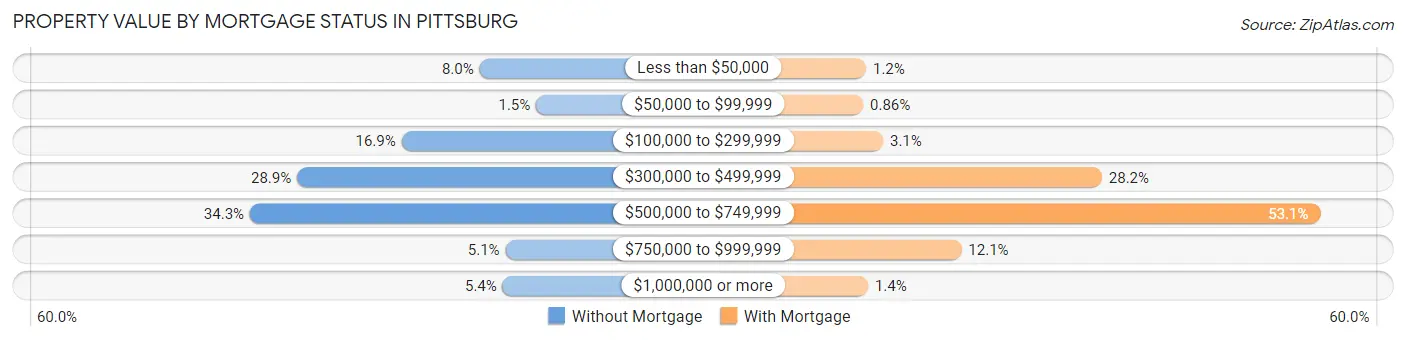
| Property Value | Without Mortgage | With Mortgage |
| Less than $50,000 | 306 (8.0%) | 120 (1.2%) |
| $50,000 to $99,999 | 59 (1.5%) | 86 (0.9%) |
| $100,000 to $299,999 | 646 (16.9%) | 315 (3.1%) |
| $300,000 to $499,999 | 1,102 (28.9%) | 2,820 (28.1%) |
| $500,000 to $749,999 | 1,308 (34.3%) | 5,321 (53.1%) |
| $750,000 to $999,999 | 193 (5.1%) | 1,212 (12.1%) |
| $1,000,000 or more | 205 (5.4%) | 142 (1.4%) |
| Total | 3,819 (100.0%) | 10,016 (100.0%) |
Household Income by Mortgage Status in Pittsburg
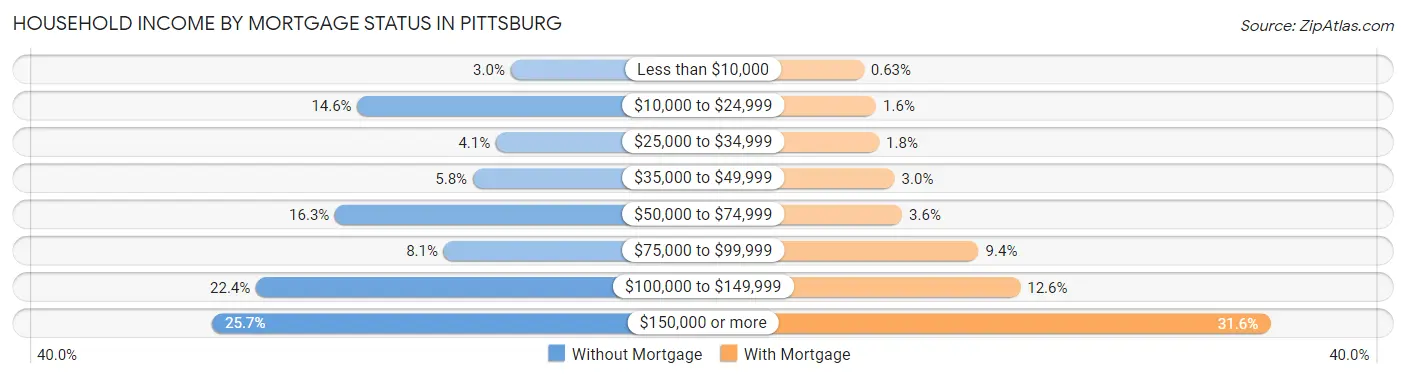
| Household Income | Without Mortgage | With Mortgage |
| Less than $10,000 | 113 (3.0%) | 63 (0.6%) |
| $10,000 to $24,999 | 559 (14.6%) | 157 (1.6%) |
| $25,000 to $34,999 | 156 (4.1%) | 180 (1.8%) |
| $35,000 to $49,999 | 223 (5.8%) | 298 (3.0%) |
| $50,000 to $74,999 | 624 (16.3%) | 356 (3.5%) |
| $75,000 to $99,999 | 308 (8.1%) | 940 (9.4%) |
| $100,000 to $149,999 | 854 (22.4%) | 1,257 (12.6%) |
| $150,000 or more | 982 (25.7%) | 3,163 (31.6%) |
| Total | 3,819 (100.0%) | 10,016 (100.0%) |
Property Value to Household Income Ratio in Pittsburg
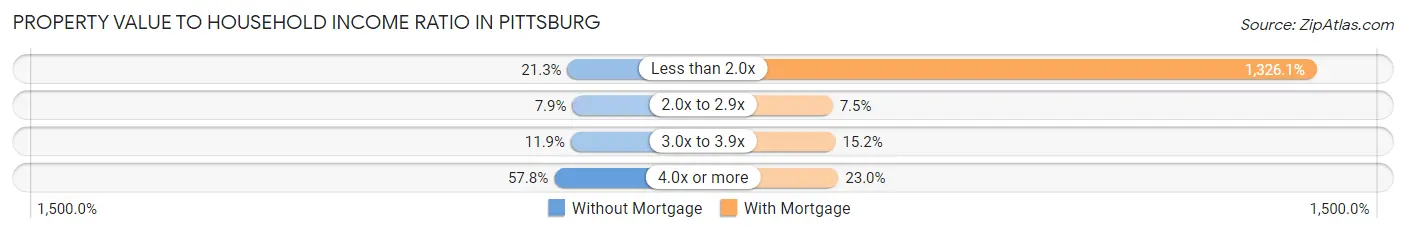
| Value-to-Income Ratio | Without Mortgage | With Mortgage |
| Less than 2.0x | 813 (21.3%) | 132,818 (1,326.1%) |
| 2.0x to 2.9x | 302 (7.9%) | 752 (7.5%) |
| 3.0x to 3.9x | 456 (11.9%) | 1,521 (15.2%) |
| 4.0x or more | 2,208 (57.8%) | 2,300 (23.0%) |
| Total | 3,819 (100.0%) | 10,016 (100.0%) |
Real Estate Taxes by Mortgage Status in Pittsburg
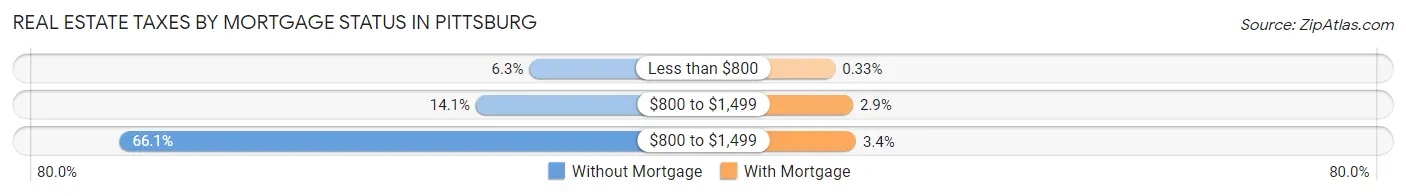
| Property Taxes | Without Mortgage | With Mortgage |
| Less than $800 | 239 (6.3%) | 33 (0.3%) |
| $800 to $1,499 | 537 (14.1%) | 292 (2.9%) |
| $800 to $1,499 | 2,525 (66.1%) | 337 (3.4%) |
| Total | 3,819 (100.0%) | 10,016 (100.0%) |
Health & Disability in Pittsburg
Health Insurance Coverage by Age in Pittsburg
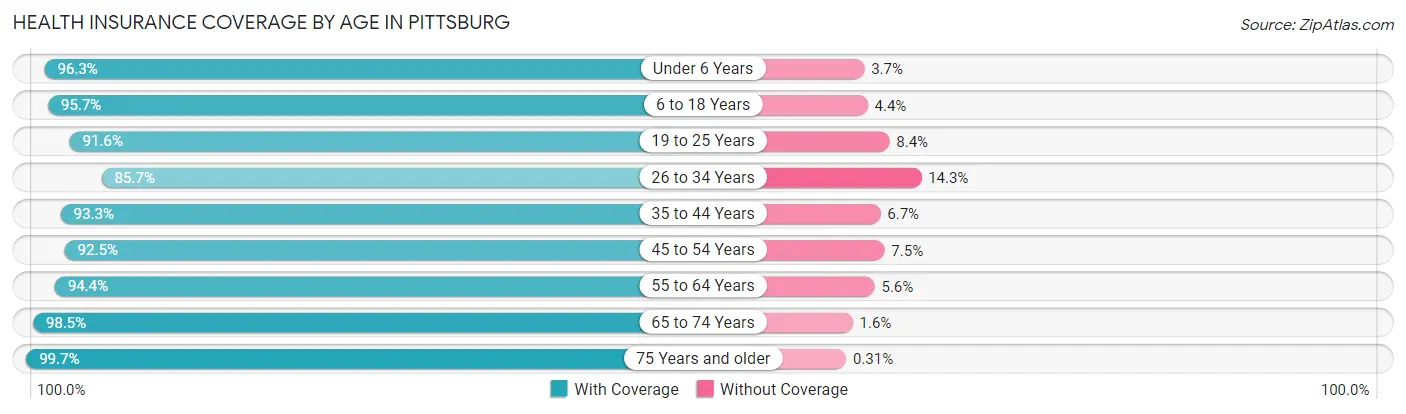
| Age Bracket | With Coverage | Without Coverage |
| Under 6 Years | 5,656 (96.3%) | 218 (3.7%) |
| 6 to 18 Years | 11,977 (95.7%) | 545 (4.3%) |
| 19 to 25 Years | 7,306 (91.6%) | 670 (8.4%) |
| 26 to 34 Years | 9,937 (85.7%) | 1,664 (14.3%) |
| 35 to 44 Years | 9,625 (93.3%) | 695 (6.7%) |
| 45 to 54 Years | 8,538 (92.5%) | 690 (7.5%) |
| 55 to 64 Years | 8,415 (94.4%) | 503 (5.6%) |
| 65 to 74 Years | 6,143 (98.5%) | 97 (1.5%) |
| 75 Years and older | 3,502 (99.7%) | 11 (0.3%) |
| Total | 71,099 (93.3%) | 5,093 (6.7%) |
Health Insurance Coverage by Citizenship Status in Pittsburg
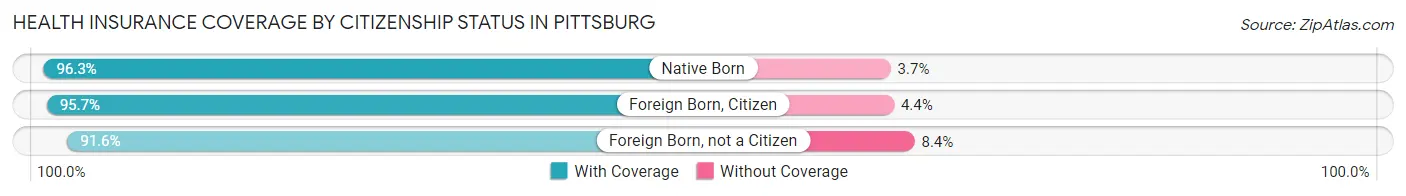
| Citizenship Status | With Coverage | Without Coverage |
| Native Born | 5,656 (96.3%) | 218 (3.7%) |
| Foreign Born, Citizen | 11,977 (95.7%) | 545 (4.3%) |
| Foreign Born, not a Citizen | 7,306 (91.6%) | 670 (8.4%) |
Health Insurance Coverage by Household Income in Pittsburg
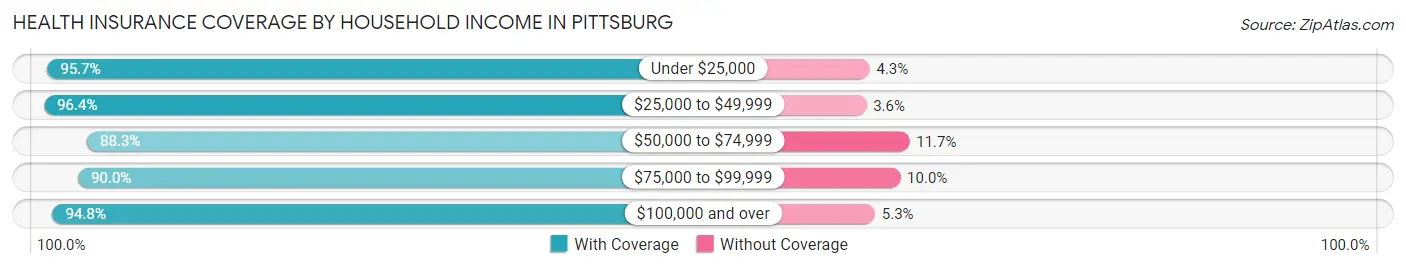
| Household Income | With Coverage | Without Coverage |
| Under $25,000 | 4,916 (95.7%) | 219 (4.3%) |
| $25,000 to $49,999 | 6,574 (96.4%) | 248 (3.6%) |
| $50,000 to $74,999 | 10,607 (88.3%) | 1,407 (11.7%) |
| $75,000 to $99,999 | 7,988 (90.0%) | 888 (10.0%) |
| $100,000 and over | 40,743 (94.8%) | 2,259 (5.2%) |
Public vs Private Health Insurance Coverage by Age in Pittsburg
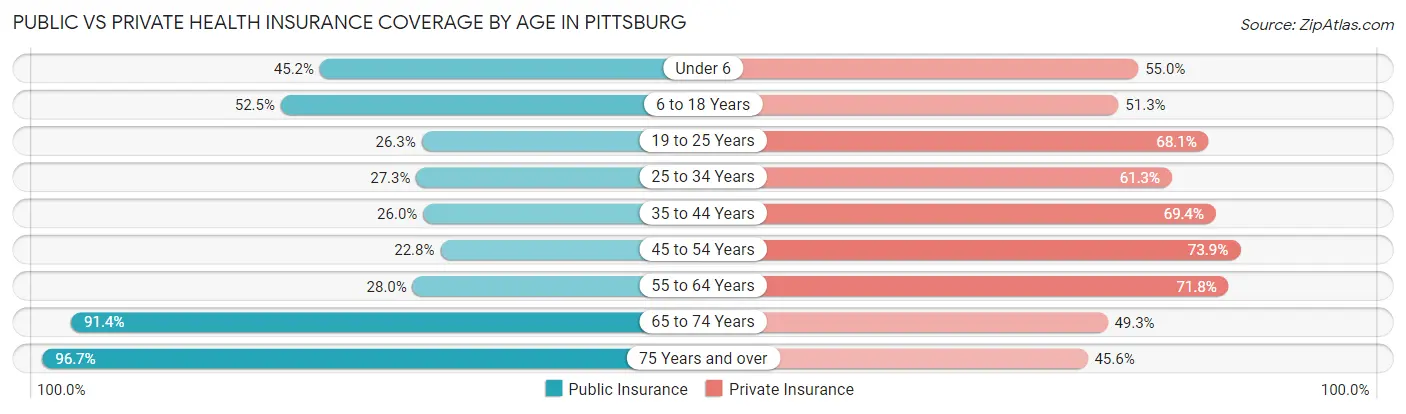
| Age Bracket | Public Insurance | Private Insurance |
| Under 6 | 2,655 (45.2%) | 3,232 (55.0%) |
| 6 to 18 Years | 6,568 (52.4%) | 6,429 (51.3%) |
| 19 to 25 Years | 2,099 (26.3%) | 5,429 (68.1%) |
| 25 to 34 Years | 3,166 (27.3%) | 7,107 (61.3%) |
| 35 to 44 Years | 2,685 (26.0%) | 7,164 (69.4%) |
| 45 to 54 Years | 2,108 (22.8%) | 6,820 (73.9%) |
| 55 to 64 Years | 2,495 (28.0%) | 6,403 (71.8%) |
| 65 to 74 Years | 5,701 (91.4%) | 3,077 (49.3%) |
| 75 Years and over | 3,397 (96.7%) | 1,602 (45.6%) |
| Total | 30,874 (40.5%) | 47,263 (62.0%) |
Disability Status by Sex by Age in Pittsburg
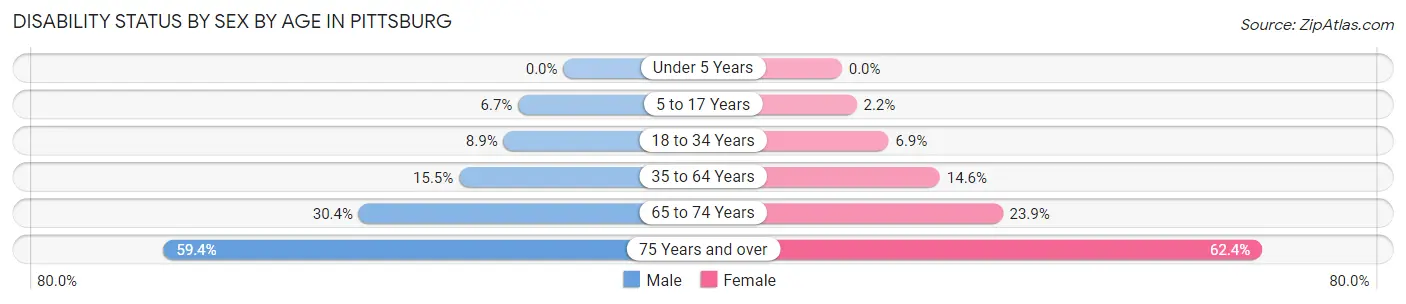
| Age Bracket | Male | Female |
| Under 5 Years | 0 (0.0%) | 0 (0.0%) |
| 5 to 17 Years | 427 (6.7%) | 127 (2.2%) |
| 18 to 34 Years | 924 (8.9%) | 709 (6.9%) |
| 35 to 64 Years | 2,161 (15.5%) | 2,112 (14.6%) |
| 65 to 74 Years | 867 (30.4%) | 808 (23.9%) |
| 75 Years and over | 696 (59.4%) | 1,461 (62.4%) |
Disability Class by Sex by Age in Pittsburg
Disability Class: Hearing Difficulty
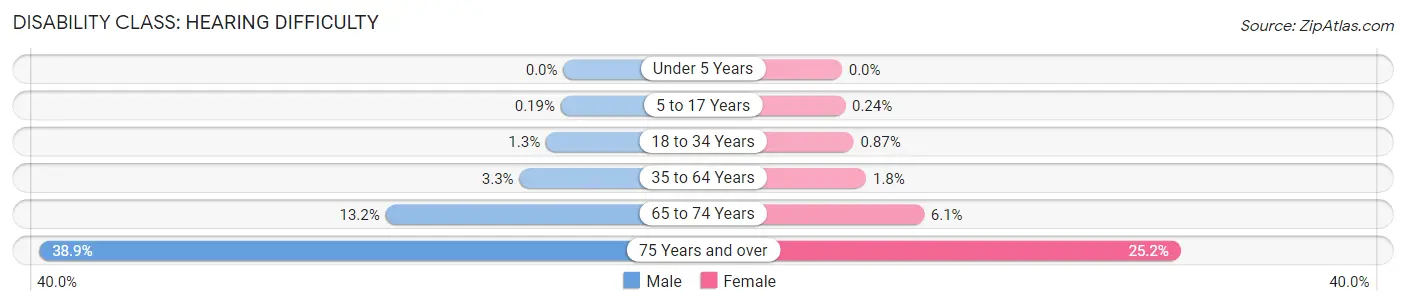
| Age Bracket | Male | Female |
| Under 5 Years | 0 (0.0%) | 0 (0.0%) |
| 5 to 17 Years | 12 (0.2%) | 14 (0.2%) |
| 18 to 34 Years | 134 (1.3%) | 89 (0.9%) |
| 35 to 64 Years | 455 (3.3%) | 261 (1.8%) |
| 65 to 74 Years | 377 (13.2%) | 206 (6.1%) |
| 75 Years and over | 456 (38.9%) | 589 (25.2%) |
Disability Class: Vision Difficulty
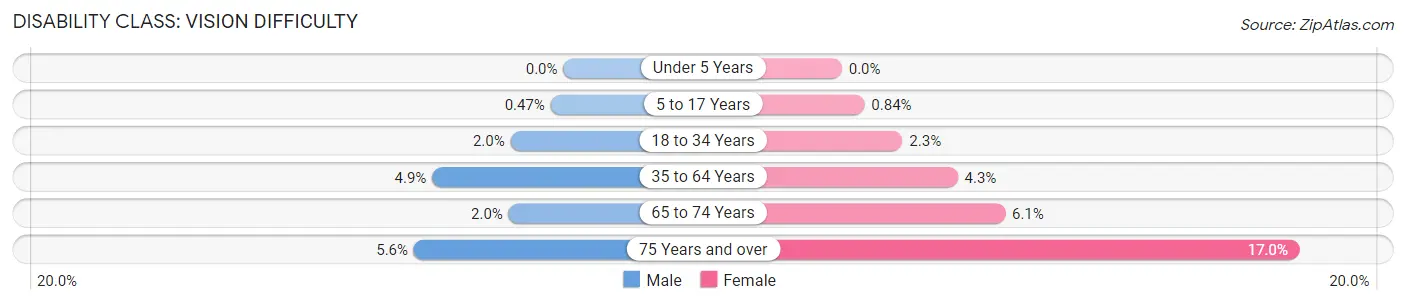
| Age Bracket | Male | Female |
| Under 5 Years | 0 (0.0%) | 0 (0.0%) |
| 5 to 17 Years | 30 (0.5%) | 49 (0.8%) |
| 18 to 34 Years | 204 (2.0%) | 230 (2.2%) |
| 35 to 64 Years | 680 (4.9%) | 624 (4.3%) |
| 65 to 74 Years | 58 (2.0%) | 205 (6.1%) |
| 75 Years and over | 65 (5.6%) | 398 (17.0%) |
Disability Class: Cognitive Difficulty
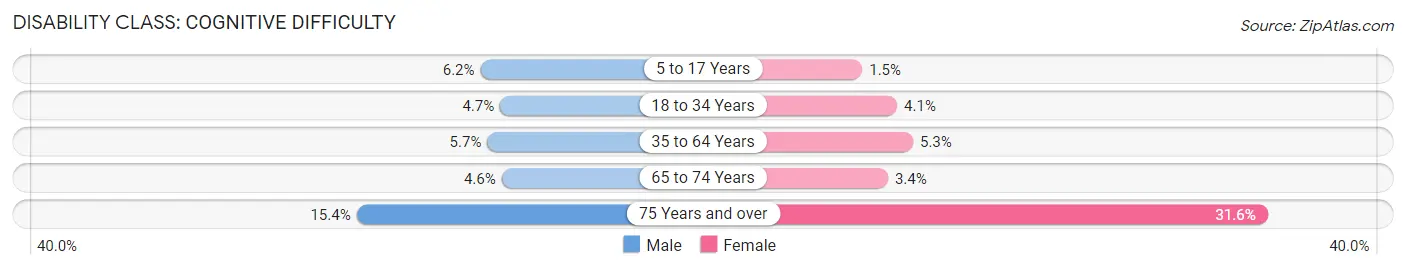
| Age Bracket | Male | Female |
| 5 to 17 Years | 392 (6.2%) | 88 (1.5%) |
| 18 to 34 Years | 488 (4.7%) | 420 (4.1%) |
| 35 to 64 Years | 789 (5.7%) | 767 (5.3%) |
| 65 to 74 Years | 131 (4.6%) | 116 (3.4%) |
| 75 Years and over | 180 (15.4%) | 740 (31.6%) |
Disability Class: Ambulatory Difficulty
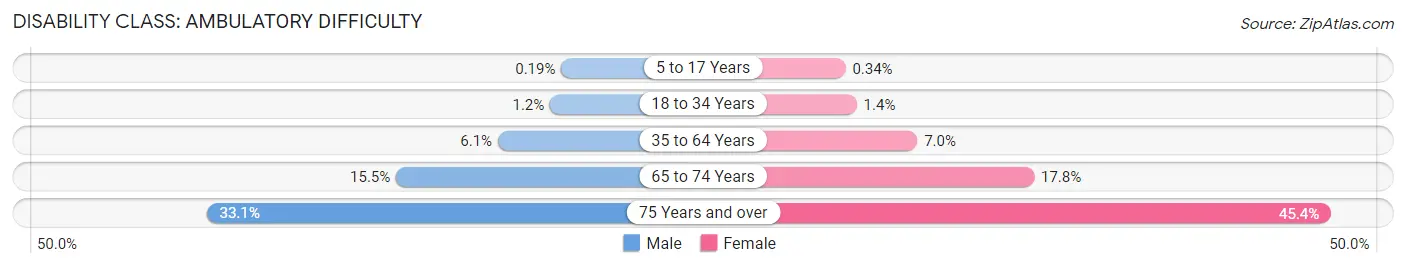
| Age Bracket | Male | Female |
| 5 to 17 Years | 12 (0.2%) | 20 (0.3%) |
| 18 to 34 Years | 128 (1.2%) | 141 (1.4%) |
| 35 to 64 Years | 847 (6.1%) | 1,015 (7.0%) |
| 65 to 74 Years | 443 (15.5%) | 604 (17.8%) |
| 75 Years and over | 388 (33.1%) | 1,063 (45.4%) |
Disability Class: Self-Care Difficulty
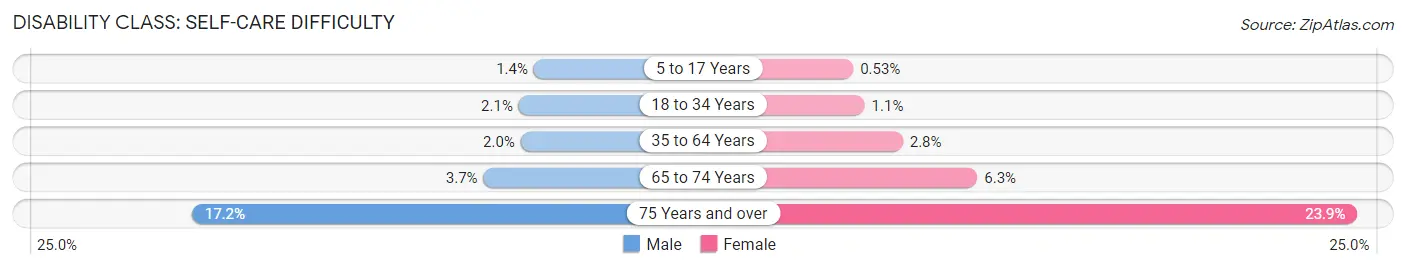
| Age Bracket | Male | Female |
| 5 to 17 Years | 87 (1.4%) | 31 (0.5%) |
| 18 to 34 Years | 215 (2.1%) | 108 (1.1%) |
| 35 to 64 Years | 277 (2.0%) | 411 (2.8%) |
| 65 to 74 Years | 106 (3.7%) | 213 (6.3%) |
| 75 Years and over | 202 (17.2%) | 560 (23.9%) |
Technology Access in Pittsburg
Computing Device Access in Pittsburg
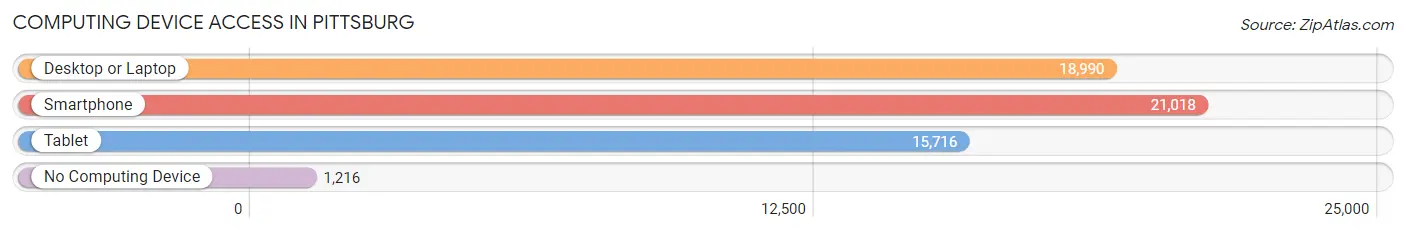
| Device Type | # Households | % Households |
| Desktop or Laptop | 18,990 | 81.7% |
| Smartphone | 21,018 | 90.4% |
| Tablet | 15,716 | 67.6% |
| No Computing Device | 1,216 | 5.2% |
| Total | 23,254 | 100.0% |
Internet Access in Pittsburg
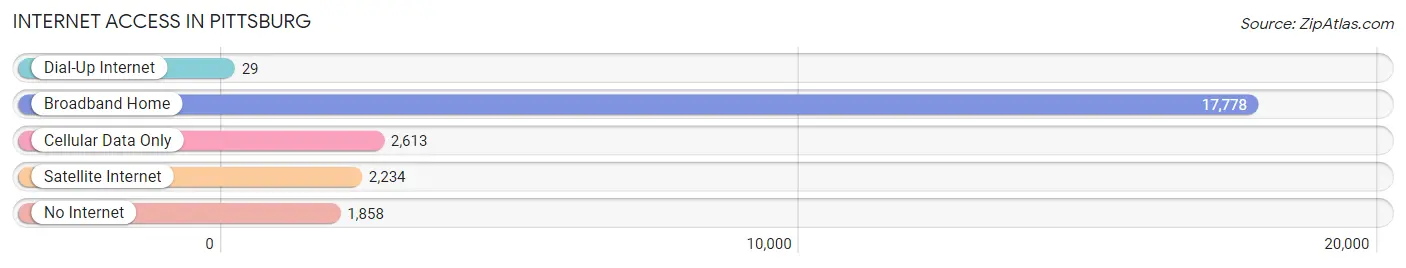
| Internet Type | # Households | % Households |
| Dial-Up Internet | 29 | 0.1% |
| Broadband Home | 17,778 | 76.4% |
| Cellular Data Only | 2,613 | 11.2% |
| Satellite Internet | 2,234 | 9.6% |
| No Internet | 1,858 | 8.0% |
| Total | 23,254 | 100.0% |
Pittsburg Summary
Pittsburg, California is a city located in Contra Costa County, California, United States. It is located in the East Bay region of the San Francisco Bay Area. The population was 63,264 at the 2010 census. It is located on the southern shore of the Suisun Bay in the East Bay region of the San Francisco Bay Area.
History
The area around what is now Pittsburg was originally inhabited by the Native American tribe known as the Ohlone. The first European settlers arrived in the area in the early 1800s, and the town was officially founded in 1839. The town was named after Pittsburgh, Pennsylvania, which was the hometown of an early settler.
In the late 1800s, the town became a major shipping port for coal and other goods. The town was also home to a large steel mill, which was the largest employer in the area. The steel mill closed in the early 1980s, and the town has since shifted its focus to other industries, such as retail and tourism.
Geography
Pittsburg is located at 38°00′N 121°52′W (38.00, -121.52). According to the United States Census Bureau, the city has a total area of 11.6 square miles (30.1 km2), of which 11.5 square miles (29.9 km2) is land and 0.1 square miles (0.2 km2) (0.86%) is water.
The city is located on the southern shore of the Suisun Bay, which is part of the San Francisco Bay. The city is bordered by the cities of Antioch to the south, Bay Point to the west, and Concord to the north.
Economy
Pittsburg is a major industrial center in the East Bay region of the San Francisco Bay Area. The city is home to several large industrial companies, including Chevron, Shell Oil, and the Pittsburg Refinery. The city is also home to several retail stores, including Walmart, Target, and Home Depot.
The city is also home to several educational institutions, including Los Medanos College and Pittsburg Adult Education. The city is also home to several medical facilities, including Sutter Delta Medical Center and Kaiser Permanente.
Demographics
As of the 2010 census, there were 63,264 people, 22,945 households, and 15,845 families residing in the city. The population density was 5,457.2 people per square mile (2,109.7/km2). There were 24,068 housing units at an average density of 2,093.3 per square mile (807.2/km2). The racial makeup of the city was 44.2% White, 16.3% African American, 0.7% Native American, 16.2% Asian, 0.3% Pacific Islander, 16.2% from other races, and 6.2% from two or more races. Hispanic or Latino of any race were 33.2% of the population.
There were 22,945 households, out of which 36.2% had children under the age of 18 living with them, 44.2% were married couples living together, 17.7% had a female householder with no husband present, and 31.2% were non-families. 24.3% of all households were made up of individuals, and 8.2% had someone living alone who was 65 years of age or older. The average household size was 2.75 and the average family size was 3.27.
In the city, the population was spread out, with 27.2% under the age of 18, 10.2% from 18 to 24, 30.2% from 25 to 44, 21.3% from 45 to 64, and 11.1% who were 65 years of age or older. The median age was 33 years. For every 100 females, there were 95.2 males. For every 100 females age 18 and over, there were 91.7 males.
The median income for a household in the city was $50,945, and the median income for a family was $58,837. Males had a median income of $41,945 versus $33,844 for females. The per capita income for the city was $22,945. About 10.2% of families and 12.7% of the population were below the poverty line, including 17.2% of those under age 18 and 8.2% of those age 65 or over.
Common Questions
What is Per Capita Income in Pittsburg?
Per Capita income in Pittsburg is $36,333.
What is the Median Family Income in Pittsburg?
Median Family Income in Pittsburg is $105,261.
What is the Median Household income in Pittsburg?
Median Household Income in Pittsburg is $98,408.
What is Income or Wage Gap in Pittsburg?
Income or Wage Gap in Pittsburg is 26.5%.
Women in Pittsburg earn 73.5 cents for every dollar earned by a man.
What is Family Income Deficit in Pittsburg?
Family Income Deficit in Pittsburg is $10,587.
Families that are below poverty line in Pittsburg earn $10,587 less on average than the poverty threshold level.
What is Inequality or Gini Index in Pittsburg?
Inequality or Gini Index in Pittsburg is 0.41.
What is the Total Population of Pittsburg?
Total Population of Pittsburg is 76,419.
What is the Total Male Population of Pittsburg?
Total Male Population of Pittsburg is 37,698.
What is the Total Female Population of Pittsburg?
Total Female Population of Pittsburg is 38,721.
What is the Ratio of Males per 100 Females in Pittsburg?
There are 97.36 Males per 100 Females in Pittsburg.
What is the Ratio of Females per 100 Males in Pittsburg?
There are 102.71 Females per 100 Males in Pittsburg.
What is the Median Population Age in Pittsburg?
Median Population Age in Pittsburg is 35.2 Years.
What is the Average Family Size in Pittsburg
Average Family Size in Pittsburg is 3.6 People.
What is the Average Household Size in Pittsburg
Average Household Size in Pittsburg is 3.3 People.
How Large is the Labor Force in Pittsburg?
There are 40,035 People in the Labor Forcein in Pittsburg.
What is the Percentage of People in the Labor Force in Pittsburg?
65.4% of People are in the Labor Force in Pittsburg.
What is the Unemployment Rate in Pittsburg?
Unemployment Rate in Pittsburg is 7.1%.