Lakewood, CA Map & Demographics
Lakewood Map
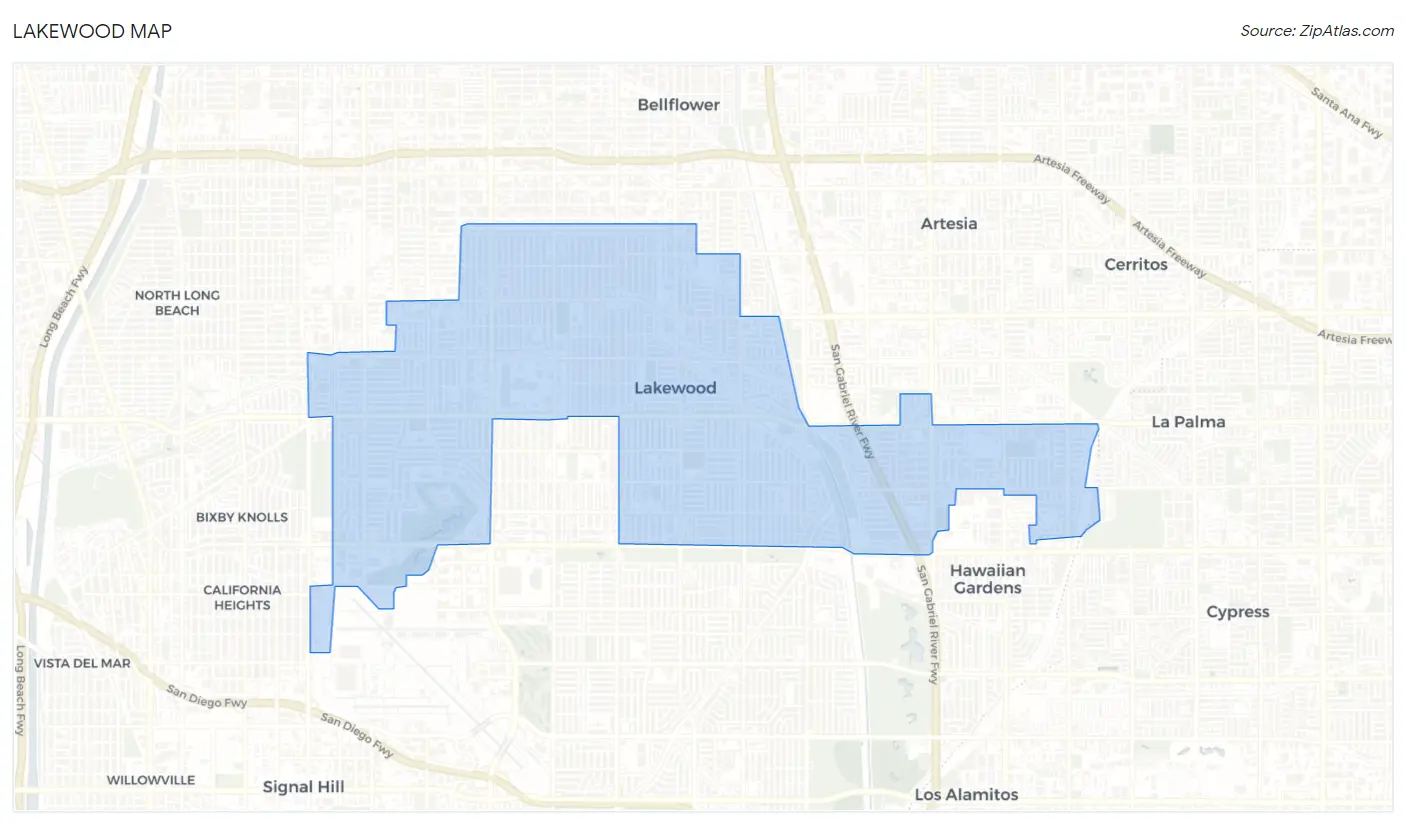
Lakewood Overview
$43,086
PER CAPITA INCOME
$120,962
AVG FAMILY INCOME
$113,030
AVG HOUSEHOLD INCOME
17.7%
WAGE / INCOME GAP [ % ]
82.3¢/ $1
WAGE / INCOME GAP [ $ ]
$11,522
FAMILY INCOME DEFICIT
0.38
INEQUALITY / GINI INDEX
81,499
TOTAL POPULATION
39,978
MALE POPULATION
41,521
FEMALE POPULATION
96.28
MALES / 100 FEMALES
103.86
FEMALES / 100 MALES
38.4
MEDIAN AGE
3.5
AVG FAMILY SIZE
3.1
AVG HOUSEHOLD SIZE
45,300
LABOR FORCE [ PEOPLE ]
68.2%
PERCENT IN LABOR FORCE
5.7%
UNEMPLOYMENT RATE
Income in Lakewood
Income Overview in Lakewood
Per Capita Income in Lakewood is $43,086, while median incomes of families and households are $120,962 and $113,030 respectively.
| Characteristic | Number | Measure |
| Per Capita Income | 81,499 | $43,086 |
| Median Family Income | 20,539 | $120,962 |
| Mean Family Income | 20,539 | $140,091 |
| Median Household Income | 26,388 | $113,030 |
| Mean Household Income | 26,388 | $129,703 |
| Income Deficit | 20,539 | $11,522 |
| Wage / Income Gap (%) | 81,499 | 17.72% |
| Wage / Income Gap ($) | 81,499 | 82.28¢ per $1 |
| Gini / Inequality Index | 81,499 | 0.38 |
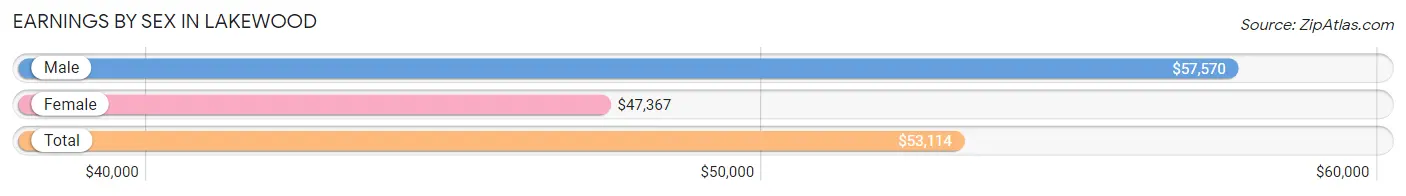
Earnings by Sex in Lakewood
Average Earnings in Lakewood are $53,114, $57,570 for men and $47,367 for women, a difference of 17.7%.
| Sex | Number | Average Earnings |
| Male | 23,196 (51.1%) | $57,570 |
| Female | 22,196 (48.9%) | $47,367 |
| Total | 45,392 (100.0%) | $53,114 |
Earnings by Sex by Income Bracket in Lakewood
The most common earnings brackets in Lakewood are $100,000+ for men (5,813 | 25.1%) and $100,000+ for women (3,625 | 16.3%).

| Income | Male | Female |
| $2,499 or less | 742 (3.2%) | 786 (3.5%) |
| $2,500 to $4,999 | 444 (1.9%) | 639 (2.9%) |
| $5,000 to $7,499 | 650 (2.8%) | 824 (3.7%) |
| $7,500 to $9,999 | 432 (1.9%) | 505 (2.3%) |
| $10,000 to $12,499 | 611 (2.6%) | 822 (3.7%) |
| $12,500 to $14,999 | 502 (2.2%) | 596 (2.7%) |
| $15,000 to $17,499 | 551 (2.4%) | 509 (2.3%) |
| $17,500 to $19,999 | 359 (1.5%) | 487 (2.2%) |
| $20,000 to $22,499 | 392 (1.7%) | 437 (2.0%) |
| $22,500 to $24,999 | 431 (1.9%) | 762 (3.4%) |
| $25,000 to $29,999 | 905 (3.9%) | 1,082 (4.9%) |
| $30,000 to $34,999 | 933 (4.0%) | 1,264 (5.7%) |
| $35,000 to $39,999 | 905 (3.9%) | 957 (4.3%) |
| $40,000 to $44,999 | 1,045 (4.5%) | 910 (4.1%) |
| $45,000 to $49,999 | 1,122 (4.8%) | 969 (4.4%) |
| $50,000 to $54,999 | 859 (3.7%) | 722 (3.3%) |
| $55,000 to $64,999 | 1,946 (8.4%) | 1,771 (8.0%) |
| $65,000 to $74,999 | 1,561 (6.7%) | 1,532 (6.9%) |
| $75,000 to $99,999 | 2,993 (12.9%) | 2,997 (13.5%) |
| $100,000+ | 5,813 (25.1%) | 3,625 (16.3%) |
| Total | 23,196 (100.0%) | 22,196 (100.0%) |
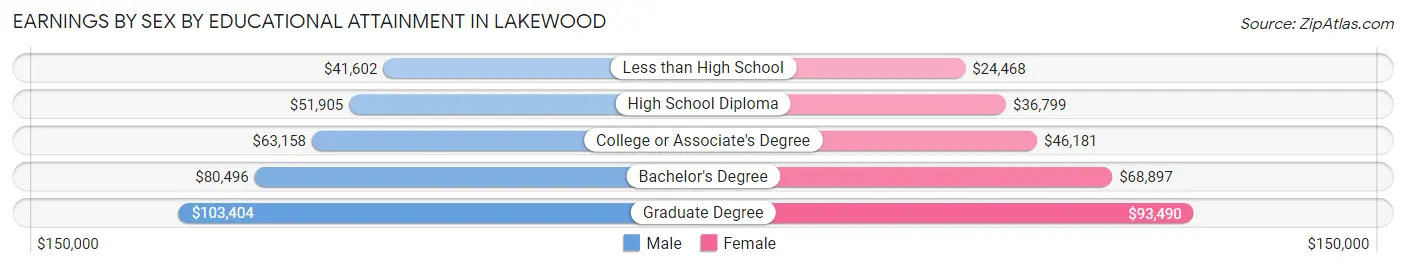
Earnings by Sex by Educational Attainment in Lakewood
Average earnings in Lakewood are $65,569 for men and $55,064 for women, a difference of 16.0%. Men with an educational attainment of graduate degree enjoy the highest average annual earnings of $103,404, while those with less than high school education earn the least with $41,602. Women with an educational attainment of graduate degree earn the most with the average annual earnings of $93,490, while those with less than high school education have the smallest earnings of $24,468.
| Educational Attainment | Male Income | Female Income |
| Less than High School | $41,602 | $24,468 |
| High School Diploma | $51,905 | $36,799 |
| College or Associate's Degree | $63,158 | $46,181 |
| Bachelor's Degree | $80,496 | $68,897 |
| Graduate Degree | $103,404 | $93,490 |
| Total | $65,569 | $55,064 |
Family Income in Lakewood
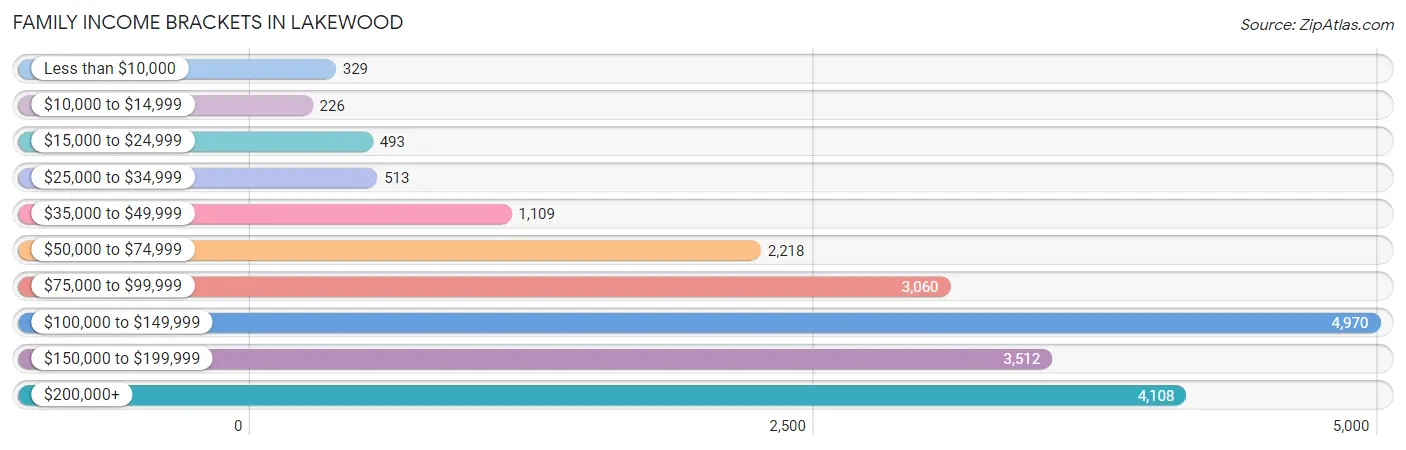
Family Income Brackets in Lakewood
According to the Lakewood family income data, there are 4,970 families falling into the $100,000 to $149,999 income range, which is the most common income bracket and makes up 24.2% of all families. Conversely, the $10,000 to $14,999 income bracket is the least frequent group with only 226 families (1.1%) belonging to this category.
| Income Bracket | # Families | % Families |
| Less than $10,000 | 329 | 1.6% |
| $10,000 to $14,999 | 226 | 1.1% |
| $15,000 to $24,999 | 493 | 2.4% |
| $25,000 to $34,999 | 513 | 2.5% |
| $35,000 to $49,999 | 1,109 | 5.4% |
| $50,000 to $74,999 | 2,218 | 10.8% |
| $75,000 to $99,999 | 3,060 | 14.9% |
| $100,000 to $149,999 | 4,970 | 24.2% |
| $150,000 to $199,999 | 3,512 | 17.1% |
| $200,000+ | 4,108 | 20.0% |
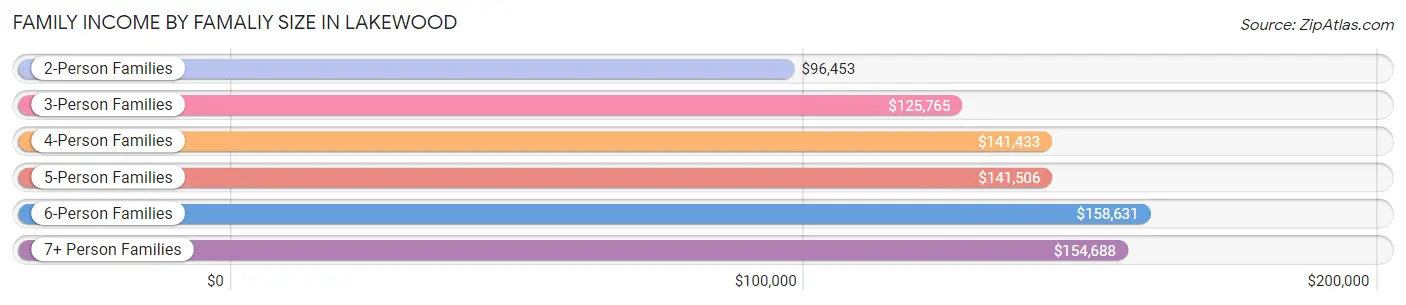
Family Income by Famaliy Size in Lakewood
6-person families (846 | 4.1%) account for the highest median family income in Lakewood with $158,631 per family, while 2-person families (6,954 | 33.9%) have the highest median income of $48,226 per family member.
| Income Bracket | # Families | Median Income |
| 2-Person Families | 6,954 (33.9%) | $96,453 |
| 3-Person Families | 5,333 (26.0%) | $125,765 |
| 4-Person Families | 4,908 (23.9%) | $141,433 |
| 5-Person Families | 2,095 (10.2%) | $141,506 |
| 6-Person Families | 846 (4.1%) | $158,631 |
| 7+ Person Families | 403 (2.0%) | $154,688 |
| Total | 20,539 (100.0%) | $120,962 |
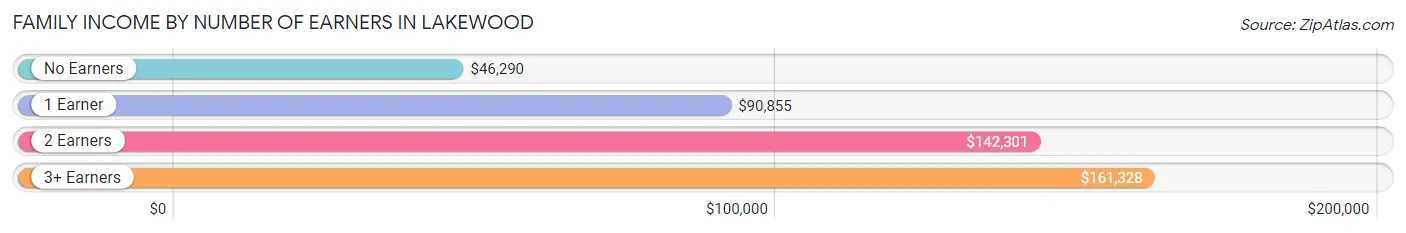
Family Income by Number of Earners in Lakewood
The median family income in Lakewood is $120,962, with families comprising 3+ earners (4,389) having the highest median family income of $161,328, while families with no earners (2,240) have the lowest median family income of $46,290, accounting for 21.4% and 10.9% of families, respectively.
| Number of Earners | # Families | Median Income |
| No Earners | 2,240 (10.9%) | $46,290 |
| 1 Earner | 5,083 (24.7%) | $90,855 |
| 2 Earners | 8,827 (43.0%) | $142,301 |
| 3+ Earners | 4,389 (21.4%) | $161,328 |
| Total | 20,539 (100.0%) | $120,962 |
Household Income in Lakewood
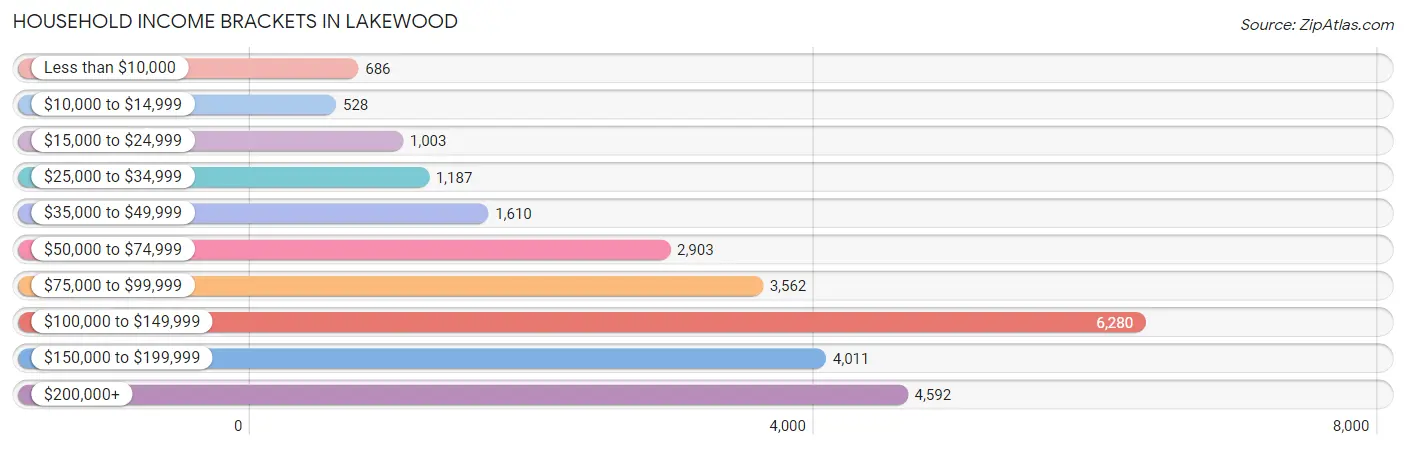
Household Income Brackets in Lakewood
With 6,280 households falling in the category, the $100,000 to $149,999 income range is the most frequent in Lakewood, accounting for 23.8% of all households. In contrast, only 528 households (2.0%) fall into the $10,000 to $14,999 income bracket, making it the least populous group.
| Income Bracket | # Households | % Households |
| Less than $10,000 | 686 | 2.6% |
| $10,000 to $14,999 | 528 | 2.0% |
| $15,000 to $24,999 | 1,003 | 3.8% |
| $25,000 to $34,999 | 1,187 | 4.5% |
| $35,000 to $49,999 | 1,610 | 6.1% |
| $50,000 to $74,999 | 2,903 | 11.0% |
| $75,000 to $99,999 | 3,562 | 13.5% |
| $100,000 to $149,999 | 6,280 | 23.8% |
| $150,000 to $199,999 | 4,011 | 15.2% |
| $200,000+ | 4,592 | 17.4% |
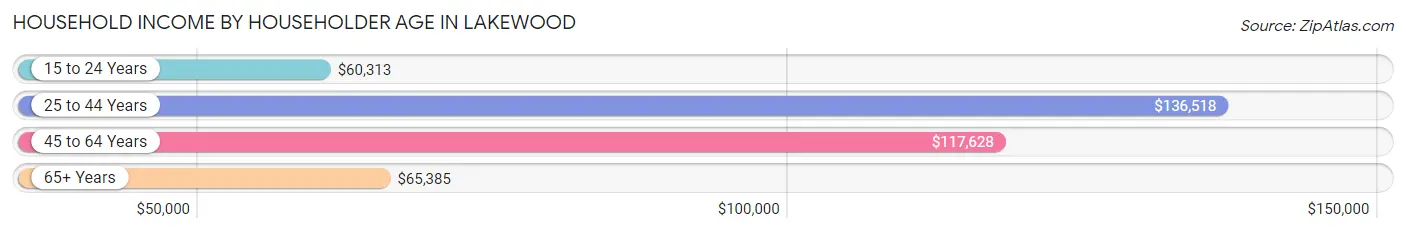
Household Income by Householder Age in Lakewood
The median household income in Lakewood is $113,030, with the highest median household income of $136,518 found in the 25 to 44 years age bracket for the primary householder. A total of 8,927 households (33.8%) fall into this category. Meanwhile, the 15 to 24 years age bracket for the primary householder has the lowest median household income of $60,313, with 342 households (1.3%) in this group.
| Income Bracket | # Households | Median Income |
| 15 to 24 Years | 342 (1.3%) | $60,313 |
| 25 to 44 Years | 8,927 (33.8%) | $136,518 |
| 45 to 64 Years | 11,022 (41.8%) | $117,628 |
| 65+ Years | 6,097 (23.1%) | $65,385 |
| Total | 26,388 (100.0%) | $113,030 |
Poverty in Lakewood
Income Below Poverty by Sex and Age in Lakewood
With 5.1% poverty level for males and 6.8% for females among the residents of Lakewood, 5 year old males and 5 year old females are the most vulnerable to poverty, with 64 males (9.0%) and 57 females (12.7%) in their respective age groups living below the poverty level.
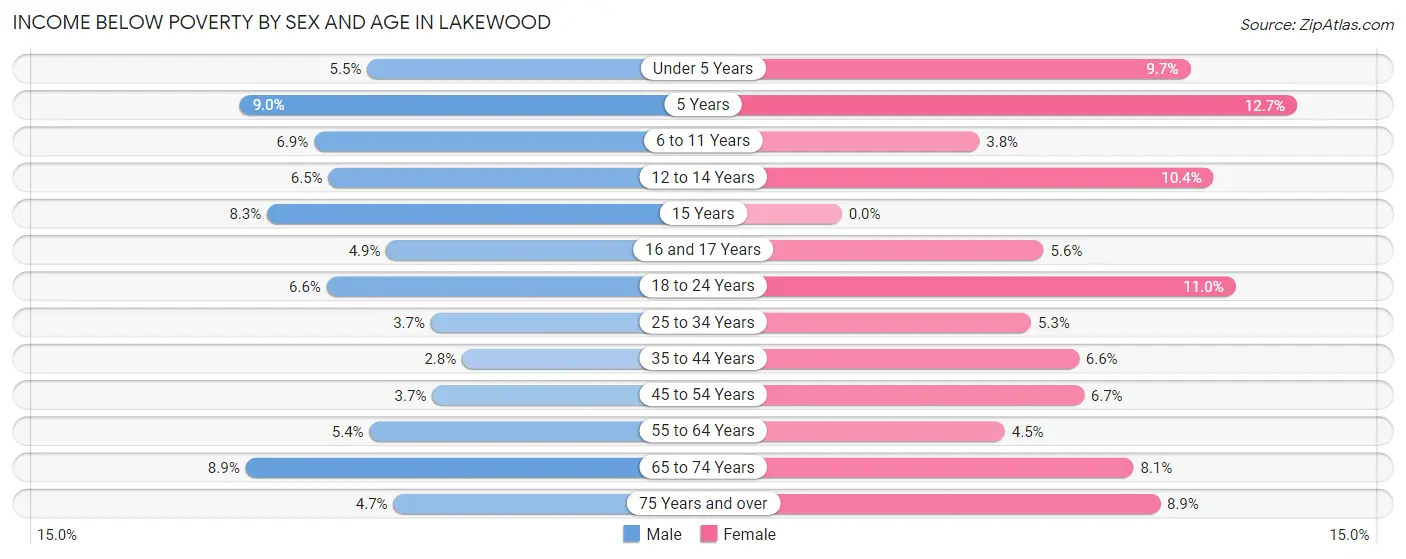
| Age Bracket | Male | Female |
| Under 5 Years | 148 (5.5%) | 218 (9.7%) |
| 5 Years | 64 (9.0%) | 57 (12.7%) |
| 6 to 11 Years | 192 (6.9%) | 98 (3.8%) |
| 12 to 14 Years | 89 (6.5%) | 136 (10.3%) |
| 15 Years | 25 (8.3%) | 0 (0.0%) |
| 16 and 17 Years | 40 (4.9%) | 46 (5.6%) |
| 18 to 24 Years | 257 (6.6%) | 372 (11.0%) |
| 25 to 34 Years | 216 (3.7%) | 333 (5.3%) |
| 35 to 44 Years | 176 (2.8%) | 383 (6.6%) |
| 45 to 54 Years | 175 (3.6%) | 374 (6.7%) |
| 55 to 64 Years | 299 (5.4%) | 268 (4.5%) |
| 65 to 74 Years | 249 (8.8%) | 305 (8.1%) |
| 75 Years and over | 99 (4.7%) | 251 (8.9%) |
| Total | 2,029 (5.1%) | 2,841 (6.8%) |
Income Above Poverty by Sex and Age in Lakewood
According to the poverty statistics in Lakewood, males aged 35 to 44 years and females aged 15 years are the age groups that are most secure financially, with 97.2% of males and 100.0% of females in these age groups living above the poverty line.
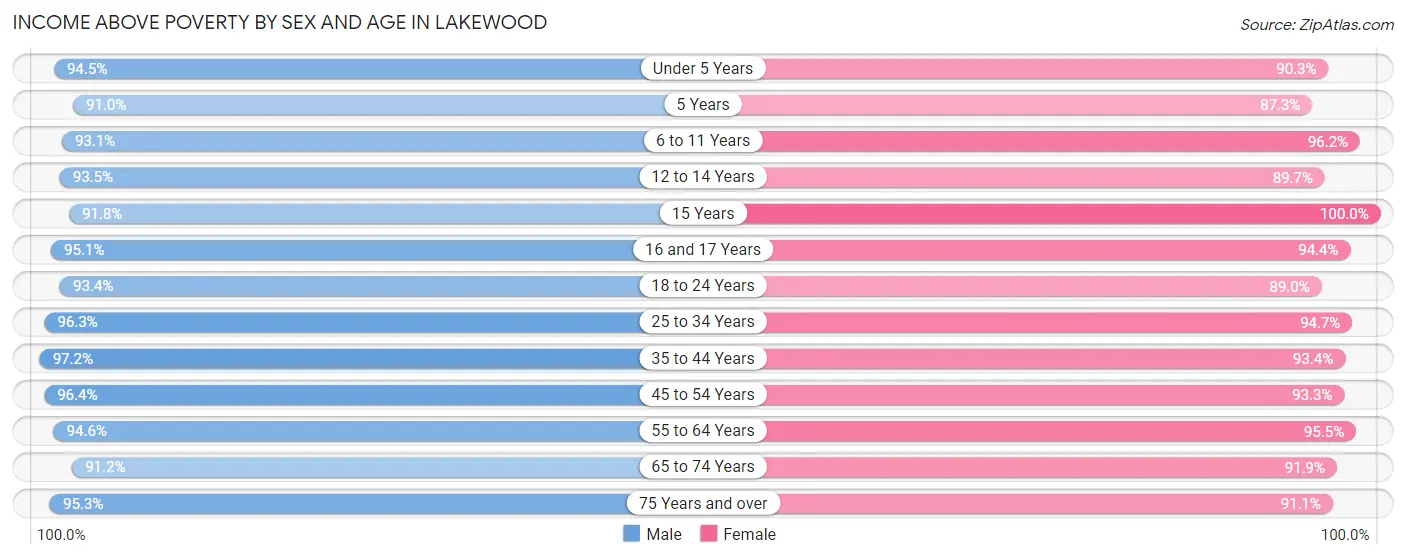
| Age Bracket | Male | Female |
| Under 5 Years | 2,563 (94.5%) | 2,030 (90.3%) |
| 5 Years | 646 (91.0%) | 393 (87.3%) |
| 6 to 11 Years | 2,573 (93.1%) | 2,463 (96.2%) |
| 12 to 14 Years | 1,272 (93.5%) | 1,178 (89.6%) |
| 15 Years | 278 (91.7%) | 561 (100.0%) |
| 16 and 17 Years | 771 (95.1%) | 773 (94.4%) |
| 18 to 24 Years | 3,644 (93.4%) | 3,021 (89.0%) |
| 25 to 34 Years | 5,643 (96.3%) | 5,985 (94.7%) |
| 35 to 44 Years | 6,058 (97.2%) | 5,417 (93.4%) |
| 45 to 54 Years | 4,626 (96.4%) | 5,178 (93.3%) |
| 55 to 64 Years | 5,236 (94.6%) | 5,631 (95.5%) |
| 65 to 74 Years | 2,565 (91.1%) | 3,452 (91.9%) |
| 75 Years and over | 1,995 (95.3%) | 2,582 (91.1%) |
| Total | 37,870 (94.9%) | 38,664 (93.2%) |
Income Below Poverty Among Married-Couple Families in Lakewood
The poverty statistics for married-couple families in Lakewood show that 2.6% or 392 of the total 14,981 families live below the poverty line. Families with no children have the highest poverty rate of 2.9%, comprising of 240 families. On the other hand, families with 3 or 4 children have the lowest poverty rate of 0.0%, which includes 0 families.
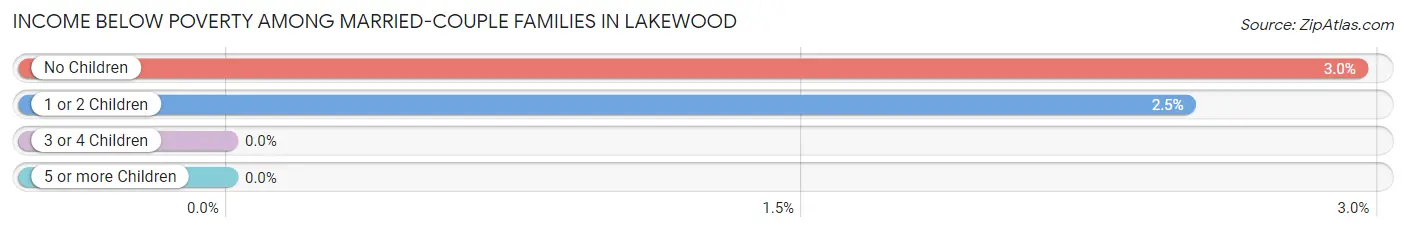
| Children | Above Poverty | Below Poverty |
| No Children | 7,897 (97.1%) | 240 (2.9%) |
| 1 or 2 Children | 5,937 (97.5%) | 152 (2.5%) |
| 3 or 4 Children | 709 (100.0%) | 0 (0.0%) |
| 5 or more Children | 46 (100.0%) | 0 (0.0%) |
| Total | 14,589 (97.4%) | 392 (2.6%) |
Income Below Poverty Among Single-Parent Households in Lakewood
According to the poverty data in Lakewood, 6.8% or 112 single-father households and 9.1% or 354 single-mother households are living below the poverty line. Among single-father households, those with 3 or 4 children have the highest poverty rate, with 30 households (50.8%) experiencing poverty. Likewise, among single-mother households, those with 5 or more children have the highest poverty rate, with 10 households (100.0%) falling below the poverty line.
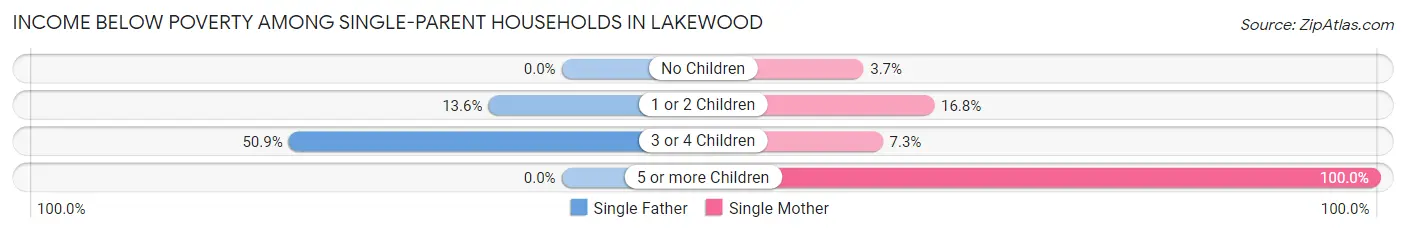
| Children | Single Father | Single Mother |
| No Children | 0 (0.0%) | 79 (3.6%) |
| 1 or 2 Children | 82 (13.6%) | 245 (16.8%) |
| 3 or 4 Children | 30 (50.8%) | 20 (7.2%) |
| 5 or more Children | 0 (0.0%) | 10 (100.0%) |
| Total | 112 (6.8%) | 354 (9.1%) |
Income Below Poverty Among Married-Couple vs Single-Parent Households in Lakewood
The poverty data for Lakewood shows that 392 of the married-couple family households (2.6%) and 466 of the single-parent households (8.4%) are living below the poverty level. Within the married-couple family households, those with no children have the highest poverty rate, with 240 households (2.9%) falling below the poverty line. Among the single-parent households, those with 5 or more children have the highest poverty rate, with 10 household (100.0%) living below poverty.
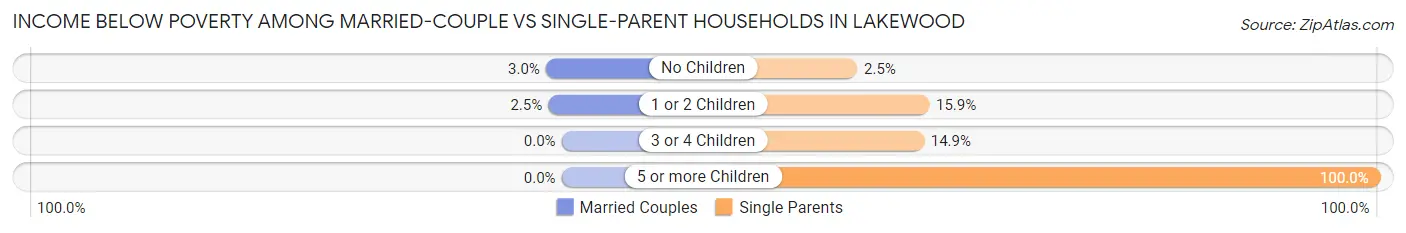
| Children | Married-Couple Families | Single-Parent Households |
| No Children | 240 (2.9%) | 79 (2.5%) |
| 1 or 2 Children | 152 (2.5%) | 327 (15.9%) |
| 3 or 4 Children | 0 (0.0%) | 50 (14.9%) |
| 5 or more Children | 0 (0.0%) | 10 (100.0%) |
| Total | 392 (2.6%) | 466 (8.4%) |
Race in Lakewood
The most populous races in Lakewood are White / Caucasian (33,912 | 41.6%), Hispanic or Latino (29,060 | 35.7%), and Asian (15,282 | 18.8%).
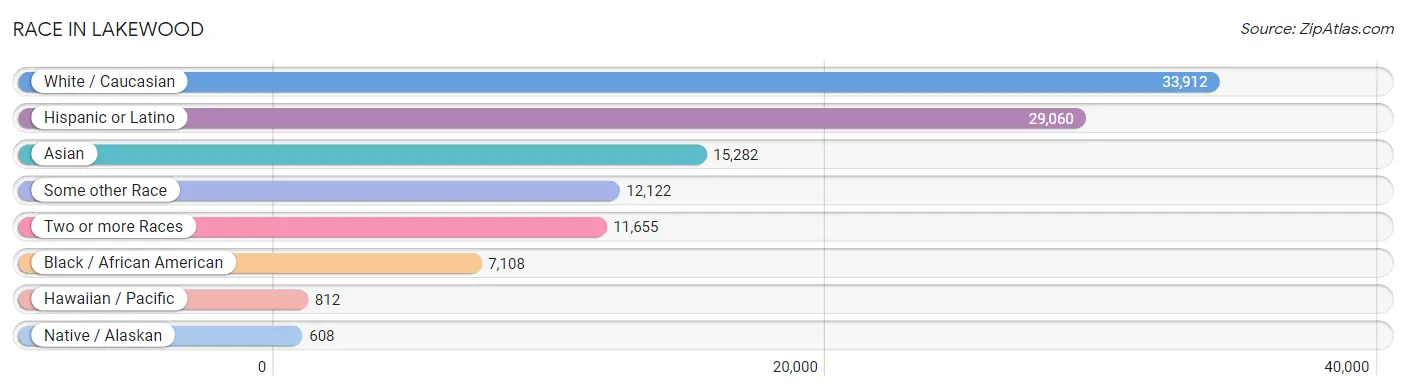
| Race | # Population | % Population |
| Asian | 15,282 | 18.8% |
| Black / African American | 7,108 | 8.7% |
| Hawaiian / Pacific | 812 | 1.0% |
| Hispanic or Latino | 29,060 | 35.7% |
| Native / Alaskan | 608 | 0.7% |
| White / Caucasian | 33,912 | 41.6% |
| Two or more Races | 11,655 | 14.3% |
| Some other Race | 12,122 | 14.9% |
| Total | 81,499 | 100.0% |
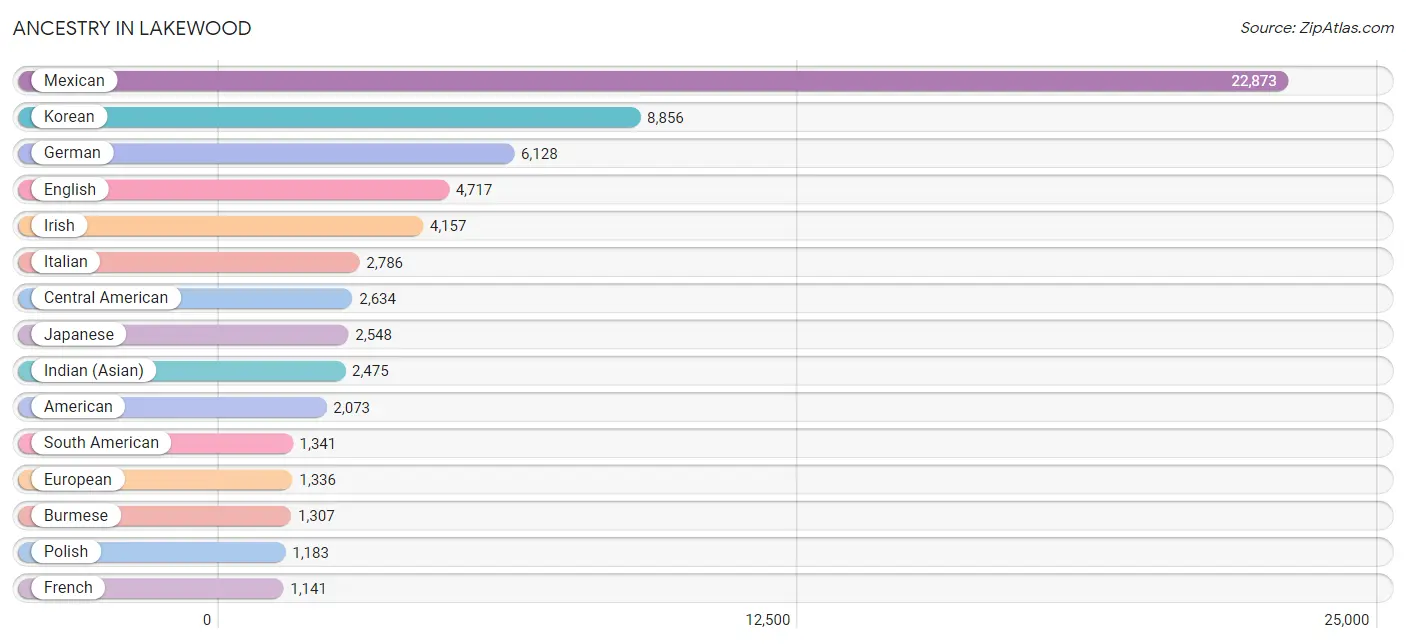
Ancestry in Lakewood
The most populous ancestries reported in Lakewood are Mexican (22,873 | 28.1%), Korean (8,856 | 10.9%), German (6,128 | 7.5%), English (4,717 | 5.8%), and Irish (4,157 | 5.1%), together accounting for 57.4% of all Lakewood residents.
| Ancestry | # Population | % Population |
| African | 528 | 0.6% |
| American | 2,073 | 2.5% |
| Apache | 9 | 0.0% |
| Arab | 588 | 0.7% |
| Argentinean | 542 | 0.7% |
| Armenian | 93 | 0.1% |
| Austrian | 36 | 0.0% |
| Bahamian | 9 | 0.0% |
| Basque | 29 | 0.0% |
| Belizean | 31 | 0.0% |
| Bhutanese | 1,117 | 1.4% |
| Blackfeet | 42 | 0.1% |
| Bolivian | 13 | 0.0% |
| Brazilian | 36 | 0.0% |
| British | 456 | 0.6% |
| Burmese | 1,307 | 1.6% |
| Canadian | 110 | 0.1% |
| Central American | 2,634 | 3.2% |
| Central American Indian | 240 | 0.3% |
| Cherokee | 188 | 0.2% |
| Chilean | 73 | 0.1% |
| Choctaw | 69 | 0.1% |
| Colombian | 179 | 0.2% |
| Comanche | 23 | 0.0% |
| Costa Rican | 129 | 0.2% |
| Croatian | 36 | 0.0% |
| Cuban | 346 | 0.4% |
| Czech | 141 | 0.2% |
| Czechoslovakian | 32 | 0.0% |
| Danish | 451 | 0.5% |
| Dominican | 40 | 0.1% |
| Dutch | 1,002 | 1.2% |
| Eastern European | 142 | 0.2% |
| Ecuadorian | 240 | 0.3% |
| Egyptian | 37 | 0.1% |
| English | 4,717 | 5.8% |
| Ethiopian | 308 | 0.4% |
| European | 1,336 | 1.6% |
| Filipino | 80 | 0.1% |
| Finnish | 98 | 0.1% |
| French | 1,141 | 1.4% |
| French American Indian | 65 | 0.1% |
| French Canadian | 213 | 0.3% |
| German | 6,128 | 7.5% |
| Greek | 172 | 0.2% |
| Guamanian / Chamorro | 208 | 0.3% |
| Guatemalan | 988 | 1.2% |
| Guyanese | 11 | 0.0% |
| Haitian | 43 | 0.1% |
| Honduran | 394 | 0.5% |
| Hungarian | 151 | 0.2% |
| Icelander | 18 | 0.0% |
| Indian (Asian) | 2,475 | 3.0% |
| Iranian | 142 | 0.2% |
| Irish | 4,157 | 5.1% |
| Israeli | 30 | 0.0% |
| Italian | 2,786 | 3.4% |
| Jamaican | 47 | 0.1% |
| Japanese | 2,548 | 3.1% |
| Jordanian | 2 | 0.0% |
| Korean | 8,856 | 10.9% |
| Laotian | 204 | 0.3% |
| Lebanese | 256 | 0.3% |
| Lithuanian | 7 | 0.0% |
| Malaysian | 73 | 0.1% |
| Mexican | 22,873 | 28.1% |
| Mexican American Indian | 376 | 0.5% |
| Mongolian | 19 | 0.0% |
| Moroccan | 38 | 0.1% |
| Native Hawaiian | 365 | 0.4% |
| Navajo | 64 | 0.1% |
| Nicaraguan | 74 | 0.1% |
| Nigerian | 105 | 0.1% |
| Northern European | 147 | 0.2% |
| Norwegian | 776 | 0.9% |
| Pakistani | 781 | 1.0% |
| Palestinian | 47 | 0.1% |
| Panamanian | 42 | 0.1% |
| Pennsylvania German | 6 | 0.0% |
| Peruvian | 209 | 0.3% |
| Pima | 11 | 0.0% |
| Polish | 1,183 | 1.5% |
| Portuguese | 514 | 0.6% |
| Puerto Rican | 493 | 0.6% |
| Romanian | 168 | 0.2% |
| Russian | 518 | 0.6% |
| Salvadoran | 960 | 1.2% |
| Samoan | 578 | 0.7% |
| Scandinavian | 170 | 0.2% |
| Scotch-Irish | 318 | 0.4% |
| Scottish | 797 | 1.0% |
| Seminole | 20 | 0.0% |
| Serbian | 92 | 0.1% |
| Slavic | 24 | 0.0% |
| South American | 1,341 | 1.7% |
| South American Indian | 40 | 0.1% |
| Spaniard | 542 | 0.7% |
| Spanish | 93 | 0.1% |
| Sri Lankan | 878 | 1.1% |
| Subsaharan African | 941 | 1.1% |
| Swedish | 574 | 0.7% |
| Swiss | 127 | 0.2% |
| Syrian | 107 | 0.1% |
| Thai | 461 | 0.6% |
| Tongan | 259 | 0.3% |
| Turkish | 18 | 0.0% |
| Ukrainian | 42 | 0.1% |
| Venezuelan | 28 | 0.0% |
| Vietnamese | 68 | 0.1% |
| Welsh | 413 | 0.5% |
| Yakama | 4 | 0.0% |
| Yaqui | 22 | 0.0% |
| Yugoslavian | 8 | 0.0% | View All 113 Rows |
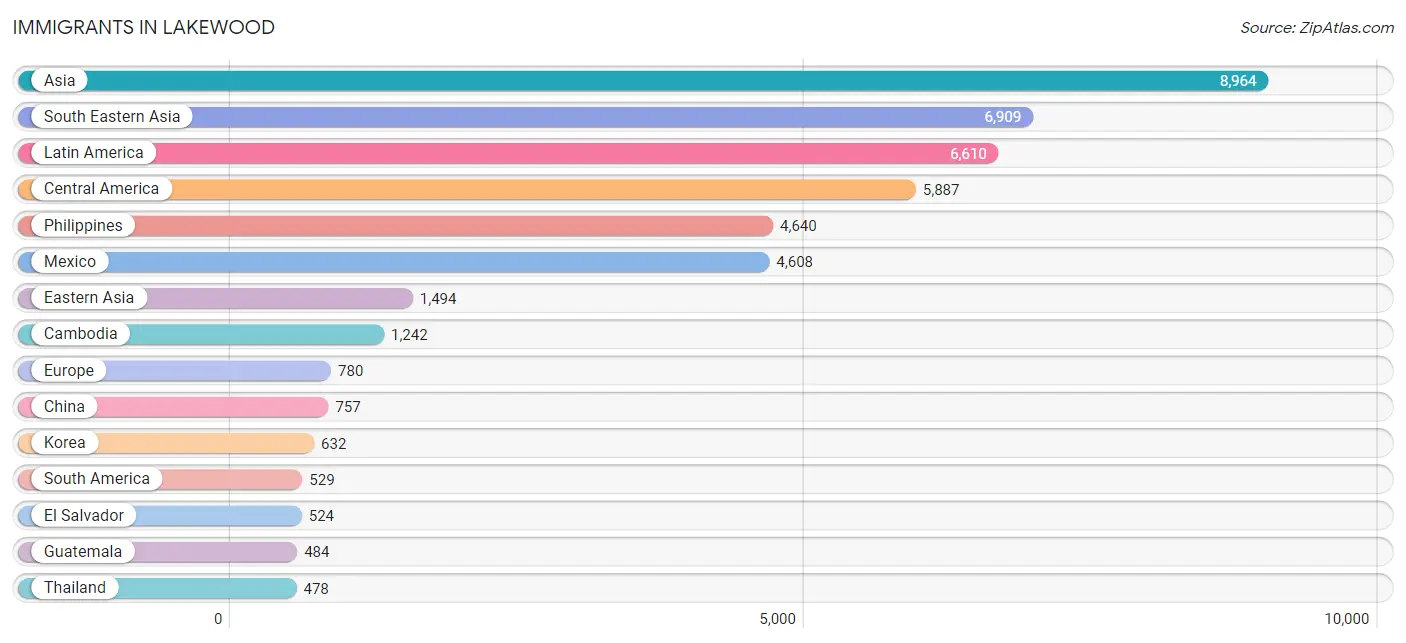
Immigrants in Lakewood
The most numerous immigrant groups reported in Lakewood came from Asia (8,964 | 11.0%), South Eastern Asia (6,909 | 8.5%), Latin America (6,610 | 8.1%), Central America (5,887 | 7.2%), and Philippines (4,640 | 5.7%), together accounting for 40.5% of all Lakewood residents.
| Immigration Origin | # Population | % Population |
| Africa | 254 | 0.3% |
| Argentina | 203 | 0.3% |
| Armenia | 10 | 0.0% |
| Asia | 8,964 | 11.0% |
| Australia | 5 | 0.0% |
| Austria | 34 | 0.0% |
| Bahamas | 9 | 0.0% |
| Bangladesh | 70 | 0.1% |
| Belize | 50 | 0.1% |
| Bolivia | 15 | 0.0% |
| Brazil | 80 | 0.1% |
| Cambodia | 1,242 | 1.5% |
| Cameroon | 12 | 0.0% |
| Canada | 206 | 0.3% |
| Caribbean | 194 | 0.2% |
| Central America | 5,887 | 7.2% |
| China | 757 | 0.9% |
| Colombia | 120 | 0.2% |
| Costa Rica | 48 | 0.1% |
| Cuba | 129 | 0.2% |
| Dominican Republic | 14 | 0.0% |
| Eastern Africa | 136 | 0.2% |
| Eastern Asia | 1,494 | 1.8% |
| Eastern Europe | 236 | 0.3% |
| Ecuador | 33 | 0.0% |
| Egypt | 37 | 0.1% |
| El Salvador | 524 | 0.6% |
| England | 48 | 0.1% |
| Ethiopia | 124 | 0.2% |
| Europe | 780 | 1.0% |
| Fiji | 40 | 0.1% |
| France | 30 | 0.0% |
| Germany | 115 | 0.1% |
| Greece | 20 | 0.0% |
| Guatemala | 484 | 0.6% |
| Guyana | 11 | 0.0% |
| Honduras | 94 | 0.1% |
| Hong Kong | 52 | 0.1% |
| India | 130 | 0.2% |
| Indonesia | 75 | 0.1% |
| Iran | 75 | 0.1% |
| Ireland | 25 | 0.0% |
| Israel | 52 | 0.1% |
| Italy | 7 | 0.0% |
| Jamaica | 26 | 0.0% |
| Japan | 105 | 0.1% |
| Jordan | 9 | 0.0% |
| Korea | 632 | 0.8% |
| Kuwait | 2 | 0.0% |
| Latin America | 6,610 | 8.1% |
| Lebanon | 11 | 0.0% |
| Malaysia | 21 | 0.0% |
| Mexico | 4,608 | 5.7% |
| Middle Africa | 12 | 0.0% |
| Nepal | 47 | 0.1% |
| Netherlands | 160 | 0.2% |
| Nicaragua | 54 | 0.1% |
| Nigeria | 58 | 0.1% |
| Northern Africa | 37 | 0.1% |
| Northern Europe | 139 | 0.2% |
| Oceania | 315 | 0.4% |
| Panama | 25 | 0.0% |
| Peru | 39 | 0.1% |
| Philippines | 4,640 | 5.7% |
| Poland | 74 | 0.1% |
| Portugal | 6 | 0.0% |
| Romania | 129 | 0.2% |
| Russia | 1 | 0.0% |
| Scotland | 5 | 0.0% |
| Singapore | 25 | 0.0% |
| South Africa | 11 | 0.0% |
| South America | 529 | 0.6% |
| South Central Asia | 393 | 0.5% |
| South Eastern Asia | 6,909 | 8.5% |
| Southern Europe | 66 | 0.1% |
| Spain | 33 | 0.0% |
| Sri Lanka | 71 | 0.1% |
| Sweden | 17 | 0.0% |
| Syria | 48 | 0.1% |
| Taiwan | 209 | 0.3% |
| Thailand | 478 | 0.6% |
| Trinidad and Tobago | 16 | 0.0% |
| Turkey | 11 | 0.0% |
| Venezuela | 28 | 0.0% |
| Vietnam | 428 | 0.5% |
| Western Africa | 58 | 0.1% |
| Western Asia | 151 | 0.2% |
| Western Europe | 339 | 0.4% | View All 88 Rows |
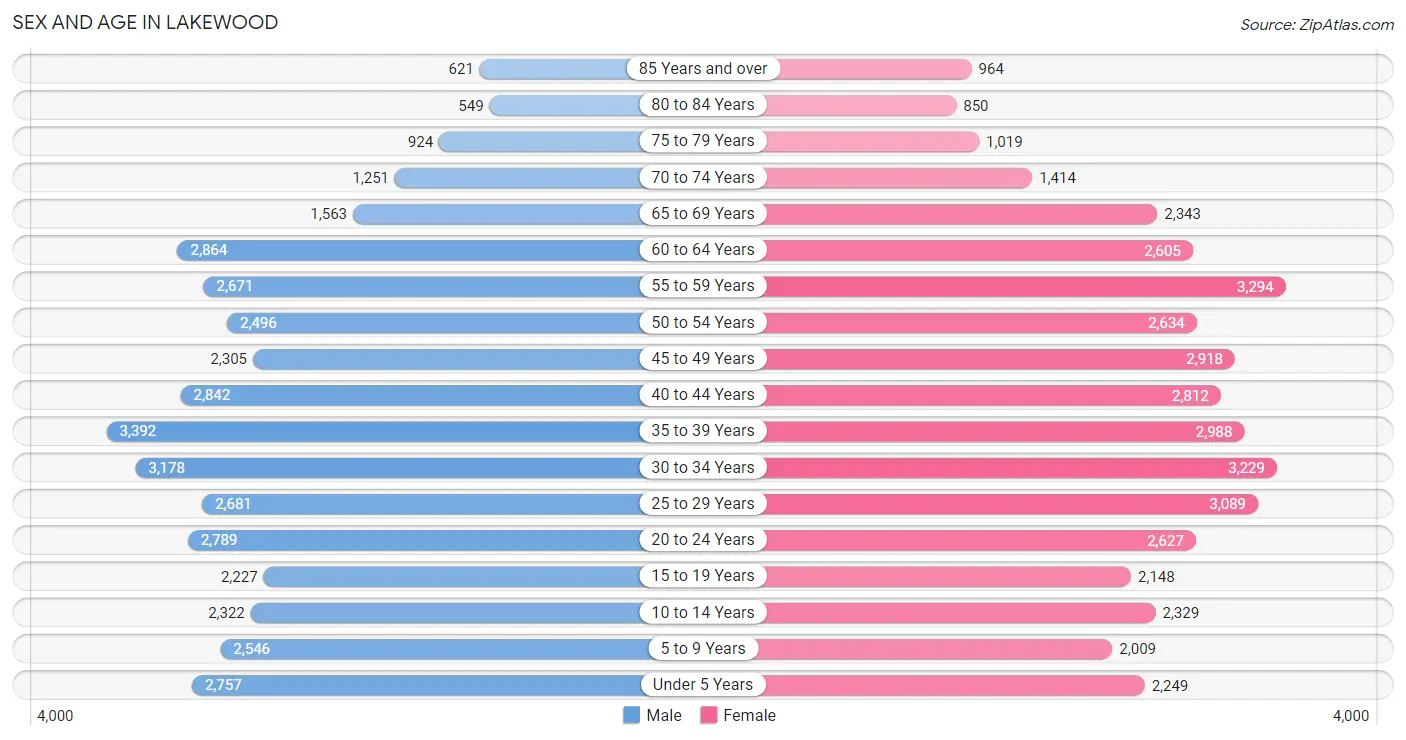
Sex and Age in Lakewood
Sex and Age in Lakewood
The most populous age groups in Lakewood are 35 to 39 Years (3,392 | 8.5%) for men and 55 to 59 Years (3,294 | 7.9%) for women.
| Age Bracket | Male | Female |
| Under 5 Years | 2,757 (6.9%) | 2,249 (5.4%) |
| 5 to 9 Years | 2,546 (6.4%) | 2,009 (4.8%) |
| 10 to 14 Years | 2,322 (5.8%) | 2,329 (5.6%) |
| 15 to 19 Years | 2,227 (5.6%) | 2,148 (5.2%) |
| 20 to 24 Years | 2,789 (7.0%) | 2,627 (6.3%) |
| 25 to 29 Years | 2,681 (6.7%) | 3,089 (7.4%) |
| 30 to 34 Years | 3,178 (8.0%) | 3,229 (7.8%) |
| 35 to 39 Years | 3,392 (8.5%) | 2,988 (7.2%) |
| 40 to 44 Years | 2,842 (7.1%) | 2,812 (6.8%) |
| 45 to 49 Years | 2,305 (5.8%) | 2,918 (7.0%) |
| 50 to 54 Years | 2,496 (6.2%) | 2,634 (6.3%) |
| 55 to 59 Years | 2,671 (6.7%) | 3,294 (7.9%) |
| 60 to 64 Years | 2,864 (7.2%) | 2,605 (6.3%) |
| 65 to 69 Years | 1,563 (3.9%) | 2,343 (5.6%) |
| 70 to 74 Years | 1,251 (3.1%) | 1,414 (3.4%) |
| 75 to 79 Years | 924 (2.3%) | 1,019 (2.5%) |
| 80 to 84 Years | 549 (1.4%) | 850 (2.1%) |
| 85 Years and over | 621 (1.5%) | 964 (2.3%) |
| Total | 39,978 (100.0%) | 41,521 (100.0%) |
Families and Households in Lakewood
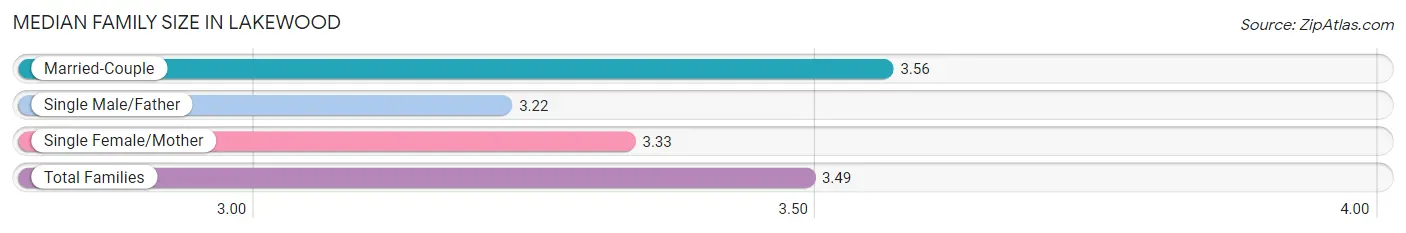
Median Family Size in Lakewood
The median family size in Lakewood is 3.49 persons per family, with married-couple families (14,981 | 72.9%) accounting for the largest median family size of 3.56 persons per family. On the other hand, single male/father families (1,651 | 8.0%) represent the smallest median family size with 3.22 persons per family.
| Family Type | # Families | Family Size |
| Married-Couple | 14,981 (72.9%) | 3.56 |
| Single Male/Father | 1,651 (8.0%) | 3.22 |
| Single Female/Mother | 3,907 (19.0%) | 3.33 |
| Total Families | 20,539 (100.0%) | 3.49 |
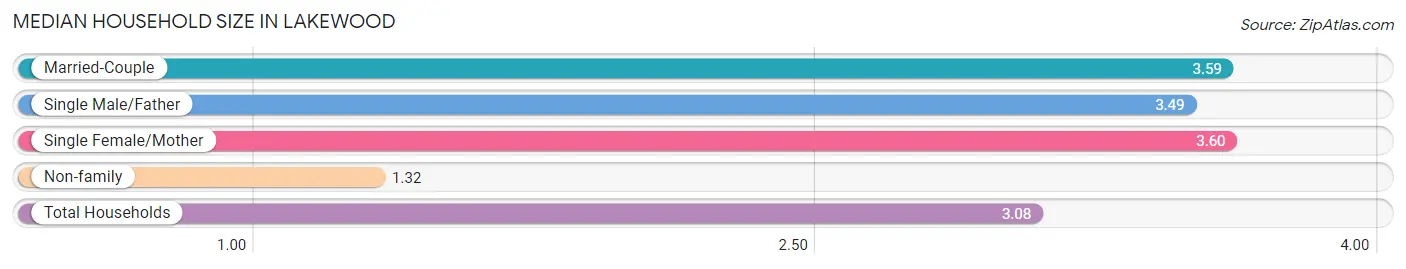
Median Household Size in Lakewood
The median household size in Lakewood is 3.08 persons per household, with single female/mother households (3,907 | 14.8%) accounting for the largest median household size of 3.6 persons per household. non-family households (5,849 | 22.2%) represent the smallest median household size with 1.32 persons per household.
| Household Type | # Households | Household Size |
| Married-Couple | 14,981 (56.8%) | 3.59 |
| Single Male/Father | 1,651 (6.3%) | 3.49 |
| Single Female/Mother | 3,907 (14.8%) | 3.60 |
| Non-family | 5,849 (22.2%) | 1.32 |
| Total Households | 26,388 (100.0%) | 3.08 |
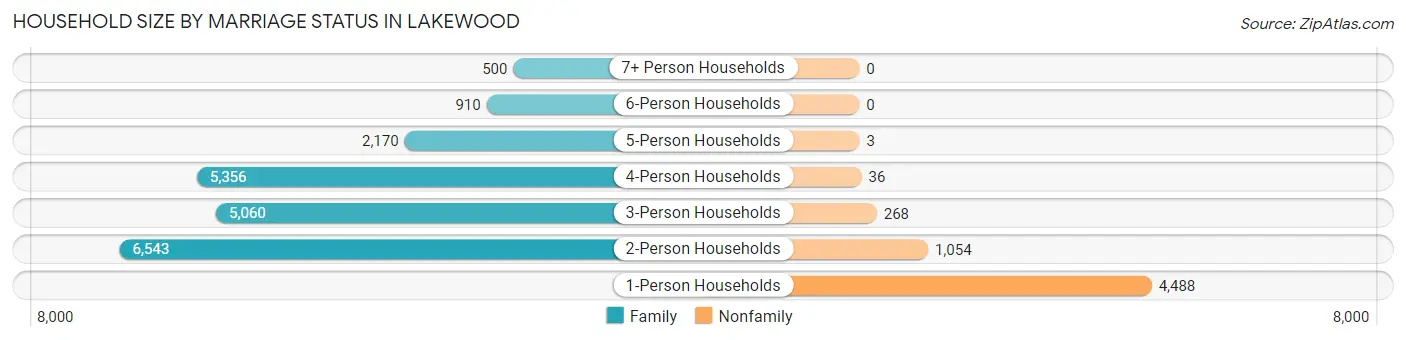
Household Size by Marriage Status in Lakewood
Out of a total of 26,388 households in Lakewood, 20,539 (77.8%) are family households, while 5,849 (22.2%) are nonfamily households. The most numerous type of family households are 2-person households, comprising 6,543, and the most common type of nonfamily households are 1-person households, comprising 4,488.
| Household Size | Family Households | Nonfamily Households |
| 1-Person Households | - | 4,488 (17.0%) |
| 2-Person Households | 6,543 (24.8%) | 1,054 (4.0%) |
| 3-Person Households | 5,060 (19.2%) | 268 (1.0%) |
| 4-Person Households | 5,356 (20.3%) | 36 (0.1%) |
| 5-Person Households | 2,170 (8.2%) | 3 (0.0%) |
| 6-Person Households | 910 (3.5%) | 0 (0.0%) |
| 7+ Person Households | 500 (1.9%) | 0 (0.0%) |
| Total | 20,539 (77.8%) | 5,849 (22.2%) |
Female Fertility in Lakewood
Fertility by Age in Lakewood
Average fertility rate in Lakewood is 56.0 births per 1,000 women. Women in the age bracket of 20 to 34 years have the highest fertility rate with 77.0 births per 1,000 women. Women in the age bracket of 20 to 34 years acount for 60.2% of all women with births.
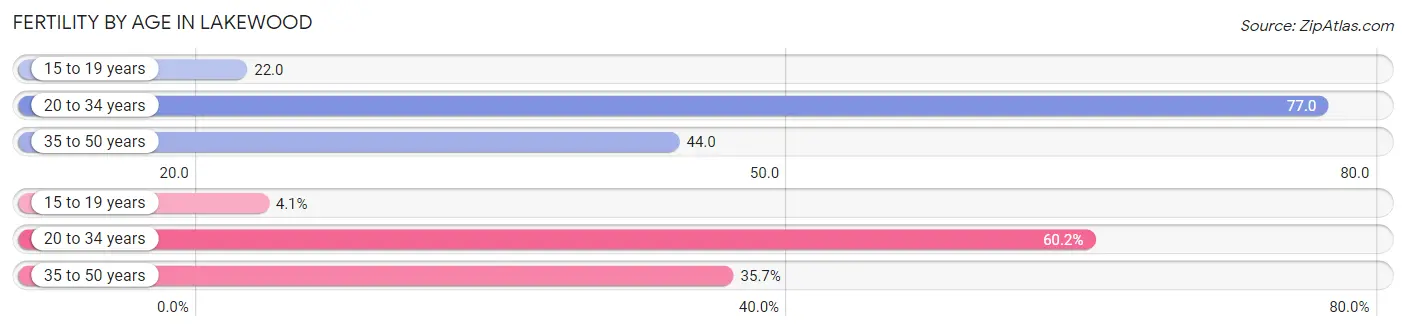
| Age Bracket | Women with Births | Births / 1,000 Women |
| 15 to 19 years | 47 (4.1%) | 22.0 |
| 20 to 34 years | 687 (60.2%) | 77.0 |
| 35 to 50 years | 407 (35.7%) | 44.0 |
| Total | 1,141 (100.0%) | 56.0 |
Fertility by Age by Marriage Status in Lakewood
74.9% of women with births (1,141) in Lakewood are married. The highest percentage of unmarried women with births falls into 15 to 19 years age bracket with 100.0% of them unmarried at the time of birth, while the lowest percentage of unmarried women with births belong to 20 to 34 years age bracket with 20.8% of them unmarried.
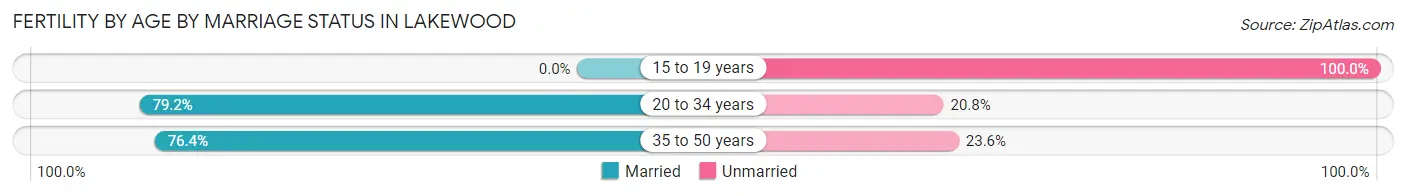
| Age Bracket | Married | Unmarried |
| 15 to 19 years | 0 (0.0%) | 47 (100.0%) |
| 20 to 34 years | 544 (79.2%) | 143 (20.8%) |
| 35 to 50 years | 311 (76.4%) | 96 (23.6%) |
| Total | 855 (74.9%) | 286 (25.1%) |
Fertility by Education in Lakewood
Average fertility rate in Lakewood is 56.0 births per 1,000 women. Women with the education attainment of graduate degree have the highest fertility rate of 109.0 births per 1,000 women, while women with the education attainment of less than high school have the lowest fertility at 29.0 births per 1,000 women. Women with the education attainment of bachelor's degree represent 33.0% of all women with births.
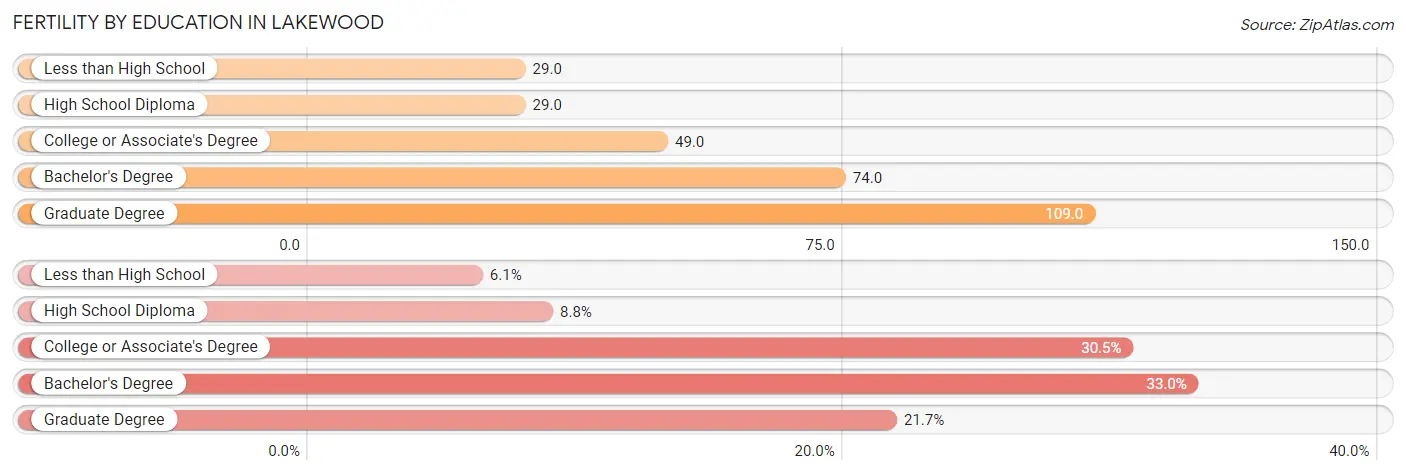
| Educational Attainment | Women with Births | Births / 1,000 Women |
| Less than High School | 70 (6.1%) | 29.0 |
| High School Diploma | 100 (8.8%) | 29.0 |
| College or Associate's Degree | 348 (30.5%) | 49.0 |
| Bachelor's Degree | 376 (33.0%) | 74.0 |
| Graduate Degree | 247 (21.6%) | 109.0 |
| Total | 1,141 (100.0%) | 56.0 |
Fertility by Education by Marriage Status in Lakewood
25.1% of women with births in Lakewood are unmarried. Women with the educational attainment of graduate degree are most likely to be married with 90.3% of them married at childbirth, while women with the educational attainment of high school diploma are least likely to be married with 59.0% of them unmarried at childbirth.
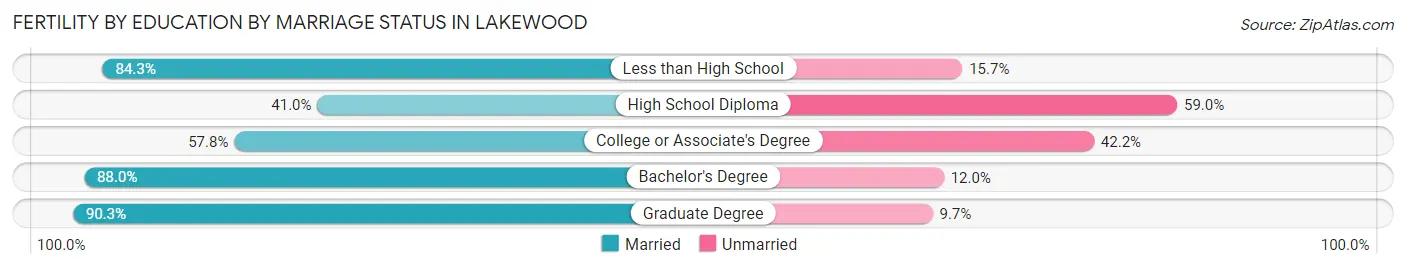
| Educational Attainment | Married | Unmarried |
| Less than High School | 59 (84.3%) | 11 (15.7%) |
| High School Diploma | 41 (41.0%) | 59 (59.0%) |
| College or Associate's Degree | 201 (57.8%) | 147 (42.2%) |
| Bachelor's Degree | 331 (88.0%) | 45 (12.0%) |
| Graduate Degree | 223 (90.3%) | 24 (9.7%) |
| Total | 855 (74.9%) | 286 (25.1%) |
Employment Characteristics in Lakewood
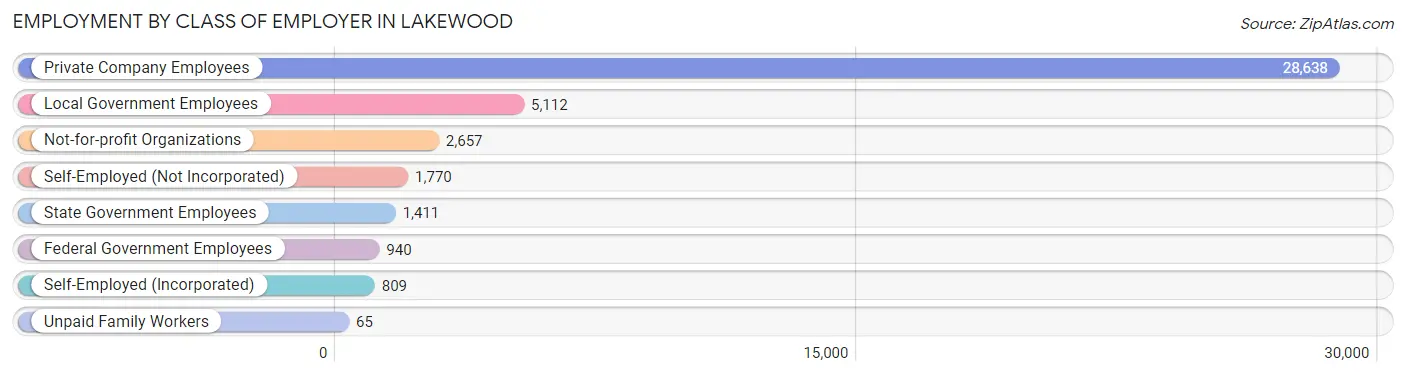
Employment by Class of Employer in Lakewood
Among the 41,402 employed individuals in Lakewood, private company employees (28,638 | 69.2%), local government employees (5,112 | 12.3%), and not-for-profit organizations (2,657 | 6.4%) make up the most common classes of employment.
| Employer Class | # Employees | % Employees |
| Private Company Employees | 28,638 | 69.2% |
| Self-Employed (Incorporated) | 809 | 1.9% |
| Self-Employed (Not Incorporated) | 1,770 | 4.3% |
| Not-for-profit Organizations | 2,657 | 6.4% |
| Local Government Employees | 5,112 | 12.3% |
| State Government Employees | 1,411 | 3.4% |
| Federal Government Employees | 940 | 2.3% |
| Unpaid Family Workers | 65 | 0.2% |
| Total | 41,402 | 100.0% |
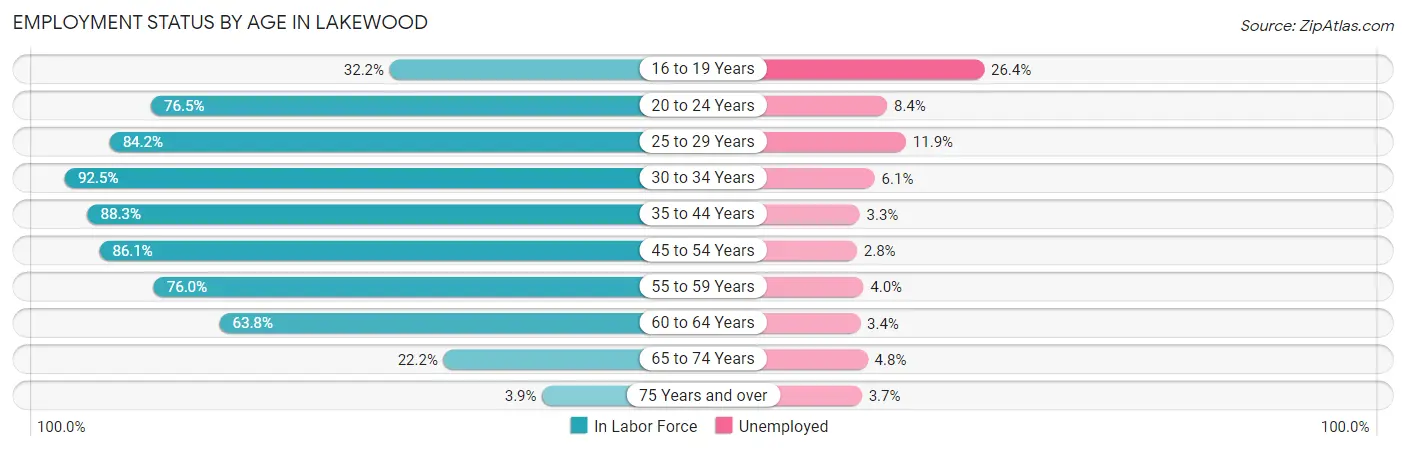
Employment Status by Age in Lakewood
According to the labor force statistics for Lakewood, out of the total population over 16 years of age (66,422), 68.2% or 45,300 individuals are in the labor force, with 5.7% or 2,582 of them unemployed. The age group with the highest labor force participation rate is 30 to 34 years, with 92.5% or 5,926 individuals in the labor force. Within the labor force, the 16 to 19 years age range has the highest percentage of unemployed individuals, with 26.4% or 298 of them being unemployed.
| Age Bracket | In Labor Force | Unemployed |
| 16 to 19 Years | 1,130 (32.2%) | 298 (26.4%) |
| 20 to 24 Years | 4,143 (76.5%) | 348 (8.4%) |
| 25 to 29 Years | 4,858 (84.2%) | 578 (11.9%) |
| 30 to 34 Years | 5,926 (92.5%) | 361 (6.1%) |
| 35 to 44 Years | 10,626 (88.3%) | 351 (3.3%) |
| 45 to 54 Years | 8,914 (86.1%) | 250 (2.8%) |
| 55 to 59 Years | 4,533 (76.0%) | 181 (4.0%) |
| 60 to 64 Years | 3,489 (63.8%) | 119 (3.4%) |
| 65 to 74 Years | 1,459 (22.2%) | 70 (4.8%) |
| 75 Years and over | 192 (3.9%) | 7 (3.7%) |
| Total | 45,300 (68.2%) | 2,582 (5.7%) |
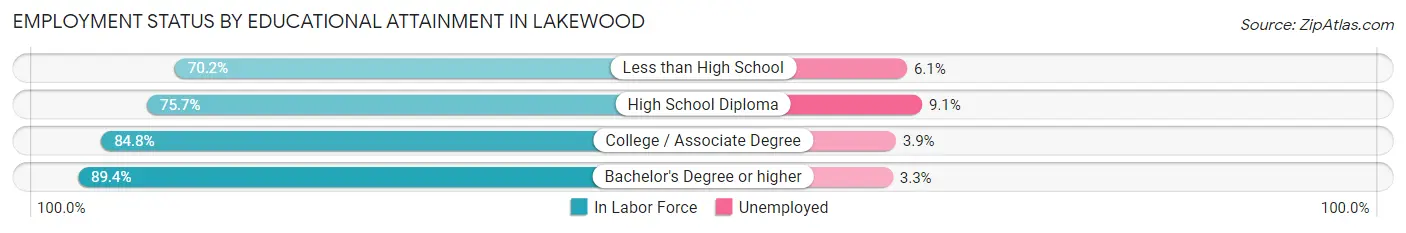
Employment Status by Educational Attainment in Lakewood
According to labor force statistics for Lakewood, 83.4% of individuals (38,362) out of the total population between 25 and 64 years of age (45,998) are in the labor force, with 4.8% or 1,841 of them being unemployed. The group with the highest labor force participation rate are those with the educational attainment of bachelor's degree or higher, with 89.4% or 14,623 individuals in the labor force. Within the labor force, individuals with high school diploma education have the highest percentage of unemployment, with 9.1% or 648 of them being unemployed.
| Educational Attainment | In Labor Force | Unemployed |
| Less than High School | 2,610 (70.2%) | 227 (6.1%) |
| High School Diploma | 7,124 (75.7%) | 856 (9.1%) |
| College / Associate Degree | 14,002 (84.8%) | 644 (3.9%) |
| Bachelor's Degree or higher | 14,623 (89.4%) | 540 (3.3%) |
| Total | 38,362 (83.4%) | 2,208 (4.8%) |
Employment Occupations by Sex in Lakewood
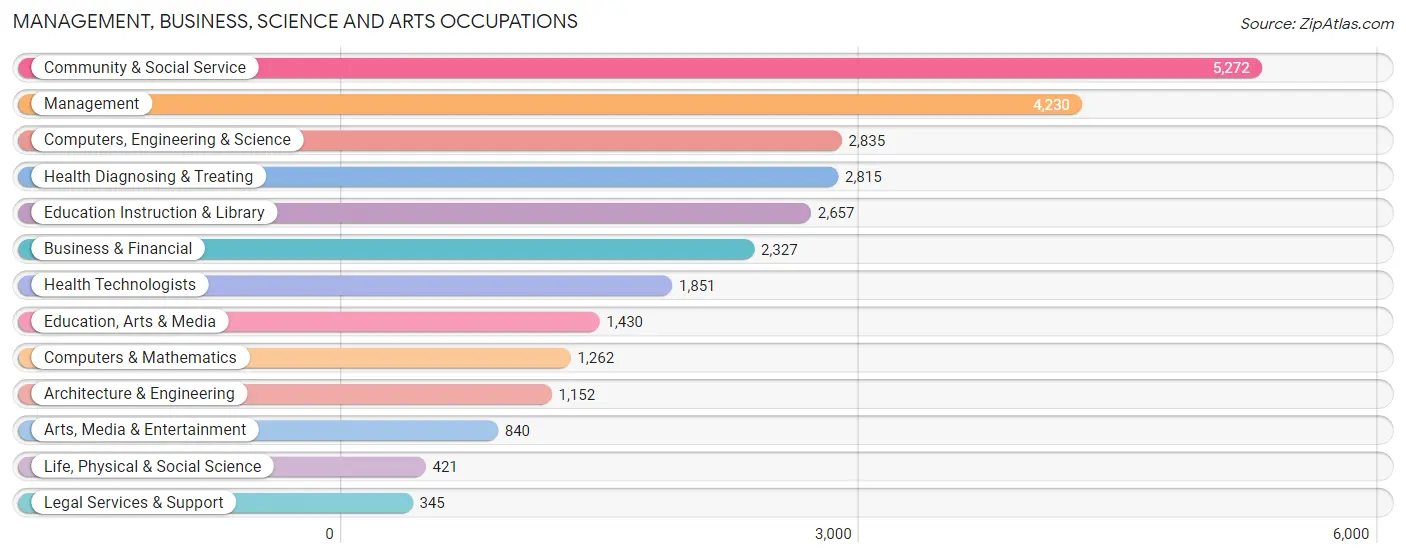
Management, Business, Science and Arts Occupations
The most common Management, Business, Science and Arts occupations in Lakewood are Community & Social Service (5,272 | 12.4%), Management (4,230 | 9.9%), Computers, Engineering & Science (2,835 | 6.7%), Health Diagnosing & Treating (2,815 | 6.6%), and Education Instruction & Library (2,657 | 6.2%).
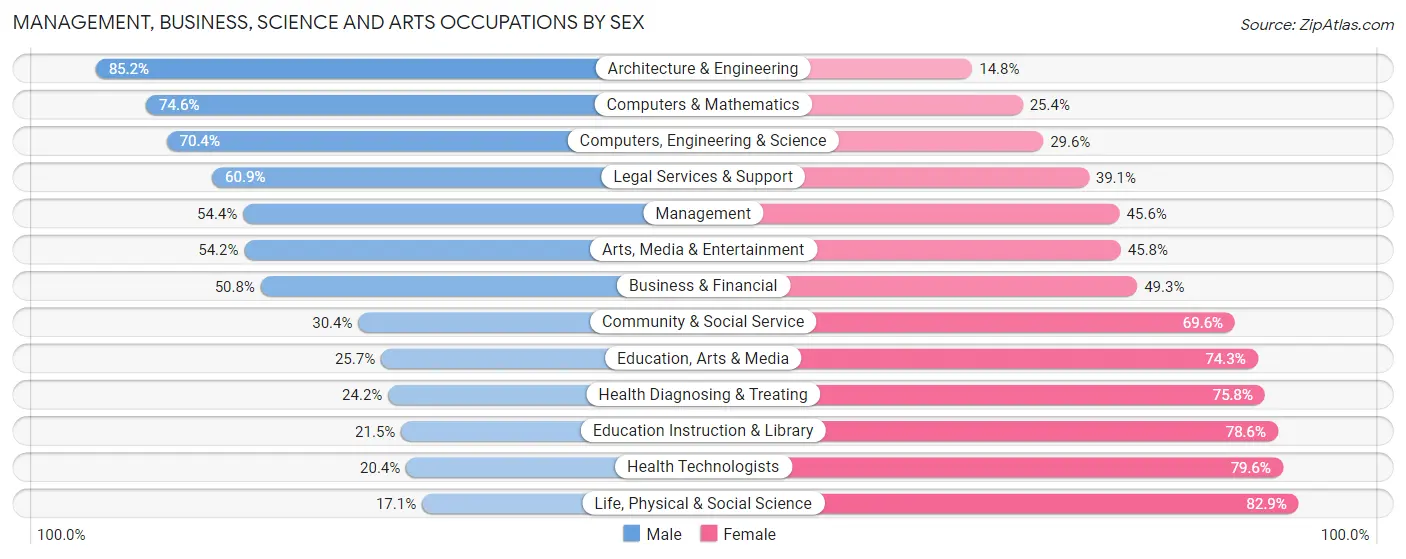
Management, Business, Science and Arts Occupations by Sex
Within the Management, Business, Science and Arts occupations in Lakewood, the most male-oriented occupations are Architecture & Engineering (85.2%), Computers & Mathematics (74.6%), and Computers, Engineering & Science (70.4%), while the most female-oriented occupations are Life, Physical & Social Science (82.9%), Health Technologists (79.6%), and Education Instruction & Library (78.5%).
| Occupation | Male | Female |
| Management | 2,302 (54.4%) | 1,928 (45.6%) |
| Business & Financial | 1,181 (50.7%) | 1,146 (49.2%) |
| Computers, Engineering & Science | 1,995 (70.4%) | 840 (29.6%) |
| Computers & Mathematics | 942 (74.6%) | 320 (25.4%) |
| Architecture & Engineering | 981 (85.2%) | 171 (14.8%) |
| Life, Physical & Social Science | 72 (17.1%) | 349 (82.9%) |
| Community & Social Service | 1,602 (30.4%) | 3,670 (69.6%) |
| Education, Arts & Media | 367 (25.7%) | 1,063 (74.3%) |
| Legal Services & Support | 210 (60.9%) | 135 (39.1%) |
| Education Instruction & Library | 570 (21.4%) | 2,087 (78.5%) |
| Arts, Media & Entertainment | 455 (54.2%) | 385 (45.8%) |
| Health Diagnosing & Treating | 680 (24.2%) | 2,135 (75.8%) |
| Health Technologists | 378 (20.4%) | 1,473 (79.6%) |
| Total (Category) | 7,760 (44.4%) | 9,719 (55.6%) |
| Total (Overall) | 21,897 (51.3%) | 20,743 (48.6%) |
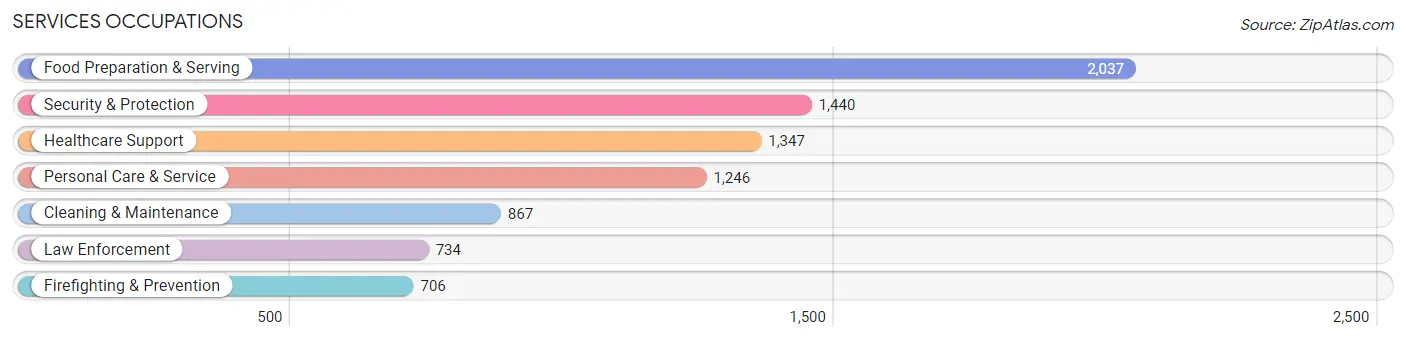
Services Occupations
The most common Services occupations in Lakewood are Food Preparation & Serving (2,037 | 4.8%), Security & Protection (1,440 | 3.4%), Healthcare Support (1,347 | 3.2%), Personal Care & Service (1,246 | 2.9%), and Cleaning & Maintenance (867 | 2.0%).
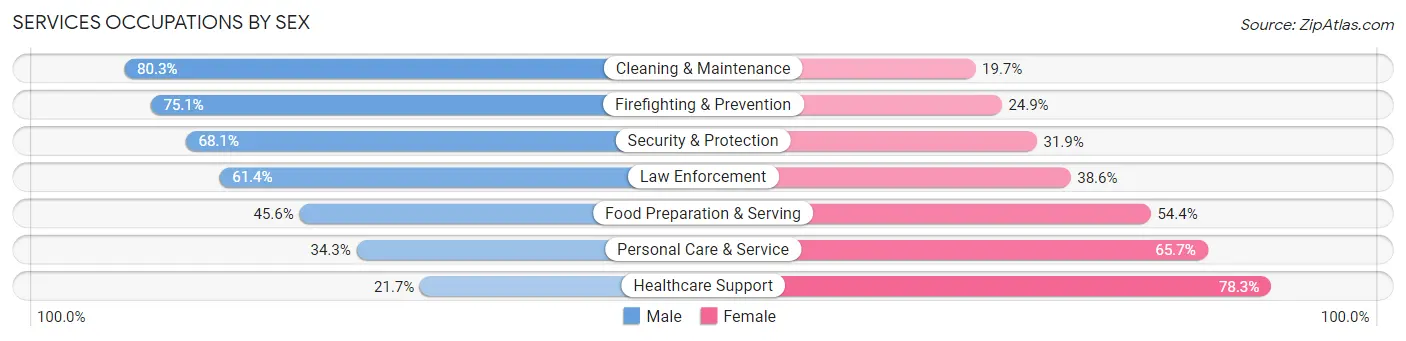
Services Occupations by Sex
Within the Services occupations in Lakewood, the most male-oriented occupations are Cleaning & Maintenance (80.3%), Firefighting & Prevention (75.1%), and Security & Protection (68.1%), while the most female-oriented occupations are Healthcare Support (78.3%), Personal Care & Service (65.7%), and Food Preparation & Serving (54.4%).
| Occupation | Male | Female |
| Healthcare Support | 292 (21.7%) | 1,055 (78.3%) |
| Security & Protection | 981 (68.1%) | 459 (31.9%) |
| Firefighting & Prevention | 530 (75.1%) | 176 (24.9%) |
| Law Enforcement | 451 (61.4%) | 283 (38.6%) |
| Food Preparation & Serving | 928 (45.6%) | 1,109 (54.4%) |
| Cleaning & Maintenance | 696 (80.3%) | 171 (19.7%) |
| Personal Care & Service | 427 (34.3%) | 819 (65.7%) |
| Total (Category) | 3,324 (47.9%) | 3,613 (52.1%) |
| Total (Overall) | 21,897 (51.3%) | 20,743 (48.6%) |
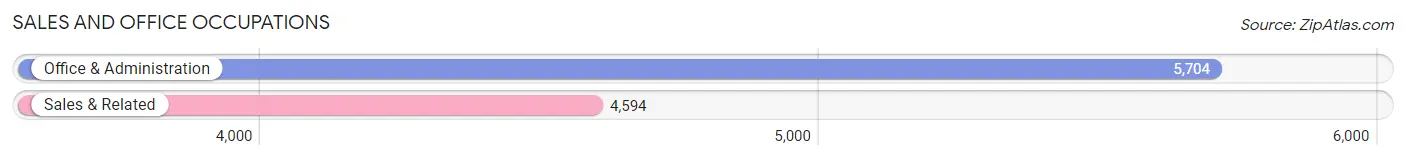
Sales and Office Occupations
The most common Sales and Office occupations in Lakewood are Office & Administration (5,704 | 13.4%), and Sales & Related (4,594 | 10.8%).
Sales and Office Occupations by Sex
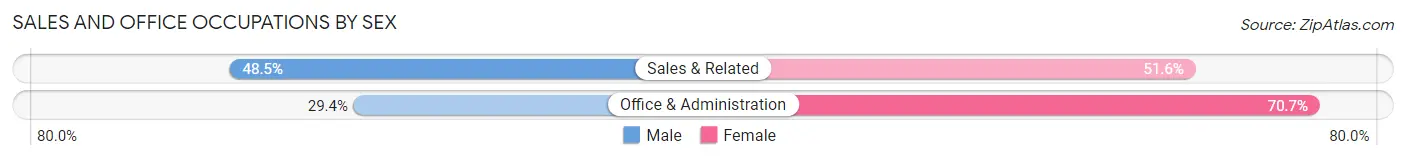
| Occupation | Male | Female |
| Sales & Related | 2,226 (48.4%) | 2,368 (51.5%) |
| Office & Administration | 1,674 (29.3%) | 4,030 (70.7%) |
| Total (Category) | 3,900 (37.9%) | 6,398 (62.1%) |
| Total (Overall) | 21,897 (51.3%) | 20,743 (48.6%) |
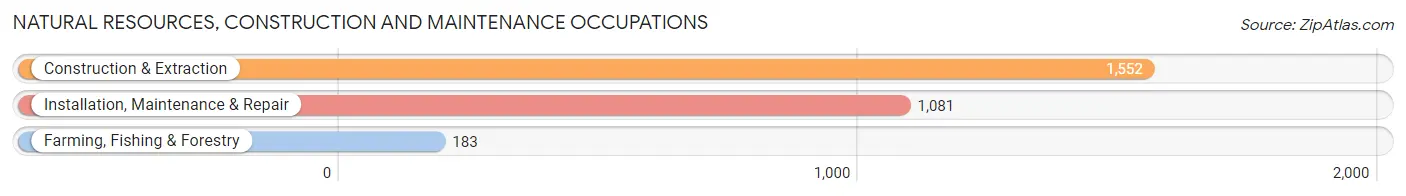
Natural Resources, Construction and Maintenance Occupations
The most common Natural Resources, Construction and Maintenance occupations in Lakewood are Construction & Extraction (1,552 | 3.6%), Installation, Maintenance & Repair (1,081 | 2.5%), and Farming, Fishing & Forestry (183 | 0.4%).
Natural Resources, Construction and Maintenance Occupations by Sex
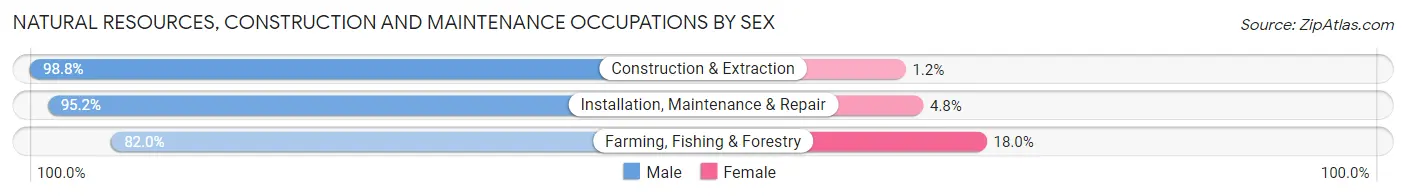
| Occupation | Male | Female |
| Farming, Fishing & Forestry | 150 (82.0%) | 33 (18.0%) |
| Construction & Extraction | 1,534 (98.8%) | 18 (1.2%) |
| Installation, Maintenance & Repair | 1,029 (95.2%) | 52 (4.8%) |
| Total (Category) | 2,713 (96.3%) | 103 (3.7%) |
| Total (Overall) | 21,897 (51.3%) | 20,743 (48.6%) |
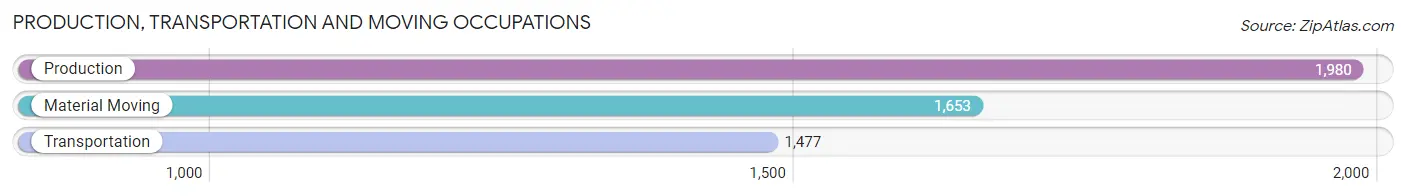
Production, Transportation and Moving Occupations
The most common Production, Transportation and Moving occupations in Lakewood are Production (1,980 | 4.6%), Material Moving (1,653 | 3.9%), and Transportation (1,477 | 3.5%).
Production, Transportation and Moving Occupations by Sex
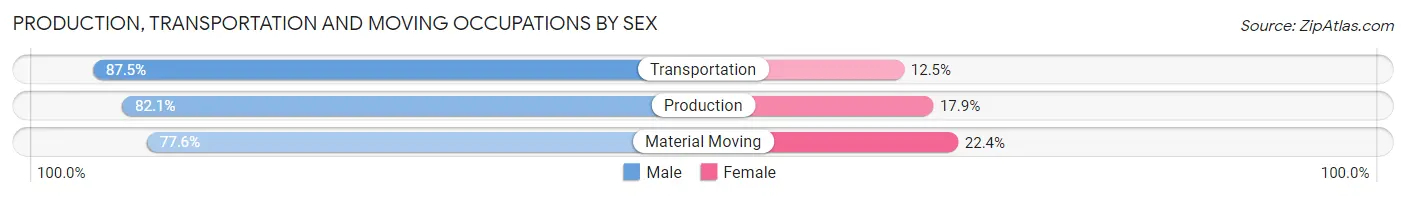
| Occupation | Male | Female |
| Production | 1,626 (82.1%) | 354 (17.9%) |
| Transportation | 1,292 (87.5%) | 185 (12.5%) |
| Material Moving | 1,282 (77.6%) | 371 (22.4%) |
| Total (Category) | 4,200 (82.2%) | 910 (17.8%) |
| Total (Overall) | 21,897 (51.3%) | 20,743 (48.6%) |
Employment Industries by Sex in Lakewood
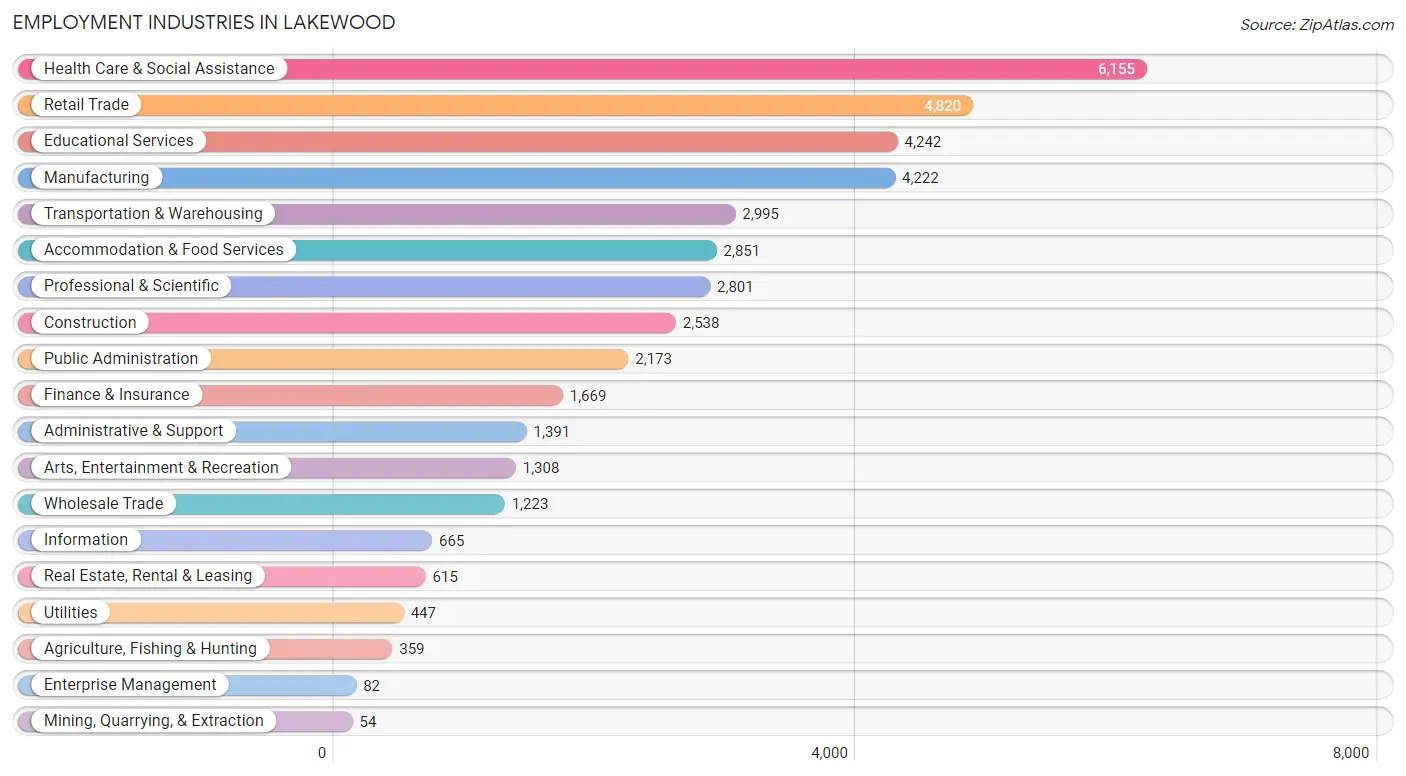
Employment Industries in Lakewood
The major employment industries in Lakewood include Health Care & Social Assistance (6,155 | 14.4%), Retail Trade (4,820 | 11.3%), Educational Services (4,242 | 10.0%), Manufacturing (4,222 | 9.9%), and Transportation & Warehousing (2,995 | 7.0%).
Employment Industries by Sex in Lakewood
The Lakewood industries that see more men than women are Mining, Quarrying, & Extraction (100.0%), Utilities (91.3%), and Construction (83.1%), whereas the industries that tend to have a higher number of women are Enterprise Management (82.9%), Health Care & Social Assistance (78.3%), and Educational Services (65.9%).
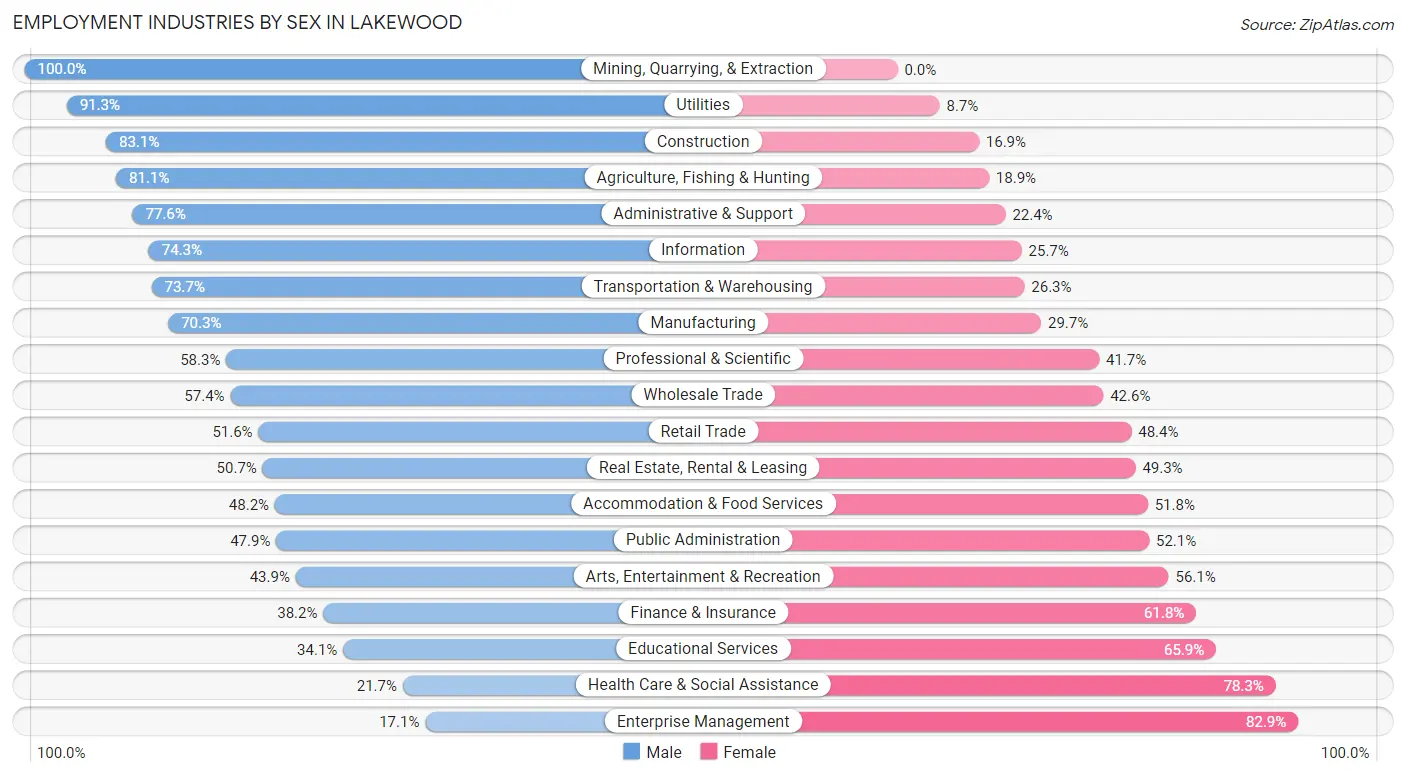
| Industry | Male | Female |
| Agriculture, Fishing & Hunting | 291 (81.1%) | 68 (18.9%) |
| Mining, Quarrying, & Extraction | 54 (100.0%) | 0 (0.0%) |
| Construction | 2,110 (83.1%) | 428 (16.9%) |
| Manufacturing | 2,967 (70.3%) | 1,255 (29.7%) |
| Wholesale Trade | 702 (57.4%) | 521 (42.6%) |
| Retail Trade | 2,487 (51.6%) | 2,333 (48.4%) |
| Transportation & Warehousing | 2,208 (73.7%) | 787 (26.3%) |
| Utilities | 408 (91.3%) | 39 (8.7%) |
| Information | 494 (74.3%) | 171 (25.7%) |
| Finance & Insurance | 637 (38.2%) | 1,032 (61.8%) |
| Real Estate, Rental & Leasing | 312 (50.7%) | 303 (49.3%) |
| Professional & Scientific | 1,632 (58.3%) | 1,169 (41.7%) |
| Enterprise Management | 14 (17.1%) | 68 (82.9%) |
| Administrative & Support | 1,080 (77.6%) | 311 (22.4%) |
| Educational Services | 1,445 (34.1%) | 2,797 (65.9%) |
| Health Care & Social Assistance | 1,336 (21.7%) | 4,819 (78.3%) |
| Arts, Entertainment & Recreation | 574 (43.9%) | 734 (56.1%) |
| Accommodation & Food Services | 1,374 (48.2%) | 1,477 (51.8%) |
| Public Administration | 1,041 (47.9%) | 1,132 (52.1%) |
| Total | 21,897 (51.3%) | 20,743 (48.6%) |
Education in Lakewood
School Enrollment in Lakewood
The most common levels of schooling among the 19,568 students in Lakewood are college / undergraduate (5,468 | 27.9%), high school (3,600 | 18.4%), and middle school (3,599 | 18.4%).
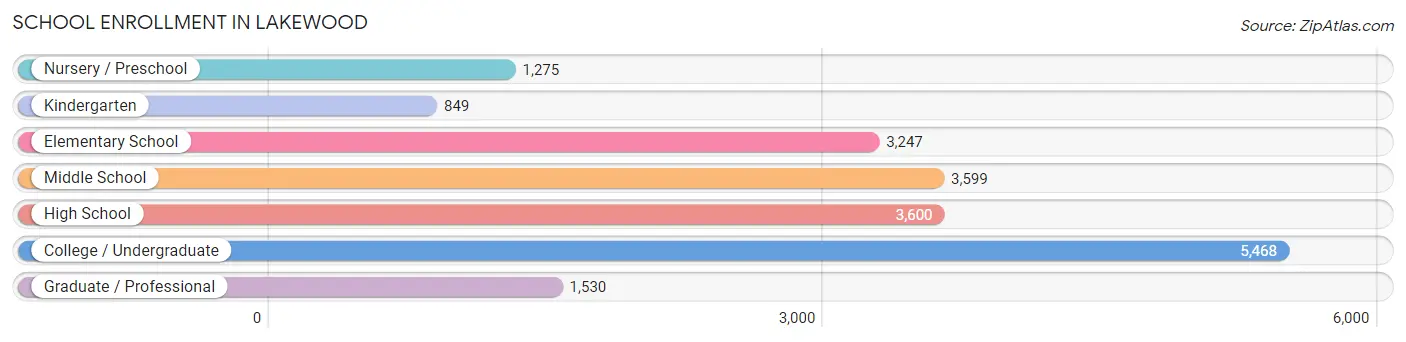
| School Level | # Students | % Students |
| Nursery / Preschool | 1,275 | 6.5% |
| Kindergarten | 849 | 4.3% |
| Elementary School | 3,247 | 16.6% |
| Middle School | 3,599 | 18.4% |
| High School | 3,600 | 18.4% |
| College / Undergraduate | 5,468 | 27.9% |
| Graduate / Professional | 1,530 | 7.8% |
| Total | 19,568 | 100.0% |
School Enrollment by Age by Funding Source in Lakewood
Out of a total of 19,568 students who are enrolled in schools in Lakewood, 3,894 (19.9%) attend a private institution, while the remaining 15,674 (80.1%) are enrolled in public schools. The age group of 3 to 4 year olds has the highest likelihood of being enrolled in private schools, with 599 (71.1% in the age bracket) enrolled. Conversely, the age group of 18 to 19 year olds has the lowest likelihood of being enrolled in a private school, with 1,475 (93.4% in the age bracket) attending a public institution.
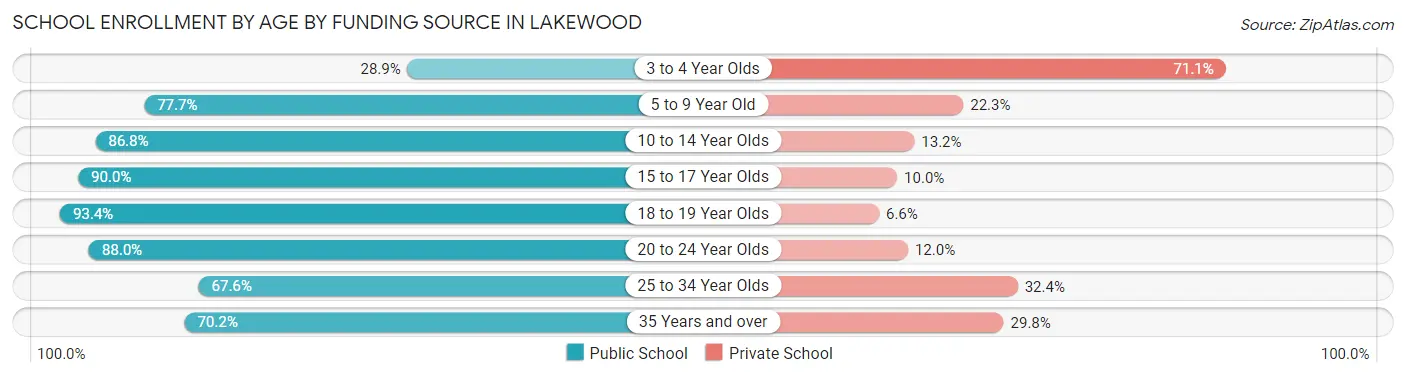
| Age Bracket | Public School | Private School |
| 3 to 4 Year Olds | 243 (28.9%) | 599 (71.1%) |
| 5 to 9 Year Old | 3,219 (77.7%) | 923 (22.3%) |
| 10 to 14 Year Olds | 3,975 (86.8%) | 603 (13.2%) |
| 15 to 17 Year Olds | 2,206 (90.0%) | 244 (10.0%) |
| 18 to 19 Year Olds | 1,475 (93.4%) | 104 (6.6%) |
| 20 to 24 Year Olds | 2,036 (88.0%) | 277 (12.0%) |
| 25 to 34 Year Olds | 1,478 (67.6%) | 709 (32.4%) |
| 35 Years and over | 1,037 (70.2%) | 440 (29.8%) |
| Total | 15,674 (80.1%) | 3,894 (19.9%) |
Educational Attainment by Field of Study in Lakewood
Business (4,007 | 20.1%), science & technology (2,296 | 11.5%), liberal arts & history (1,685 | 8.5%), engineering (1,604 | 8.1%), and social sciences (1,592 | 8.0%) are the most common fields of study among 19,932 individuals in Lakewood who have obtained a bachelor's degree or higher.
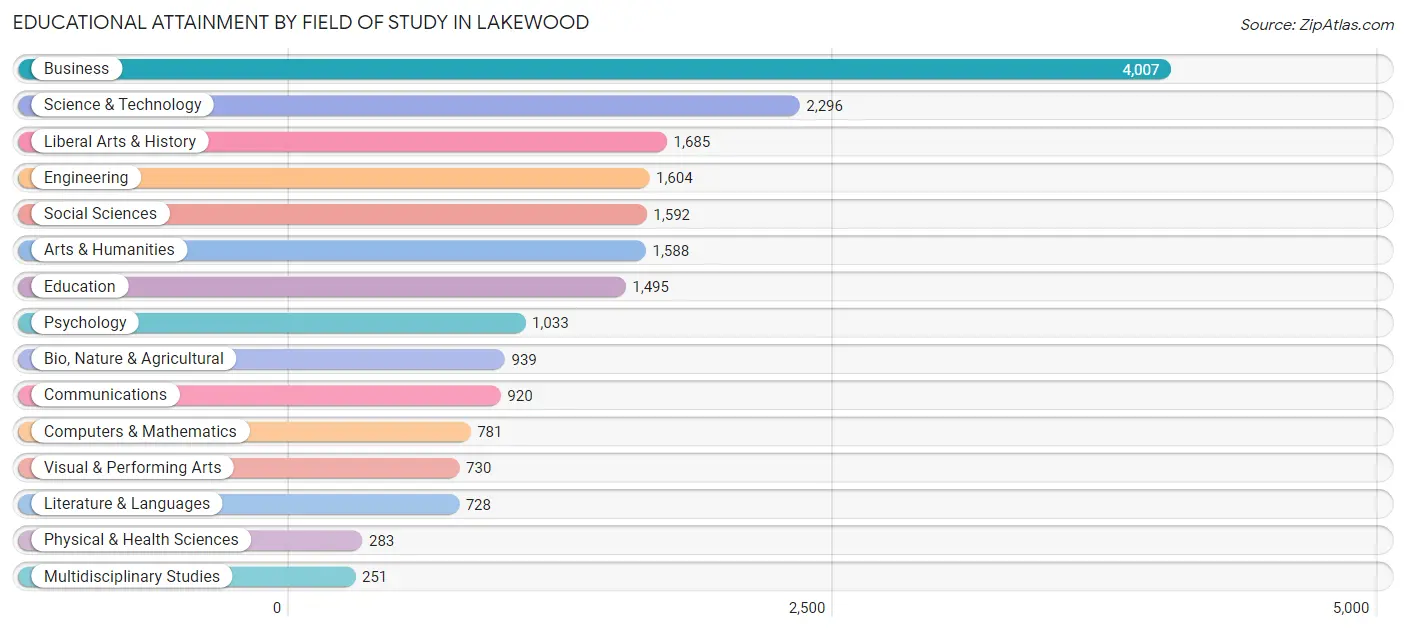
| Field of Study | # Graduates | % Graduates |
| Computers & Mathematics | 781 | 3.9% |
| Bio, Nature & Agricultural | 939 | 4.7% |
| Physical & Health Sciences | 283 | 1.4% |
| Psychology | 1,033 | 5.2% |
| Social Sciences | 1,592 | 8.0% |
| Engineering | 1,604 | 8.1% |
| Multidisciplinary Studies | 251 | 1.3% |
| Science & Technology | 2,296 | 11.5% |
| Business | 4,007 | 20.1% |
| Education | 1,495 | 7.5% |
| Literature & Languages | 728 | 3.6% |
| Liberal Arts & History | 1,685 | 8.5% |
| Visual & Performing Arts | 730 | 3.7% |
| Communications | 920 | 4.6% |
| Arts & Humanities | 1,588 | 8.0% |
| Total | 19,932 | 100.0% |
Transportation & Commute in Lakewood
Vehicle Availability by Sex in Lakewood
The most prevalent vehicle ownership categories in Lakewood are males with 2 vehicles (7,522, accounting for 35.3%) and females with 2 vehicles (6,974, making up 37.5%).
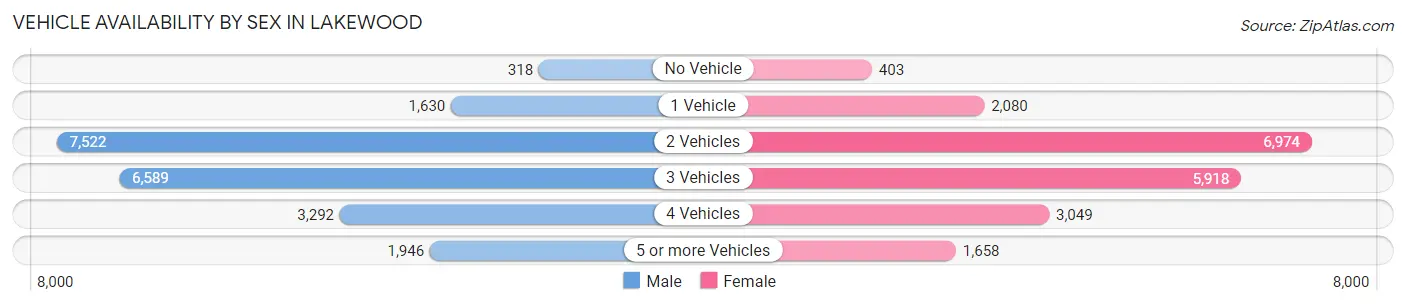
| Vehicles Available | Male | Female |
| No Vehicle | 318 (1.5%) | 403 (2.0%) |
| 1 Vehicle | 1,630 (7.6%) | 2,080 (10.4%) |
| 2 Vehicles | 7,522 (35.3%) | 6,974 (34.7%) |
| 3 Vehicles | 6,589 (30.9%) | 5,918 (29.5%) |
| 4 Vehicles | 3,292 (15.5%) | 3,049 (15.2%) |
| 5 or more Vehicles | 1,946 (9.1%) | 1,658 (8.3%) |
| Total | 21,297 (100.0%) | 20,082 (100.0%) |
Commute Time in Lakewood
The most frequently occuring commute durations in Lakewood are 30 to 34 minutes (6,688 commuters, 17.9%), 20 to 24 minutes (5,921 commuters, 15.8%), and 15 to 19 minutes (5,153 commuters, 13.8%).
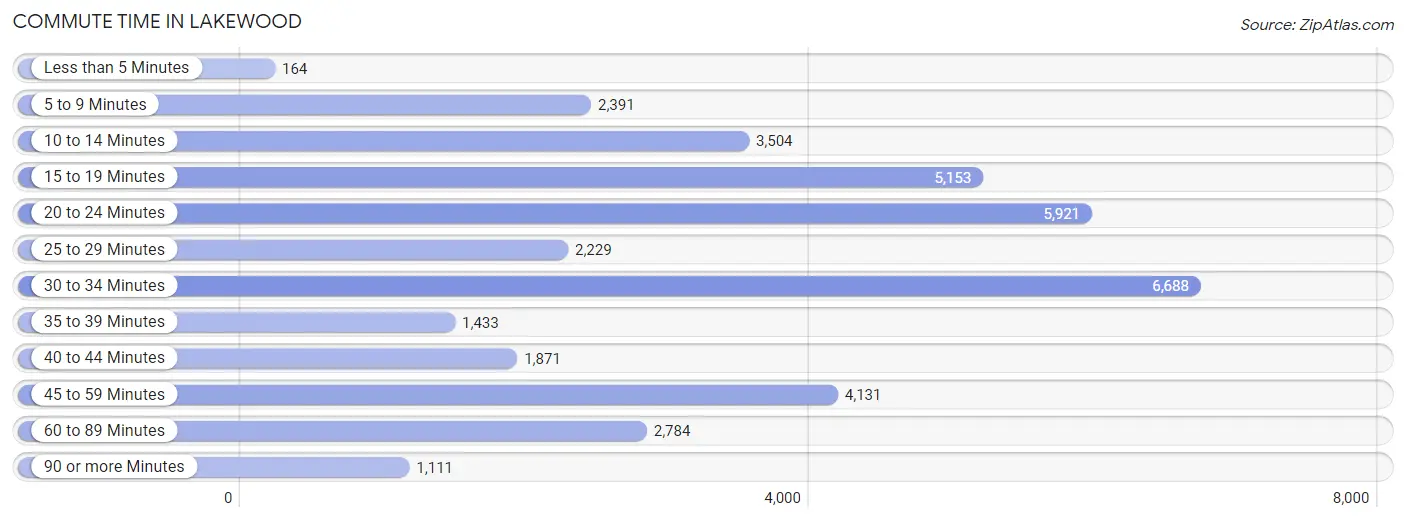
| Commute Time | # Commuters | % Commuters |
| Less than 5 Minutes | 164 | 0.4% |
| 5 to 9 Minutes | 2,391 | 6.4% |
| 10 to 14 Minutes | 3,504 | 9.4% |
| 15 to 19 Minutes | 5,153 | 13.8% |
| 20 to 24 Minutes | 5,921 | 15.8% |
| 25 to 29 Minutes | 2,229 | 6.0% |
| 30 to 34 Minutes | 6,688 | 17.9% |
| 35 to 39 Minutes | 1,433 | 3.8% |
| 40 to 44 Minutes | 1,871 | 5.0% |
| 45 to 59 Minutes | 4,131 | 11.1% |
| 60 to 89 Minutes | 2,784 | 7.4% |
| 90 or more Minutes | 1,111 | 3.0% |
Commute Time by Sex in Lakewood
The most common commute times in Lakewood are 30 to 34 minutes (3,862 commuters, 19.7%) for males and 20 to 24 minutes (2,968 commuters, 16.7%) for females.
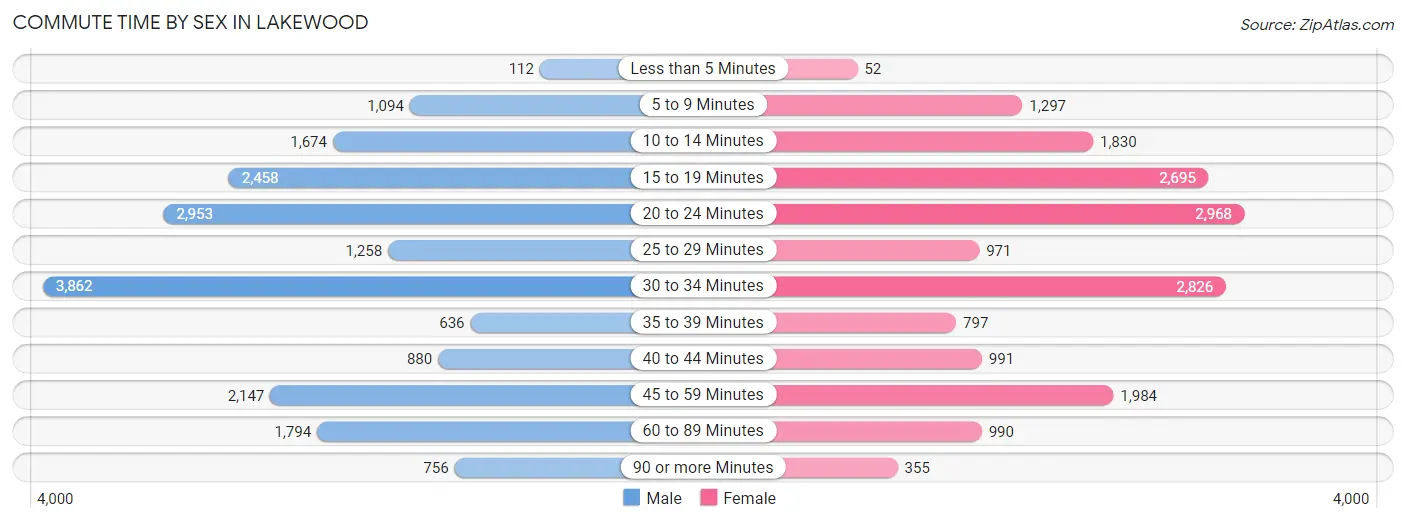
| Commute Time | Male | Female |
| Less than 5 Minutes | 112 (0.6%) | 52 (0.3%) |
| 5 to 9 Minutes | 1,094 (5.6%) | 1,297 (7.3%) |
| 10 to 14 Minutes | 1,674 (8.5%) | 1,830 (10.3%) |
| 15 to 19 Minutes | 2,458 (12.5%) | 2,695 (15.2%) |
| 20 to 24 Minutes | 2,953 (15.0%) | 2,968 (16.7%) |
| 25 to 29 Minutes | 1,258 (6.4%) | 971 (5.5%) |
| 30 to 34 Minutes | 3,862 (19.7%) | 2,826 (15.9%) |
| 35 to 39 Minutes | 636 (3.2%) | 797 (4.5%) |
| 40 to 44 Minutes | 880 (4.5%) | 991 (5.6%) |
| 45 to 59 Minutes | 2,147 (10.9%) | 1,984 (11.2%) |
| 60 to 89 Minutes | 1,794 (9.1%) | 990 (5.6%) |
| 90 or more Minutes | 756 (3.8%) | 355 (2.0%) |
Time of Departure to Work by Sex in Lakewood
The most frequent times of departure to work in Lakewood are 7:00 AM to 7:29 AM (2,593, 13.2%) for males and 7:00 AM to 7:29 AM (2,947, 16.6%) for females.
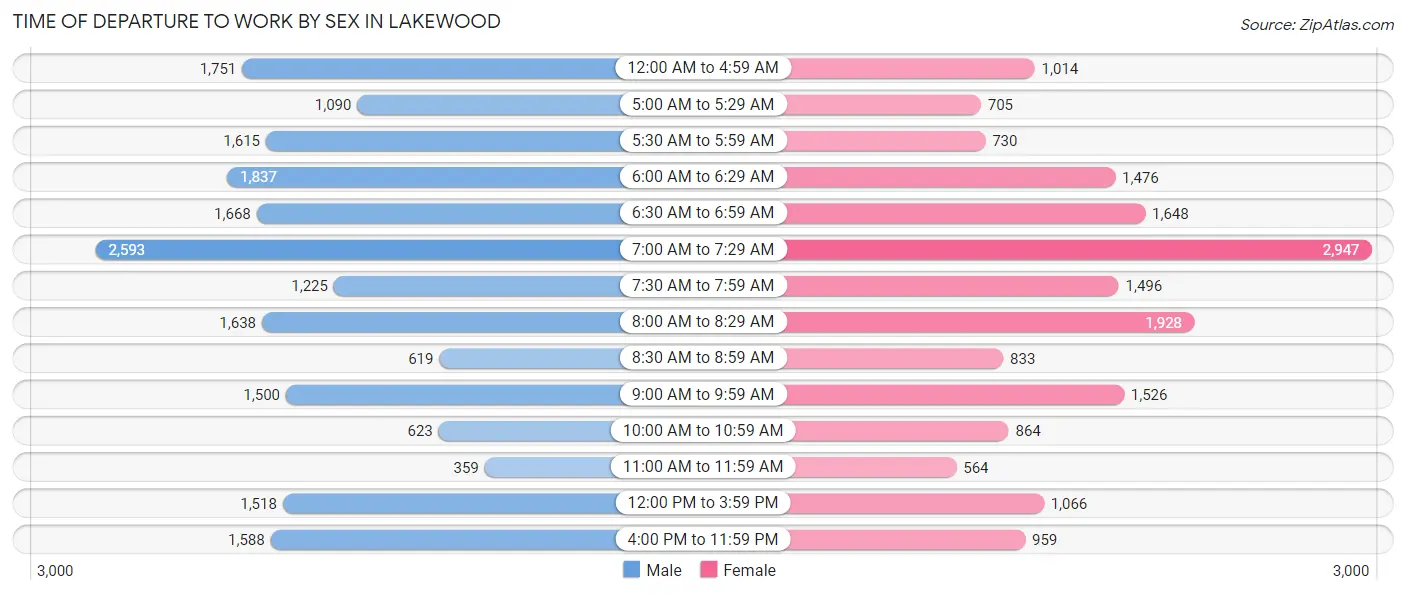
| Time of Departure | Male | Female |
| 12:00 AM to 4:59 AM | 1,751 (8.9%) | 1,014 (5.7%) |
| 5:00 AM to 5:29 AM | 1,090 (5.6%) | 705 (4.0%) |
| 5:30 AM to 5:59 AM | 1,615 (8.2%) | 730 (4.1%) |
| 6:00 AM to 6:29 AM | 1,837 (9.4%) | 1,476 (8.3%) |
| 6:30 AM to 6:59 AM | 1,668 (8.5%) | 1,648 (9.3%) |
| 7:00 AM to 7:29 AM | 2,593 (13.2%) | 2,947 (16.6%) |
| 7:30 AM to 7:59 AM | 1,225 (6.2%) | 1,496 (8.4%) |
| 8:00 AM to 8:29 AM | 1,638 (8.4%) | 1,928 (10.9%) |
| 8:30 AM to 8:59 AM | 619 (3.2%) | 833 (4.7%) |
| 9:00 AM to 9:59 AM | 1,500 (7.6%) | 1,526 (8.6%) |
| 10:00 AM to 10:59 AM | 623 (3.2%) | 864 (4.9%) |
| 11:00 AM to 11:59 AM | 359 (1.8%) | 564 (3.2%) |
| 12:00 PM to 3:59 PM | 1,518 (7.7%) | 1,066 (6.0%) |
| 4:00 PM to 11:59 PM | 1,588 (8.1%) | 959 (5.4%) |
| Total | 19,624 (100.0%) | 17,756 (100.0%) |
Housing Occupancy in Lakewood
Occupancy by Ownership in Lakewood
Of the total 26,388 dwellings in Lakewood, owner-occupied units account for 18,915 (71.7%), while renter-occupied units make up 7,473 (28.3%).
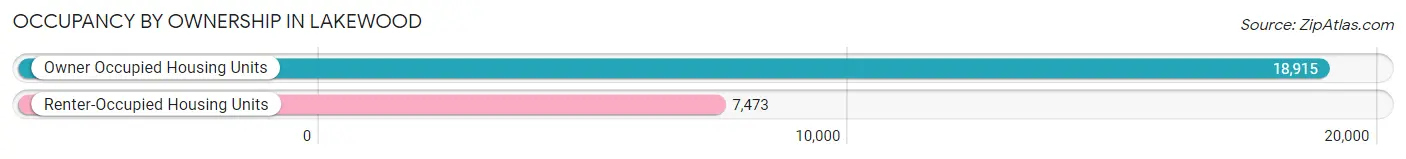
| Occupancy | # Housing Units | % Housing Units |
| Owner Occupied Housing Units | 18,915 | 71.7% |
| Renter-Occupied Housing Units | 7,473 | 28.3% |
| Total Occupied Housing Units | 26,388 | 100.0% |
Occupancy by Household Size in Lakewood
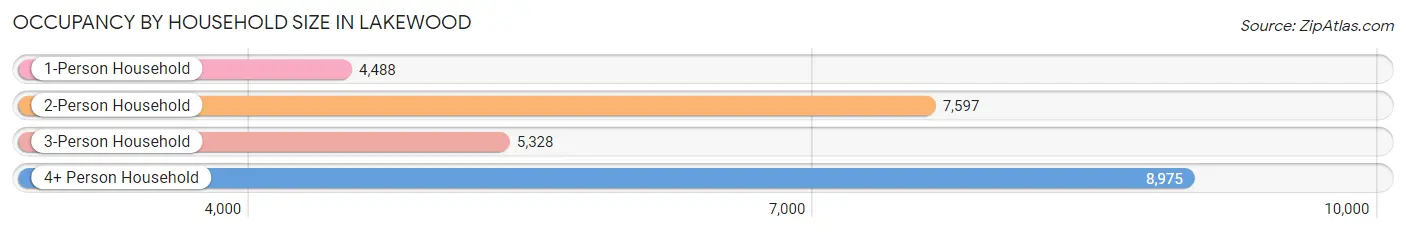
| Household Size | # Housing Units | % Housing Units |
| 1-Person Household | 4,488 | 17.0% |
| 2-Person Household | 7,597 | 28.8% |
| 3-Person Household | 5,328 | 20.2% |
| 4+ Person Household | 8,975 | 34.0% |
| Total Housing Units | 26,388 | 100.0% |
Occupancy by Ownership by Household Size in Lakewood
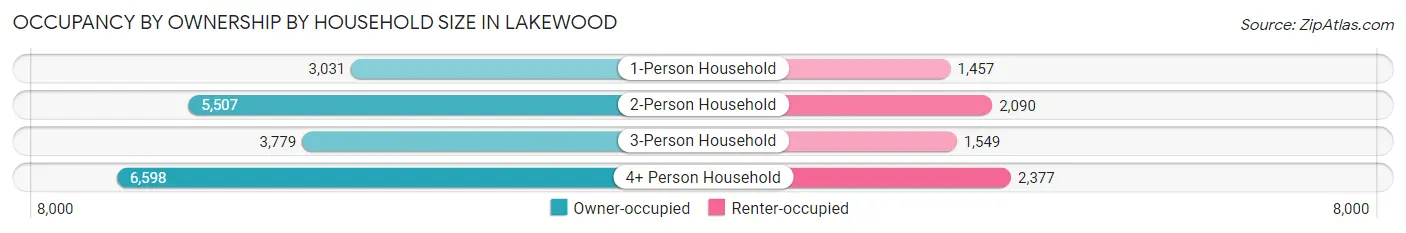
| Household Size | Owner-occupied | Renter-occupied |
| 1-Person Household | 3,031 (67.5%) | 1,457 (32.5%) |
| 2-Person Household | 5,507 (72.5%) | 2,090 (27.5%) |
| 3-Person Household | 3,779 (70.9%) | 1,549 (29.1%) |
| 4+ Person Household | 6,598 (73.5%) | 2,377 (26.5%) |
| Total Housing Units | 18,915 (71.7%) | 7,473 (28.3%) |
Occupancy by Educational Attainment in Lakewood
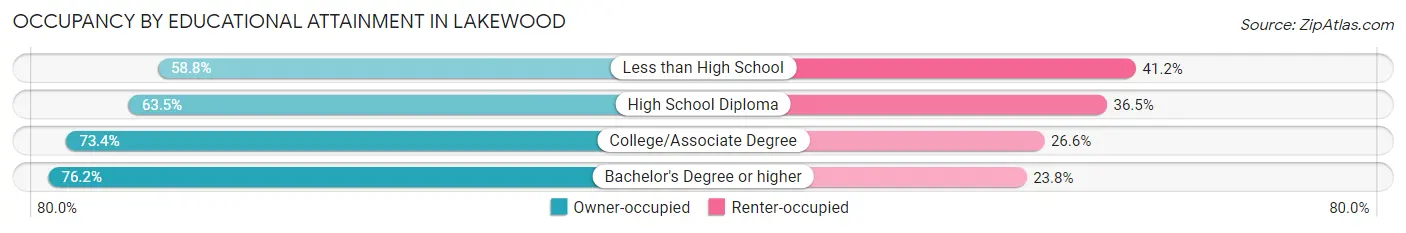
| Household Size | Owner-occupied | Renter-occupied |
| Less than High School | 1,008 (58.8%) | 705 (41.2%) |
| High School Diploma | 3,071 (63.5%) | 1,768 (36.5%) |
| College/Associate Degree | 7,273 (73.4%) | 2,638 (26.6%) |
| Bachelor's Degree or higher | 7,563 (76.2%) | 2,362 (23.8%) |
Occupancy by Age of Householder in Lakewood
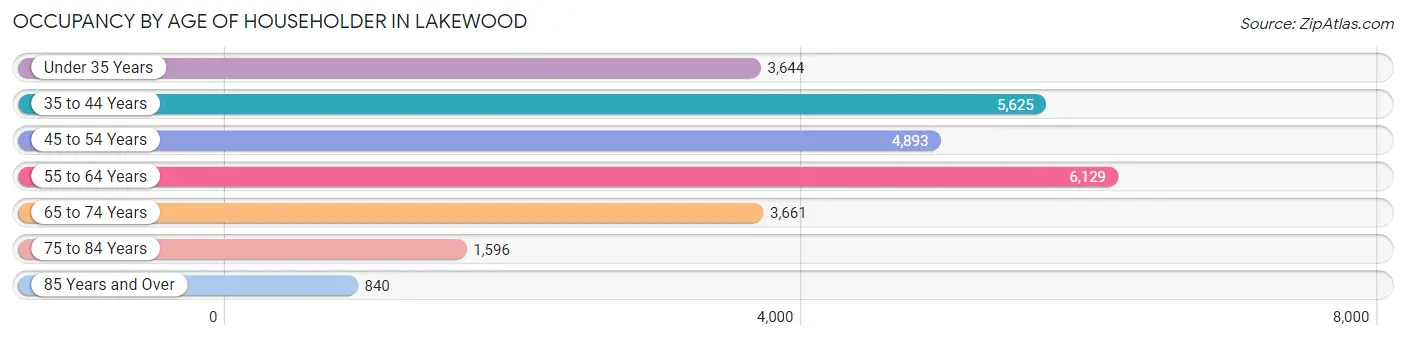
| Age Bracket | # Households | % Households |
| Under 35 Years | 3,644 | 13.8% |
| 35 to 44 Years | 5,625 | 21.3% |
| 45 to 54 Years | 4,893 | 18.5% |
| 55 to 64 Years | 6,129 | 23.2% |
| 65 to 74 Years | 3,661 | 13.9% |
| 75 to 84 Years | 1,596 | 6.0% |
| 85 Years and Over | 840 | 3.2% |
| Total | 26,388 | 100.0% |
Housing Finances in Lakewood
Median Income by Occupancy in Lakewood
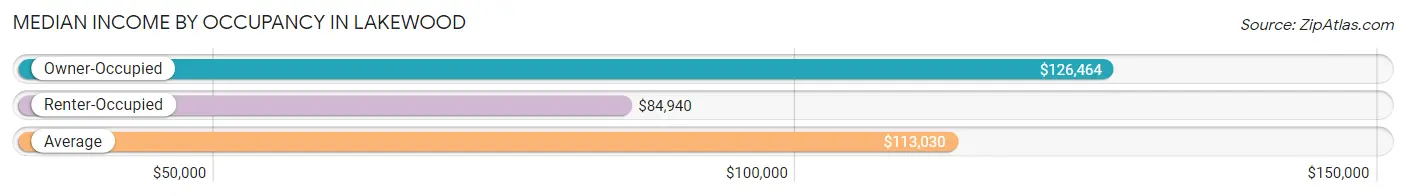
| Occupancy Type | # Households | Median Income |
| Owner-Occupied | 18,915 (71.7%) | $126,464 |
| Renter-Occupied | 7,473 (28.3%) | $84,940 |
| Average | 26,388 (100.0%) | $113,030 |
Occupancy by Householder Income Bracket in Lakewood
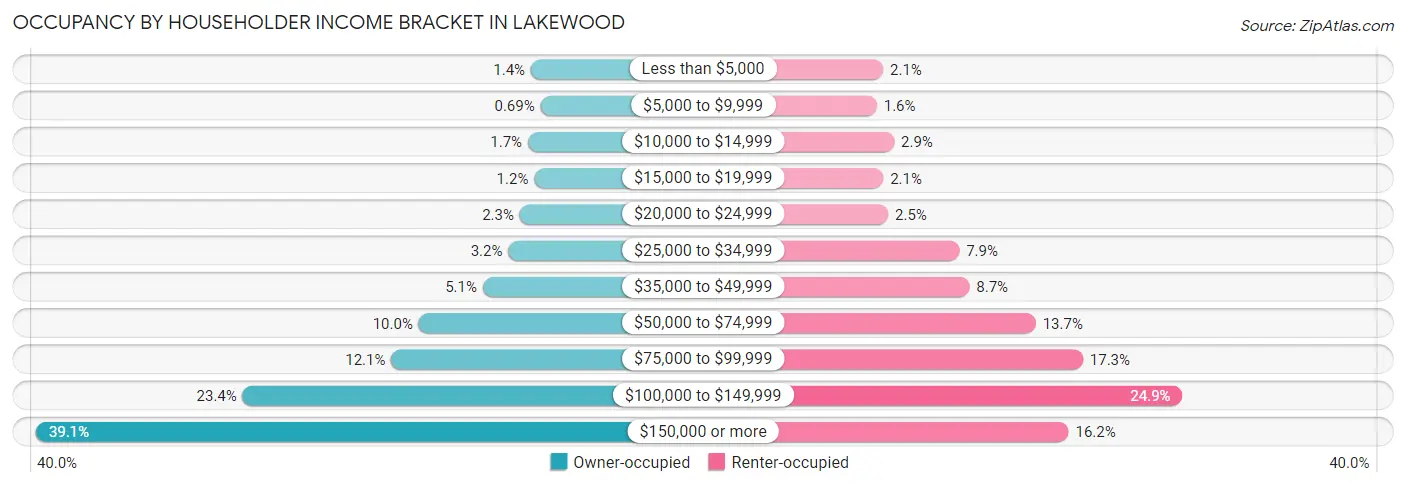
| Income Bracket | Owner-occupied | Renter-occupied |
| Less than $5,000 | 268 (1.4%) | 157 (2.1%) |
| $5,000 to $9,999 | 131 (0.7%) | 121 (1.6%) |
| $10,000 to $14,999 | 312 (1.7%) | 220 (2.9%) |
| $15,000 to $19,999 | 222 (1.2%) | 158 (2.1%) |
| $20,000 to $24,999 | 429 (2.3%) | 185 (2.5%) |
| $25,000 to $34,999 | 595 (3.2%) | 590 (7.9%) |
| $35,000 to $49,999 | 963 (5.1%) | 648 (8.7%) |
| $50,000 to $74,999 | 1,886 (10.0%) | 1,026 (13.7%) |
| $75,000 to $99,999 | 2,281 (12.1%) | 1,294 (17.3%) |
| $100,000 to $149,999 | 4,425 (23.4%) | 1,861 (24.9%) |
| $150,000 or more | 7,403 (39.1%) | 1,213 (16.2%) |
| Total | 18,915 (100.0%) | 7,473 (100.0%) |
Monthly Housing Cost Tiers in Lakewood
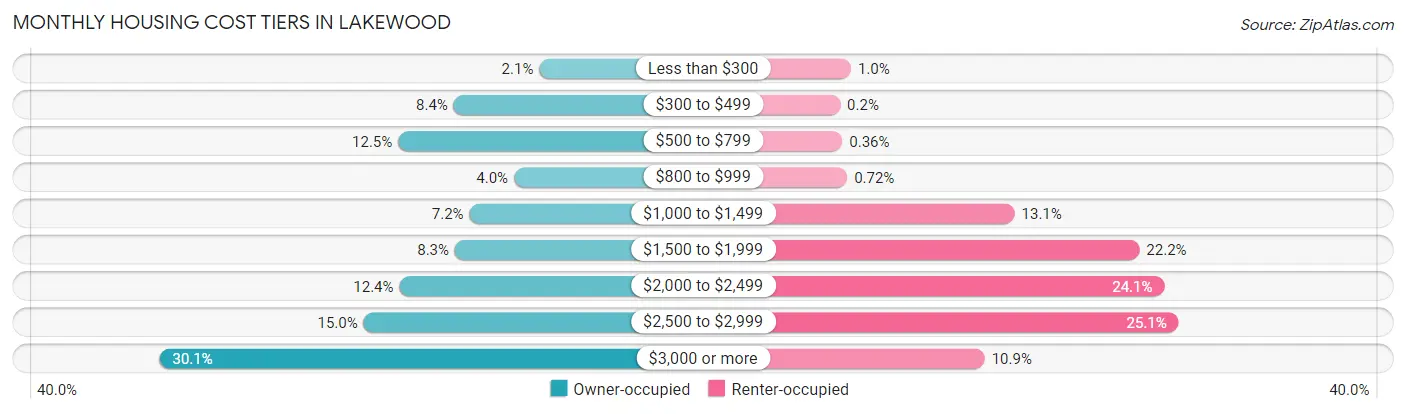
| Monthly Cost | Owner-occupied | Renter-occupied |
| Less than $300 | 397 (2.1%) | 75 (1.0%) |
| $300 to $499 | 1,589 (8.4%) | 15 (0.2%) |
| $500 to $799 | 2,363 (12.5%) | 27 (0.4%) |
| $800 to $999 | 749 (4.0%) | 54 (0.7%) |
| $1,000 to $1,499 | 1,370 (7.2%) | 975 (13.1%) |
| $1,500 to $1,999 | 1,571 (8.3%) | 1,662 (22.2%) |
| $2,000 to $2,499 | 2,345 (12.4%) | 1,799 (24.1%) |
| $2,500 to $2,999 | 2,844 (15.0%) | 1,878 (25.1%) |
| $3,000 or more | 5,687 (30.1%) | 811 (10.8%) |
| Total | 18,915 (100.0%) | 7,473 (100.0%) |
Physical Housing Characteristics in Lakewood
Housing Structures in Lakewood
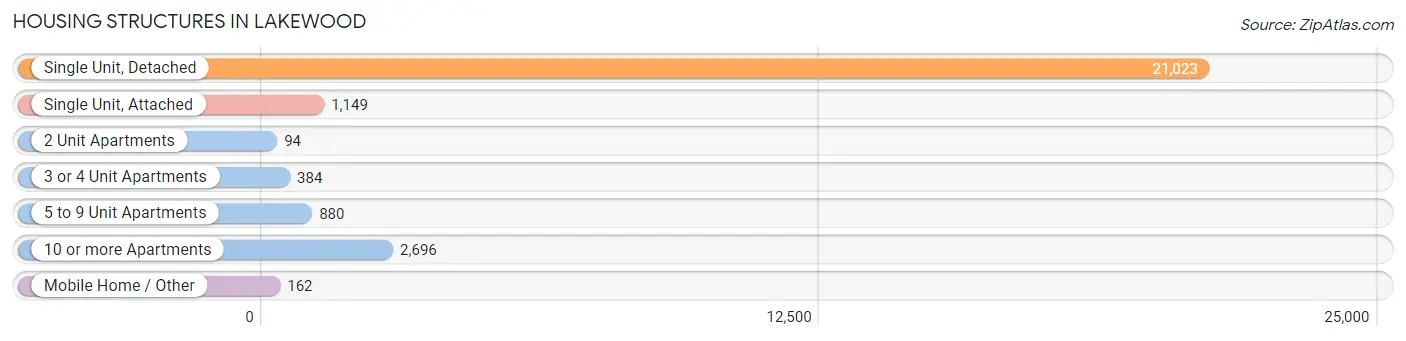
| Structure Type | # Housing Units | % Housing Units |
| Single Unit, Detached | 21,023 | 79.7% |
| Single Unit, Attached | 1,149 | 4.3% |
| 2 Unit Apartments | 94 | 0.4% |
| 3 or 4 Unit Apartments | 384 | 1.5% |
| 5 to 9 Unit Apartments | 880 | 3.3% |
| 10 or more Apartments | 2,696 | 10.2% |
| Mobile Home / Other | 162 | 0.6% |
| Total | 26,388 | 100.0% |
Housing Structures by Occupancy in Lakewood
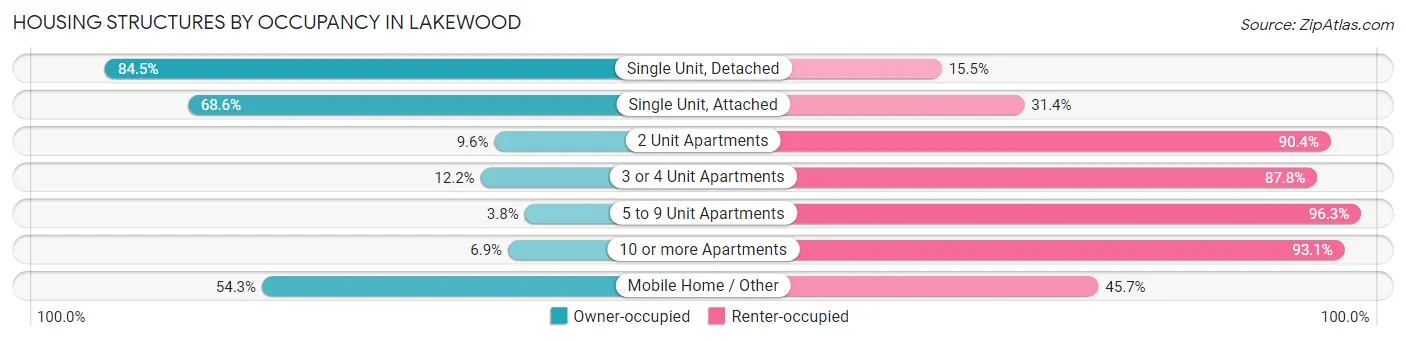
| Structure Type | Owner-occupied | Renter-occupied |
| Single Unit, Detached | 17,763 (84.5%) | 3,260 (15.5%) |
| Single Unit, Attached | 788 (68.6%) | 361 (31.4%) |
| 2 Unit Apartments | 9 (9.6%) | 85 (90.4%) |
| 3 or 4 Unit Apartments | 47 (12.2%) | 337 (87.8%) |
| 5 to 9 Unit Apartments | 33 (3.7%) | 847 (96.3%) |
| 10 or more Apartments | 187 (6.9%) | 2,509 (93.1%) |
| Mobile Home / Other | 88 (54.3%) | 74 (45.7%) |
| Total | 18,915 (71.7%) | 7,473 (28.3%) |
Housing Structures by Number of Rooms in Lakewood
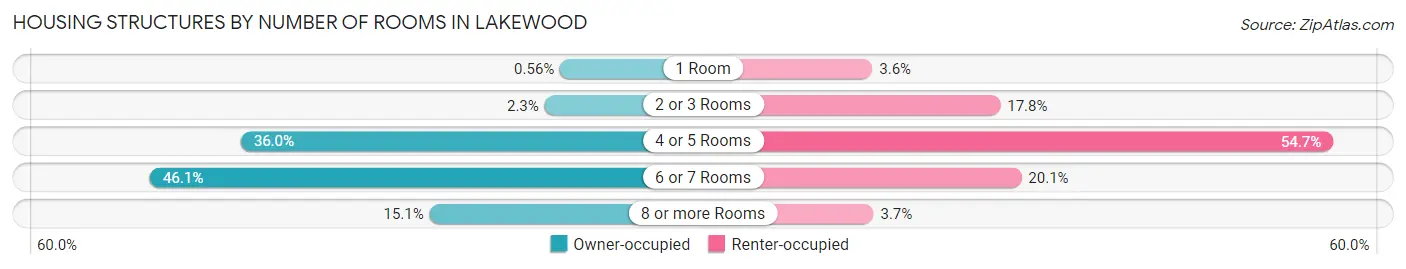
| Number of Rooms | Owner-occupied | Renter-occupied |
| 1 Room | 106 (0.6%) | 269 (3.6%) |
| 2 or 3 Rooms | 434 (2.3%) | 1,330 (17.8%) |
| 4 or 5 Rooms | 6,810 (36.0%) | 4,090 (54.7%) |
| 6 or 7 Rooms | 8,716 (46.1%) | 1,505 (20.1%) |
| 8 or more Rooms | 2,849 (15.1%) | 279 (3.7%) |
| Total | 18,915 (100.0%) | 7,473 (100.0%) |
Housing Structure by Heating Type in Lakewood
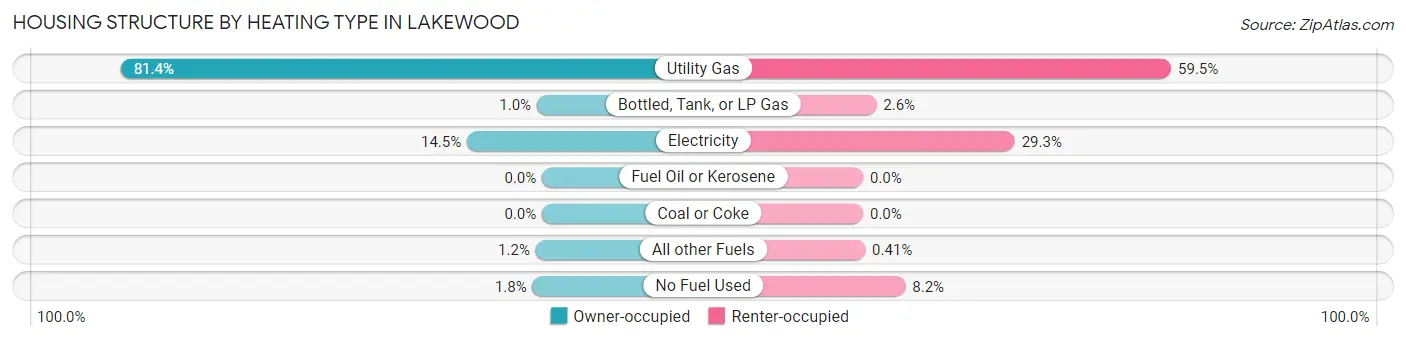
| Heating Type | Owner-occupied | Renter-occupied |
| Utility Gas | 15,401 (81.4%) | 4,449 (59.5%) |
| Bottled, Tank, or LP Gas | 189 (1.0%) | 192 (2.6%) |
| Electricity | 2,745 (14.5%) | 2,190 (29.3%) |
| Fuel Oil or Kerosene | 0 (0.0%) | 0 (0.0%) |
| Coal or Coke | 0 (0.0%) | 0 (0.0%) |
| All other Fuels | 232 (1.2%) | 31 (0.4%) |
| No Fuel Used | 348 (1.8%) | 611 (8.2%) |
| Total | 18,915 (100.0%) | 7,473 (100.0%) |
Household Vehicle Usage in Lakewood
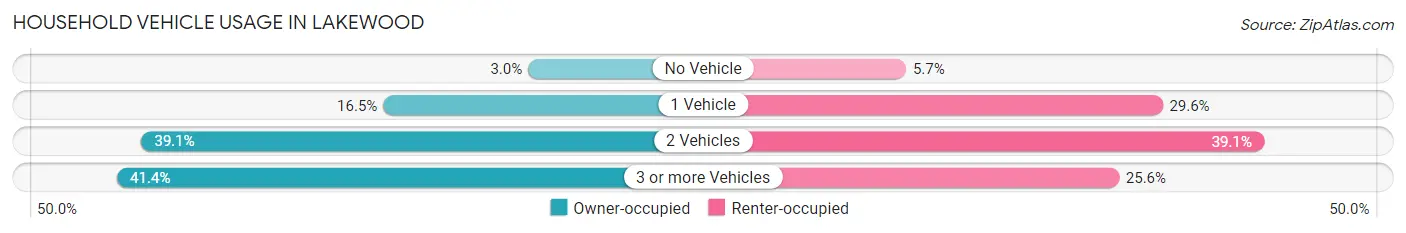
| Vehicles per Household | Owner-occupied | Renter-occupied |
| No Vehicle | 568 (3.0%) | 426 (5.7%) |
| 1 Vehicle | 3,126 (16.5%) | 2,215 (29.6%) |
| 2 Vehicles | 7,395 (39.1%) | 2,921 (39.1%) |
| 3 or more Vehicles | 7,826 (41.4%) | 1,911 (25.6%) |
| Total | 18,915 (100.0%) | 7,473 (100.0%) |
Real Estate & Mortgages in Lakewood
Real Estate and Mortgage Overview in Lakewood
| Characteristic | Without Mortgage | With Mortgage |
| Housing Units | 5,492 | 13,423 |
| Median Property Value | $673,200 | $704,400 |
| Median Household Income | $82,767 | $6,196 |
| Monthly Housing Costs | $597 | $5,659 |
| Real Estate Taxes | $3,743 | $111 |
Property Value by Mortgage Status in Lakewood
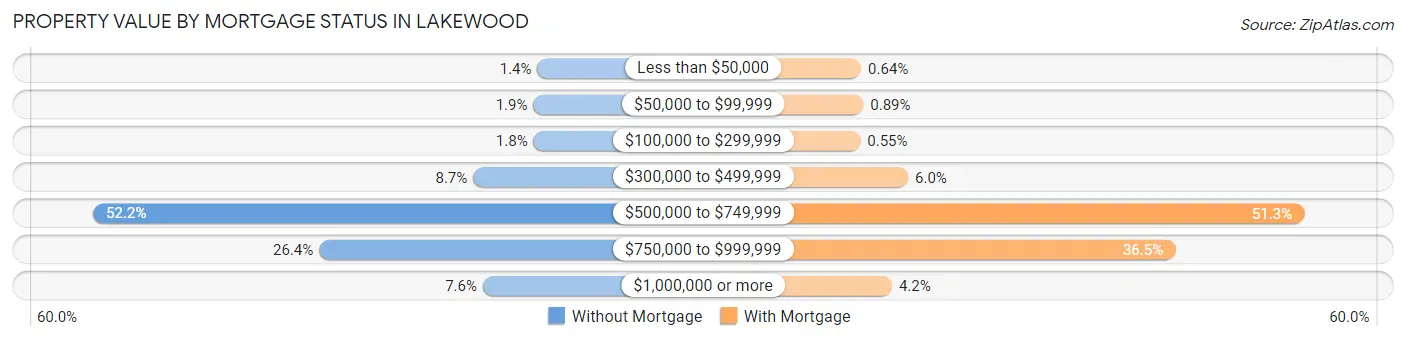
| Property Value | Without Mortgage | With Mortgage |
| Less than $50,000 | 77 (1.4%) | 86 (0.6%) |
| $50,000 to $99,999 | 102 (1.9%) | 119 (0.9%) |
| $100,000 to $299,999 | 101 (1.8%) | 74 (0.5%) |
| $300,000 to $499,999 | 480 (8.7%) | 807 (6.0%) |
| $500,000 to $749,999 | 2,866 (52.2%) | 6,880 (51.3%) |
| $750,000 to $999,999 | 1,447 (26.4%) | 4,899 (36.5%) |
| $1,000,000 or more | 419 (7.6%) | 558 (4.2%) |
| Total | 5,492 (100.0%) | 13,423 (100.0%) |
Household Income by Mortgage Status in Lakewood
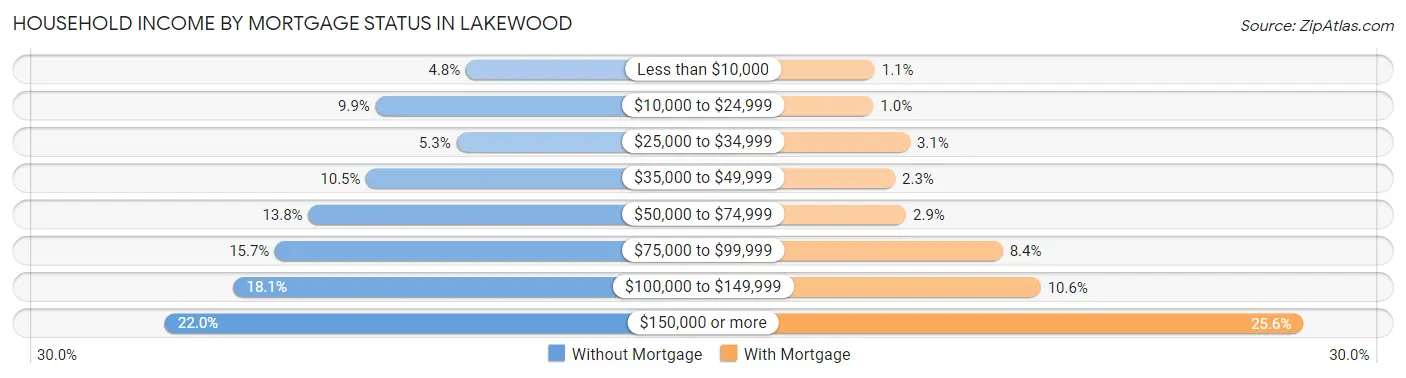
| Household Income | Without Mortgage | With Mortgage |
| Less than $10,000 | 262 (4.8%) | 148 (1.1%) |
| $10,000 to $24,999 | 546 (9.9%) | 137 (1.0%) |
| $25,000 to $34,999 | 292 (5.3%) | 417 (3.1%) |
| $35,000 to $49,999 | 575 (10.5%) | 303 (2.3%) |
| $50,000 to $74,999 | 757 (13.8%) | 388 (2.9%) |
| $75,000 to $99,999 | 861 (15.7%) | 1,129 (8.4%) |
| $100,000 to $149,999 | 992 (18.1%) | 1,420 (10.6%) |
| $150,000 or more | 1,207 (22.0%) | 3,433 (25.6%) |
| Total | 5,492 (100.0%) | 13,423 (100.0%) |
Property Value to Household Income Ratio in Lakewood
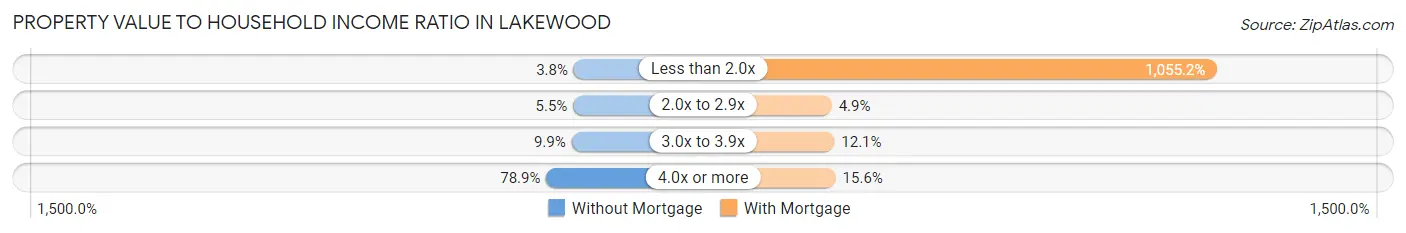
| Value-to-Income Ratio | Without Mortgage | With Mortgage |
| Less than 2.0x | 211 (3.8%) | 141,637 (1,055.2%) |
| 2.0x to 2.9x | 303 (5.5%) | 651 (4.9%) |
| 3.0x to 3.9x | 546 (9.9%) | 1,624 (12.1%) |
| 4.0x or more | 4,333 (78.9%) | 2,093 (15.6%) |
| Total | 5,492 (100.0%) | 13,423 (100.0%) |
Real Estate Taxes by Mortgage Status in Lakewood
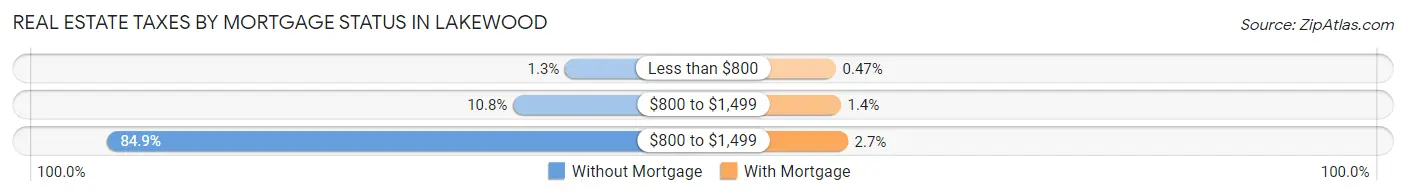
| Property Taxes | Without Mortgage | With Mortgage |
| Less than $800 | 69 (1.3%) | 63 (0.5%) |
| $800 to $1,499 | 591 (10.8%) | 184 (1.4%) |
| $800 to $1,499 | 4,660 (84.9%) | 357 (2.7%) |
| Total | 5,492 (100.0%) | 13,423 (100.0%) |
Health & Disability in Lakewood
Health Insurance Coverage by Age in Lakewood
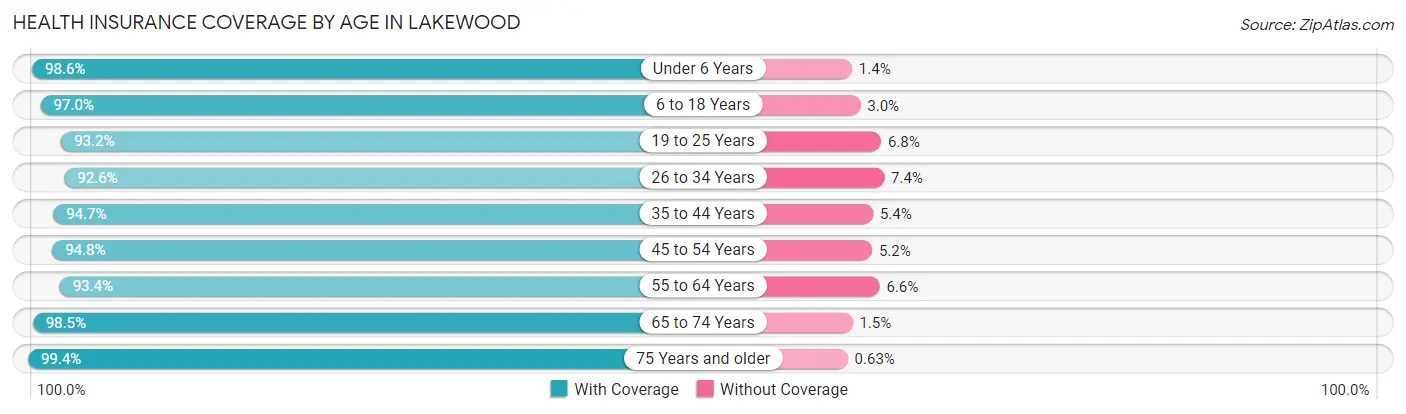
| Age Bracket | With Coverage | Without Coverage |
| Under 6 Years | 6,100 (98.6%) | 88 (1.4%) |
| 6 to 18 Years | 11,236 (97.0%) | 347 (3.0%) |
| 19 to 25 Years | 6,764 (93.2%) | 497 (6.8%) |
| 26 to 34 Years | 10,260 (92.6%) | 823 (7.4%) |
| 35 to 44 Years | 11,390 (94.7%) | 644 (5.3%) |
| 45 to 54 Years | 9,819 (94.8%) | 534 (5.2%) |
| 55 to 64 Years | 10,684 (93.4%) | 750 (6.6%) |
| 65 to 74 Years | 6,471 (98.5%) | 100 (1.5%) |
| 75 Years and older | 4,896 (99.4%) | 31 (0.6%) |
| Total | 77,620 (95.3%) | 3,814 (4.7%) |
Health Insurance Coverage by Citizenship Status in Lakewood
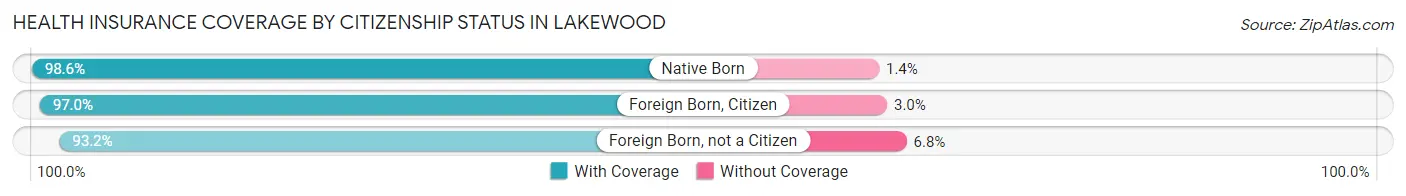
| Citizenship Status | With Coverage | Without Coverage |
| Native Born | 6,100 (98.6%) | 88 (1.4%) |
| Foreign Born, Citizen | 11,236 (97.0%) | 347 (3.0%) |
| Foreign Born, not a Citizen | 6,764 (93.2%) | 497 (6.8%) |
Health Insurance Coverage by Household Income in Lakewood
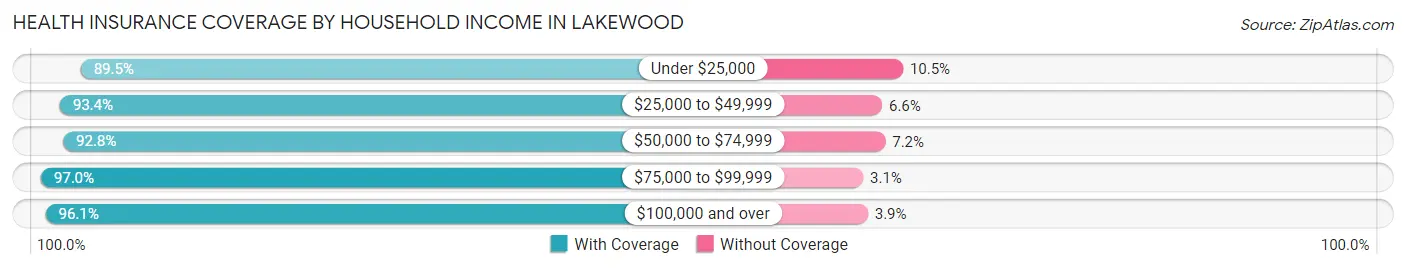
| Household Income | With Coverage | Without Coverage |
| Under $25,000 | 3,665 (89.5%) | 431 (10.5%) |
| $25,000 to $49,999 | 5,645 (93.4%) | 399 (6.6%) |
| $50,000 to $74,999 | 7,595 (92.8%) | 590 (7.2%) |
| $75,000 to $99,999 | 9,955 (97.0%) | 313 (3.0%) |
| $100,000 and over | 50,604 (96.1%) | 2,072 (3.9%) |
Public vs Private Health Insurance Coverage by Age in Lakewood
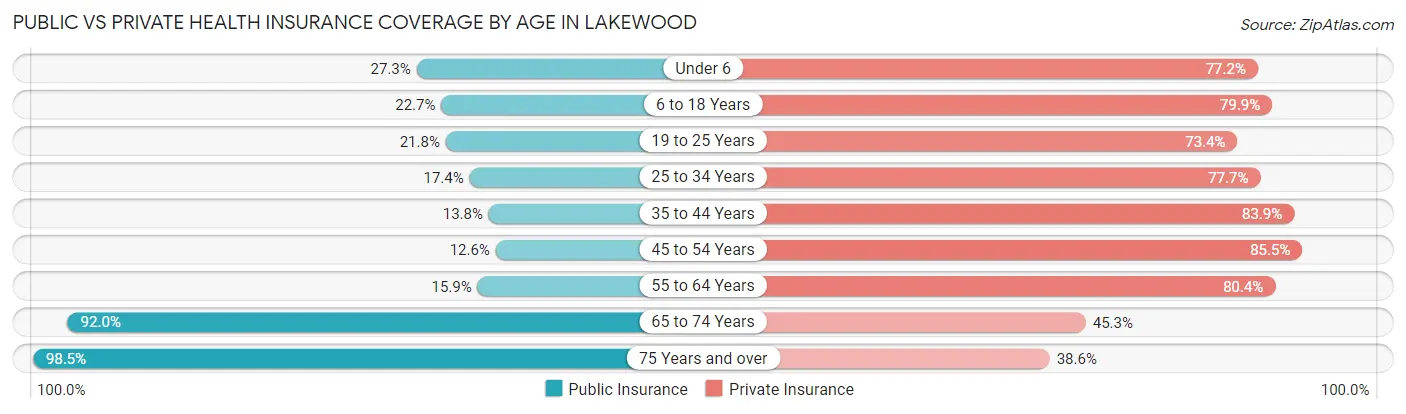
| Age Bracket | Public Insurance | Private Insurance |
| Under 6 | 1,686 (27.3%) | 4,777 (77.2%) |
| 6 to 18 Years | 2,624 (22.7%) | 9,251 (79.9%) |
| 19 to 25 Years | 1,585 (21.8%) | 5,331 (73.4%) |
| 25 to 34 Years | 1,929 (17.4%) | 8,609 (77.7%) |
| 35 to 44 Years | 1,665 (13.8%) | 10,101 (83.9%) |
| 45 to 54 Years | 1,300 (12.6%) | 8,848 (85.5%) |
| 55 to 64 Years | 1,820 (15.9%) | 9,197 (80.4%) |
| 65 to 74 Years | 6,045 (92.0%) | 2,976 (45.3%) |
| 75 Years and over | 4,851 (98.5%) | 1,902 (38.6%) |
| Total | 23,505 (28.9%) | 60,992 (74.9%) |
Disability Status by Sex by Age in Lakewood
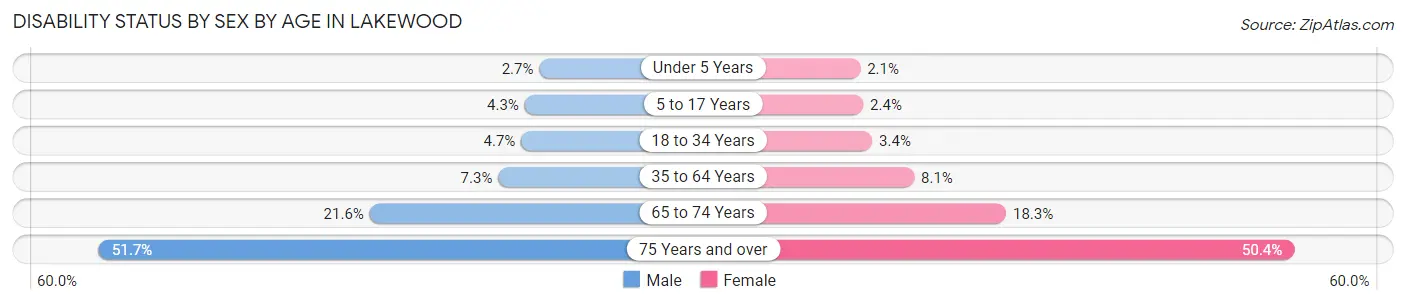
| Age Bracket | Male | Female |
| Under 5 Years | 74 (2.7%) | 46 (2.1%) |
| 5 to 17 Years | 258 (4.3%) | 136 (2.4%) |
| 18 to 34 Years | 458 (4.7%) | 327 (3.4%) |
| 35 to 64 Years | 1,202 (7.2%) | 1,388 (8.1%) |
| 65 to 74 Years | 607 (21.6%) | 687 (18.3%) |
| 75 Years and over | 1,083 (51.7%) | 1,427 (50.4%) |
Disability Class by Sex by Age in Lakewood
Disability Class: Hearing Difficulty
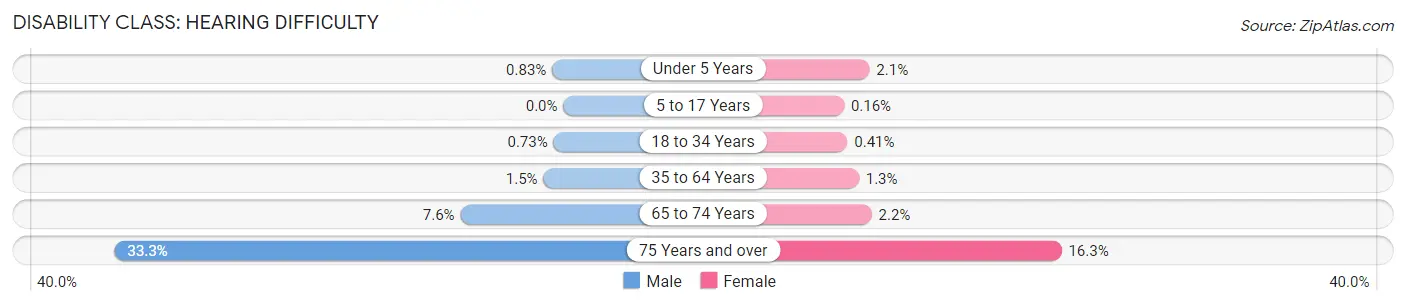
| Age Bracket | Male | Female |
| Under 5 Years | 23 (0.8%) | 46 (2.1%) |
| 5 to 17 Years | 0 (0.0%) | 9 (0.2%) |
| 18 to 34 Years | 71 (0.7%) | 40 (0.4%) |
| 35 to 64 Years | 246 (1.5%) | 217 (1.3%) |
| 65 to 74 Years | 215 (7.6%) | 83 (2.2%) |
| 75 Years and over | 698 (33.3%) | 462 (16.3%) |
Disability Class: Vision Difficulty
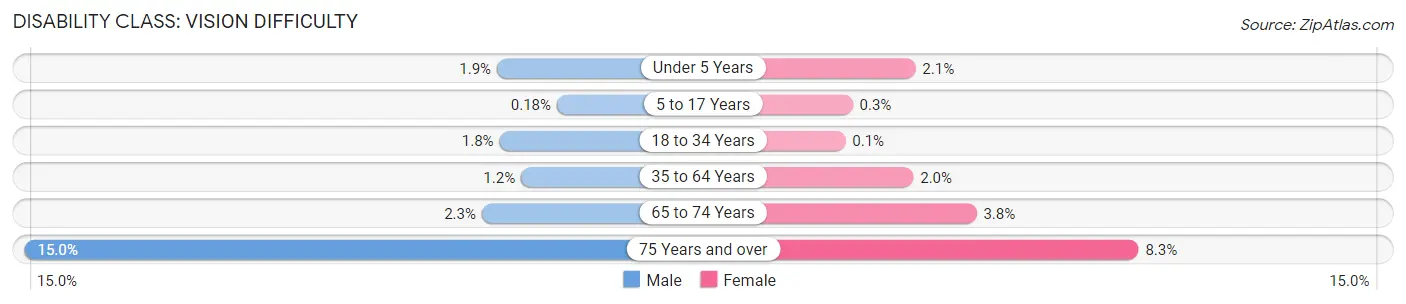
| Age Bracket | Male | Female |
| Under 5 Years | 51 (1.8%) | 46 (2.1%) |
| 5 to 17 Years | 11 (0.2%) | 17 (0.3%) |
| 18 to 34 Years | 173 (1.8%) | 10 (0.1%) |
| 35 to 64 Years | 196 (1.2%) | 344 (2.0%) |
| 65 to 74 Years | 64 (2.3%) | 141 (3.7%) |
| 75 Years and over | 314 (15.0%) | 234 (8.3%) |
Disability Class: Cognitive Difficulty
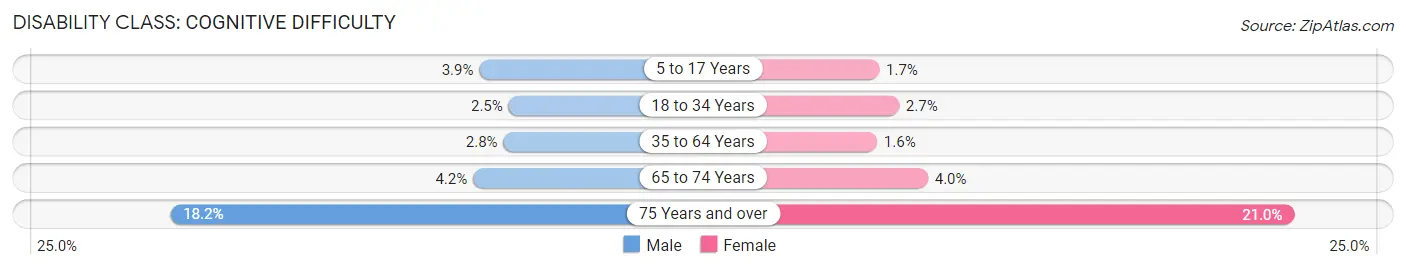
| Age Bracket | Male | Female |
| 5 to 17 Years | 233 (3.9%) | 99 (1.7%) |
| 18 to 34 Years | 247 (2.5%) | 256 (2.6%) |
| 35 to 64 Years | 460 (2.8%) | 282 (1.6%) |
| 65 to 74 Years | 118 (4.2%) | 150 (4.0%) |
| 75 Years and over | 382 (18.2%) | 595 (21.0%) |
Disability Class: Ambulatory Difficulty
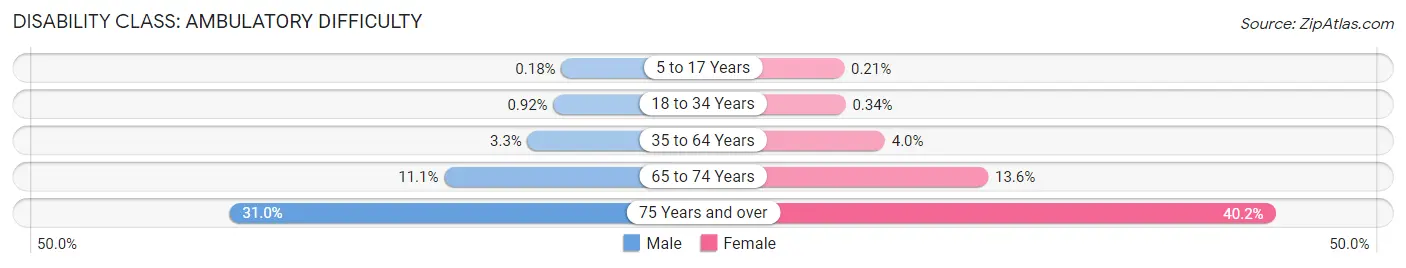
| Age Bracket | Male | Female |
| 5 to 17 Years | 11 (0.2%) | 12 (0.2%) |
| 18 to 34 Years | 90 (0.9%) | 33 (0.3%) |
| 35 to 64 Years | 549 (3.3%) | 689 (4.0%) |
| 65 to 74 Years | 311 (11.1%) | 510 (13.6%) |
| 75 Years and over | 649 (31.0%) | 1,140 (40.2%) |
Disability Class: Self-Care Difficulty
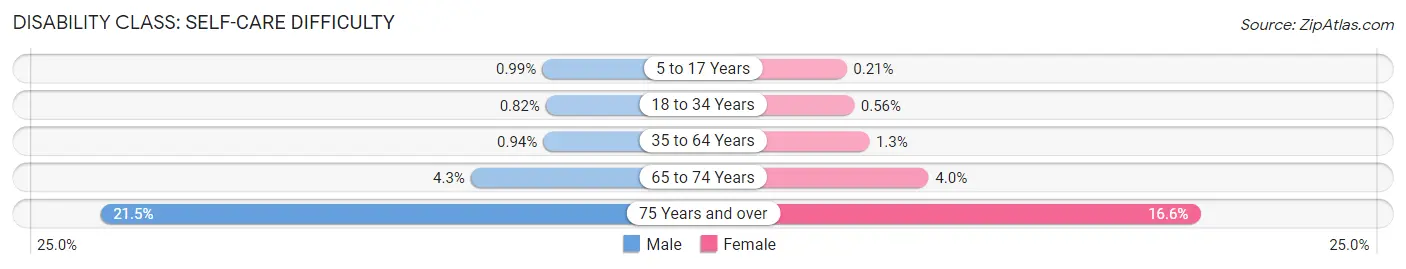
| Age Bracket | Male | Female |
| 5 to 17 Years | 59 (1.0%) | 12 (0.2%) |
| 18 to 34 Years | 80 (0.8%) | 54 (0.6%) |
| 35 to 64 Years | 155 (0.9%) | 217 (1.3%) |
| 65 to 74 Years | 121 (4.3%) | 151 (4.0%) |
| 75 Years and over | 450 (21.5%) | 471 (16.6%) |
Technology Access in Lakewood
Computing Device Access in Lakewood
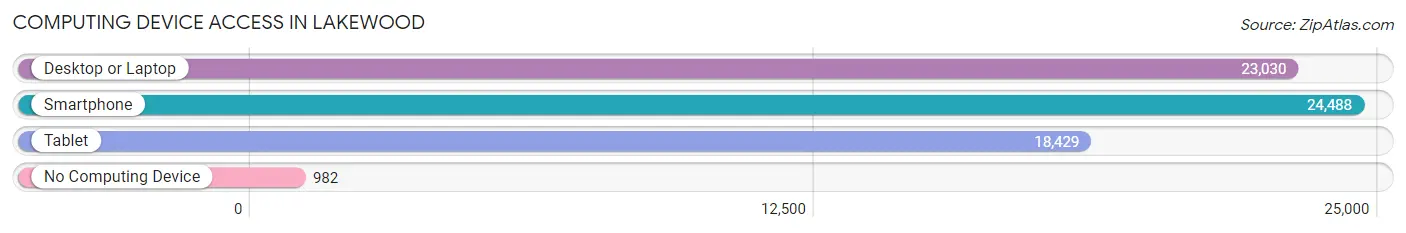
| Device Type | # Households | % Households |
| Desktop or Laptop | 23,030 | 87.3% |
| Smartphone | 24,488 | 92.8% |
| Tablet | 18,429 | 69.8% |
| No Computing Device | 982 | 3.7% |
| Total | 26,388 | 100.0% |
Internet Access in Lakewood
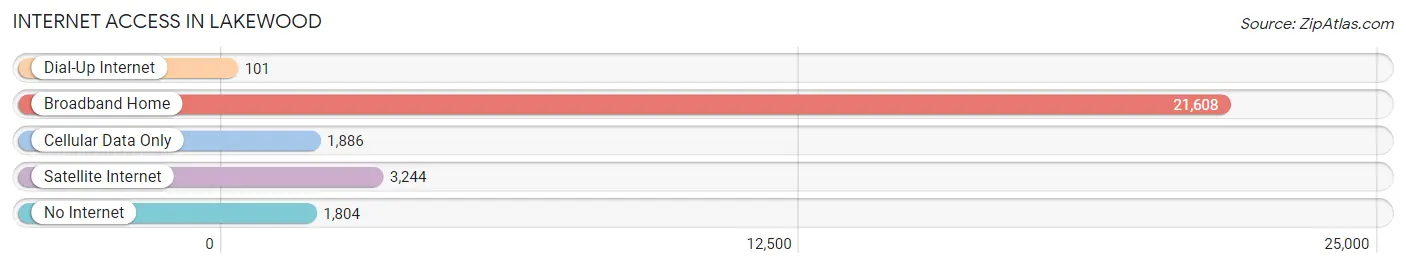
| Internet Type | # Households | % Households |
| Dial-Up Internet | 101 | 0.4% |
| Broadband Home | 21,608 | 81.9% |
| Cellular Data Only | 1,886 | 7.1% |
| Satellite Internet | 3,244 | 12.3% |
| No Internet | 1,804 | 6.8% |
| Total | 26,388 | 100.0% |
Lakewood Summary
Lakewood is a city located in Los Angeles County, California, United States. The city is situated in the southeastern corner of the county, just south of Long Beach and east of Cerritos. As of the 2010 census, the population of Lakewood was 80,048, making it the third largest city in Los Angeles County.
History
The area that is now Lakewood was originally inhabited by the Tongva people, who were later displaced by Spanish settlers in the late 1700s. The area was part of the Rancho Los Alamitos, which was granted to Manuel Nieto in 1795. In the early 1900s, the area was developed as a farming community, and in 1954, the City of Lakewood was incorporated.
Geography
Lakewood is located at 33°49'N 118°7'W (33.817, -118.117). It is situated in the southeastern corner of Los Angeles County, just south of Long Beach and east of Cerritos. The city covers an area of 9.5 square miles, with a population density of 8,400 people per square mile.
The city is bordered by Long Beach to the west, Bellflower to the north, Cerritos to the east, and Hawaiian Gardens to the south. The Los Angeles River runs through the city, and there are several parks and recreational areas, including Lakewood Park, Del Valle Park, and Mayfair Park.
Economy
Lakewood is a primarily residential city, and the economy is largely based on the service industry. The city is home to several large employers, including Boeing, St. Joseph Medical Center, and Lakewood Regional Medical Center. The city also has a thriving retail sector, with several shopping centers and malls, including Lakewood Center, Long Beach Towne Center, and Cerritos Towne Center.
Demographics
As of the 2010 census, the population of Lakewood was 80,048, with a population density of 8,400 people per square mile. The racial makeup of the city was 57.2% White, 11.2% African American, 0.7% Native American, 16.2% Asian, 0.3% Pacific Islander, 8.7% from other races, and 5.7% from two or more races. Hispanic or Latino of any race were 24.2% of the population.
The median income for a household in the city was $60,845, and the median income for a family was $68,921. The per capita income for the city was $27,837. About 8.2% of families and 10.2% of the population were below the poverty line, including 14.2% of those under age 18 and 6.2% of those age 65 or over.
Common Questions
What is Per Capita Income in Lakewood?
Per Capita income in Lakewood is $43,086.
What is the Median Family Income in Lakewood?
Median Family Income in Lakewood is $120,962.
What is the Median Household income in Lakewood?
Median Household Income in Lakewood is $113,030.
What is Income or Wage Gap in Lakewood?
Income or Wage Gap in Lakewood is 17.7%.
Women in Lakewood earn 82.3 cents for every dollar earned by a man.
What is Family Income Deficit in Lakewood?
Family Income Deficit in Lakewood is $11,522.
Families that are below poverty line in Lakewood earn $11,522 less on average than the poverty threshold level.
What is Inequality or Gini Index in Lakewood?
Inequality or Gini Index in Lakewood is 0.38.
What is the Total Population of Lakewood?
Total Population of Lakewood is 81,499.
What is the Total Male Population of Lakewood?
Total Male Population of Lakewood is 39,978.
What is the Total Female Population of Lakewood?
Total Female Population of Lakewood is 41,521.
What is the Ratio of Males per 100 Females in Lakewood?
There are 96.28 Males per 100 Females in Lakewood.
What is the Ratio of Females per 100 Males in Lakewood?
There are 103.86 Females per 100 Males in Lakewood.
What is the Median Population Age in Lakewood?
Median Population Age in Lakewood is 38.4 Years.
What is the Average Family Size in Lakewood
Average Family Size in Lakewood is 3.5 People.
What is the Average Household Size in Lakewood
Average Household Size in Lakewood is 3.1 People.
How Large is the Labor Force in Lakewood?
There are 45,300 People in the Labor Forcein in Lakewood.
What is the Percentage of People in the Labor Force in Lakewood?
68.2% of People are in the Labor Force in Lakewood.
What is the Unemployment Rate in Lakewood?
Unemployment Rate in Lakewood is 5.7%.