West Covina, CA Map & Demographics
West Covina Map
West Covina Overview
$36,707
PER CAPITA INCOME
$105,071
AVG FAMILY INCOME
$96,219
AVG HOUSEHOLD INCOME
23.2%
WAGE / INCOME GAP [ % ]
76.8¢/ $1
WAGE / INCOME GAP [ $ ]
$11,329
FAMILY INCOME DEFICIT
0.42
INEQUALITY / GINI INDEX
108,173
TOTAL POPULATION
52,130
MALE POPULATION
56,043
FEMALE POPULATION
93.02
MALES / 100 FEMALES
107.51
FEMALES / 100 MALES
39.8
MEDIAN AGE
3.7
AVG FAMILY SIZE
3.3
AVG HOUSEHOLD SIZE
56,738
LABOR FORCE [ PEOPLE ]
63.5%
PERCENT IN LABOR FORCE
6.7%
UNEMPLOYMENT RATE
West Covina Area Codes
Income in West Covina
Income Overview in West Covina
Per Capita Income in West Covina is $36,707, while median incomes of families and households are $105,071 and $96,219 respectively.
| Characteristic | Number | Measure |
| Per Capita Income | 108,173 | $36,707 |
| Median Family Income | 25,152 | $105,071 |
| Mean Family Income | 25,152 | $126,865 |
| Median Household Income | 32,285 | $96,219 |
| Mean Household Income | 32,285 | $117,808 |
| Income Deficit | 25,152 | $11,329 |
| Wage / Income Gap (%) | 108,173 | 23.17% |
| Wage / Income Gap ($) | 108,173 | 76.83¢ per $1 |
| Gini / Inequality Index | 108,173 | 0.42 |
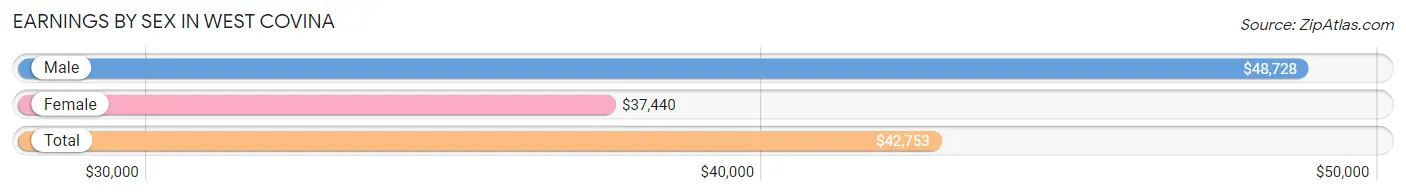
Earnings by Sex in West Covina
Average Earnings in West Covina are $42,753, $48,728 for men and $37,440 for women, a difference of 23.2%.
| Sex | Number | Average Earnings |
| Male | 28,769 (50.7%) | $48,728 |
| Female | 27,973 (49.3%) | $37,440 |
| Total | 56,742 (100.0%) | $42,753 |
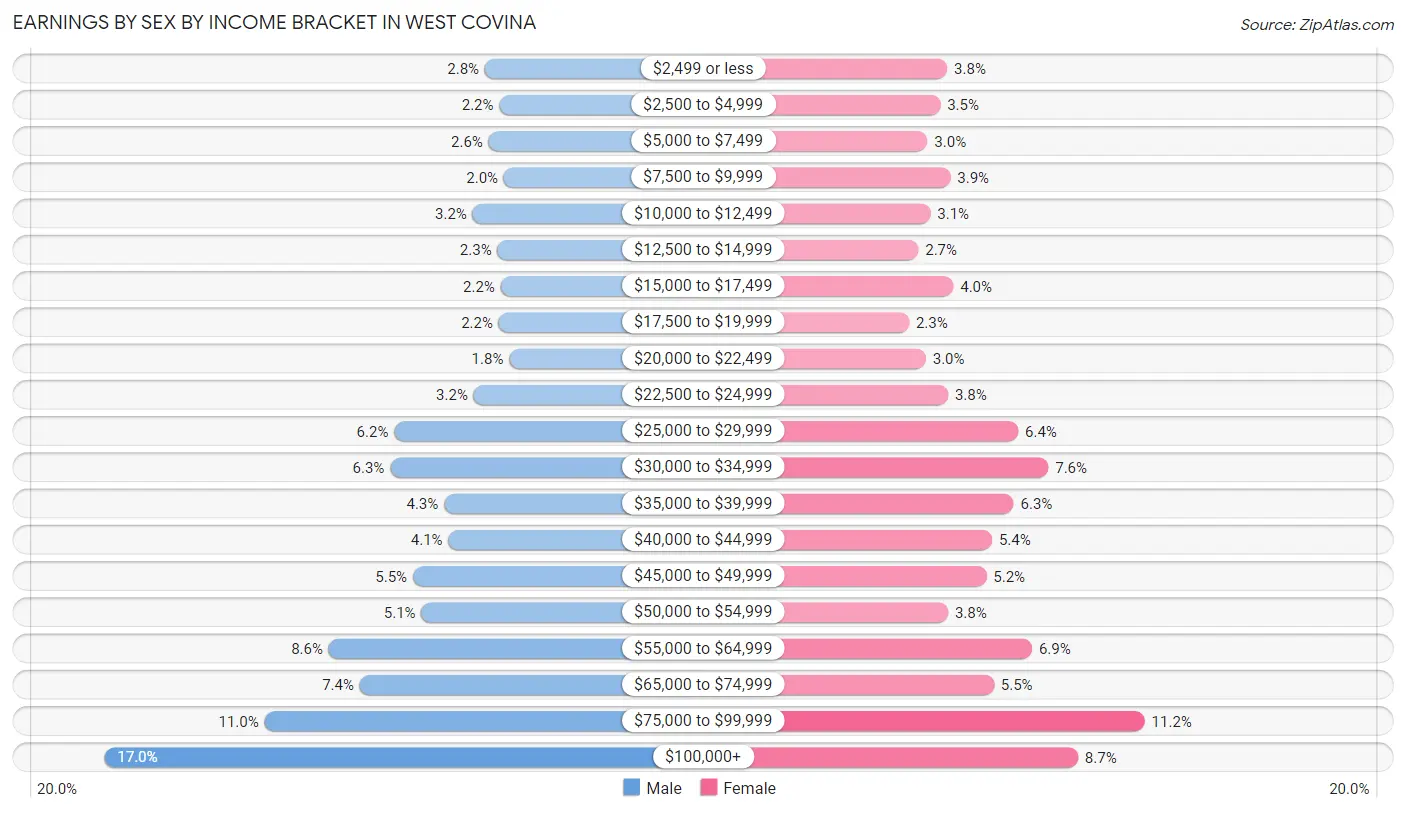
Earnings by Sex by Income Bracket in West Covina
The most common earnings brackets in West Covina are $100,000+ for men (4,894 | 17.0%) and $75,000 to $99,999 for women (3,123 | 11.2%).
| Income | Male | Female |
| $2,499 or less | 791 (2.8%) | 1,053 (3.8%) |
| $2,500 to $4,999 | 636 (2.2%) | 979 (3.5%) |
| $5,000 to $7,499 | 752 (2.6%) | 846 (3.0%) |
| $7,500 to $9,999 | 587 (2.0%) | 1,085 (3.9%) |
| $10,000 to $12,499 | 923 (3.2%) | 875 (3.1%) |
| $12,500 to $14,999 | 657 (2.3%) | 750 (2.7%) |
| $15,000 to $17,499 | 622 (2.2%) | 1,115 (4.0%) |
| $17,500 to $19,999 | 642 (2.2%) | 652 (2.3%) |
| $20,000 to $22,499 | 530 (1.8%) | 829 (3.0%) |
| $22,500 to $24,999 | 911 (3.2%) | 1,061 (3.8%) |
| $25,000 to $29,999 | 1,770 (6.1%) | 1,796 (6.4%) |
| $30,000 to $34,999 | 1,812 (6.3%) | 2,113 (7.5%) |
| $35,000 to $39,999 | 1,230 (4.3%) | 1,747 (6.2%) |
| $40,000 to $44,999 | 1,186 (4.1%) | 1,523 (5.4%) |
| $45,000 to $49,999 | 1,567 (5.4%) | 1,462 (5.2%) |
| $50,000 to $54,999 | 1,475 (5.1%) | 1,060 (3.8%) |
| $55,000 to $64,999 | 2,475 (8.6%) | 1,941 (6.9%) |
| $65,000 to $74,999 | 2,141 (7.4%) | 1,540 (5.5%) |
| $75,000 to $99,999 | 3,168 (11.0%) | 3,123 (11.2%) |
| $100,000+ | 4,894 (17.0%) | 2,423 (8.7%) |
| Total | 28,769 (100.0%) | 27,973 (100.0%) |
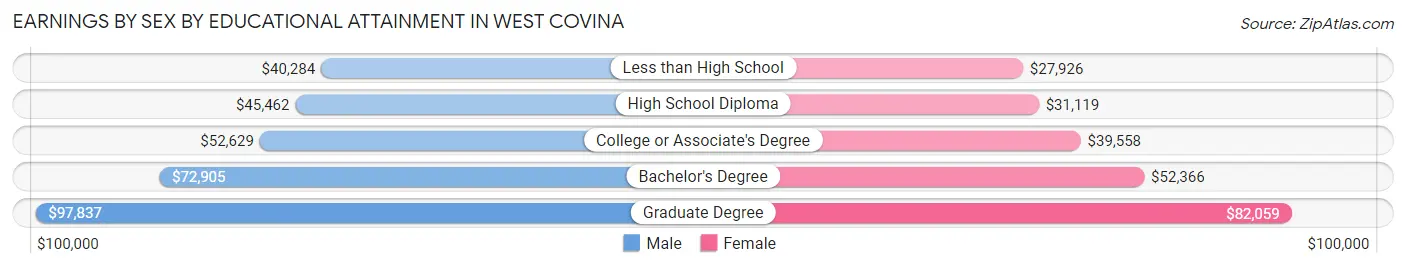
Earnings by Sex by Educational Attainment in West Covina
Average earnings in West Covina are $54,226 for men and $41,308 for women, a difference of 23.8%. Men with an educational attainment of graduate degree enjoy the highest average annual earnings of $97,837, while those with less than high school education earn the least with $40,284. Women with an educational attainment of graduate degree earn the most with the average annual earnings of $82,059, while those with less than high school education have the smallest earnings of $27,926.
| Educational Attainment | Male Income | Female Income |
| Less than High School | $40,284 | $27,926 |
| High School Diploma | $45,462 | $31,119 |
| College or Associate's Degree | $52,629 | $39,558 |
| Bachelor's Degree | $72,905 | $52,366 |
| Graduate Degree | $97,837 | $82,059 |
| Total | $54,226 | $41,308 |
Family Income in West Covina
Family Income Brackets in West Covina
According to the West Covina family income data, there are 6,036 families falling into the $100,000 to $149,999 income range, which is the most common income bracket and makes up 24.0% of all families. Conversely, the $10,000 to $14,999 income bracket is the least frequent group with only 402 families (1.6%) belonging to this category.
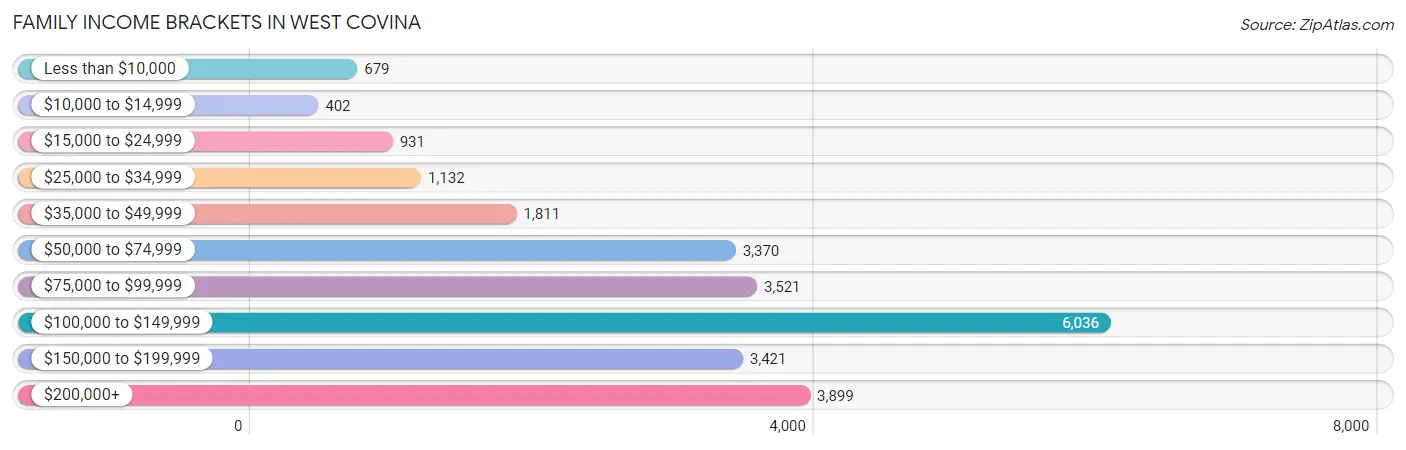
| Income Bracket | # Families | % Families |
| Less than $10,000 | 679 | 2.7% |
| $10,000 to $14,999 | 402 | 1.6% |
| $15,000 to $24,999 | 931 | 3.7% |
| $25,000 to $34,999 | 1,132 | 4.5% |
| $35,000 to $49,999 | 1,811 | 7.2% |
| $50,000 to $74,999 | 3,370 | 13.4% |
| $75,000 to $99,999 | 3,521 | 14.0% |
| $100,000 to $149,999 | 6,036 | 24.0% |
| $150,000 to $199,999 | 3,421 | 13.6% |
| $200,000+ | 3,899 | 15.5% |
Family Income by Famaliy Size in West Covina
7+ person families (1,026 | 4.1%) account for the highest median family income in West Covina with $170,938 per family, while 2-person families (7,823 | 31.1%) have the highest median income of $39,267 per family member.
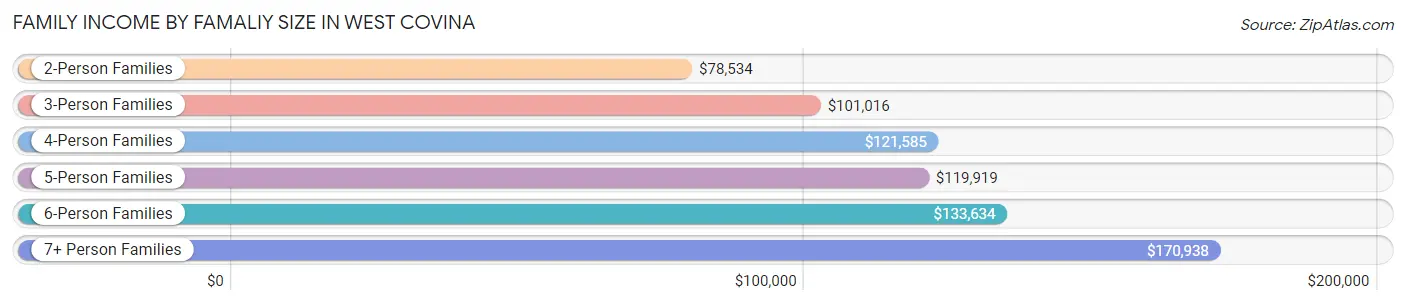
| Income Bracket | # Families | Median Income |
| 2-Person Families | 7,823 (31.1%) | $78,534 |
| 3-Person Families | 6,239 (24.8%) | $101,016 |
| 4-Person Families | 5,993 (23.8%) | $121,585 |
| 5-Person Families | 2,594 (10.3%) | $119,919 |
| 6-Person Families | 1,477 (5.9%) | $133,634 |
| 7+ Person Families | 1,026 (4.1%) | $170,938 |
| Total | 25,152 (100.0%) | $105,071 |
Family Income by Number of Earners in West Covina
The median family income in West Covina is $105,071, with families comprising 3+ earners (5,880) having the highest median family income of $154,695, while families with no earners (2,827) have the lowest median family income of $36,595, accounting for 23.4% and 11.2% of families, respectively.
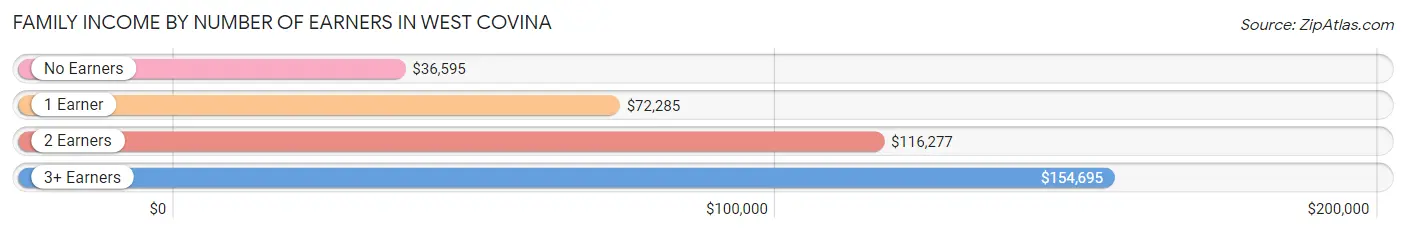
| Number of Earners | # Families | Median Income |
| No Earners | 2,827 (11.2%) | $36,595 |
| 1 Earner | 6,958 (27.7%) | $72,285 |
| 2 Earners | 9,487 (37.7%) | $116,277 |
| 3+ Earners | 5,880 (23.4%) | $154,695 |
| Total | 25,152 (100.0%) | $105,071 |
Household Income in West Covina
Household Income Brackets in West Covina
With 7,103 households falling in the category, the $100,000 to $149,999 income range is the most frequent in West Covina, accounting for 22.0% of all households. In contrast, only 1,033 households (3.2%) fall into the $10,000 to $14,999 income bracket, making it the least populous group.
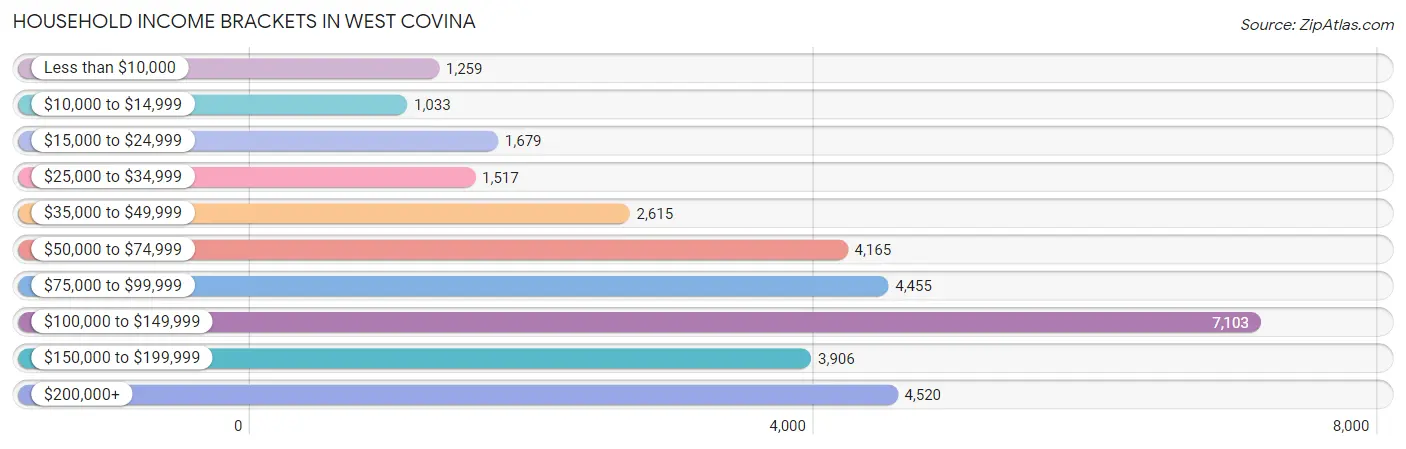
| Income Bracket | # Households | % Households |
| Less than $10,000 | 1,259 | 3.9% |
| $10,000 to $14,999 | 1,033 | 3.2% |
| $15,000 to $24,999 | 1,679 | 5.2% |
| $25,000 to $34,999 | 1,517 | 4.7% |
| $35,000 to $49,999 | 2,615 | 8.1% |
| $50,000 to $74,999 | 4,165 | 12.9% |
| $75,000 to $99,999 | 4,455 | 13.8% |
| $100,000 to $149,999 | 7,103 | 22.0% |
| $150,000 to $199,999 | 3,906 | 12.1% |
| $200,000+ | 4,520 | 14.0% |
Household Income by Householder Age in West Covina
The median household income in West Covina is $96,219, with the highest median household income of $115,426 found in the 45 to 64 years age bracket for the primary householder. A total of 14,033 households (43.5%) fall into this category. Meanwhile, the 15 to 24 years age bracket for the primary householder has the lowest median household income of $51,516, with 497 households (1.5%) in this group.
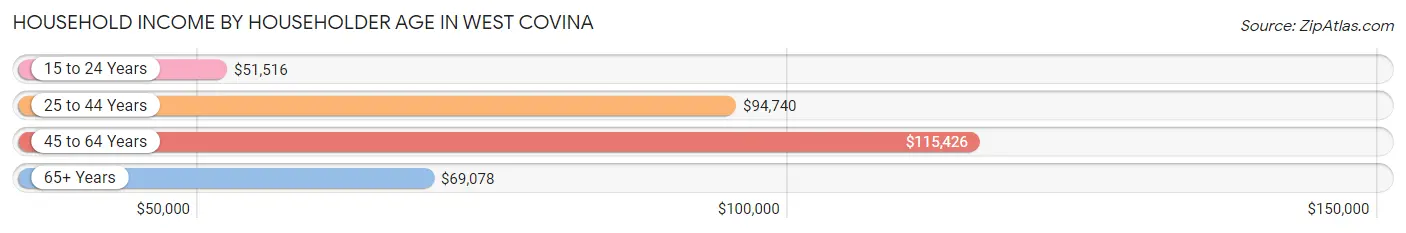
| Income Bracket | # Households | Median Income |
| 15 to 24 Years | 497 (1.5%) | $51,516 |
| 25 to 44 Years | 9,063 (28.1%) | $94,740 |
| 45 to 64 Years | 14,033 (43.5%) | $115,426 |
| 65+ Years | 8,692 (26.9%) | $69,078 |
| Total | 32,285 (100.0%) | $96,219 |
Poverty in West Covina
Income Below Poverty by Sex and Age in West Covina
With 7.5% poverty level for males and 10.9% for females among the residents of West Covina, 16 and 17 year old males and under 5 year old females are the most vulnerable to poverty, with 170 males (13.4%) and 346 females (16.7%) in their respective age groups living below the poverty level.
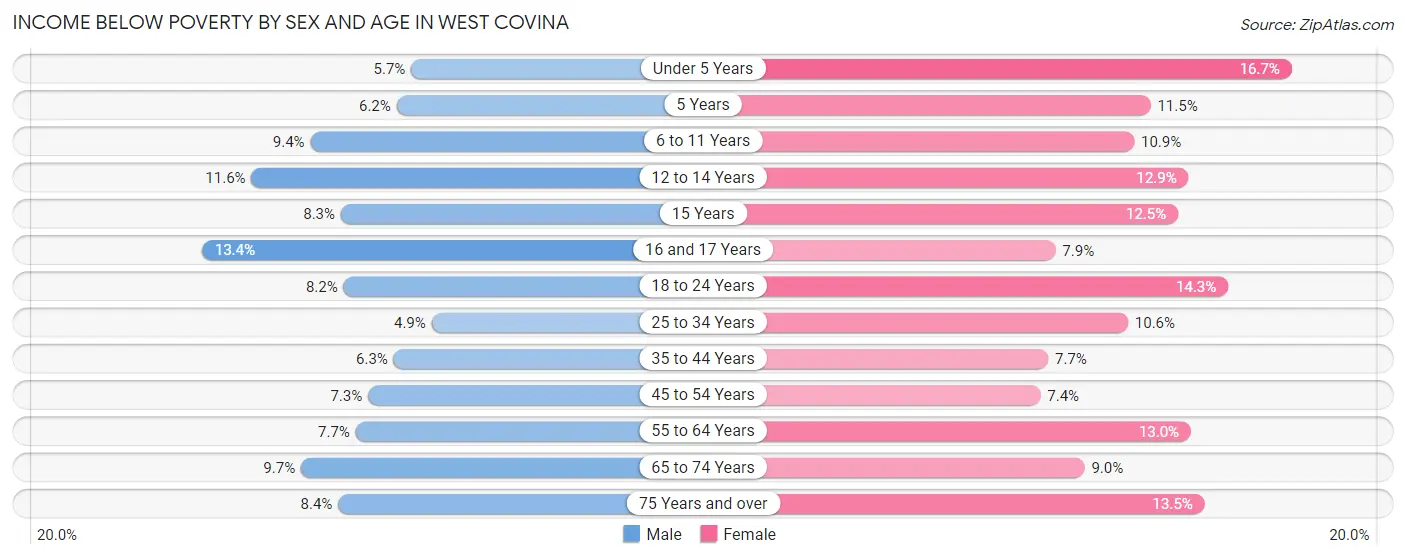
| Age Bracket | Male | Female |
| Under 5 Years | 149 (5.7%) | 346 (16.7%) |
| 5 Years | 38 (6.2%) | 66 (11.5%) |
| 6 to 11 Years | 365 (9.4%) | 391 (10.8%) |
| 12 to 14 Years | 202 (11.6%) | 259 (12.9%) |
| 15 Years | 53 (8.3%) | 67 (12.5%) |
| 16 and 17 Years | 170 (13.4%) | 96 (7.9%) |
| 18 to 24 Years | 417 (8.2%) | 689 (14.3%) |
| 25 to 34 Years | 403 (4.9%) | 852 (10.6%) |
| 35 to 44 Years | 402 (6.3%) | 517 (7.7%) |
| 45 to 54 Years | 511 (7.2%) | 523 (7.4%) |
| 55 to 64 Years | 537 (7.7%) | 1,073 (13.0%) |
| 65 to 74 Years | 414 (9.7%) | 507 (9.0%) |
| 75 Years and over | 241 (8.4%) | 674 (13.5%) |
| Total | 3,902 (7.5%) | 6,060 (10.9%) |
Income Above Poverty by Sex and Age in West Covina
According to the poverty statistics in West Covina, males aged 25 to 34 years and females aged 45 to 54 years are the age groups that are most secure financially, with 95.1% of males and 92.6% of females in these age groups living above the poverty line.
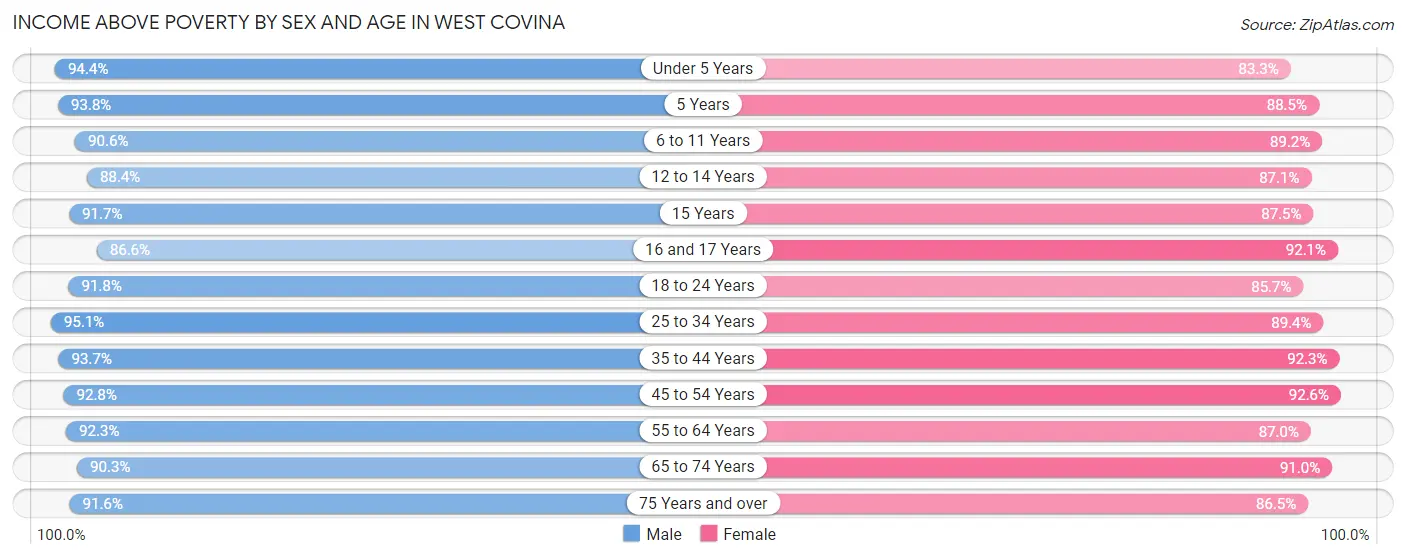
| Age Bracket | Male | Female |
| Under 5 Years | 2,487 (94.4%) | 1,726 (83.3%) |
| 5 Years | 576 (93.8%) | 510 (88.5%) |
| 6 to 11 Years | 3,522 (90.6%) | 3,214 (89.1%) |
| 12 to 14 Years | 1,543 (88.4%) | 1,753 (87.1%) |
| 15 Years | 589 (91.7%) | 470 (87.5%) |
| 16 and 17 Years | 1,097 (86.6%) | 1,114 (92.1%) |
| 18 to 24 Years | 4,693 (91.8%) | 4,116 (85.7%) |
| 25 to 34 Years | 7,830 (95.1%) | 7,170 (89.4%) |
| 35 to 44 Years | 5,981 (93.7%) | 6,231 (92.3%) |
| 45 to 54 Years | 6,535 (92.7%) | 6,573 (92.6%) |
| 55 to 64 Years | 6,429 (92.3%) | 7,204 (87.0%) |
| 65 to 74 Years | 3,837 (90.3%) | 5,120 (91.0%) |
| 75 Years and over | 2,642 (91.6%) | 4,330 (86.5%) |
| Total | 47,761 (92.4%) | 49,531 (89.1%) |
Income Below Poverty Among Married-Couple Families in West Covina
The poverty statistics for married-couple families in West Covina show that 4.8% or 793 of the total 16,689 families live below the poverty line. Families with 3 or 4 children have the highest poverty rate of 10.1%, comprising of 93 families. On the other hand, families with 5 or more children have the lowest poverty rate of 0.0%, which includes 0 families.
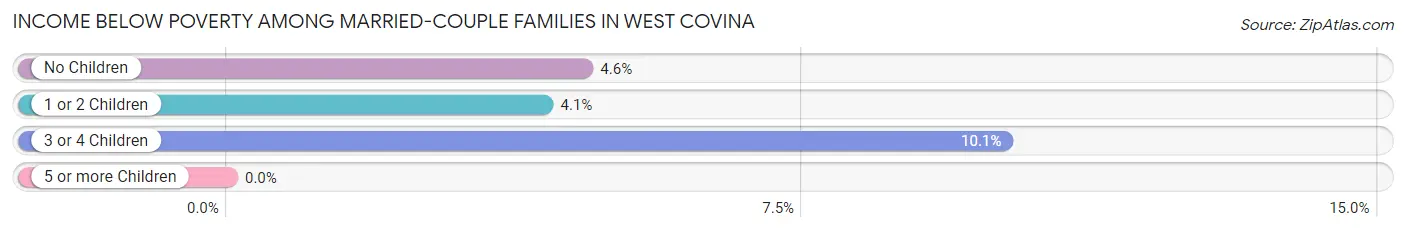
| Children | Above Poverty | Below Poverty |
| No Children | 9,395 (95.4%) | 457 (4.6%) |
| 1 or 2 Children | 5,651 (95.9%) | 243 (4.1%) |
| 3 or 4 Children | 826 (89.9%) | 93 (10.1%) |
| 5 or more Children | 24 (100.0%) | 0 (0.0%) |
| Total | 15,896 (95.3%) | 793 (4.8%) |
Income Below Poverty Among Single-Parent Households in West Covina
According to the poverty data in West Covina, 8.3% or 198 single-father households and 12.9% or 784 single-mother households are living below the poverty line. Among single-father households, those with 1 or 2 children have the highest poverty rate, with 93 households (9.2%) experiencing poverty. Likewise, among single-mother households, those with 5 or more children have the highest poverty rate, with 20 households (69.0%) falling below the poverty line.
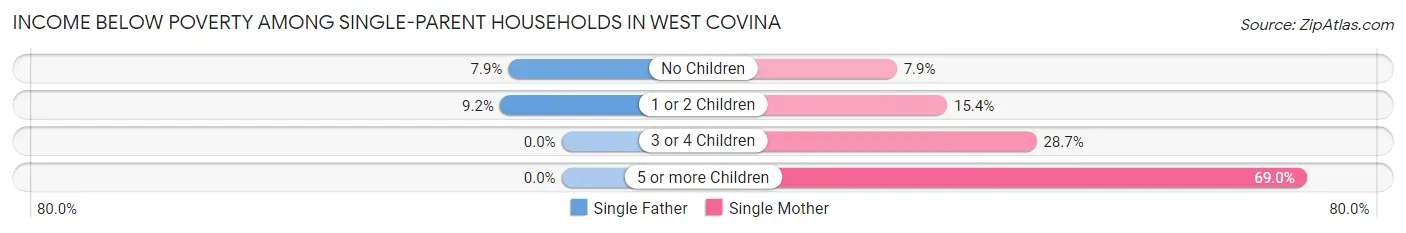
| Children | Single Father | Single Mother |
| No Children | 105 (7.9%) | 242 (7.9%) |
| 1 or 2 Children | 93 (9.2%) | 389 (15.4%) |
| 3 or 4 Children | 0 (0.0%) | 133 (28.7%) |
| 5 or more Children | 0 (0.0%) | 20 (69.0%) |
| Total | 198 (8.3%) | 784 (12.9%) |
Income Below Poverty Among Married-Couple vs Single-Parent Households in West Covina
The poverty data for West Covina shows that 793 of the married-couple family households (4.8%) and 982 of the single-parent households (11.6%) are living below the poverty level. Within the married-couple family households, those with 3 or 4 children have the highest poverty rate, with 93 households (10.1%) falling below the poverty line. Among the single-parent households, those with 5 or more children have the highest poverty rate, with 20 household (69.0%) living below poverty.
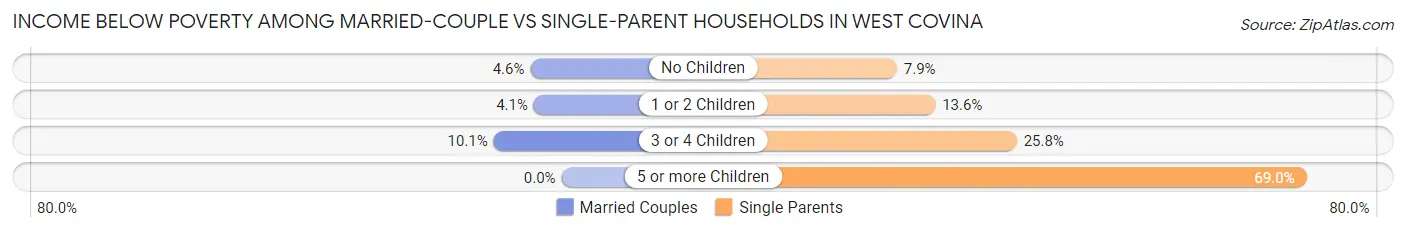
| Children | Married-Couple Families | Single-Parent Households |
| No Children | 457 (4.6%) | 347 (7.9%) |
| 1 or 2 Children | 243 (4.1%) | 482 (13.6%) |
| 3 or 4 Children | 93 (10.1%) | 133 (25.8%) |
| 5 or more Children | 0 (0.0%) | 20 (69.0%) |
| Total | 793 (4.8%) | 982 (11.6%) |
Race in West Covina
The most populous races in West Covina are Hispanic or Latino (57,504 | 53.2%), Asian (32,007 | 29.6%), and White / Caucasian (27,820 | 25.7%).
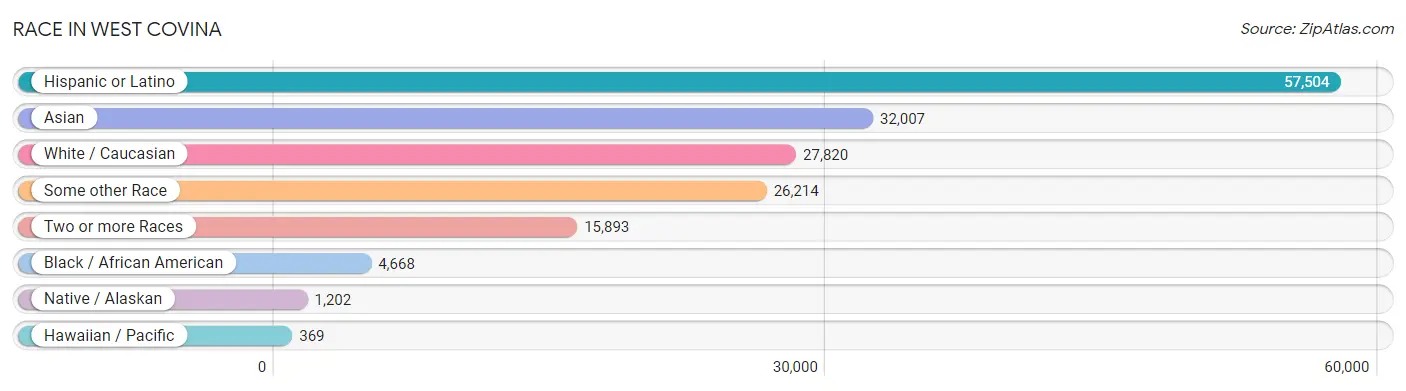
| Race | # Population | % Population |
| Asian | 32,007 | 29.6% |
| Black / African American | 4,668 | 4.3% |
| Hawaiian / Pacific | 369 | 0.3% |
| Hispanic or Latino | 57,504 | 53.2% |
| Native / Alaskan | 1,202 | 1.1% |
| White / Caucasian | 27,820 | 25.7% |
| Two or more Races | 15,893 | 14.7% |
| Some other Race | 26,214 | 24.2% |
| Total | 108,173 | 100.0% |
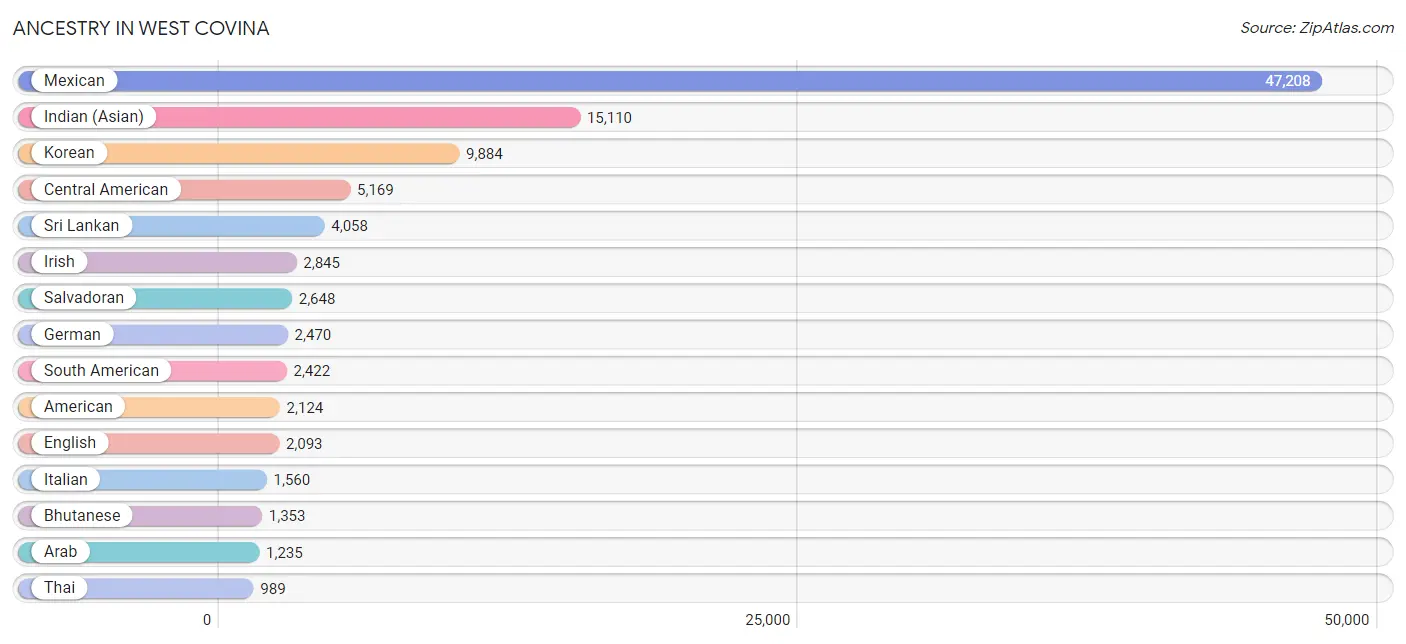
Ancestry in West Covina
The most populous ancestries reported in West Covina are Mexican (47,208 | 43.6%), Indian (Asian) (15,110 | 14.0%), Korean (9,884 | 9.1%), Central American (5,169 | 4.8%), and Sri Lankan (4,058 | 3.7%), together accounting for 75.3% of all West Covina residents.
| Ancestry | # Population | % Population |
| African | 236 | 0.2% |
| American | 2,124 | 2.0% |
| Apache | 142 | 0.1% |
| Arab | 1,235 | 1.1% |
| Argentinean | 205 | 0.2% |
| Armenian | 25 | 0.0% |
| Austrian | 45 | 0.0% |
| Bahamian | 15 | 0.0% |
| Basque | 40 | 0.0% |
| Belgian | 1 | 0.0% |
| Belizean | 91 | 0.1% |
| Bhutanese | 1,353 | 1.3% |
| Blackfeet | 14 | 0.0% |
| Bolivian | 178 | 0.2% |
| Brazilian | 87 | 0.1% |
| British | 149 | 0.1% |
| Bulgarian | 15 | 0.0% |
| Burmese | 508 | 0.5% |
| Canadian | 116 | 0.1% |
| Cape Verdean | 10 | 0.0% |
| Central American | 5,169 | 4.8% |
| Central American Indian | 236 | 0.2% |
| Cherokee | 163 | 0.2% |
| Cheyenne | 33 | 0.0% |
| Chilean | 94 | 0.1% |
| Chippewa | 143 | 0.1% |
| Colombian | 474 | 0.4% |
| Colville | 33 | 0.0% |
| Costa Rican | 209 | 0.2% |
| Creek | 8 | 0.0% |
| Croatian | 25 | 0.0% |
| Cuban | 317 | 0.3% |
| Czech | 41 | 0.0% |
| Czechoslovakian | 71 | 0.1% |
| Danish | 87 | 0.1% |
| Dutch | 198 | 0.2% |
| Dutch West Indian | 57 | 0.1% |
| Eastern European | 30 | 0.0% |
| Ecuadorian | 465 | 0.4% |
| Egyptian | 387 | 0.4% |
| English | 2,093 | 1.9% |
| Estonian | 5 | 0.0% |
| Ethiopian | 23 | 0.0% |
| European | 514 | 0.5% |
| Filipino | 880 | 0.8% |
| Finnish | 38 | 0.0% |
| French | 894 | 0.8% |
| French American Indian | 80 | 0.1% |
| French Canadian | 47 | 0.0% |
| German | 2,470 | 2.3% |
| Greek | 282 | 0.3% |
| Guamanian / Chamorro | 90 | 0.1% |
| Guatemalan | 975 | 0.9% |
| Haitian | 5 | 0.0% |
| Honduran | 380 | 0.4% |
| Hopi | 4 | 0.0% |
| Hungarian | 70 | 0.1% |
| Indian (Asian) | 15,110 | 14.0% |
| Indonesian | 466 | 0.4% |
| Inupiat | 3 | 0.0% |
| Iranian | 261 | 0.2% |
| Iraqi | 90 | 0.1% |
| Irish | 2,845 | 2.6% |
| Italian | 1,560 | 1.4% |
| Jamaican | 43 | 0.0% |
| Japanese | 342 | 0.3% |
| Jordanian | 33 | 0.0% |
| Korean | 9,884 | 9.1% |
| Laotian | 195 | 0.2% |
| Latvian | 8 | 0.0% |
| Lebanese | 166 | 0.2% |
| Lithuanian | 8 | 0.0% |
| Malaysian | 231 | 0.2% |
| Mexican | 47,208 | 43.6% |
| Mexican American Indian | 695 | 0.6% |
| Mongolian | 90 | 0.1% |
| Moroccan | 39 | 0.0% |
| Native Hawaiian | 119 | 0.1% |
| Navajo | 31 | 0.0% |
| Nicaraguan | 896 | 0.8% |
| Nigerian | 46 | 0.0% |
| Norwegian | 179 | 0.2% |
| Okinawan | 9 | 0.0% |
| Pakistani | 790 | 0.7% |
| Palestinian | 131 | 0.1% |
| Panamanian | 61 | 0.1% |
| Peruvian | 615 | 0.6% |
| Pima | 15 | 0.0% |
| Polish | 343 | 0.3% |
| Portuguese | 196 | 0.2% |
| Pueblo | 4 | 0.0% |
| Puerto Rican | 446 | 0.4% |
| Romanian | 32 | 0.0% |
| Russian | 86 | 0.1% |
| Salvadoran | 2,648 | 2.5% |
| Samoan | 234 | 0.2% |
| Scandinavian | 94 | 0.1% |
| Scotch-Irish | 118 | 0.1% |
| Scottish | 273 | 0.3% |
| Serbian | 8 | 0.0% |
| Slovak | 26 | 0.0% |
| Slovene | 24 | 0.0% |
| South American | 2,422 | 2.2% |
| Spaniard | 315 | 0.3% |
| Spanish | 247 | 0.2% |
| Spanish American | 64 | 0.1% |
| Spanish American Indian | 114 | 0.1% |
| Sri Lankan | 4,058 | 3.7% |
| Subsaharan African | 389 | 0.4% |
| Swedish | 383 | 0.4% |
| Swiss | 24 | 0.0% |
| Syrian | 96 | 0.1% |
| Thai | 989 | 0.9% |
| Tongan | 171 | 0.2% |
| Ugandan | 7 | 0.0% |
| Ukrainian | 119 | 0.1% |
| Ute | 25 | 0.0% |
| Venezuelan | 339 | 0.3% |
| Welsh | 120 | 0.1% |
| Yaqui | 120 | 0.1% | View All 120 Rows |
Immigrants in West Covina
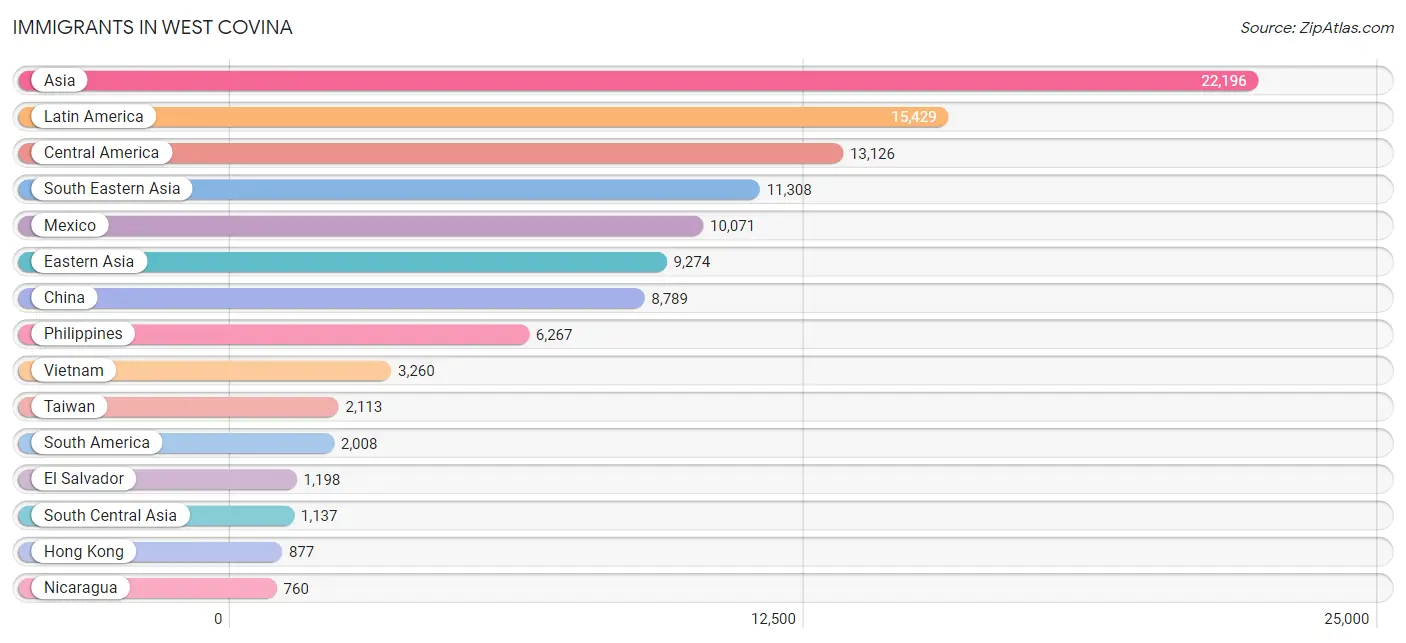
The most numerous immigrant groups reported in West Covina came from Asia (22,196 | 20.5%), Latin America (15,429 | 14.3%), Central America (13,126 | 12.1%), South Eastern Asia (11,308 | 10.4%), and Mexico (10,071 | 9.3%), together accounting for 66.7% of all West Covina residents.
| Immigration Origin | # Population | % Population |
| Africa | 367 | 0.3% |
| Argentina | 131 | 0.1% |
| Asia | 22,196 | 20.5% |
| Bangladesh | 45 | 0.0% |
| Belize | 99 | 0.1% |
| Bolivia | 104 | 0.1% |
| Brazil | 24 | 0.0% |
| Cambodia | 251 | 0.2% |
| Canada | 45 | 0.0% |
| Caribbean | 295 | 0.3% |
| Central America | 13,126 | 12.1% |
| Chile | 60 | 0.1% |
| China | 8,789 | 8.1% |
| Colombia | 430 | 0.4% |
| Costa Rica | 97 | 0.1% |
| Croatia | 8 | 0.0% |
| Cuba | 198 | 0.2% |
| Czechoslovakia | 29 | 0.0% |
| Denmark | 9 | 0.0% |
| Eastern Africa | 21 | 0.0% |
| Eastern Asia | 9,274 | 8.6% |
| Eastern Europe | 141 | 0.1% |
| Ecuador | 319 | 0.3% |
| Egypt | 249 | 0.2% |
| El Salvador | 1,198 | 1.1% |
| England | 77 | 0.1% |
| Ethiopia | 10 | 0.0% |
| Europe | 401 | 0.4% |
| Fiji | 105 | 0.1% |
| France | 25 | 0.0% |
| Germany | 20 | 0.0% |
| Ghana | 33 | 0.0% |
| Guatemala | 672 | 0.6% |
| Honduras | 229 | 0.2% |
| Hong Kong | 877 | 0.8% |
| Hungary | 1 | 0.0% |
| India | 664 | 0.6% |
| Indonesia | 232 | 0.2% |
| Iran | 173 | 0.2% |
| Iraq | 76 | 0.1% |
| Italy | 15 | 0.0% |
| Jamaica | 44 | 0.0% |
| Japan | 171 | 0.2% |
| Jordan | 79 | 0.1% |
| Korea | 314 | 0.3% |
| Kuwait | 21 | 0.0% |
| Laos | 219 | 0.2% |
| Latin America | 15,429 | 14.3% |
| Lebanon | 55 | 0.1% |
| Malaysia | 137 | 0.1% |
| Mexico | 10,071 | 9.3% |
| Morocco | 43 | 0.0% |
| Nepal | 139 | 0.1% |
| Netherlands | 11 | 0.0% |
| Nicaragua | 760 | 0.7% |
| Nigeria | 15 | 0.0% |
| Northern Africa | 292 | 0.3% |
| Northern Europe | 145 | 0.1% |
| Norway | 6 | 0.0% |
| Oceania | 251 | 0.2% |
| Peru | 696 | 0.6% |
| Philippines | 6,267 | 5.8% |
| Poland | 28 | 0.0% |
| Romania | 22 | 0.0% |
| Russia | 27 | 0.0% |
| Saudi Arabia | 33 | 0.0% |
| Singapore | 12 | 0.0% |
| South America | 2,008 | 1.9% |
| South Central Asia | 1,137 | 1.1% |
| South Eastern Asia | 11,308 | 10.4% |
| Southern Europe | 59 | 0.1% |
| Spain | 44 | 0.0% |
| Sri Lanka | 116 | 0.1% |
| Sweden | 6 | 0.0% |
| Syria | 42 | 0.0% |
| Taiwan | 2,113 | 1.9% |
| Thailand | 385 | 0.4% |
| Trinidad and Tobago | 19 | 0.0% |
| Uganda | 11 | 0.0% |
| Ukraine | 26 | 0.0% |
| Venezuela | 244 | 0.2% |
| Vietnam | 3,260 | 3.0% |
| Western Africa | 48 | 0.0% |
| Western Asia | 394 | 0.4% |
| Western Europe | 56 | 0.1% | View All 85 Rows |
Sex and Age in West Covina
Sex and Age in West Covina
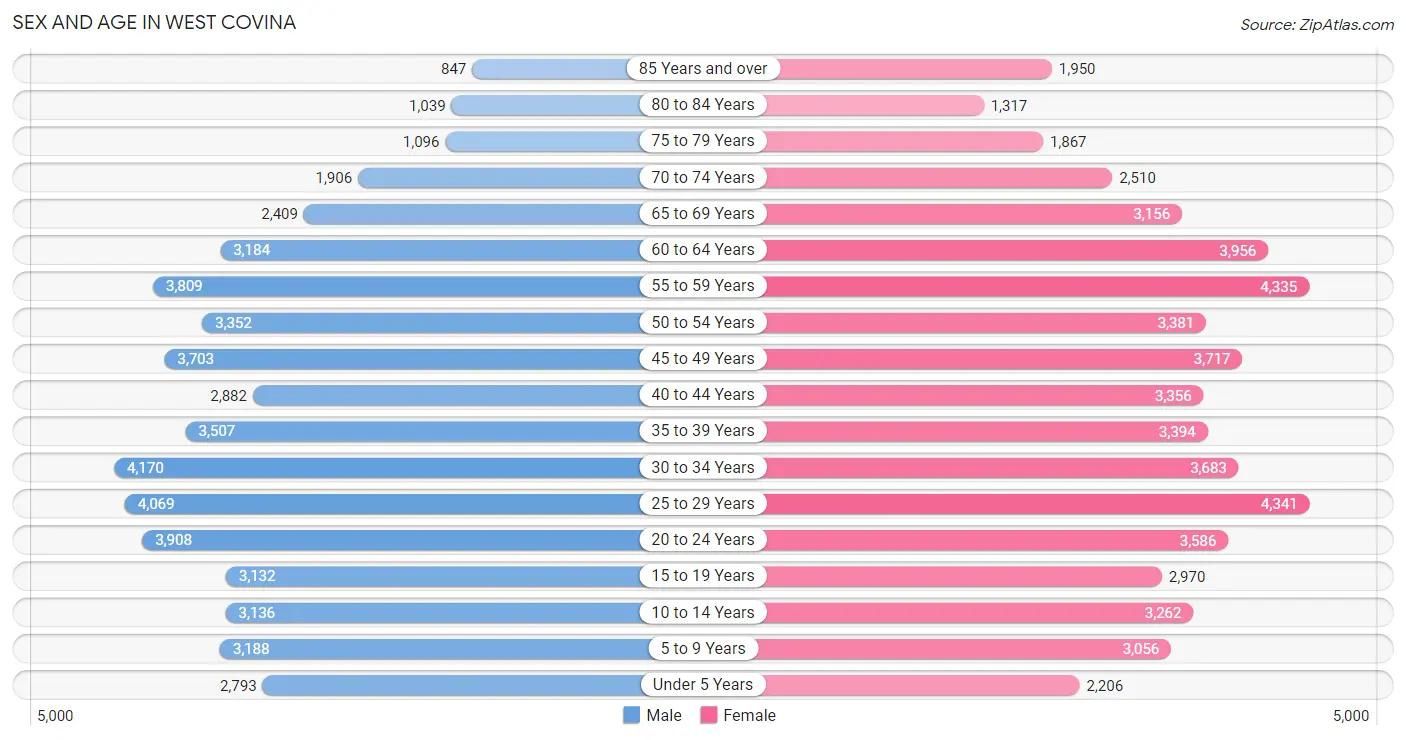
The most populous age groups in West Covina are 30 to 34 Years (4,170 | 8.0%) for men and 25 to 29 Years (4,341 | 7.7%) for women.
| Age Bracket | Male | Female |
| Under 5 Years | 2,793 (5.4%) | 2,206 (3.9%) |
| 5 to 9 Years | 3,188 (6.1%) | 3,056 (5.4%) |
| 10 to 14 Years | 3,136 (6.0%) | 3,262 (5.8%) |
| 15 to 19 Years | 3,132 (6.0%) | 2,970 (5.3%) |
| 20 to 24 Years | 3,908 (7.5%) | 3,586 (6.4%) |
| 25 to 29 Years | 4,069 (7.8%) | 4,341 (7.7%) |
| 30 to 34 Years | 4,170 (8.0%) | 3,683 (6.6%) |
| 35 to 39 Years | 3,507 (6.7%) | 3,394 (6.1%) |
| 40 to 44 Years | 2,882 (5.5%) | 3,356 (6.0%) |
| 45 to 49 Years | 3,703 (7.1%) | 3,717 (6.6%) |
| 50 to 54 Years | 3,352 (6.4%) | 3,381 (6.0%) |
| 55 to 59 Years | 3,809 (7.3%) | 4,335 (7.7%) |
| 60 to 64 Years | 3,184 (6.1%) | 3,956 (7.1%) |
| 65 to 69 Years | 2,409 (4.6%) | 3,156 (5.6%) |
| 70 to 74 Years | 1,906 (3.7%) | 2,510 (4.5%) |
| 75 to 79 Years | 1,096 (2.1%) | 1,867 (3.3%) |
| 80 to 84 Years | 1,039 (2.0%) | 1,317 (2.4%) |
| 85 Years and over | 847 (1.6%) | 1,950 (3.5%) |
| Total | 52,130 (100.0%) | 56,043 (100.0%) |
Families and Households in West Covina
Median Family Size in West Covina
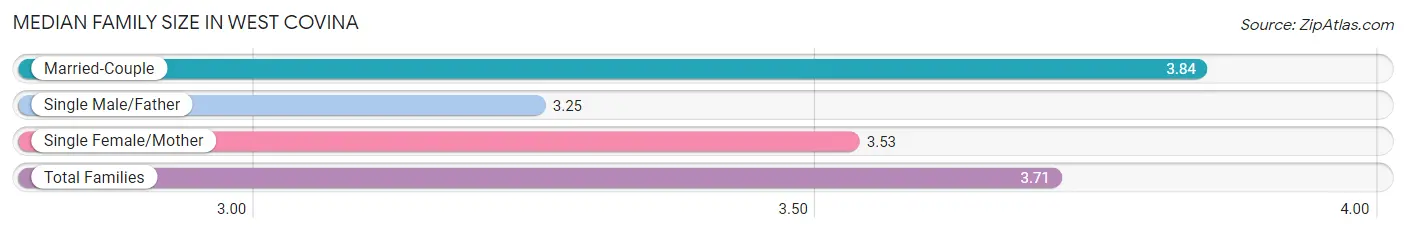
The median family size in West Covina is 3.71 persons per family, with married-couple families (16,689 | 66.3%) accounting for the largest median family size of 3.84 persons per family. On the other hand, single male/father families (2,387 | 9.5%) represent the smallest median family size with 3.25 persons per family.
| Family Type | # Families | Family Size |
| Married-Couple | 16,689 (66.3%) | 3.84 |
| Single Male/Father | 2,387 (9.5%) | 3.25 |
| Single Female/Mother | 6,076 (24.2%) | 3.53 |
| Total Families | 25,152 (100.0%) | 3.71 |
Median Household Size in West Covina
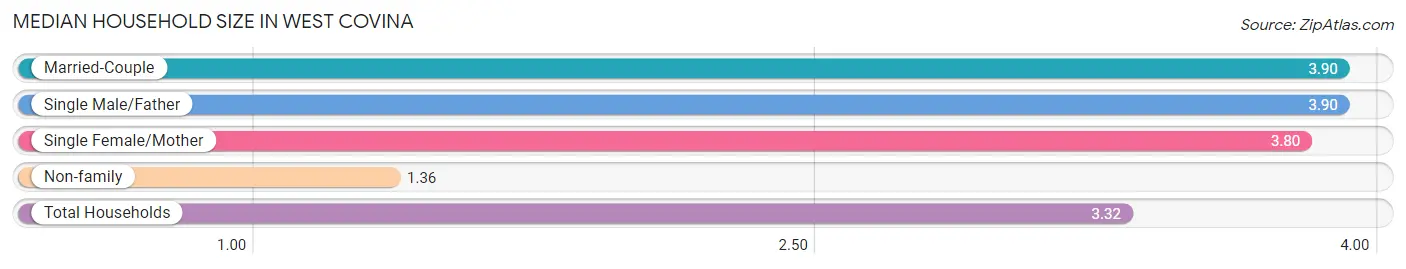
The median household size in West Covina is 3.32 persons per household, with married-couple households (16,689 | 51.7%) accounting for the largest median household size of 3.9 persons per household. non-family households (7,133 | 22.1%) represent the smallest median household size with 1.36 persons per household.
| Household Type | # Households | Household Size |
| Married-Couple | 16,689 (51.7%) | 3.90 |
| Single Male/Father | 2,387 (7.4%) | 3.90 |
| Single Female/Mother | 6,076 (18.8%) | 3.80 |
| Non-family | 7,133 (22.1%) | 1.36 |
| Total Households | 32,285 (100.0%) | 3.32 |
Household Size by Marriage Status in West Covina
Out of a total of 32,285 households in West Covina, 25,152 (77.9%) are family households, while 7,133 (22.1%) are nonfamily households. The most numerous type of family households are 2-person households, comprising 6,950, and the most common type of nonfamily households are 1-person households, comprising 5,324.
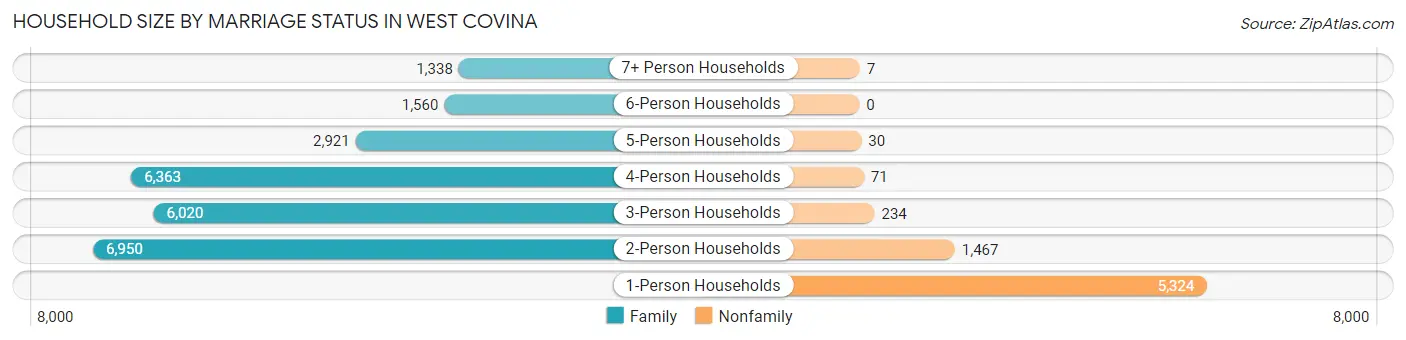
| Household Size | Family Households | Nonfamily Households |
| 1-Person Households | - | 5,324 (16.5%) |
| 2-Person Households | 6,950 (21.5%) | 1,467 (4.5%) |
| 3-Person Households | 6,020 (18.6%) | 234 (0.7%) |
| 4-Person Households | 6,363 (19.7%) | 71 (0.2%) |
| 5-Person Households | 2,921 (9.0%) | 30 (0.1%) |
| 6-Person Households | 1,560 (4.8%) | 0 (0.0%) |
| 7+ Person Households | 1,338 (4.1%) | 7 (0.0%) |
| Total | 25,152 (77.9%) | 7,133 (22.1%) |
Female Fertility in West Covina
Fertility by Age in West Covina
Average fertility rate in West Covina is 48.0 births per 1,000 women. Women in the age bracket of 20 to 34 years have the highest fertility rate with 62.0 births per 1,000 women. Women in the age bracket of 20 to 34 years acount for 58.3% of all women with births.
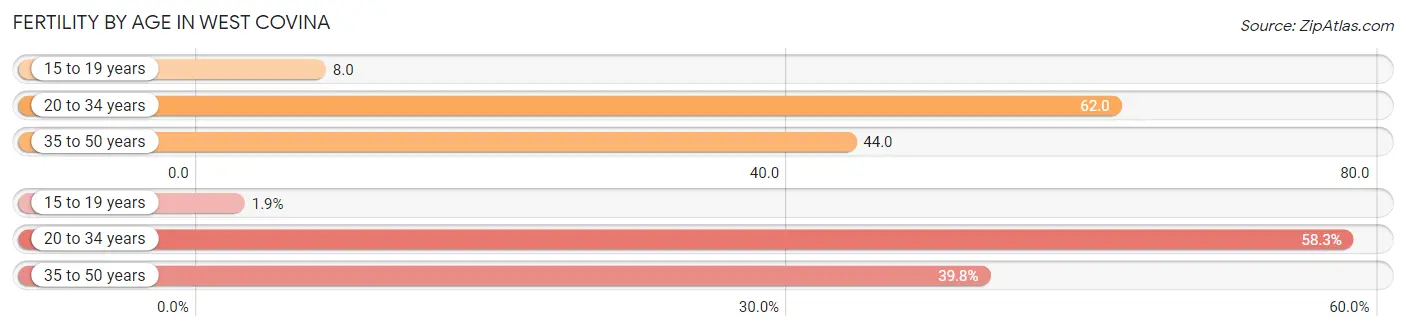
| Age Bracket | Women with Births | Births / 1,000 Women |
| 15 to 19 years | 23 (1.9%) | 8.0 |
| 20 to 34 years | 716 (58.3%) | 62.0 |
| 35 to 50 years | 489 (39.8%) | 44.0 |
| Total | 1,228 (100.0%) | 48.0 |
Fertility by Age by Marriage Status in West Covina
55.9% of women with births (1,228) in West Covina are married. The highest percentage of unmarried women with births falls into 15 to 19 years age bracket with 100.0% of them unmarried at the time of birth, while the lowest percentage of unmarried women with births belong to 35 to 50 years age bracket with 15.7% of them unmarried.
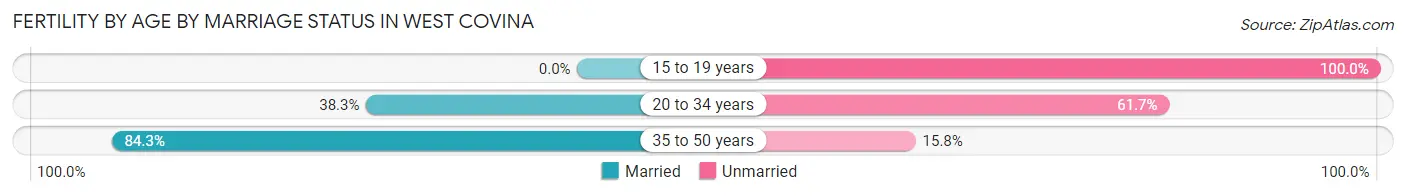
| Age Bracket | Married | Unmarried |
| 15 to 19 years | 0 (0.0%) | 23 (100.0%) |
| 20 to 34 years | 274 (38.3%) | 442 (61.7%) |
| 35 to 50 years | 412 (84.3%) | 77 (15.8%) |
| Total | 686 (55.9%) | 542 (44.1%) |
Fertility by Education in West Covina
Average fertility rate in West Covina is 48.0 births per 1,000 women. Women with the education attainment of college or associate's degree have the highest fertility rate of 55.0 births per 1,000 women, while women with the education attainment of less than high school have the lowest fertility at 33.0 births per 1,000 women. Women with the education attainment of college or associate's degree represent 35.7% of all women with births.
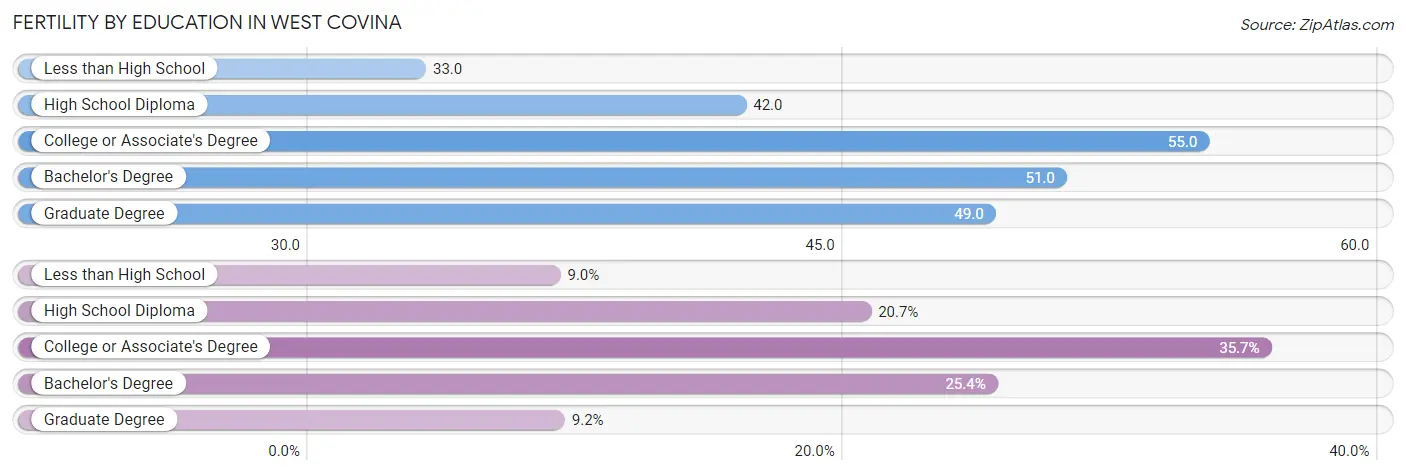
| Educational Attainment | Women with Births | Births / 1,000 Women |
| Less than High School | 111 (9.0%) | 33.0 |
| High School Diploma | 254 (20.7%) | 42.0 |
| College or Associate's Degree | 438 (35.7%) | 55.0 |
| Bachelor's Degree | 312 (25.4%) | 51.0 |
| Graduate Degree | 113 (9.2%) | 49.0 |
| Total | 1,228 (100.0%) | 48.0 |
Fertility by Education by Marriage Status in West Covina
44.1% of women with births in West Covina are unmarried. Women with the educational attainment of graduate degree are most likely to be married with 100.0% of them married at childbirth, while women with the educational attainment of college or associate's degree are least likely to be married with 82.2% of them unmarried at childbirth.
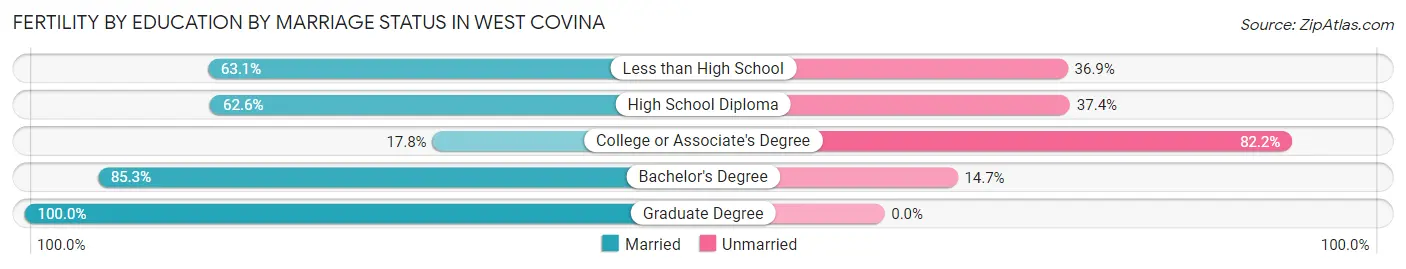
| Educational Attainment | Married | Unmarried |
| Less than High School | 70 (63.1%) | 41 (36.9%) |
| High School Diploma | 159 (62.6%) | 95 (37.4%) |
| College or Associate's Degree | 78 (17.8%) | 360 (82.2%) |
| Bachelor's Degree | 266 (85.3%) | 46 (14.7%) |
| Graduate Degree | 113 (100.0%) | 0 (0.0%) |
| Total | 686 (55.9%) | 542 (44.1%) |
Employment Characteristics in West Covina
Employment by Class of Employer in West Covina
Among the 51,231 employed individuals in West Covina, private company employees (35,020 | 68.4%), local government employees (5,923 | 11.6%), and not-for-profit organizations (3,464 | 6.8%) make up the most common classes of employment.
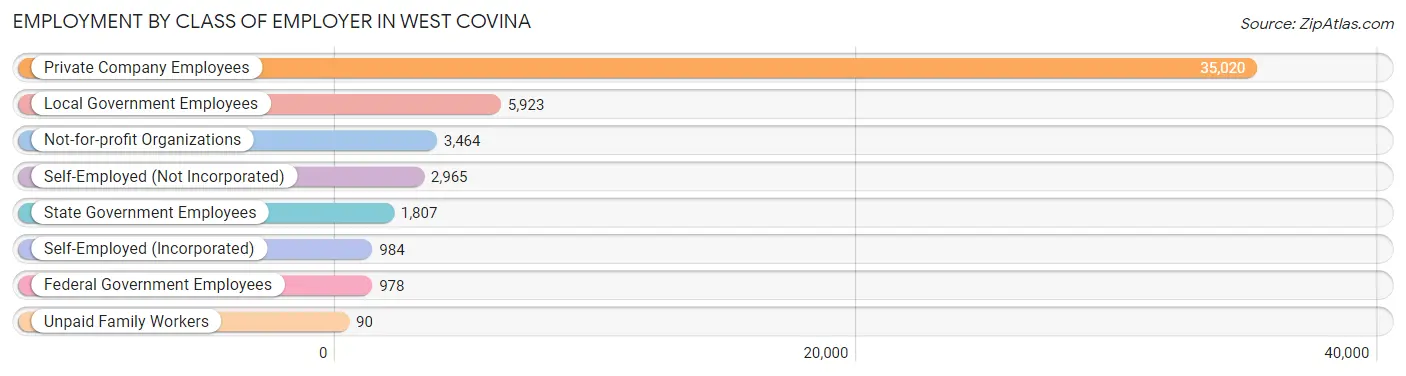
| Employer Class | # Employees | % Employees |
| Private Company Employees | 35,020 | 68.4% |
| Self-Employed (Incorporated) | 984 | 1.9% |
| Self-Employed (Not Incorporated) | 2,965 | 5.8% |
| Not-for-profit Organizations | 3,464 | 6.8% |
| Local Government Employees | 5,923 | 11.6% |
| State Government Employees | 1,807 | 3.5% |
| Federal Government Employees | 978 | 1.9% |
| Unpaid Family Workers | 90 | 0.2% |
| Total | 51,231 | 100.0% |
Employment Status by Age in West Covina
According to the labor force statistics for West Covina, out of the total population over 16 years of age (89,351), 63.5% or 56,738 individuals are in the labor force, with 6.7% or 3,801 of them unemployed. The age group with the highest labor force participation rate is 35 to 44 years, with 85.5% or 11,234 individuals in the labor force. Within the labor force, the 16 to 19 years age range has the highest percentage of unemployed individuals, with 15.0% or 208 of them being unemployed.
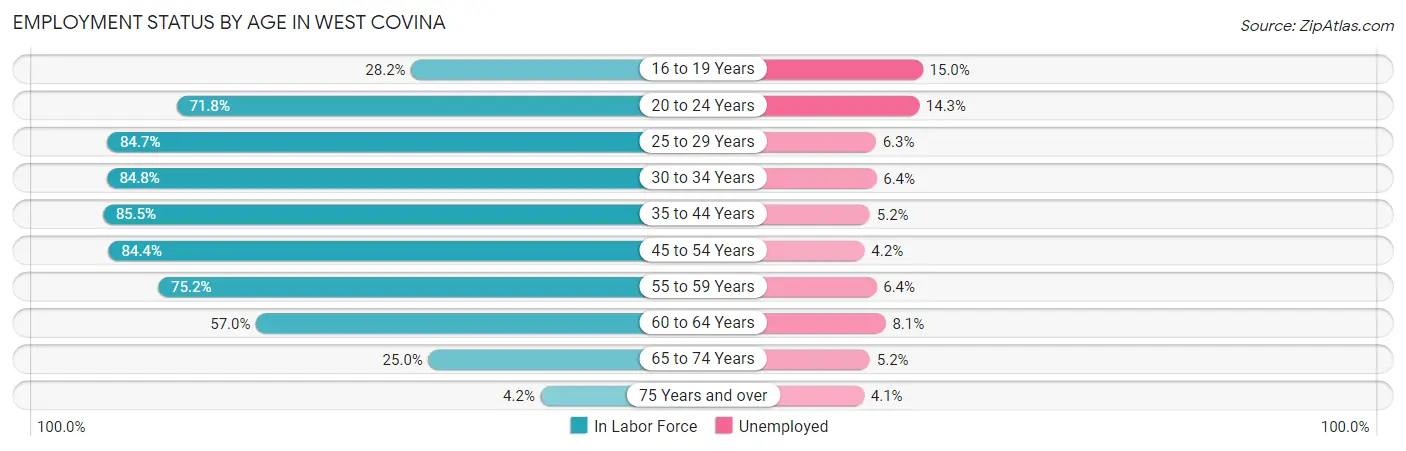
| Age Bracket | In Labor Force | Unemployed |
| 16 to 19 Years | 1,388 (28.2%) | 208 (15.0%) |
| 20 to 24 Years | 5,381 (71.8%) | 769 (14.3%) |
| 25 to 29 Years | 7,123 (84.7%) | 449 (6.3%) |
| 30 to 34 Years | 6,659 (84.8%) | 426 (6.4%) |
| 35 to 44 Years | 11,234 (85.5%) | 584 (5.2%) |
| 45 to 54 Years | 11,945 (84.4%) | 502 (4.2%) |
| 55 to 59 Years | 6,124 (75.2%) | 392 (6.4%) |
| 60 to 64 Years | 4,070 (57.0%) | 330 (8.1%) |
| 65 to 74 Years | 2,495 (25.0%) | 130 (5.2%) |
| 75 Years and over | 341 (4.2%) | 14 (4.1%) |
| Total | 56,738 (63.5%) | 3,801 (6.7%) |
Employment Status by Educational Attainment in West Covina
According to labor force statistics for West Covina, 80.1% of individuals (47,130) out of the total population between 25 and 64 years of age (58,839) are in the labor force, with 5.7% or 2,686 of them being unemployed. The group with the highest labor force participation rate are those with the educational attainment of bachelor's degree or higher, with 86.6% or 15,895 individuals in the labor force. Within the labor force, individuals with less than high school education have the highest percentage of unemployment, with 7.7% or 287 of them being unemployed.
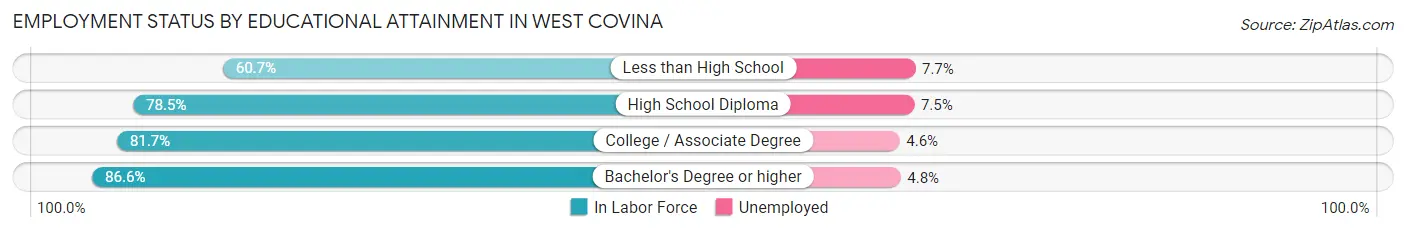
| Educational Attainment | In Labor Force | Unemployed |
| Less than High School | 3,722 (60.7%) | 472 (7.7%) |
| High School Diploma | 12,722 (78.5%) | 1,216 (7.5%) |
| College / Associate Degree | 14,825 (81.7%) | 835 (4.6%) |
| Bachelor's Degree or higher | 15,895 (86.6%) | 881 (4.8%) |
| Total | 47,130 (80.1%) | 3,354 (5.7%) |
Employment Occupations by Sex in West Covina
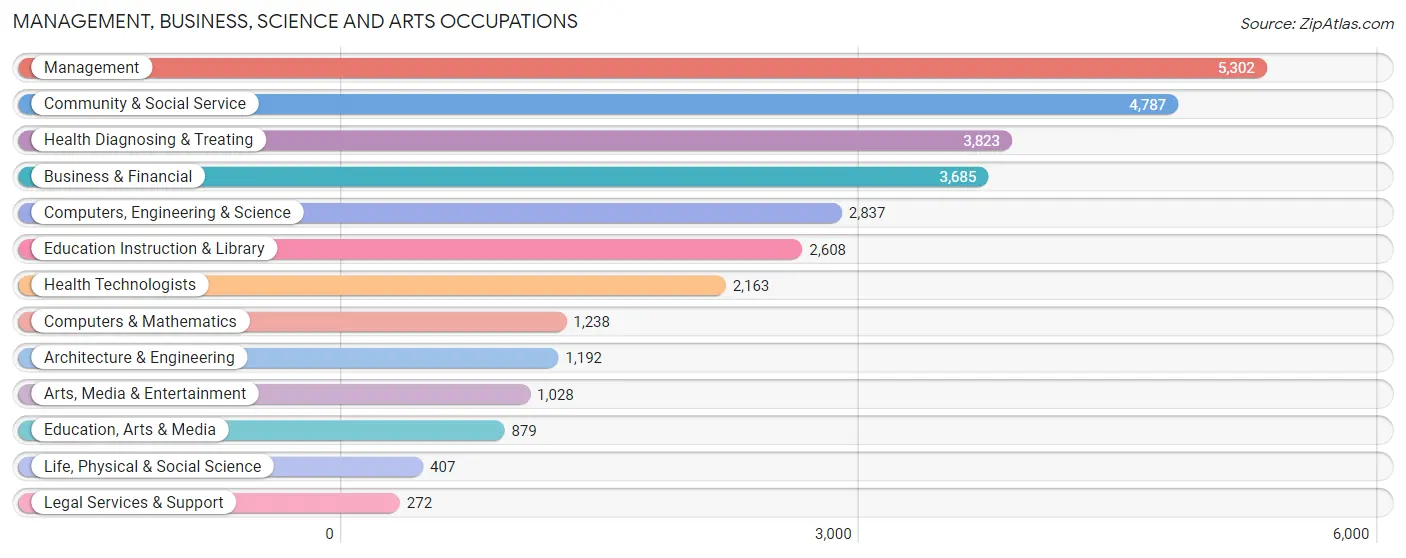
Management, Business, Science and Arts Occupations
The most common Management, Business, Science and Arts occupations in West Covina are Management (5,302 | 10.0%), Community & Social Service (4,787 | 9.0%), Health Diagnosing & Treating (3,823 | 7.2%), Business & Financial (3,685 | 7.0%), and Computers, Engineering & Science (2,837 | 5.4%).
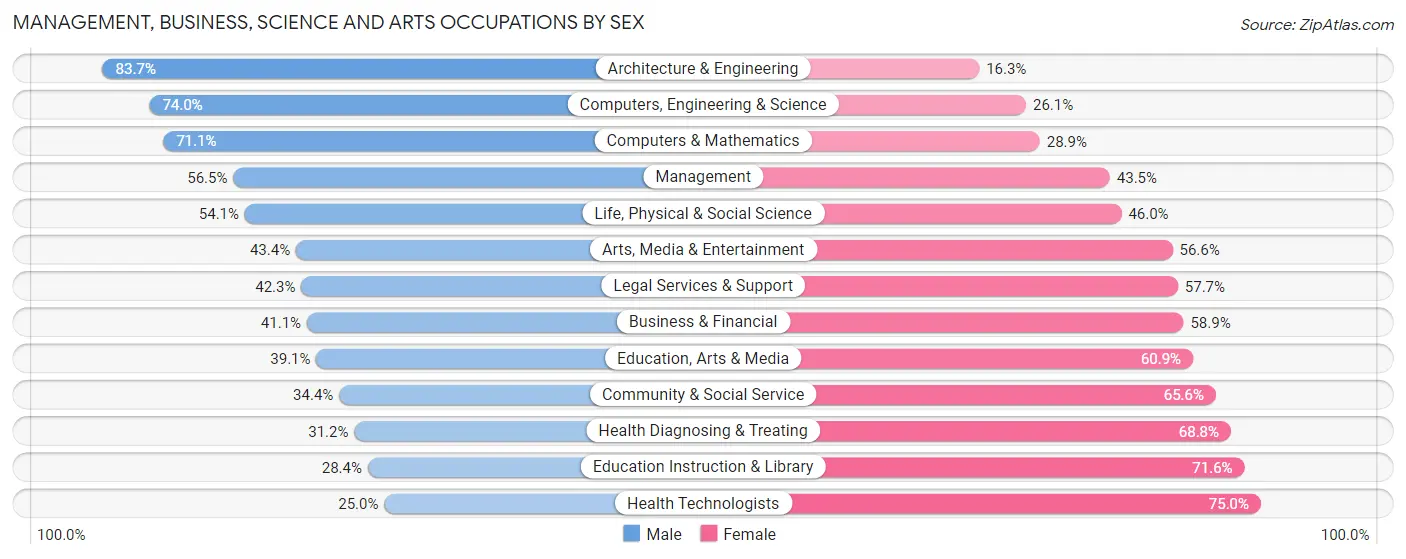
Management, Business, Science and Arts Occupations by Sex
Within the Management, Business, Science and Arts occupations in West Covina, the most male-oriented occupations are Architecture & Engineering (83.7%), Computers, Engineering & Science (74.0%), and Computers & Mathematics (71.1%), while the most female-oriented occupations are Health Technologists (75.0%), Education Instruction & Library (71.6%), and Health Diagnosing & Treating (68.8%).
| Occupation | Male | Female |
| Management | 2,994 (56.5%) | 2,308 (43.5%) |
| Business & Financial | 1,515 (41.1%) | 2,170 (58.9%) |
| Computers, Engineering & Science | 2,098 (74.0%) | 739 (26.1%) |
| Computers & Mathematics | 880 (71.1%) | 358 (28.9%) |
| Architecture & Engineering | 998 (83.7%) | 194 (16.3%) |
| Life, Physical & Social Science | 220 (54.0%) | 187 (46.0%) |
| Community & Social Service | 1,646 (34.4%) | 3,141 (65.6%) |
| Education, Arts & Media | 344 (39.1%) | 535 (60.9%) |
| Legal Services & Support | 115 (42.3%) | 157 (57.7%) |
| Education Instruction & Library | 741 (28.4%) | 1,867 (71.6%) |
| Arts, Media & Entertainment | 446 (43.4%) | 582 (56.6%) |
| Health Diagnosing & Treating | 1,194 (31.2%) | 2,629 (68.8%) |
| Health Technologists | 540 (25.0%) | 1,623 (75.0%) |
| Total (Category) | 9,447 (46.2%) | 10,987 (53.8%) |
| Total (Overall) | 26,934 (50.9%) | 25,966 (49.1%) |
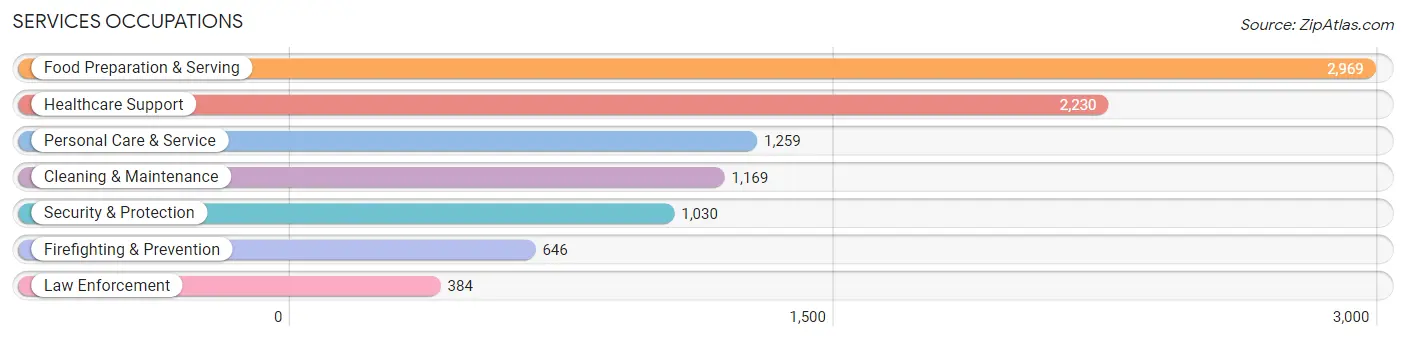
Services Occupations
The most common Services occupations in West Covina are Food Preparation & Serving (2,969 | 5.6%), Healthcare Support (2,230 | 4.2%), Personal Care & Service (1,259 | 2.4%), Cleaning & Maintenance (1,169 | 2.2%), and Security & Protection (1,030 | 1.9%).
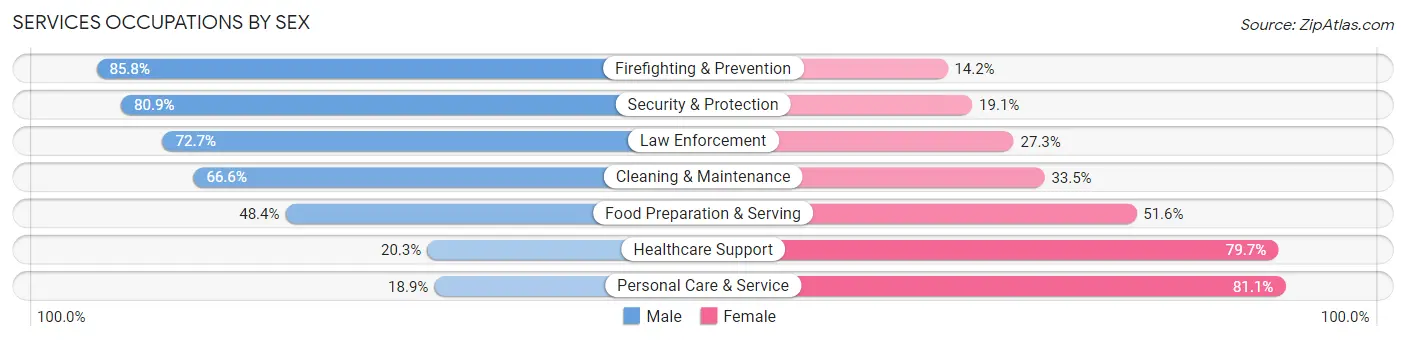
Services Occupations by Sex
Within the Services occupations in West Covina, the most male-oriented occupations are Firefighting & Prevention (85.8%), Security & Protection (80.9%), and Law Enforcement (72.7%), while the most female-oriented occupations are Personal Care & Service (81.1%), Healthcare Support (79.7%), and Food Preparation & Serving (51.6%).
| Occupation | Male | Female |
| Healthcare Support | 453 (20.3%) | 1,777 (79.7%) |
| Security & Protection | 833 (80.9%) | 197 (19.1%) |
| Firefighting & Prevention | 554 (85.8%) | 92 (14.2%) |
| Law Enforcement | 279 (72.7%) | 105 (27.3%) |
| Food Preparation & Serving | 1,436 (48.4%) | 1,533 (51.6%) |
| Cleaning & Maintenance | 778 (66.5%) | 391 (33.5%) |
| Personal Care & Service | 238 (18.9%) | 1,021 (81.1%) |
| Total (Category) | 3,738 (43.2%) | 4,919 (56.8%) |
| Total (Overall) | 26,934 (50.9%) | 25,966 (49.1%) |
Sales and Office Occupations
The most common Sales and Office occupations in West Covina are Office & Administration (7,377 | 14.0%), and Sales & Related (5,455 | 10.3%).
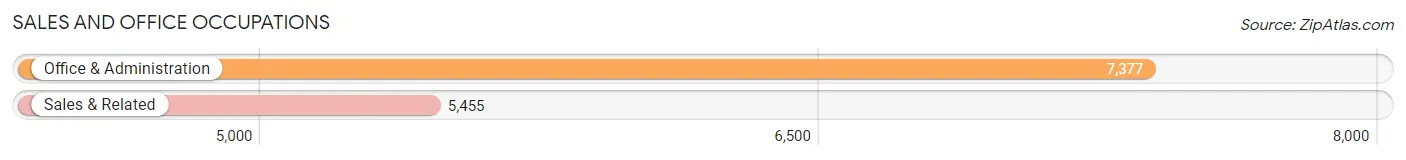
Sales and Office Occupations by Sex
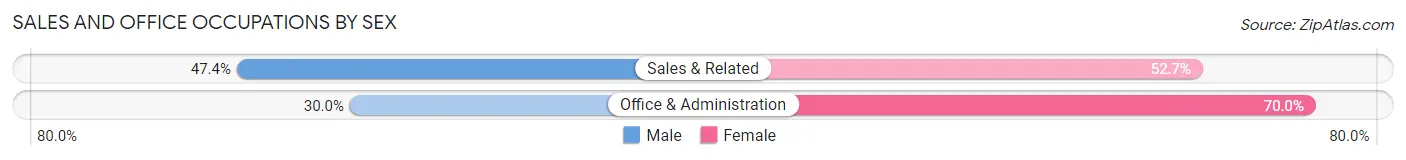
| Occupation | Male | Female |
| Sales & Related | 2,583 (47.3%) | 2,872 (52.6%) |
| Office & Administration | 2,211 (30.0%) | 5,166 (70.0%) |
| Total (Category) | 4,794 (37.4%) | 8,038 (62.6%) |
| Total (Overall) | 26,934 (50.9%) | 25,966 (49.1%) |
Natural Resources, Construction and Maintenance Occupations
The most common Natural Resources, Construction and Maintenance occupations in West Covina are Construction & Extraction (2,388 | 4.5%), Installation, Maintenance & Repair (1,424 | 2.7%), and Farming, Fishing & Forestry (172 | 0.3%).
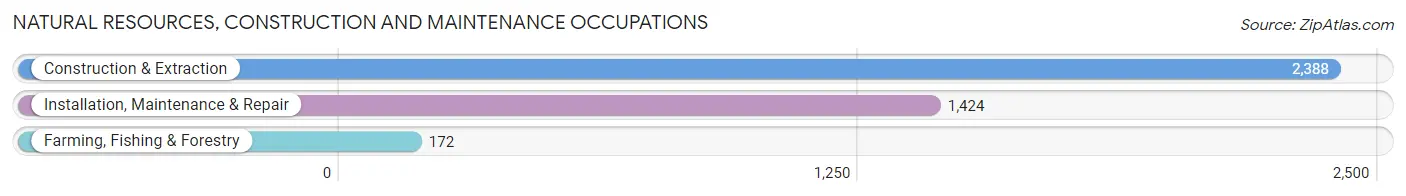
Natural Resources, Construction and Maintenance Occupations by Sex
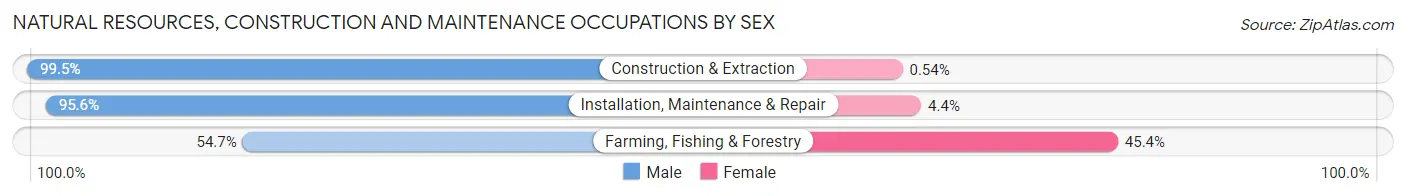
| Occupation | Male | Female |
| Farming, Fishing & Forestry | 94 (54.6%) | 78 (45.4%) |
| Construction & Extraction | 2,375 (99.5%) | 13 (0.5%) |
| Installation, Maintenance & Repair | 1,361 (95.6%) | 63 (4.4%) |
| Total (Category) | 3,830 (96.1%) | 154 (3.9%) |
| Total (Overall) | 26,934 (50.9%) | 25,966 (49.1%) |
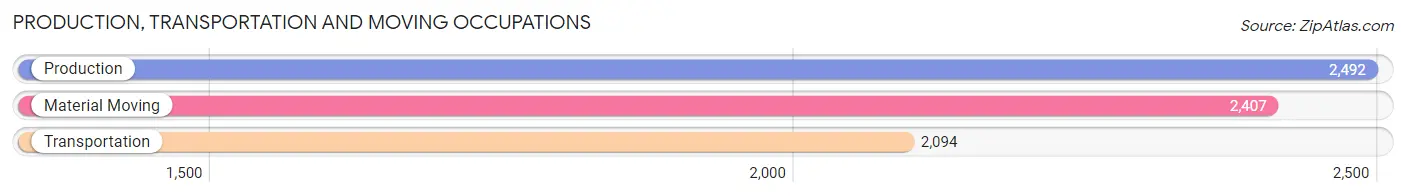
Production, Transportation and Moving Occupations
The most common Production, Transportation and Moving occupations in West Covina are Production (2,492 | 4.7%), Material Moving (2,407 | 4.5%), and Transportation (2,094 | 4.0%).
Production, Transportation and Moving Occupations by Sex
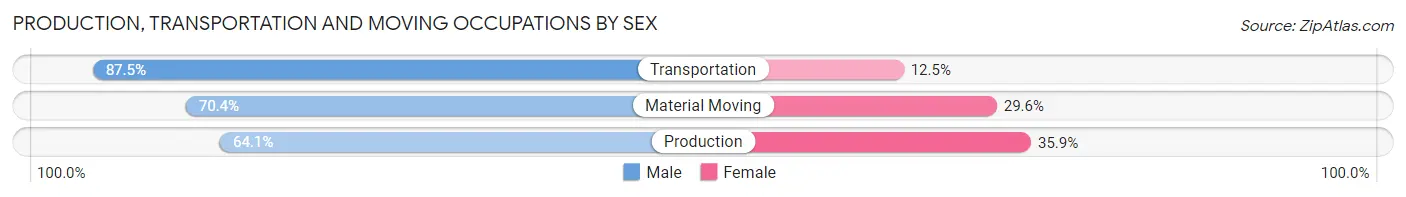
| Occupation | Male | Female |
| Production | 1,598 (64.1%) | 894 (35.9%) |
| Transportation | 1,832 (87.5%) | 262 (12.5%) |
| Material Moving | 1,695 (70.4%) | 712 (29.6%) |
| Total (Category) | 5,125 (73.3%) | 1,868 (26.7%) |
| Total (Overall) | 26,934 (50.9%) | 25,966 (49.1%) |
Employment Industries by Sex in West Covina
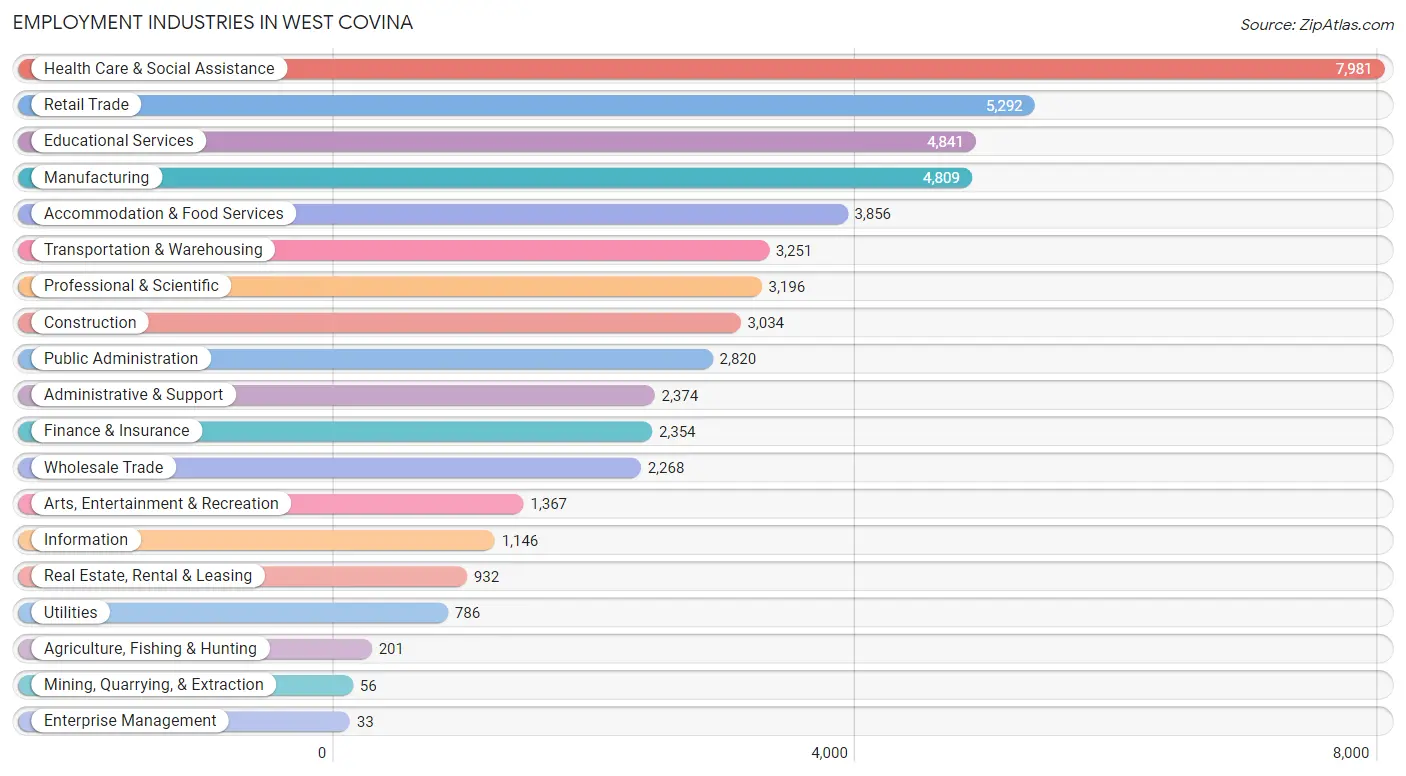
Employment Industries in West Covina
The major employment industries in West Covina include Health Care & Social Assistance (7,981 | 15.1%), Retail Trade (5,292 | 10.0%), Educational Services (4,841 | 9.1%), Manufacturing (4,809 | 9.1%), and Accommodation & Food Services (3,856 | 7.3%).
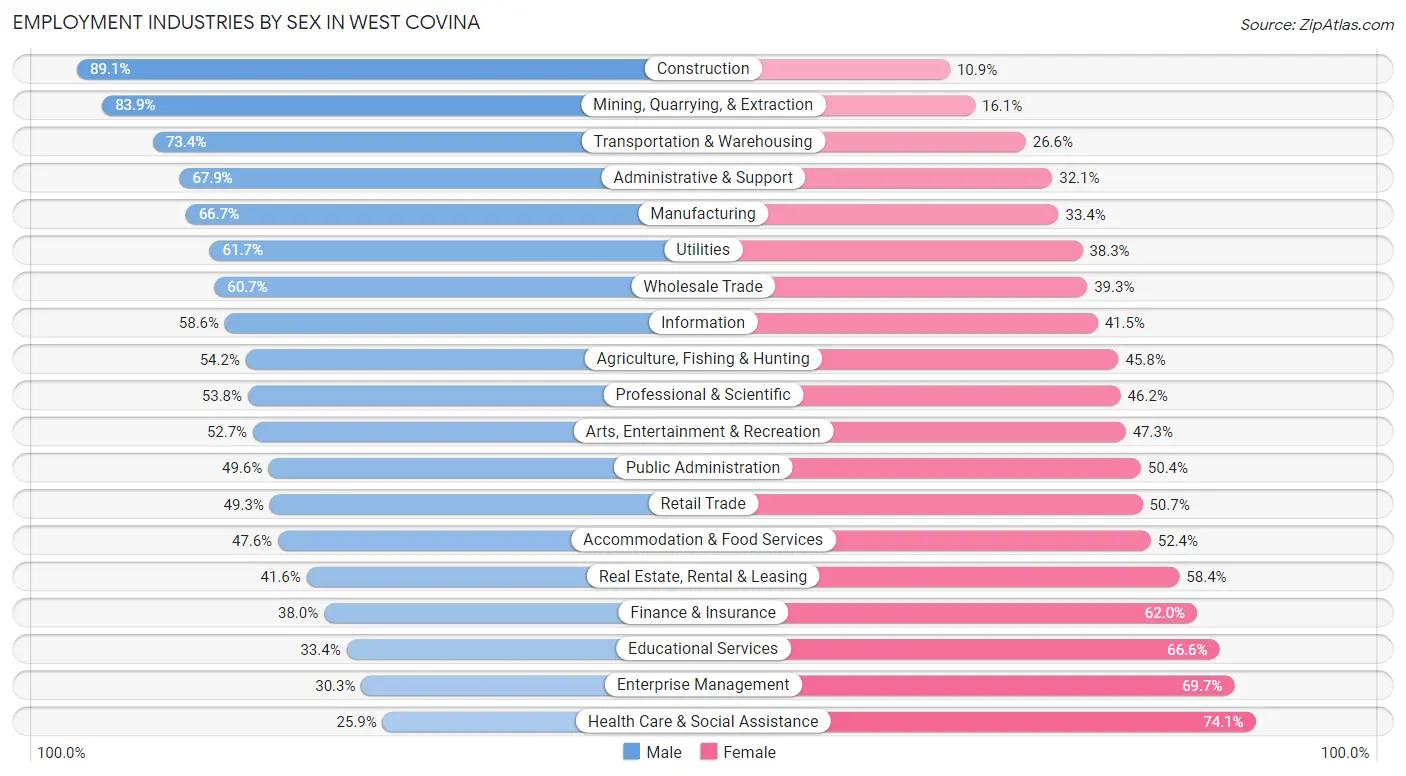
Employment Industries by Sex in West Covina
The West Covina industries that see more men than women are Construction (89.1%), Mining, Quarrying, & Extraction (83.9%), and Transportation & Warehousing (73.4%), whereas the industries that tend to have a higher number of women are Health Care & Social Assistance (74.1%), Enterprise Management (69.7%), and Educational Services (66.6%).
| Industry | Male | Female |
| Agriculture, Fishing & Hunting | 109 (54.2%) | 92 (45.8%) |
| Mining, Quarrying, & Extraction | 47 (83.9%) | 9 (16.1%) |
| Construction | 2,704 (89.1%) | 330 (10.9%) |
| Manufacturing | 3,205 (66.6%) | 1,604 (33.4%) |
| Wholesale Trade | 1,377 (60.7%) | 891 (39.3%) |
| Retail Trade | 2,608 (49.3%) | 2,684 (50.7%) |
| Transportation & Warehousing | 2,387 (73.4%) | 864 (26.6%) |
| Utilities | 485 (61.7%) | 301 (38.3%) |
| Information | 671 (58.6%) | 475 (41.4%) |
| Finance & Insurance | 895 (38.0%) | 1,459 (62.0%) |
| Real Estate, Rental & Leasing | 388 (41.6%) | 544 (58.4%) |
| Professional & Scientific | 1,719 (53.8%) | 1,477 (46.2%) |
| Enterprise Management | 10 (30.3%) | 23 (69.7%) |
| Administrative & Support | 1,613 (67.9%) | 761 (32.1%) |
| Educational Services | 1,616 (33.4%) | 3,225 (66.6%) |
| Health Care & Social Assistance | 2,067 (25.9%) | 5,914 (74.1%) |
| Arts, Entertainment & Recreation | 721 (52.7%) | 646 (47.3%) |
| Accommodation & Food Services | 1,834 (47.6%) | 2,022 (52.4%) |
| Public Administration | 1,399 (49.6%) | 1,421 (50.4%) |
| Total | 26,934 (50.9%) | 25,966 (49.1%) |
Education in West Covina
School Enrollment in West Covina
The most common levels of schooling among the 26,327 students in West Covina are college / undergraduate (7,286 | 27.7%), middle school (5,106 | 19.4%), and high school (5,029 | 19.1%).
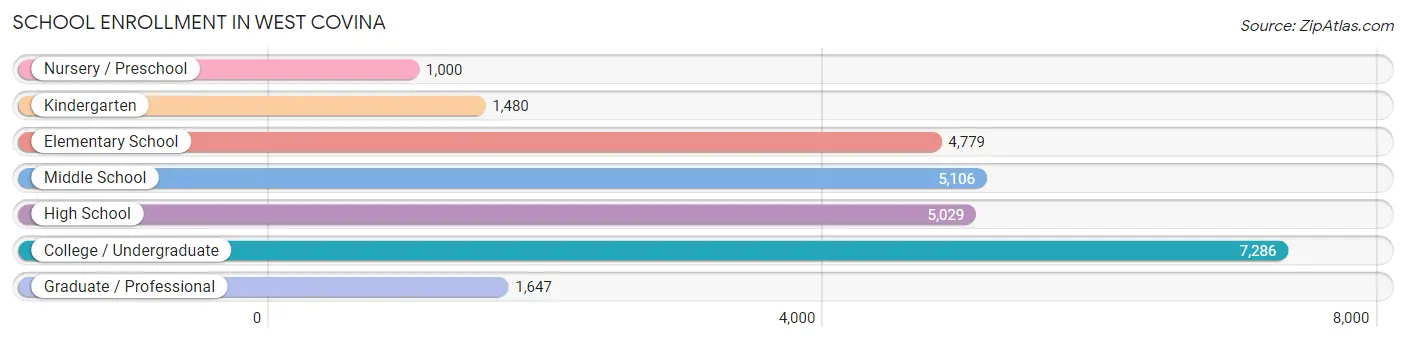
| School Level | # Students | % Students |
| Nursery / Preschool | 1,000 | 3.8% |
| Kindergarten | 1,480 | 5.6% |
| Elementary School | 4,779 | 18.1% |
| Middle School | 5,106 | 19.4% |
| High School | 5,029 | 19.1% |
| College / Undergraduate | 7,286 | 27.7% |
| Graduate / Professional | 1,647 | 6.3% |
| Total | 26,327 | 100.0% |
School Enrollment by Age by Funding Source in West Covina
Out of a total of 26,327 students who are enrolled in schools in West Covina, 3,580 (13.6%) attend a private institution, while the remaining 22,747 (86.4%) are enrolled in public schools. The age group of 3 to 4 year olds has the highest likelihood of being enrolled in private schools, with 290 (31.2% in the age bracket) enrolled. Conversely, the age group of 18 to 19 year olds has the lowest likelihood of being enrolled in a private school, with 1,882 (96.8% in the age bracket) attending a public institution.
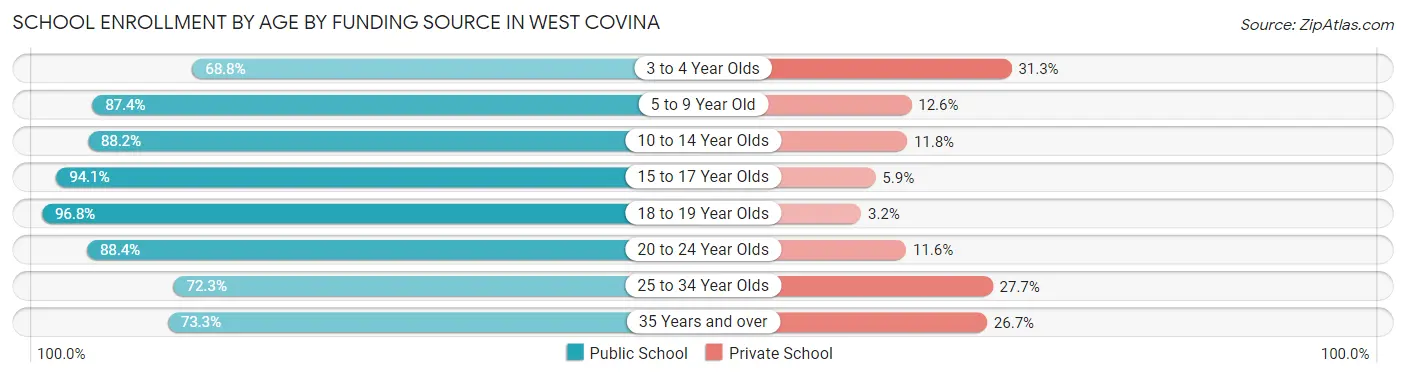
| Age Bracket | Public School | Private School |
| 3 to 4 Year Olds | 638 (68.8%) | 290 (31.2%) |
| 5 to 9 Year Old | 5,176 (87.4%) | 746 (12.6%) |
| 10 to 14 Year Olds | 5,598 (88.2%) | 748 (11.8%) |
| 15 to 17 Year Olds | 3,361 (94.1%) | 211 (5.9%) |
| 18 to 19 Year Olds | 1,882 (96.8%) | 63 (3.2%) |
| 20 to 24 Year Olds | 3,155 (88.4%) | 415 (11.6%) |
| 25 to 34 Year Olds | 1,839 (72.3%) | 706 (27.7%) |
| 35 Years and over | 1,099 (73.3%) | 400 (26.7%) |
| Total | 22,747 (86.4%) | 3,580 (13.6%) |
Educational Attainment by Field of Study in West Covina
Business (6,147 | 25.6%), science & technology (2,815 | 11.7%), engineering (2,166 | 9.0%), social sciences (2,045 | 8.5%), and education (1,518 | 6.3%) are the most common fields of study among 24,052 individuals in West Covina who have obtained a bachelor's degree or higher.
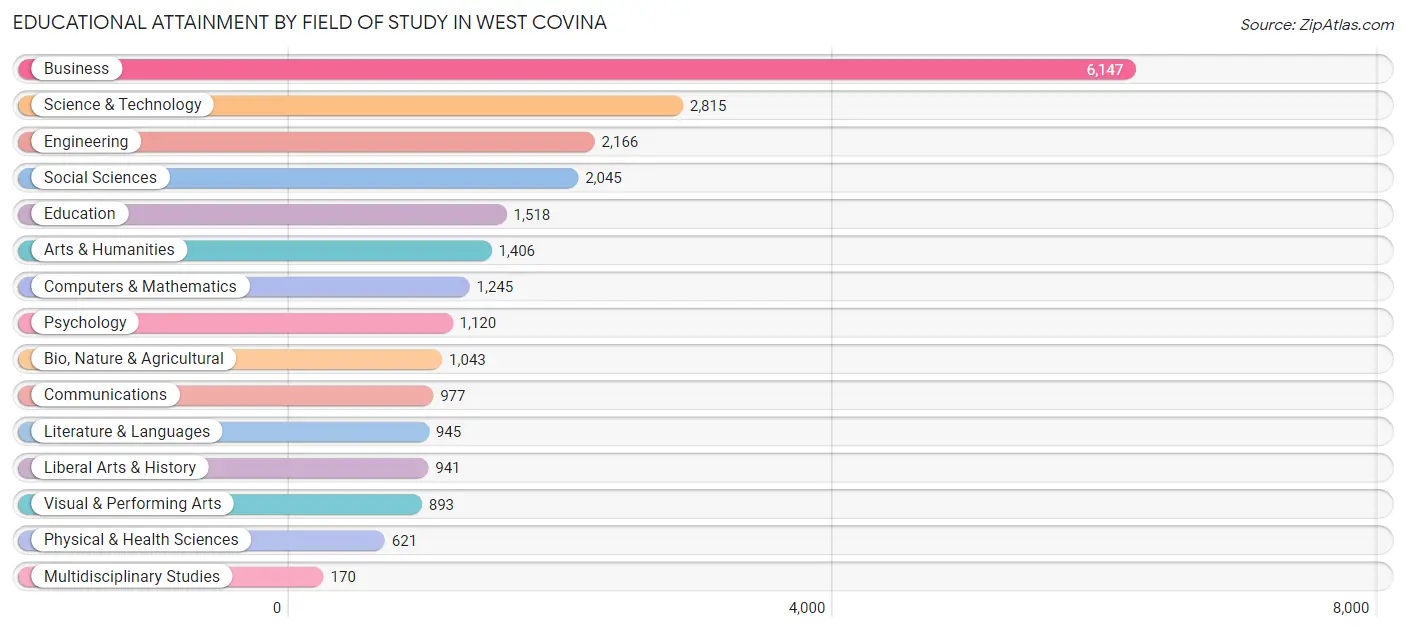
| Field of Study | # Graduates | % Graduates |
| Computers & Mathematics | 1,245 | 5.2% |
| Bio, Nature & Agricultural | 1,043 | 4.3% |
| Physical & Health Sciences | 621 | 2.6% |
| Psychology | 1,120 | 4.7% |
| Social Sciences | 2,045 | 8.5% |
| Engineering | 2,166 | 9.0% |
| Multidisciplinary Studies | 170 | 0.7% |
| Science & Technology | 2,815 | 11.7% |
| Business | 6,147 | 25.6% |
| Education | 1,518 | 6.3% |
| Literature & Languages | 945 | 3.9% |
| Liberal Arts & History | 941 | 3.9% |
| Visual & Performing Arts | 893 | 3.7% |
| Communications | 977 | 4.1% |
| Arts & Humanities | 1,406 | 5.9% |
| Total | 24,052 | 100.0% |
Transportation & Commute in West Covina
Vehicle Availability by Sex in West Covina
The most prevalent vehicle ownership categories in West Covina are males with 2 vehicles (8,113, accounting for 31.0%) and females with 2 vehicles (7,654, making up 32.5%).
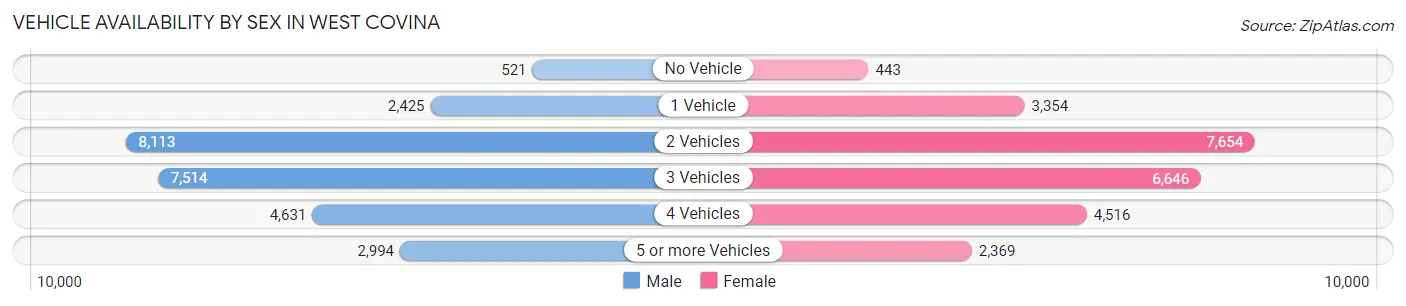
| Vehicles Available | Male | Female |
| No Vehicle | 521 (2.0%) | 443 (1.8%) |
| 1 Vehicle | 2,425 (9.3%) | 3,354 (13.4%) |
| 2 Vehicles | 8,113 (31.0%) | 7,654 (30.6%) |
| 3 Vehicles | 7,514 (28.7%) | 6,646 (26.6%) |
| 4 Vehicles | 4,631 (17.7%) | 4,516 (18.1%) |
| 5 or more Vehicles | 2,994 (11.4%) | 2,369 (9.5%) |
| Total | 26,198 (100.0%) | 24,982 (100.0%) |
Commute Time in West Covina
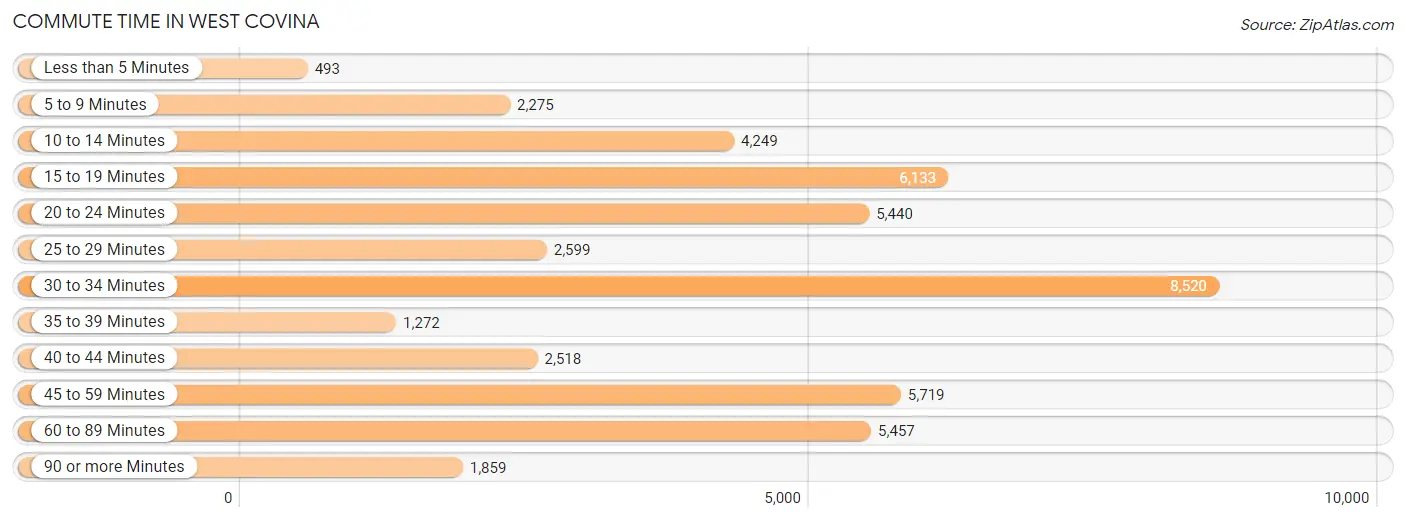
The most frequently occuring commute durations in West Covina are 30 to 34 minutes (8,520 commuters, 18.3%), 15 to 19 minutes (6,133 commuters, 13.2%), and 45 to 59 minutes (5,719 commuters, 12.3%).
| Commute Time | # Commuters | % Commuters |
| Less than 5 Minutes | 493 | 1.1% |
| 5 to 9 Minutes | 2,275 | 4.9% |
| 10 to 14 Minutes | 4,249 | 9.1% |
| 15 to 19 Minutes | 6,133 | 13.2% |
| 20 to 24 Minutes | 5,440 | 11.7% |
| 25 to 29 Minutes | 2,599 | 5.6% |
| 30 to 34 Minutes | 8,520 | 18.3% |
| 35 to 39 Minutes | 1,272 | 2.7% |
| 40 to 44 Minutes | 2,518 | 5.4% |
| 45 to 59 Minutes | 5,719 | 12.3% |
| 60 to 89 Minutes | 5,457 | 11.7% |
| 90 or more Minutes | 1,859 | 4.0% |
Commute Time by Sex in West Covina
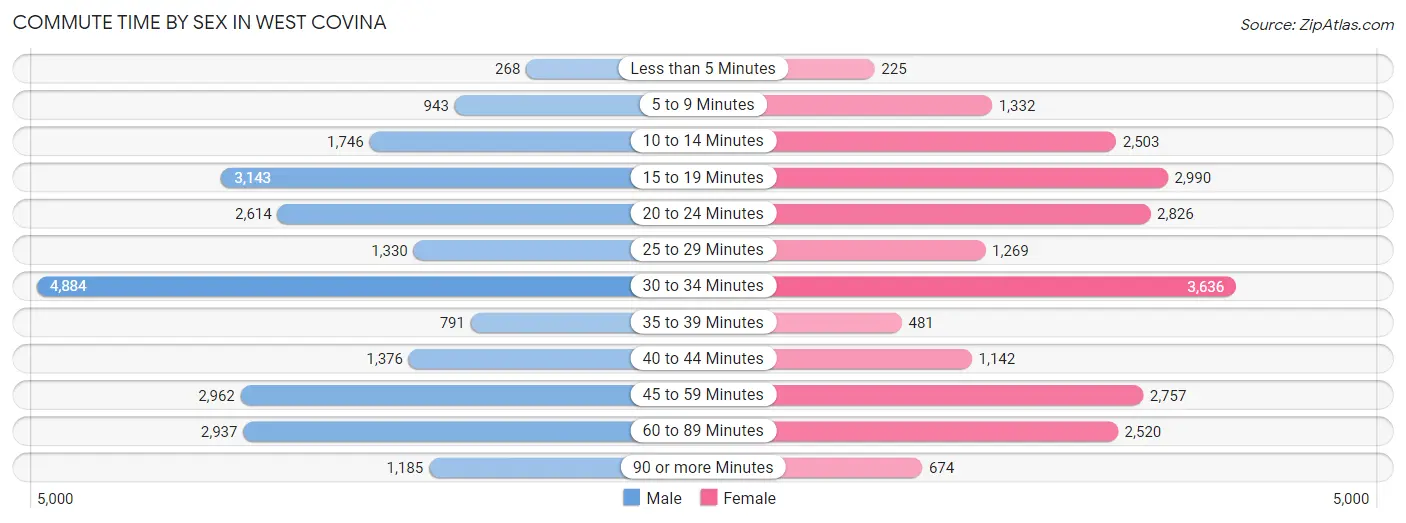
The most common commute times in West Covina are 30 to 34 minutes (4,884 commuters, 20.2%) for males and 30 to 34 minutes (3,636 commuters, 16.3%) for females.
| Commute Time | Male | Female |
| Less than 5 Minutes | 268 (1.1%) | 225 (1.0%) |
| 5 to 9 Minutes | 943 (3.9%) | 1,332 (6.0%) |
| 10 to 14 Minutes | 1,746 (7.2%) | 2,503 (11.2%) |
| 15 to 19 Minutes | 3,143 (13.0%) | 2,990 (13.4%) |
| 20 to 24 Minutes | 2,614 (10.8%) | 2,826 (12.6%) |
| 25 to 29 Minutes | 1,330 (5.5%) | 1,269 (5.7%) |
| 30 to 34 Minutes | 4,884 (20.2%) | 3,636 (16.3%) |
| 35 to 39 Minutes | 791 (3.3%) | 481 (2.1%) |
| 40 to 44 Minutes | 1,376 (5.7%) | 1,142 (5.1%) |
| 45 to 59 Minutes | 2,962 (12.2%) | 2,757 (12.3%) |
| 60 to 89 Minutes | 2,937 (12.1%) | 2,520 (11.3%) |
| 90 or more Minutes | 1,185 (4.9%) | 674 (3.0%) |
Time of Departure to Work by Sex in West Covina
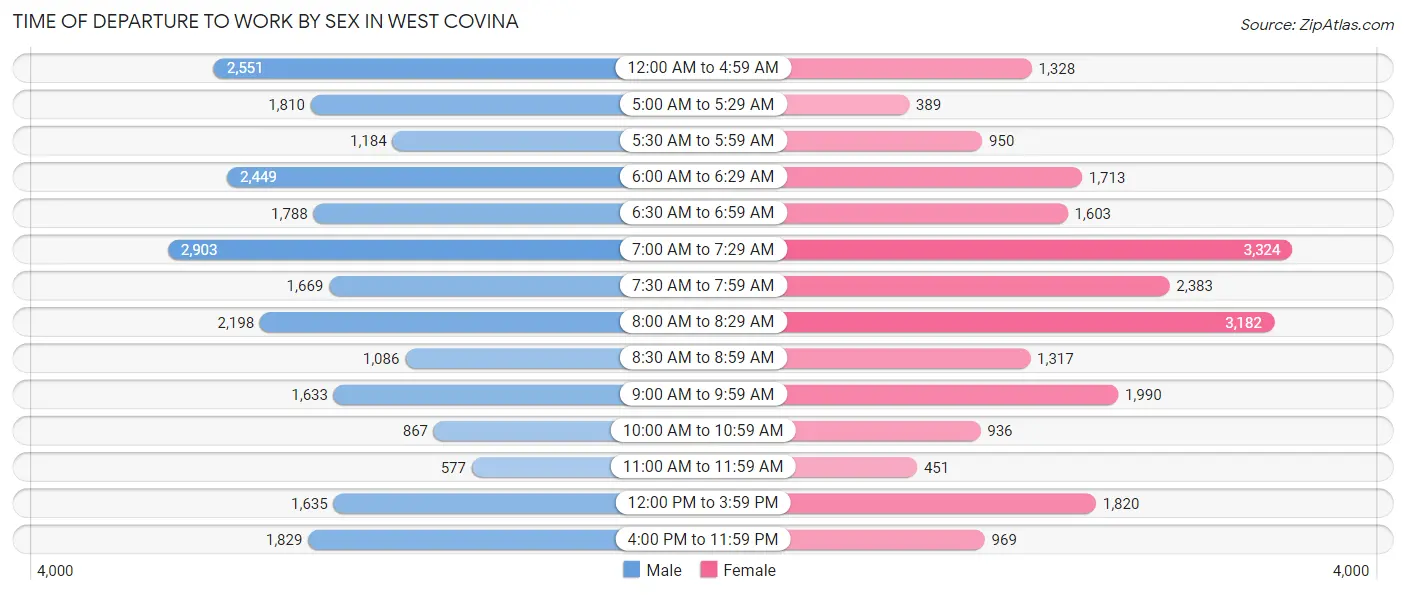
The most frequent times of departure to work in West Covina are 7:00 AM to 7:29 AM (2,903, 12.0%) for males and 7:00 AM to 7:29 AM (3,324, 14.9%) for females.
| Time of Departure | Male | Female |
| 12:00 AM to 4:59 AM | 2,551 (10.5%) | 1,328 (5.9%) |
| 5:00 AM to 5:29 AM | 1,810 (7.5%) | 389 (1.7%) |
| 5:30 AM to 5:59 AM | 1,184 (4.9%) | 950 (4.3%) |
| 6:00 AM to 6:29 AM | 2,449 (10.1%) | 1,713 (7.7%) |
| 6:30 AM to 6:59 AM | 1,788 (7.4%) | 1,603 (7.2%) |
| 7:00 AM to 7:29 AM | 2,903 (12.0%) | 3,324 (14.9%) |
| 7:30 AM to 7:59 AM | 1,669 (6.9%) | 2,383 (10.7%) |
| 8:00 AM to 8:29 AM | 2,198 (9.1%) | 3,182 (14.2%) |
| 8:30 AM to 8:59 AM | 1,086 (4.5%) | 1,317 (5.9%) |
| 9:00 AM to 9:59 AM | 1,633 (6.8%) | 1,990 (8.9%) |
| 10:00 AM to 10:59 AM | 867 (3.6%) | 936 (4.2%) |
| 11:00 AM to 11:59 AM | 577 (2.4%) | 451 (2.0%) |
| 12:00 PM to 3:59 PM | 1,635 (6.8%) | 1,820 (8.1%) |
| 4:00 PM to 11:59 PM | 1,829 (7.6%) | 969 (4.3%) |
| Total | 24,179 (100.0%) | 22,355 (100.0%) |
Housing Occupancy in West Covina
Occupancy by Ownership in West Covina
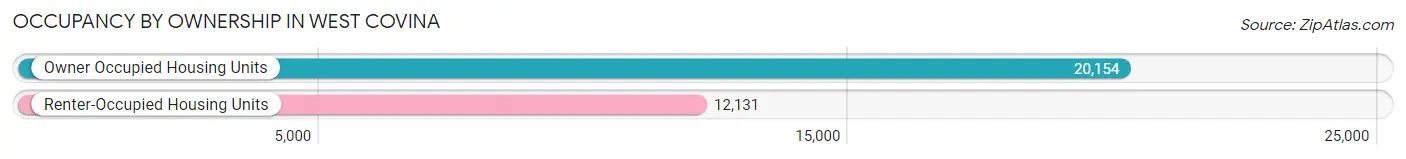
Of the total 32,285 dwellings in West Covina, owner-occupied units account for 20,154 (62.4%), while renter-occupied units make up 12,131 (37.6%).
| Occupancy | # Housing Units | % Housing Units |
| Owner Occupied Housing Units | 20,154 | 62.4% |
| Renter-Occupied Housing Units | 12,131 | 37.6% |
| Total Occupied Housing Units | 32,285 | 100.0% |
Occupancy by Household Size in West Covina
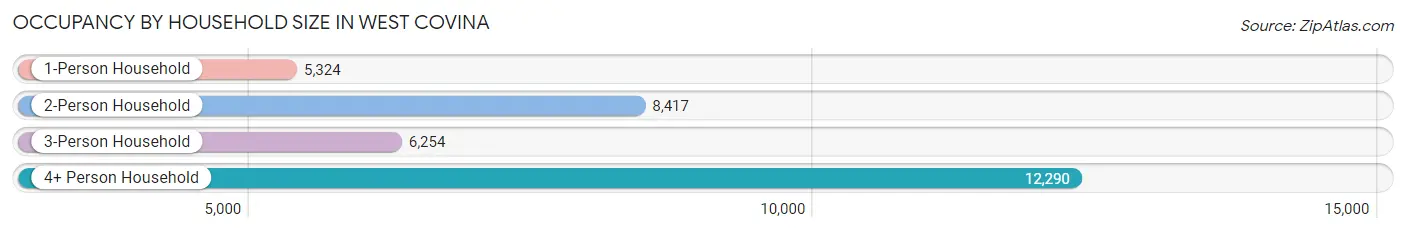
| Household Size | # Housing Units | % Housing Units |
| 1-Person Household | 5,324 | 16.5% |
| 2-Person Household | 8,417 | 26.1% |
| 3-Person Household | 6,254 | 19.4% |
| 4+ Person Household | 12,290 | 38.1% |
| Total Housing Units | 32,285 | 100.0% |
Occupancy by Ownership by Household Size in West Covina
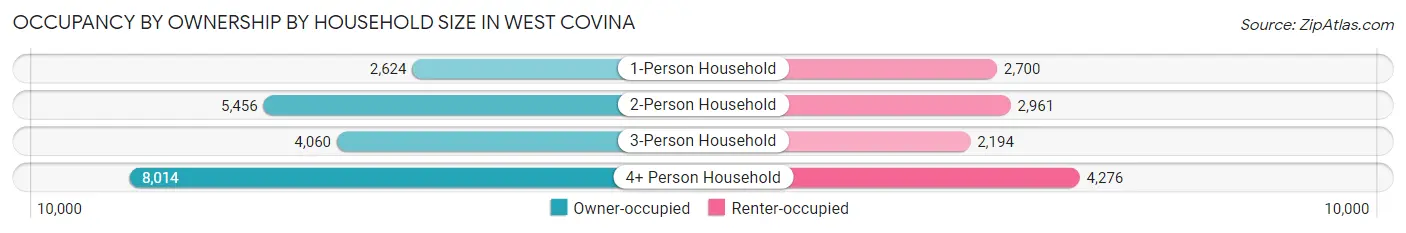
| Household Size | Owner-occupied | Renter-occupied |
| 1-Person Household | 2,624 (49.3%) | 2,700 (50.7%) |
| 2-Person Household | 5,456 (64.8%) | 2,961 (35.2%) |
| 3-Person Household | 4,060 (64.9%) | 2,194 (35.1%) |
| 4+ Person Household | 8,014 (65.2%) | 4,276 (34.8%) |
| Total Housing Units | 20,154 (62.4%) | 12,131 (37.6%) |
Occupancy by Educational Attainment in West Covina
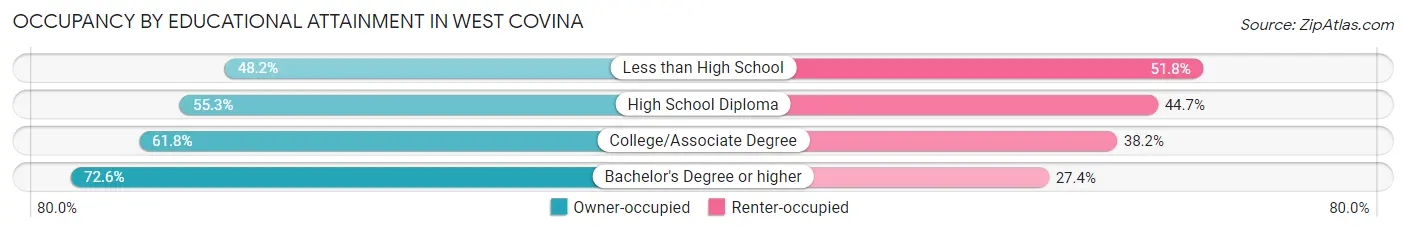
| Household Size | Owner-occupied | Renter-occupied |
| Less than High School | 1,741 (48.2%) | 1,868 (51.8%) |
| High School Diploma | 4,133 (55.3%) | 3,335 (44.7%) |
| College/Associate Degree | 6,430 (61.8%) | 3,970 (38.2%) |
| Bachelor's Degree or higher | 7,850 (72.6%) | 2,958 (27.4%) |
Occupancy by Age of Householder in West Covina
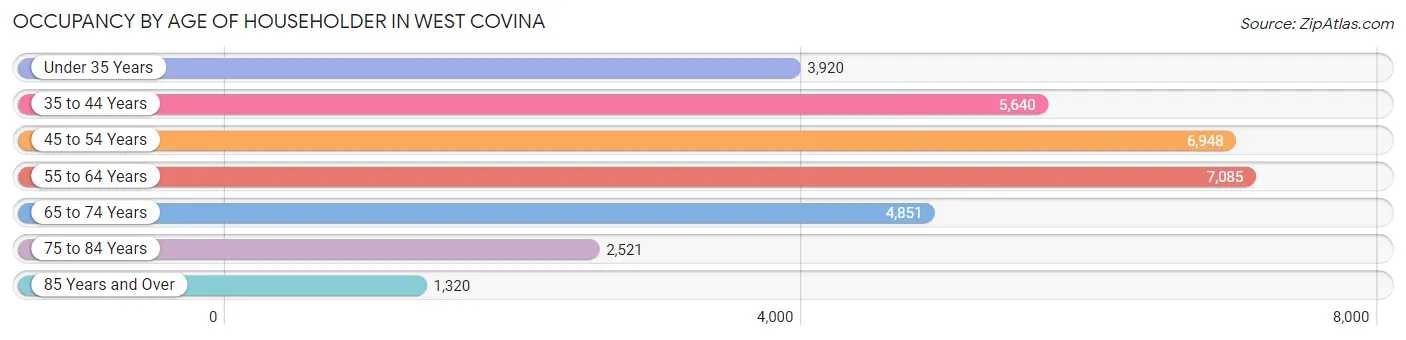
| Age Bracket | # Households | % Households |
| Under 35 Years | 3,920 | 12.1% |
| 35 to 44 Years | 5,640 | 17.5% |
| 45 to 54 Years | 6,948 | 21.5% |
| 55 to 64 Years | 7,085 | 22.0% |
| 65 to 74 Years | 4,851 | 15.0% |
| 75 to 84 Years | 2,521 | 7.8% |
| 85 Years and Over | 1,320 | 4.1% |
| Total | 32,285 | 100.0% |
Housing Finances in West Covina
Median Income by Occupancy in West Covina
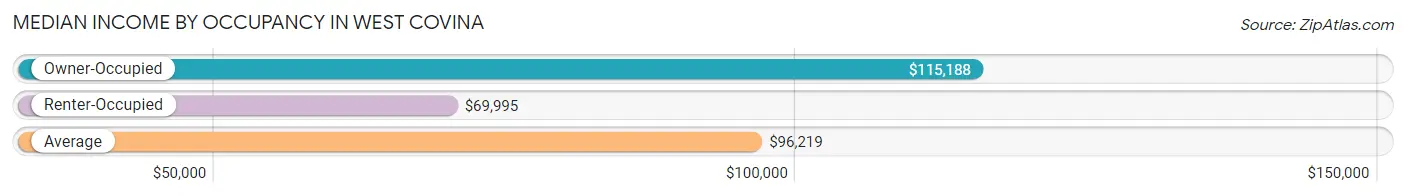
| Occupancy Type | # Households | Median Income |
| Owner-Occupied | 20,154 (62.4%) | $115,188 |
| Renter-Occupied | 12,131 (37.6%) | $69,995 |
| Average | 32,285 (100.0%) | $96,219 |
Occupancy by Householder Income Bracket in West Covina
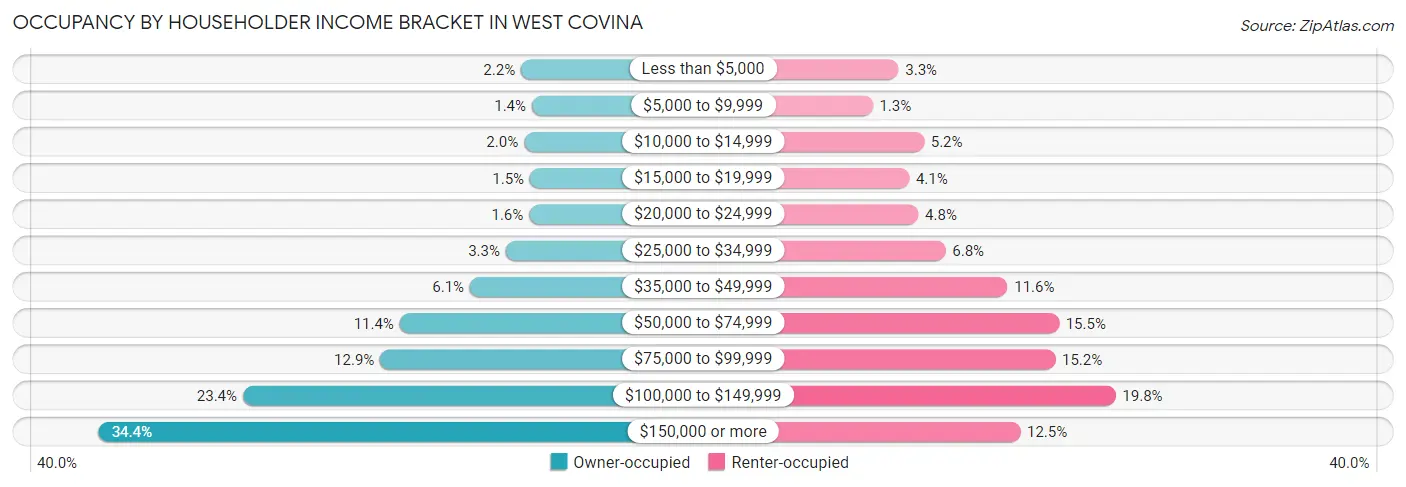
| Income Bracket | Owner-occupied | Renter-occupied |
| Less than $5,000 | 440 (2.2%) | 395 (3.3%) |
| $5,000 to $9,999 | 273 (1.3%) | 156 (1.3%) |
| $10,000 to $14,999 | 393 (1.9%) | 631 (5.2%) |
| $15,000 to $19,999 | 302 (1.5%) | 494 (4.1%) |
| $20,000 to $24,999 | 314 (1.6%) | 579 (4.8%) |
| $25,000 to $34,999 | 673 (3.3%) | 830 (6.8%) |
| $35,000 to $49,999 | 1,224 (6.1%) | 1,402 (11.6%) |
| $50,000 to $74,999 | 2,301 (11.4%) | 1,878 (15.5%) |
| $75,000 to $99,999 | 2,602 (12.9%) | 1,844 (15.2%) |
| $100,000 to $149,999 | 4,710 (23.4%) | 2,402 (19.8%) |
| $150,000 or more | 6,922 (34.4%) | 1,520 (12.5%) |
| Total | 20,154 (100.0%) | 12,131 (100.0%) |
Monthly Housing Cost Tiers in West Covina
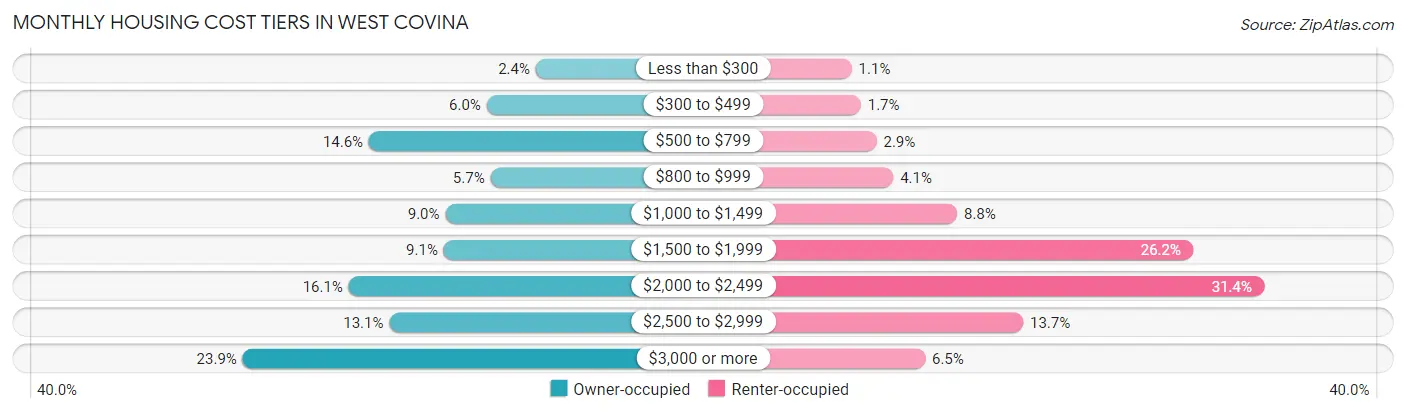
| Monthly Cost | Owner-occupied | Renter-occupied |
| Less than $300 | 473 (2.4%) | 127 (1.1%) |
| $300 to $499 | 1,204 (6.0%) | 209 (1.7%) |
| $500 to $799 | 2,951 (14.6%) | 349 (2.9%) |
| $800 to $999 | 1,147 (5.7%) | 498 (4.1%) |
| $1,000 to $1,499 | 1,815 (9.0%) | 1,069 (8.8%) |
| $1,500 to $1,999 | 1,841 (9.1%) | 3,175 (26.2%) |
| $2,000 to $2,499 | 3,250 (16.1%) | 3,809 (31.4%) |
| $2,500 to $2,999 | 2,649 (13.1%) | 1,658 (13.7%) |
| $3,000 or more | 4,824 (23.9%) | 782 (6.5%) |
| Total | 20,154 (100.0%) | 12,131 (100.0%) |
Physical Housing Characteristics in West Covina
Housing Structures in West Covina
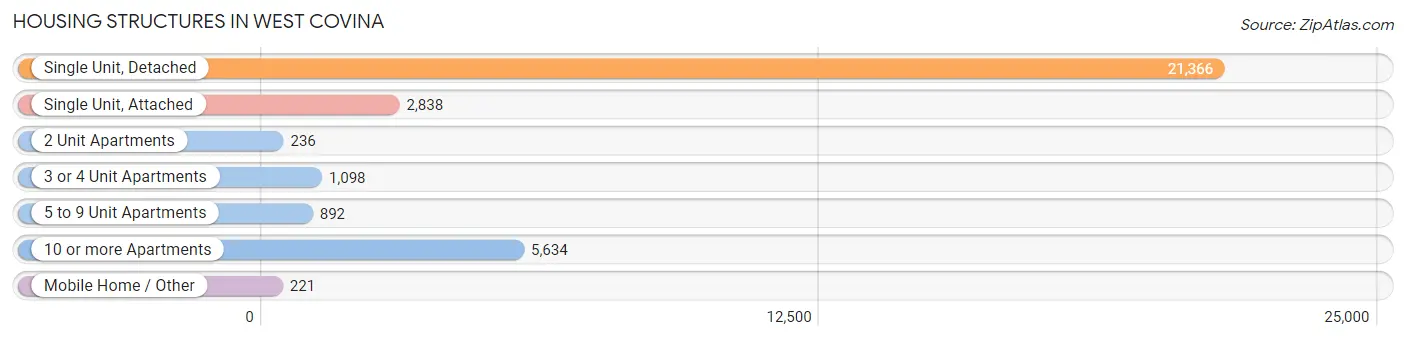
| Structure Type | # Housing Units | % Housing Units |
| Single Unit, Detached | 21,366 | 66.2% |
| Single Unit, Attached | 2,838 | 8.8% |
| 2 Unit Apartments | 236 | 0.7% |
| 3 or 4 Unit Apartments | 1,098 | 3.4% |
| 5 to 9 Unit Apartments | 892 | 2.8% |
| 10 or more Apartments | 5,634 | 17.4% |
| Mobile Home / Other | 221 | 0.7% |
| Total | 32,285 | 100.0% |
Housing Structures by Occupancy in West Covina
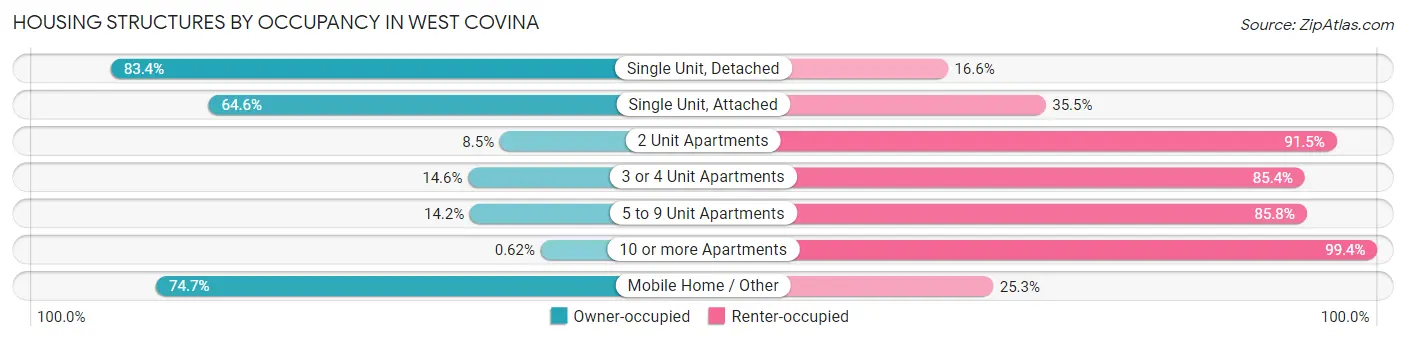
| Structure Type | Owner-occupied | Renter-occupied |
| Single Unit, Detached | 17,815 (83.4%) | 3,551 (16.6%) |
| Single Unit, Attached | 1,832 (64.5%) | 1,006 (35.4%) |
| 2 Unit Apartments | 20 (8.5%) | 216 (91.5%) |
| 3 or 4 Unit Apartments | 160 (14.6%) | 938 (85.4%) |
| 5 to 9 Unit Apartments | 127 (14.2%) | 765 (85.8%) |
| 10 or more Apartments | 35 (0.6%) | 5,599 (99.4%) |
| Mobile Home / Other | 165 (74.7%) | 56 (25.3%) |
| Total | 20,154 (62.4%) | 12,131 (37.6%) |
Housing Structures by Number of Rooms in West Covina
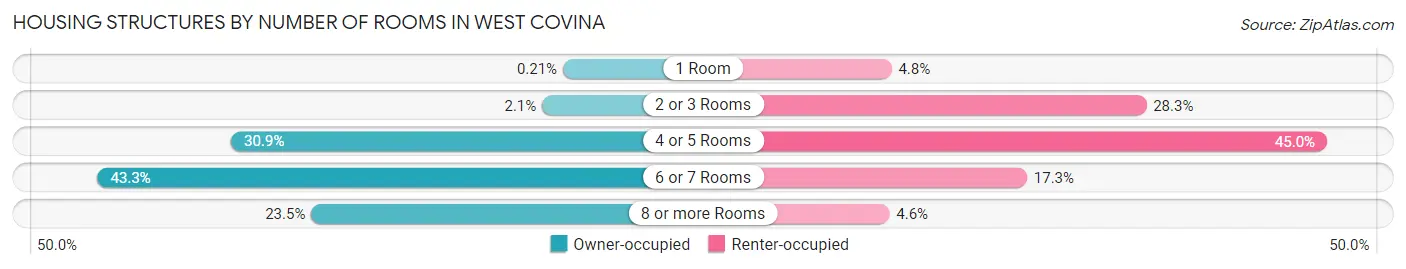
| Number of Rooms | Owner-occupied | Renter-occupied |
| 1 Room | 42 (0.2%) | 579 (4.8%) |
| 2 or 3 Rooms | 432 (2.1%) | 3,437 (28.3%) |
| 4 or 5 Rooms | 6,228 (30.9%) | 5,464 (45.0%) |
| 6 or 7 Rooms | 8,718 (43.3%) | 2,097 (17.3%) |
| 8 or more Rooms | 4,734 (23.5%) | 554 (4.6%) |
| Total | 20,154 (100.0%) | 12,131 (100.0%) |
Housing Structure by Heating Type in West Covina
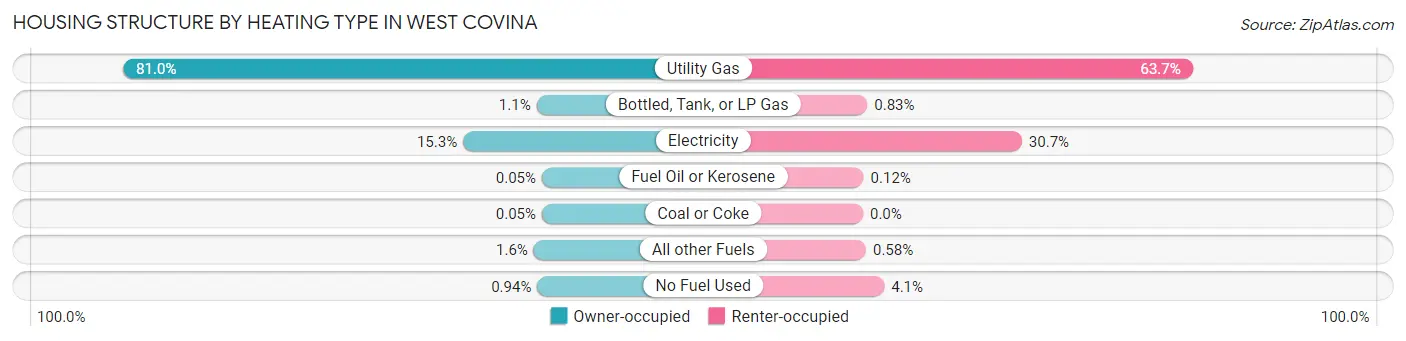
| Heating Type | Owner-occupied | Renter-occupied |
| Utility Gas | 16,319 (81.0%) | 7,723 (63.7%) |
| Bottled, Tank, or LP Gas | 217 (1.1%) | 101 (0.8%) |
| Electricity | 3,081 (15.3%) | 3,724 (30.7%) |
| Fuel Oil or Kerosene | 11 (0.1%) | 15 (0.1%) |
| Coal or Coke | 10 (0.1%) | 0 (0.0%) |
| All other Fuels | 326 (1.6%) | 70 (0.6%) |
| No Fuel Used | 190 (0.9%) | 498 (4.1%) |
| Total | 20,154 (100.0%) | 12,131 (100.0%) |
Household Vehicle Usage in West Covina
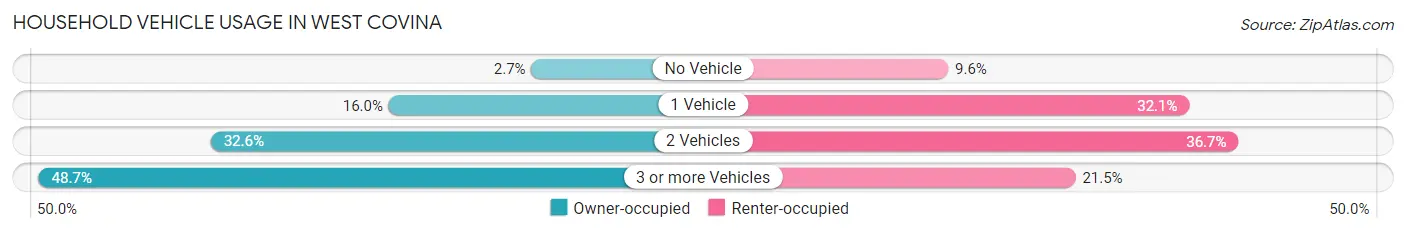
| Vehicles per Household | Owner-occupied | Renter-occupied |
| No Vehicle | 542 (2.7%) | 1,168 (9.6%) |
| 1 Vehicle | 3,225 (16.0%) | 3,899 (32.1%) |
| 2 Vehicles | 6,574 (32.6%) | 4,454 (36.7%) |
| 3 or more Vehicles | 9,813 (48.7%) | 2,610 (21.5%) |
| Total | 20,154 (100.0%) | 12,131 (100.0%) |
Real Estate & Mortgages in West Covina
Real Estate and Mortgage Overview in West Covina
| Characteristic | Without Mortgage | With Mortgage |
| Housing Units | 6,714 | 13,440 |
| Median Property Value | $641,800 | $676,400 |
| Median Household Income | $87,403 | $5,318 |
| Monthly Housing Costs | $670 | $4,803 |
| Real Estate Taxes | $3,910 | $187 |
Property Value by Mortgage Status in West Covina
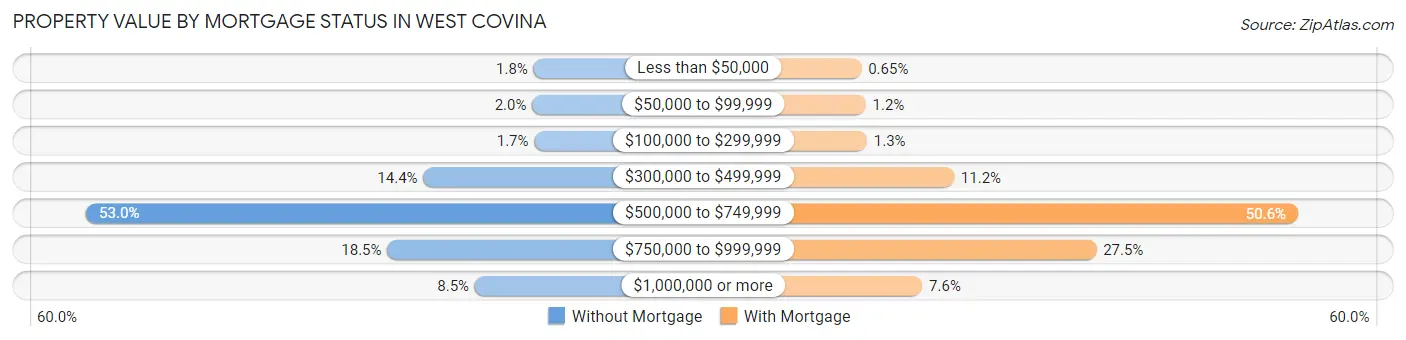
| Property Value | Without Mortgage | With Mortgage |
| Less than $50,000 | 122 (1.8%) | 88 (0.6%) |
| $50,000 to $99,999 | 133 (2.0%) | 155 (1.1%) |
| $100,000 to $299,999 | 117 (1.7%) | 173 (1.3%) |
| $300,000 to $499,999 | 968 (14.4%) | 1,511 (11.2%) |
| $500,000 to $749,999 | 3,556 (53.0%) | 6,794 (50.5%) |
| $750,000 to $999,999 | 1,245 (18.5%) | 3,696 (27.5%) |
| $1,000,000 or more | 573 (8.5%) | 1,023 (7.6%) |
| Total | 6,714 (100.0%) | 13,440 (100.0%) |
Household Income by Mortgage Status in West Covina
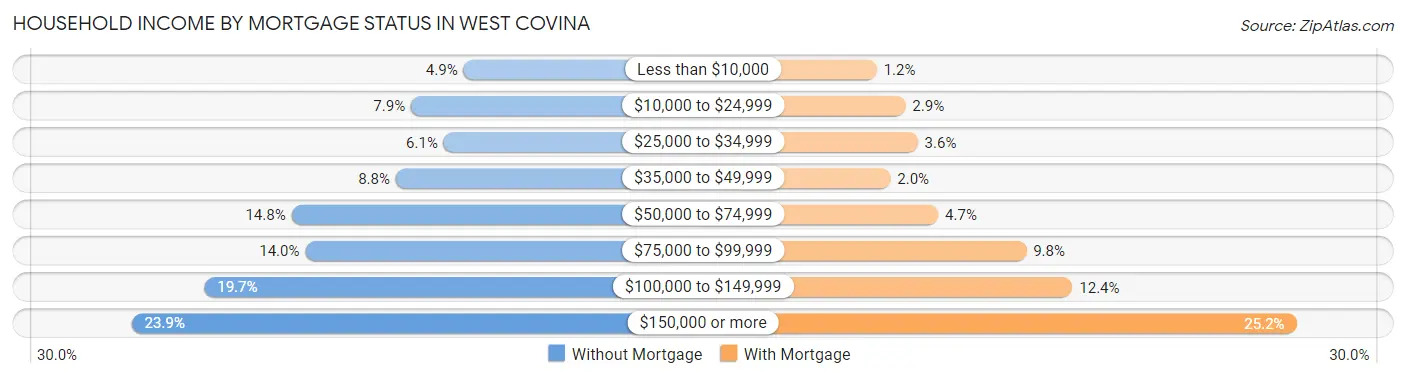
| Household Income | Without Mortgage | With Mortgage |
| Less than $10,000 | 330 (4.9%) | 162 (1.2%) |
| $10,000 to $24,999 | 532 (7.9%) | 383 (2.9%) |
| $25,000 to $34,999 | 406 (6.0%) | 477 (3.5%) |
| $35,000 to $49,999 | 590 (8.8%) | 267 (2.0%) |
| $50,000 to $74,999 | 990 (14.7%) | 634 (4.7%) |
| $75,000 to $99,999 | 937 (14.0%) | 1,311 (9.8%) |
| $100,000 to $149,999 | 1,325 (19.7%) | 1,665 (12.4%) |
| $150,000 or more | 1,604 (23.9%) | 3,385 (25.2%) |
| Total | 6,714 (100.0%) | 13,440 (100.0%) |
Property Value to Household Income Ratio in West Covina
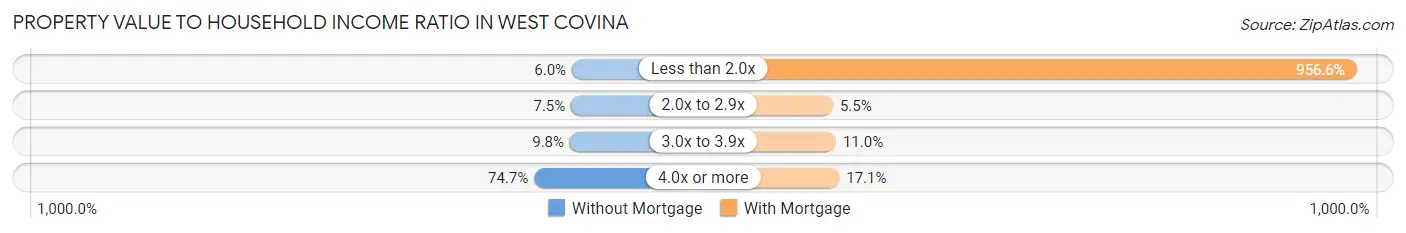
| Value-to-Income Ratio | Without Mortgage | With Mortgage |
| Less than 2.0x | 403 (6.0%) | 128,568 (956.6%) |
| 2.0x to 2.9x | 500 (7.4%) | 743 (5.5%) |
| 3.0x to 3.9x | 656 (9.8%) | 1,480 (11.0%) |
| 4.0x or more | 5,012 (74.7%) | 2,292 (17.1%) |
| Total | 6,714 (100.0%) | 13,440 (100.0%) |
Real Estate Taxes by Mortgage Status in West Covina
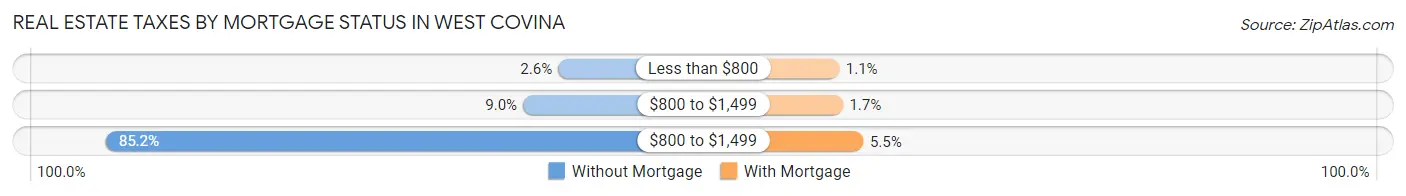
| Property Taxes | Without Mortgage | With Mortgage |
| Less than $800 | 173 (2.6%) | 142 (1.1%) |
| $800 to $1,499 | 603 (9.0%) | 231 (1.7%) |
| $800 to $1,499 | 5,718 (85.2%) | 734 (5.5%) |
| Total | 6,714 (100.0%) | 13,440 (100.0%) |
Health & Disability in West Covina
Health Insurance Coverage by Age in West Covina
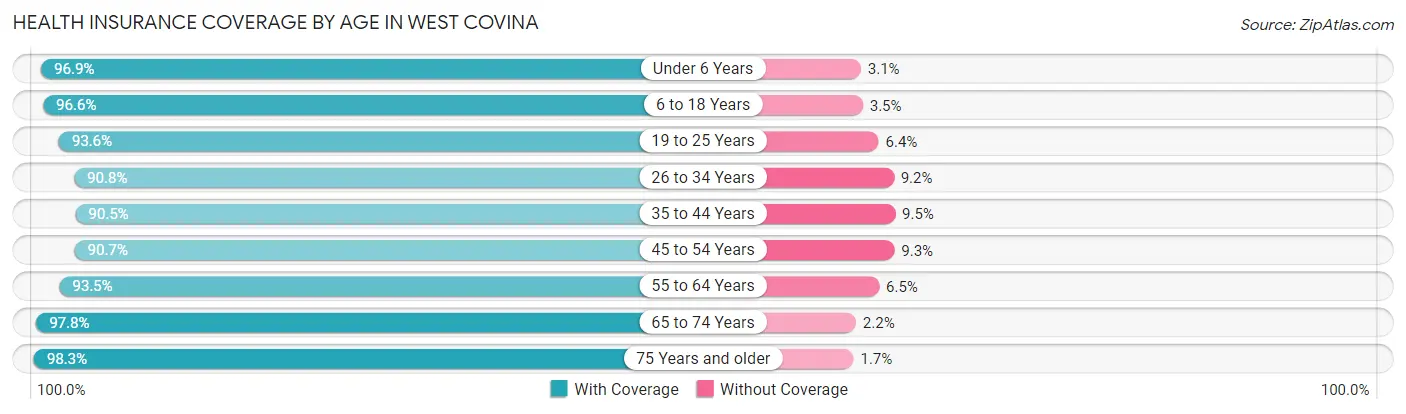
| Age Bracket | With Coverage | Without Coverage |
| Under 6 Years | 6,046 (96.9%) | 193 (3.1%) |
| 6 to 18 Years | 15,671 (96.6%) | 560 (3.5%) |
| 19 to 25 Years | 9,583 (93.6%) | 654 (6.4%) |
| 26 to 34 Years | 13,328 (90.8%) | 1,353 (9.2%) |
| 35 to 44 Years | 11,886 (90.5%) | 1,245 (9.5%) |
| 45 to 54 Years | 12,823 (90.7%) | 1,319 (9.3%) |
| 55 to 64 Years | 14,254 (93.5%) | 989 (6.5%) |
| 65 to 74 Years | 9,664 (97.8%) | 214 (2.2%) |
| 75 Years and older | 7,751 (98.3%) | 136 (1.7%) |
| Total | 101,006 (93.8%) | 6,663 (6.2%) |
Health Insurance Coverage by Citizenship Status in West Covina
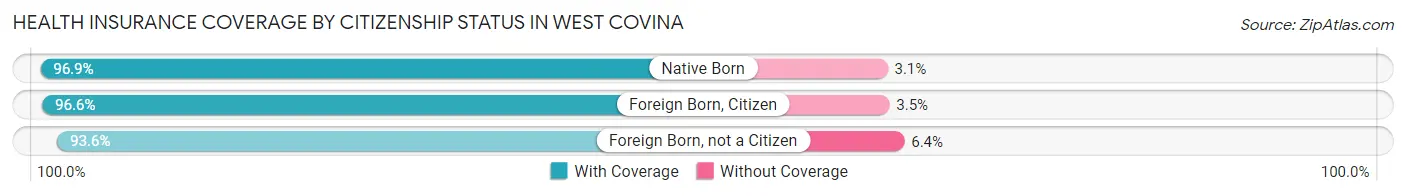
| Citizenship Status | With Coverage | Without Coverage |
| Native Born | 6,046 (96.9%) | 193 (3.1%) |
| Foreign Born, Citizen | 15,671 (96.6%) | 560 (3.5%) |
| Foreign Born, not a Citizen | 9,583 (93.6%) | 654 (6.4%) |
Health Insurance Coverage by Household Income in West Covina
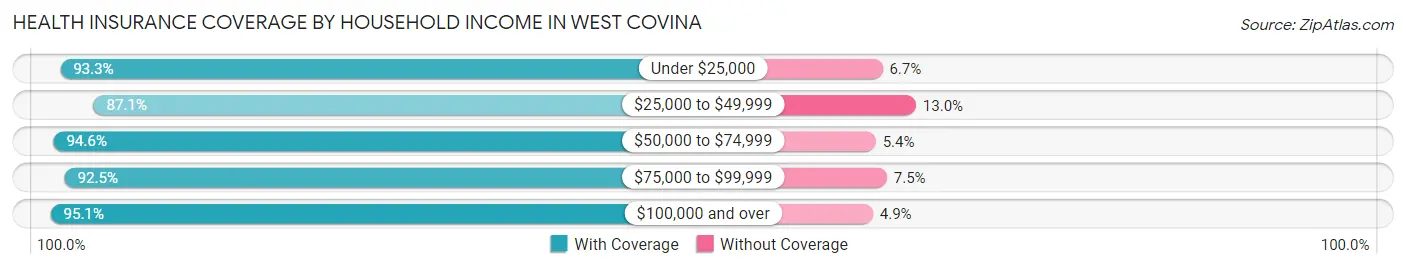
| Household Income | With Coverage | Without Coverage |
| Under $25,000 | 7,255 (93.3%) | 519 (6.7%) |
| $25,000 to $49,999 | 9,212 (87.1%) | 1,371 (13.0%) |
| $50,000 to $74,999 | 12,142 (94.6%) | 696 (5.4%) |
| $75,000 to $99,999 | 12,788 (92.5%) | 1,039 (7.5%) |
| $100,000 and over | 59,038 (95.1%) | 3,027 (4.9%) |
Public vs Private Health Insurance Coverage by Age in West Covina
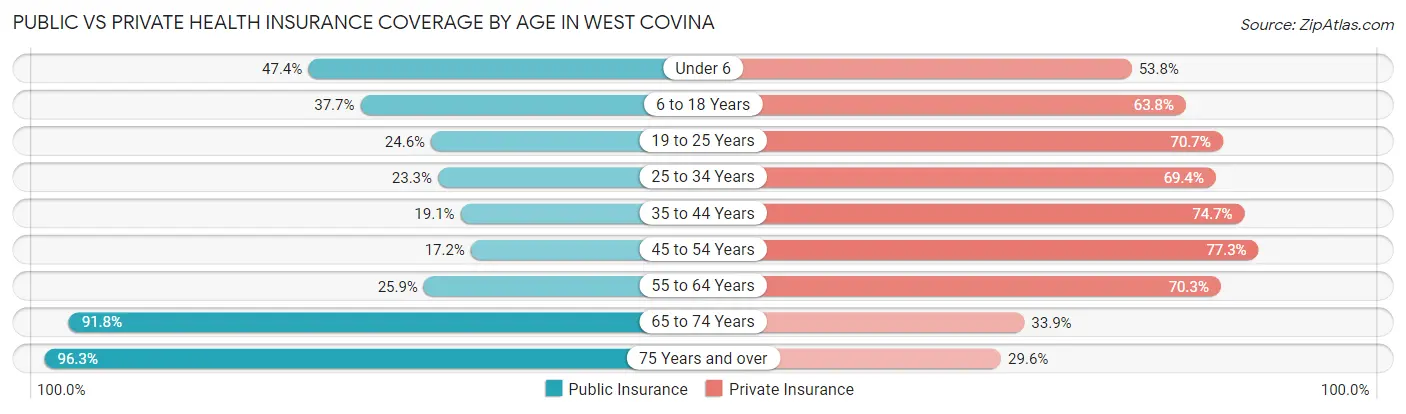
| Age Bracket | Public Insurance | Private Insurance |
| Under 6 | 2,956 (47.4%) | 3,357 (53.8%) |
| 6 to 18 Years | 6,117 (37.7%) | 10,362 (63.8%) |
| 19 to 25 Years | 2,516 (24.6%) | 7,236 (70.7%) |
| 25 to 34 Years | 3,419 (23.3%) | 10,188 (69.4%) |
| 35 to 44 Years | 2,509 (19.1%) | 9,813 (74.7%) |
| 45 to 54 Years | 2,433 (17.2%) | 10,936 (77.3%) |
| 55 to 64 Years | 3,951 (25.9%) | 10,720 (70.3%) |
| 65 to 74 Years | 9,067 (91.8%) | 3,349 (33.9%) |
| 75 Years and over | 7,594 (96.3%) | 2,333 (29.6%) |
| Total | 40,562 (37.7%) | 68,294 (63.4%) |
Disability Status by Sex by Age in West Covina
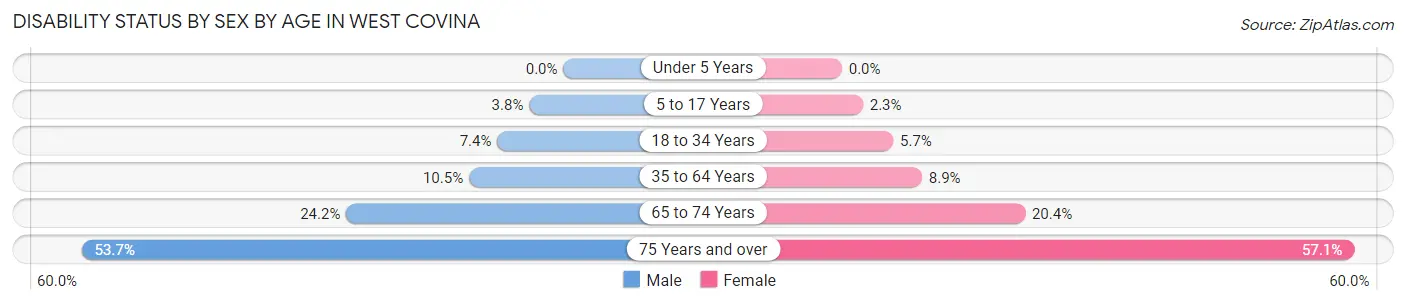
| Age Bracket | Male | Female |
| Under 5 Years | 0 (0.0%) | 0 (0.0%) |
| 5 to 17 Years | 313 (3.8%) | 189 (2.3%) |
| 18 to 34 Years | 977 (7.4%) | 732 (5.7%) |
| 35 to 64 Years | 2,144 (10.5%) | 1,974 (8.9%) |
| 65 to 74 Years | 1,028 (24.2%) | 1,148 (20.4%) |
| 75 Years and over | 1,547 (53.7%) | 2,855 (57.1%) |
Disability Class by Sex by Age in West Covina
Disability Class: Hearing Difficulty
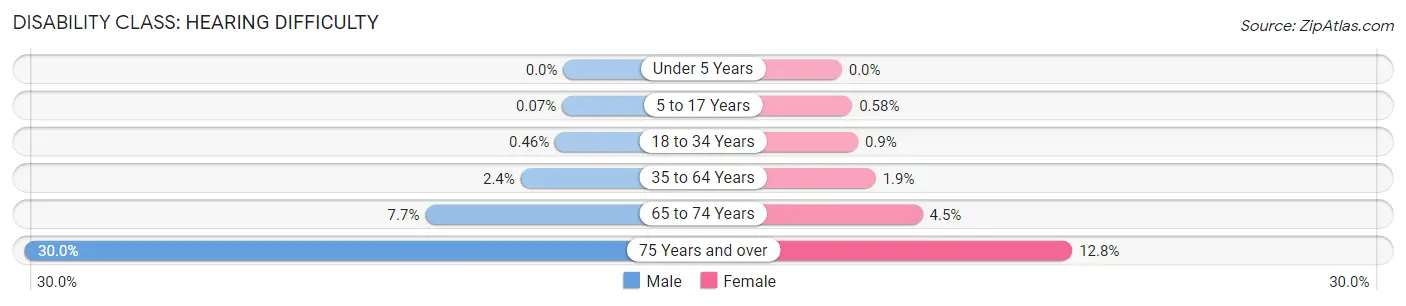
| Age Bracket | Male | Female |
| Under 5 Years | 0 (0.0%) | 0 (0.0%) |
| 5 to 17 Years | 6 (0.1%) | 47 (0.6%) |
| 18 to 34 Years | 61 (0.5%) | 116 (0.9%) |
| 35 to 64 Years | 485 (2.4%) | 419 (1.9%) |
| 65 to 74 Years | 327 (7.7%) | 253 (4.5%) |
| 75 Years and over | 864 (30.0%) | 642 (12.8%) |
Disability Class: Vision Difficulty
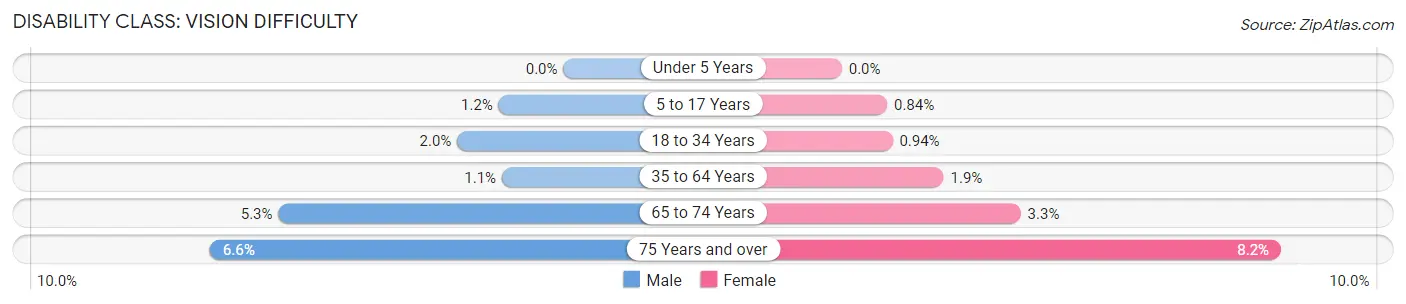
| Age Bracket | Male | Female |
| Under 5 Years | 0 (0.0%) | 0 (0.0%) |
| 5 to 17 Years | 99 (1.2%) | 68 (0.8%) |
| 18 to 34 Years | 262 (2.0%) | 120 (0.9%) |
| 35 to 64 Years | 233 (1.1%) | 419 (1.9%) |
| 65 to 74 Years | 225 (5.3%) | 187 (3.3%) |
| 75 Years and over | 189 (6.6%) | 408 (8.2%) |
Disability Class: Cognitive Difficulty
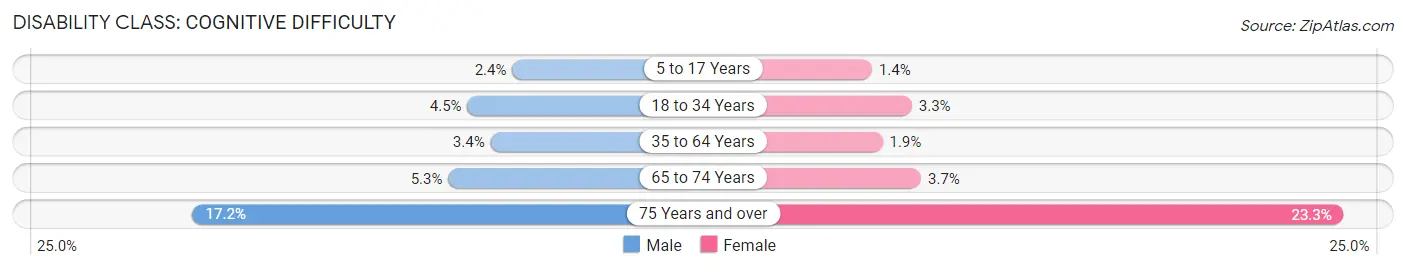
| Age Bracket | Male | Female |
| 5 to 17 Years | 195 (2.4%) | 113 (1.4%) |
| 18 to 34 Years | 591 (4.4%) | 417 (3.3%) |
| 35 to 64 Years | 689 (3.4%) | 419 (1.9%) |
| 65 to 74 Years | 227 (5.3%) | 207 (3.7%) |
| 75 Years and over | 496 (17.2%) | 1,165 (23.3%) |
Disability Class: Ambulatory Difficulty
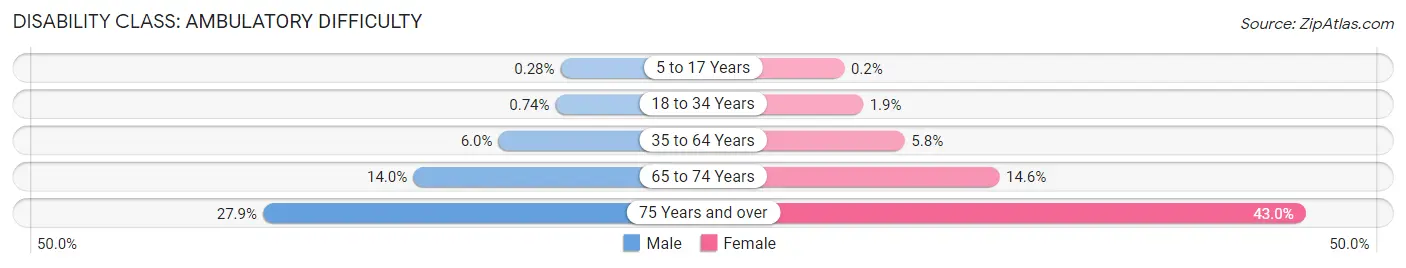
| Age Bracket | Male | Female |
| 5 to 17 Years | 23 (0.3%) | 16 (0.2%) |
| 18 to 34 Years | 98 (0.7%) | 249 (1.9%) |
| 35 to 64 Years | 1,232 (6.0%) | 1,286 (5.8%) |
| 65 to 74 Years | 593 (14.0%) | 821 (14.6%) |
| 75 Years and over | 804 (27.9%) | 2,153 (43.0%) |
Disability Class: Self-Care Difficulty
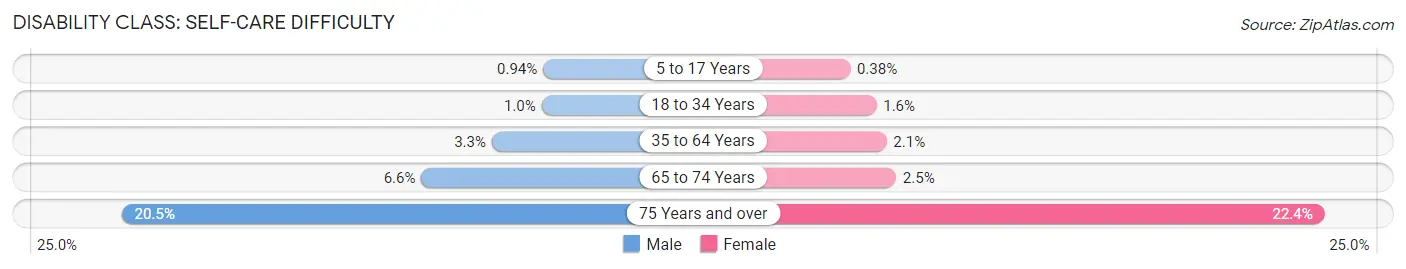
| Age Bracket | Male | Female |
| 5 to 17 Years | 77 (0.9%) | 31 (0.4%) |
| 18 to 34 Years | 134 (1.0%) | 205 (1.6%) |
| 35 to 64 Years | 678 (3.3%) | 459 (2.1%) |
| 65 to 74 Years | 280 (6.6%) | 141 (2.5%) |
| 75 Years and over | 591 (20.5%) | 1,121 (22.4%) |
Technology Access in West Covina
Computing Device Access in West Covina
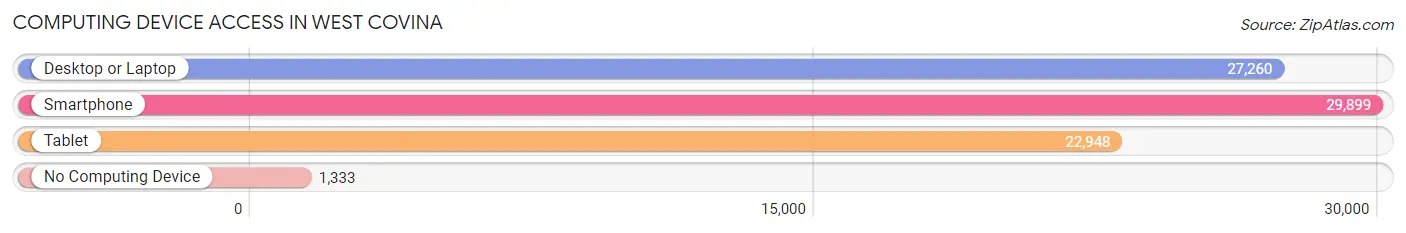
| Device Type | # Households | % Households |
| Desktop or Laptop | 27,260 | 84.4% |
| Smartphone | 29,899 | 92.6% |
| Tablet | 22,948 | 71.1% |
| No Computing Device | 1,333 | 4.1% |
| Total | 32,285 | 100.0% |
Internet Access in West Covina
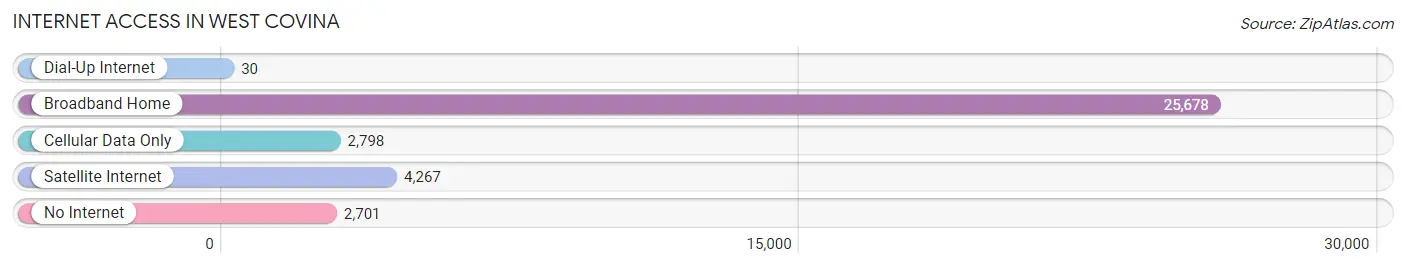
| Internet Type | # Households | % Households |
| Dial-Up Internet | 30 | 0.1% |
| Broadband Home | 25,678 | 79.5% |
| Cellular Data Only | 2,798 | 8.7% |
| Satellite Internet | 4,267 | 13.2% |
| No Internet | 2,701 | 8.4% |
| Total | 32,285 | 100.0% |
West Covina Summary
West Covina, California is a city located in Los Angeles County, California, United States. The city is located about 19 miles east of downtown Los Angeles and is part of the Greater Los Angeles Area. As of the 2010 census, the city had a population of 106,098.
Geography
West Covina is located at 34°3′N 117°57′W (34.05, -117.95). According to the United States Census Bureau, the city has a total area of 27.8 square miles (71.9 km2), of which 27.7 square miles (71.7 km2) is land and 0.1 square miles (0.2 km2) (0.36%) is water.
West Covina is bordered by Covina and Irwindale on the north, Baldwin Park and Azusa on the east, Glendora on the south, and the San Gabriel Valley communities of San Dimas, La Verne, and Pomona on the west.
History
West Covina was founded by entrepreneur Edward E. Hart in 1906. Hart was a real estate developer who owned the successful Covina Valley Land Company. He purchased the land that would become West Covina in 1906 and developed it into a residential community. The city was incorporated on October 23, 1923.
Economy
West Covina is home to a variety of businesses, including retail, manufacturing, and service industries. The city is home to several major employers, including East Valley Community Health Center, Kaiser Permanente, and Wal-Mart.
Demographics
As of the 2010 census, there were 106,098 people, 33,845 households, and 25,845 families residing in the city. The population density was 3,819.3 people per square mile (1,475.2/km2). There were 34,845 housing units at an average density of 1,256.2 per square mile (485.3/km2). The racial makeup of the city was 57.2% White, 4.2% African American, 1.0% Native American, 25.5% Asian, 0.2% Pacific Islander, 8.4% from other races, and 3.5% from two or more races. Hispanic or Latino of any race were 24.7% of the population.
The median income for a household in the city was $60,817, and the median income for a family was $68,717. Males had a median income of $45,919 versus $36,919 for females. The per capita income for the city was $25,817. About 8.7% of families and 11.2% of the population were below the poverty line, including 15.2% of those under age 18 and 6.7% of those age 65 or over.
Common Questions
What is Per Capita Income in West Covina?
Per Capita income in West Covina is $36,707.
What is the Median Family Income in West Covina?
Median Family Income in West Covina is $105,071.
What is the Median Household income in West Covina?
Median Household Income in West Covina is $96,219.
What is Income or Wage Gap in West Covina?
Income or Wage Gap in West Covina is 23.2%.
Women in West Covina earn 76.8 cents for every dollar earned by a man.
What is Family Income Deficit in West Covina?
Family Income Deficit in West Covina is $11,329.
Families that are below poverty line in West Covina earn $11,329 less on average than the poverty threshold level.
What is Inequality or Gini Index in West Covina?
Inequality or Gini Index in West Covina is 0.42.
What is the Total Population of West Covina?
Total Population of West Covina is 108,173.
What is the Total Male Population of West Covina?
Total Male Population of West Covina is 52,130.
What is the Total Female Population of West Covina?
Total Female Population of West Covina is 56,043.
What is the Ratio of Males per 100 Females in West Covina?
There are 93.02 Males per 100 Females in West Covina.
What is the Ratio of Females per 100 Males in West Covina?
There are 107.51 Females per 100 Males in West Covina.
What is the Median Population Age in West Covina?
Median Population Age in West Covina is 39.8 Years.
What is the Average Family Size in West Covina
Average Family Size in West Covina is 3.7 People.
What is the Average Household Size in West Covina
Average Household Size in West Covina is 3.3 People.
How Large is the Labor Force in West Covina?
There are 56,738 People in the Labor Forcein in West Covina.
What is the Percentage of People in the Labor Force in West Covina?
63.5% of People are in the Labor Force in West Covina.
What is the Unemployment Rate in West Covina?
Unemployment Rate in West Covina is 6.7%.