Cities with the Most Immigrants from Philippines in New York
RELATED REPORTS & OPTIONS
Philippines
New York
Compare Cities
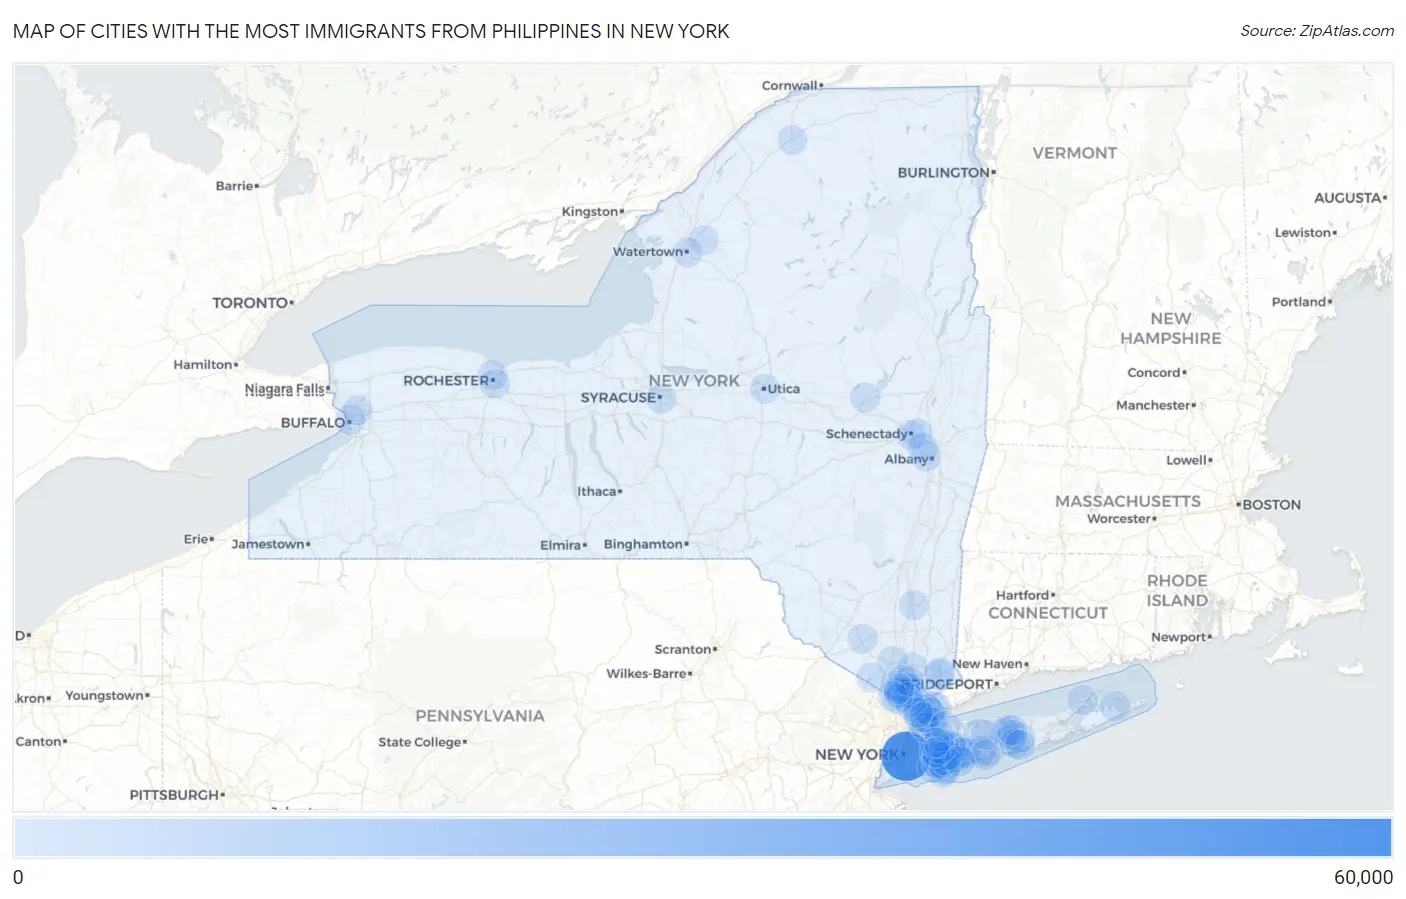
Map of Cities with the Most Immigrants from Philippines in New York
0
60,000
Cities with the Most Immigrants from Philippines in New York
| City | Philippines | vs State | vs National | |
| 1. | New York | 57,191 | 91,070(62.80%)#1 | 1,985,710(2.88%)#2 |
| 2. | Yonkers | 2,255 | 91,070(2.48%)#2 | 1,985,710(0.11%)#120 |
| 3. | Valley Stream | 1,022 | 91,070(1.12%)#3 | 1,985,710(0.05%)#292 |
| 4. | Franklin Square | 784 | 91,070(0.86%)#4 | 1,985,710(0.04%)#374 |
| 5. | Long Beach | 654 | 91,070(0.72%)#5 | 1,985,710(0.03%)#438 |
| 6. | East Meadow | 639 | 91,070(0.70%)#6 | 1,985,710(0.03%)#449 |
| 7. | New City | 633 | 91,070(0.70%)#7 | 1,985,710(0.03%)#451 |
| 8. | New Rochelle | 617 | 91,070(0.68%)#8 | 1,985,710(0.03%)#461 |
| 9. | Albany | 607 | 91,070(0.67%)#9 | 1,985,710(0.03%)#472 |
| 10. | Valley Cottage | 478 | 91,070(0.52%)#10 | 1,985,710(0.02%)#572 |
| 11. | Elmont | 466 | 91,070(0.51%)#11 | 1,985,710(0.02%)#583 |
| 12. | Rochester | 426 | 91,070(0.47%)#12 | 1,985,710(0.02%)#633 |
| 13. | Holbrook | 419 | 91,070(0.46%)#13 | 1,985,710(0.02%)#644 |
| 14. | Tarrytown | 355 | 91,070(0.39%)#14 | 1,985,710(0.02%)#729 |
| 15. | Bedford Hills | 347 | 91,070(0.38%)#15 | 1,985,710(0.02%)#738 |
| 16. | Nanuet | 343 | 91,070(0.38%)#16 | 1,985,710(0.02%)#746 |
| 17. | Mineola | 323 | 91,070(0.35%)#17 | 1,985,710(0.02%)#776 |
| 18. | Levittown | 313 | 91,070(0.34%)#18 | 1,985,710(0.02%)#794 |
| 19. | Hewlett | 295 | 91,070(0.32%)#19 | 1,985,710(0.01%)#840 |
| 20. | Eastchester | 293 | 91,070(0.32%)#20 | 1,985,710(0.01%)#842 |
| 21. | White Plains | 292 | 91,070(0.32%)#21 | 1,985,710(0.01%)#844 |
| 22. | North Valley Stream | 282 | 91,070(0.31%)#22 | 1,985,710(0.01%)#870 |
| 23. | Hicksville | 247 | 91,070(0.27%)#23 | 1,985,710(0.01%)#973 |
| 24. | West Hempstead | 242 | 91,070(0.27%)#24 | 1,985,710(0.01%)#991 |
| 25. | South Farmingdale | 222 | 91,070(0.24%)#25 | 1,985,710(0.01%)#1,052 |
| 26. | Congers | 217 | 91,070(0.24%)#26 | 1,985,710(0.01%)#1,082 |
| 27. | Buffalo | 214 | 91,070(0.23%)#27 | 1,985,710(0.01%)#1,095 |
| 28. | Plainedge | 213 | 91,070(0.23%)#28 | 1,985,710(0.01%)#1,100 |
| 29. | Hillcrest | 200 | 91,070(0.22%)#29 | 1,985,710(0.01%)#1,159 |
| 30. | Dobbs Ferry | 198 | 91,070(0.22%)#30 | 1,985,710(0.01%)#1,177 |
| 31. | Centereach | 196 | 91,070(0.22%)#31 | 1,985,710(0.01%)#1,183 |
| 32. | South Valley Stream | 191 | 91,070(0.21%)#32 | 1,985,710(0.01%)#1,213 |
| 33. | Baldwin | 186 | 91,070(0.20%)#33 | 1,985,710(0.01%)#1,236 |
| 34. | Springs | 181 | 91,070(0.20%)#34 | 1,985,710(0.01%)#1,266 |
| 35. | Roessleville | 180 | 91,070(0.20%)#35 | 1,985,710(0.01%)#1,274 |
| 36. | Mount Vernon | 176 | 91,070(0.19%)#36 | 1,985,710(0.01%)#1,291 |
| 37. | Medford | 176 | 91,070(0.19%)#37 | 1,985,710(0.01%)#1,295 |
| 38. | Woodbury | 173 | 91,070(0.19%)#38 | 1,985,710(0.01%)#1,307 |
| 39. | Lake Grove | 168 | 91,070(0.18%)#39 | 1,985,710(0.01%)#1,336 |
| 40. | Lynbrook | 167 | 91,070(0.18%)#40 | 1,985,710(0.01%)#1,340 |
| 41. | Syracuse | 162 | 91,070(0.18%)#41 | 1,985,710(0.01%)#1,371 |
| 42. | Salisbury | 160 | 91,070(0.18%)#42 | 1,985,710(0.01%)#1,384 |
| 43. | Niskayuna | 159 | 91,070(0.17%)#43 | 1,985,710(0.01%)#1,391 |
| 44. | Westbury | 152 | 91,070(0.17%)#44 | 1,985,710(0.01%)#1,433 |
| 45. | Floral Park | 148 | 91,070(0.16%)#45 | 1,985,710(0.01%)#1,462 |
| 46. | Oceanside | 146 | 91,070(0.16%)#46 | 1,985,710(0.01%)#1,469 |
| 47. | Bay Shore | 144 | 91,070(0.16%)#47 | 1,985,710(0.01%)#1,484 |
| 48. | Harrison | 142 | 91,070(0.16%)#48 | 1,985,710(0.01%)#1,499 |
| 49. | Farmingville | 141 | 91,070(0.15%)#49 | 1,985,710(0.01%)#1,512 |
| 50. | Utica | 135 | 91,070(0.15%)#50 | 1,985,710(0.01%)#1,552 |
| 51. | North Bellmore | 128 | 91,070(0.14%)#51 | 1,985,710(0.01%)#1,629 |
| 52. | Elwood | 127 | 91,070(0.14%)#52 | 1,985,710(0.01%)#1,639 |
| 53. | Peekskill | 125 | 91,070(0.14%)#53 | 1,985,710(0.01%)#1,656 |
| 54. | Fort Drum | 121 | 91,070(0.13%)#54 | 1,985,710(0.01%)#1,694 |
| 55. | Hartsdale | 121 | 91,070(0.13%)#55 | 1,985,710(0.01%)#1,701 |
| 56. | Larchmont | 119 | 91,070(0.13%)#56 | 1,985,710(0.01%)#1,721 |
| 57. | Wesley Hills | 118 | 91,070(0.13%)#57 | 1,985,710(0.01%)#1,729 |
| 58. | Albertson | 114 | 91,070(0.13%)#58 | 1,985,710(0.01%)#1,751 |
| 59. | Schenectady | 113 | 91,070(0.12%)#59 | 1,985,710(0.01%)#1,754 |
| 60. | North Babylon | 113 | 91,070(0.12%)#60 | 1,985,710(0.01%)#1,757 |
| 61. | Orangeburg | 112 | 91,070(0.12%)#61 | 1,985,710(0.01%)#1,776 |
| 62. | Katonah | 111 | 91,070(0.12%)#62 | 1,985,710(0.01%)#1,790 |
| 63. | Barnum Island | 109 | 91,070(0.12%)#63 | 1,985,710(0.01%)#1,807 |
| 64. | West Islip | 108 | 91,070(0.12%)#64 | 1,985,710(0.01%)#1,811 |
| 65. | Rockville Centre | 107 | 91,070(0.12%)#65 | 1,985,710(0.01%)#1,830 |
| 66. | Greenwood Lake | 106 | 91,070(0.12%)#66 | 1,985,710(0.01%)#1,846 |
| 67. | West Nyack | 105 | 91,070(0.12%)#67 | 1,985,710(0.01%)#1,857 |
| 68. | North Patchogue | 103 | 91,070(0.11%)#68 | 1,985,710(0.01%)#1,880 |
| 69. | Eggertsville | 99 | 91,070(0.11%)#69 | 1,985,710(0.00%)#1,928 |
| 70. | Inwood | 98 | 91,070(0.11%)#70 | 1,985,710(0.00%)#1,940 |
| 71. | Spring Valley | 97 | 91,070(0.11%)#71 | 1,985,710(0.00%)#1,948 |
| 72. | Hempstead | 96 | 91,070(0.11%)#72 | 1,985,710(0.00%)#1,964 |
| 73. | North New Hyde Park | 96 | 91,070(0.11%)#73 | 1,985,710(0.00%)#1,977 |
| 74. | Sparkill | 94 | 91,070(0.10%)#74 | 1,985,710(0.00%)#2,009 |
| 75. | Thiells | 92 | 91,070(0.10%)#75 | 1,985,710(0.00%)#2,044 |
| 76. | Selden | 91 | 91,070(0.10%)#76 | 1,985,710(0.00%)#2,052 |
| 77. | Gloversville | 90 | 91,070(0.10%)#77 | 1,985,710(0.00%)#2,067 |
| 78. | Pelham Manor | 89 | 91,070(0.10%)#78 | 1,985,710(0.00%)#2,083 |
| 79. | Port Washington | 87 | 91,070(0.10%)#79 | 1,985,710(0.00%)#2,094 |
| 80. | Chestnut Ridge | 86 | 91,070(0.09%)#80 | 1,985,710(0.00%)#2,110 |
| 81. | Manhasset | 86 | 91,070(0.09%)#81 | 1,985,710(0.00%)#2,112 |
| 82. | Watertown | 85 | 91,070(0.09%)#82 | 1,985,710(0.00%)#2,121 |
| 83. | Haverstraw | 85 | 91,070(0.09%)#83 | 1,985,710(0.00%)#2,125 |
| 84. | Great Neck Plaza | 84 | 91,070(0.09%)#84 | 1,985,710(0.00%)#2,148 |
| 85. | Brighton | 83 | 91,070(0.09%)#85 | 1,985,710(0.00%)#2,158 |
| 86. | East Patchogue | 83 | 91,070(0.09%)#86 | 1,985,710(0.00%)#2,162 |
| 87. | Airmont | 83 | 91,070(0.09%)#87 | 1,985,710(0.00%)#2,166 |
| 88. | New Hempstead | 83 | 91,070(0.09%)#88 | 1,985,710(0.00%)#2,168 |
| 89. | Scarsdale | 82 | 91,070(0.09%)#89 | 1,985,710(0.00%)#2,178 |
| 90. | Poughkeepsie | 81 | 91,070(0.09%)#90 | 1,985,710(0.00%)#2,191 |
| 91. | Tuckahoe | 80 | 91,070(0.09%)#91 | 1,985,710(0.00%)#2,220 |
| 92. | Southold | 80 | 91,070(0.09%)#92 | 1,985,710(0.00%)#2,221 |
| 93. | Potsdam | 79 | 91,070(0.09%)#93 | 1,985,710(0.00%)#2,235 |
| 94. | Bellerose Terrace | 79 | 91,070(0.09%)#94 | 1,985,710(0.00%)#2,242 |
| 95. | Commack | 78 | 91,070(0.09%)#95 | 1,985,710(0.00%)#2,245 |
| 96. | Glen Cove | 78 | 91,070(0.09%)#96 | 1,985,710(0.00%)#2,247 |
| 97. | Scotchtown | 78 | 91,070(0.09%)#97 | 1,985,710(0.00%)#2,256 |
| 98. | Colonie | 77 | 91,070(0.08%)#98 | 1,985,710(0.00%)#2,274 |
| 99. | Wantagh | 74 | 91,070(0.08%)#99 | 1,985,710(0.00%)#2,324 |
| 100. | Hastings On Hudson | 74 | 91,070(0.08%)#100 | 1,985,710(0.00%)#2,326 |
Common Questions
What are the Top 10 Cities with the Most Immigrants from Philippines in New York?
Top 10 Cities with the Most Immigrants from Philippines in New York are:
#1
57,191
#2
2,255
#3
1,022
#4
784
#5
654
#6
639
#7
633
#8
617
#9
607
#10
478
What city has the Most Immigrants from Philippines in New York?
New York has the Most Immigrants from Philippines in New York with 57,191.
What is the Total Immigrants from Philippines in the State of New York?
Total Immigrants from Philippines in New York is 91,070.
What is the Total Immigrants from Philippines in the United States?
Total Immigrants from Philippines in the United States is 1,985,710.