Cities with the Most Immigrants from Philippines in Iowa
RELATED REPORTS & OPTIONS
Philippines
Iowa
Compare Cities
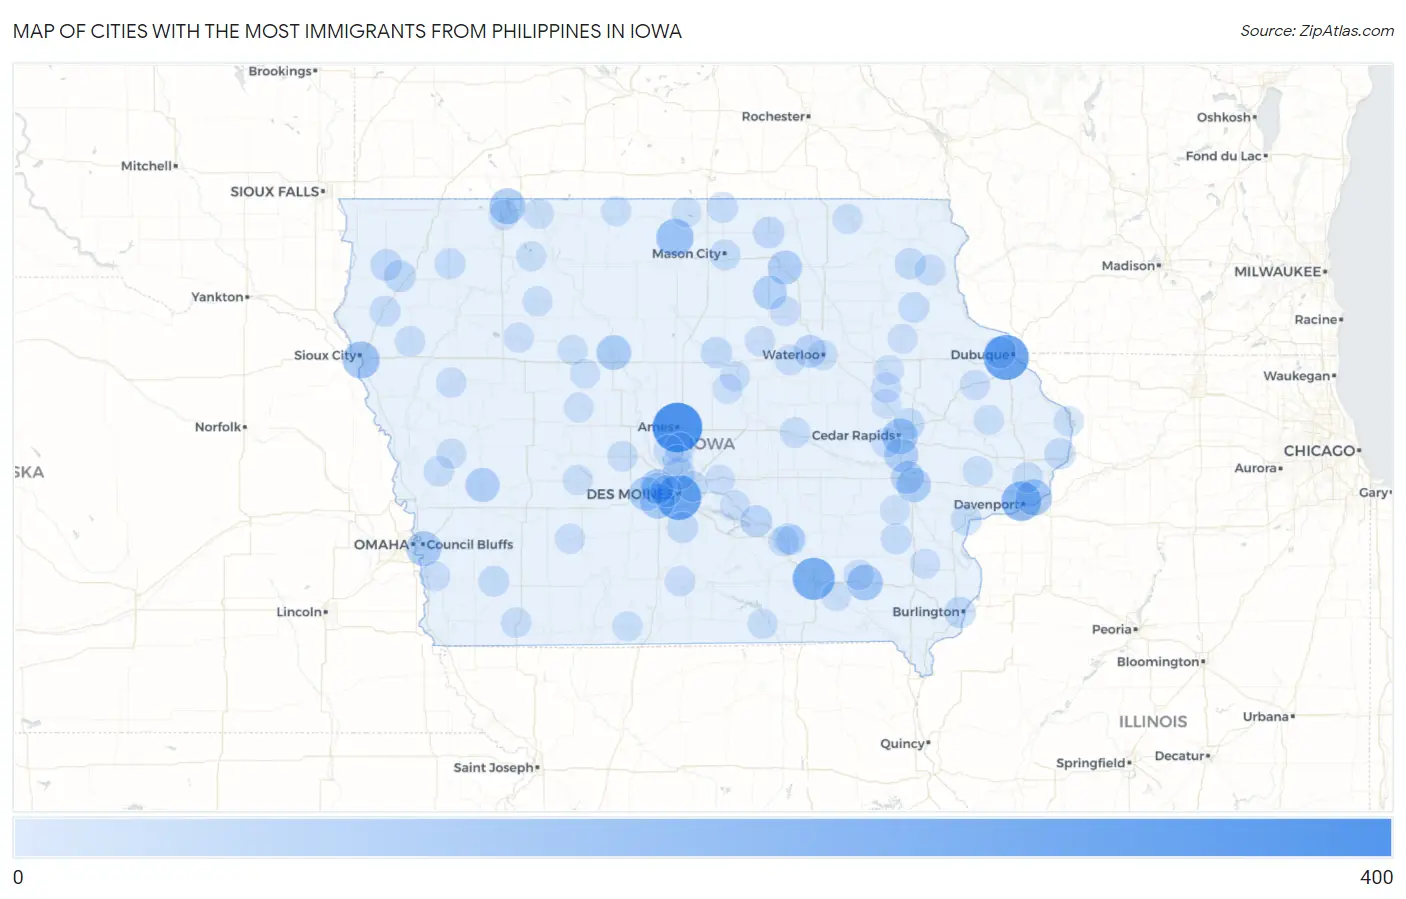
Map of Cities with the Most Immigrants from Philippines in Iowa
0
400
Cities with the Most Immigrants from Philippines in Iowa
| City | Philippines | vs State | vs National | |
| 1. | Ames | 396 | 4,675(8.47%)#1 | 1,985,710(0.02%)#670 |
| 2. | Dubuque | 303 | 4,675(6.48%)#2 | 1,985,710(0.02%)#813 |
| 3. | Des Moines | 298 | 4,675(6.37%)#3 | 1,985,710(0.02%)#825 |
| 4. | Ottumwa | 242 | 4,675(5.18%)#4 | 1,985,710(0.01%)#989 |
| 5. | Davenport | 190 | 4,675(4.06%)#5 | 1,985,710(0.01%)#1,214 |
| 6. | Forest City | 145 | 4,675(3.10%)#6 | 1,985,710(0.01%)#1,480 |
| 7. | Sioux City | 137 | 4,675(2.93%)#7 | 1,985,710(0.01%)#1,539 |
| 8. | Bettendorf | 122 | 4,675(2.61%)#8 | 1,985,710(0.01%)#1,679 |
| 9. | Fairfield | 113 | 4,675(2.42%)#9 | 1,985,710(0.01%)#1,761 |
| 10. | Orleans | 112 | 4,675(2.40%)#10 | 1,985,710(0.01%)#1,777 |
| 11. | Cedar Rapids | 109 | 4,675(2.33%)#11 | 1,985,710(0.01%)#1,802 |
| 12. | Council Bluffs | 100 | 4,675(2.14%)#12 | 1,985,710(0.01%)#1,909 |
| 13. | West Des Moines | 99 | 4,675(2.12%)#13 | 1,985,710(0.00%)#1,922 |
| 14. | Fort Dodge | 94 | 4,675(2.01%)#14 | 1,985,710(0.00%)#1,996 |
| 15. | Iowa City | 89 | 4,675(1.90%)#15 | 1,985,710(0.00%)#2,073 |
| 16. | Urbandale | 83 | 4,675(1.78%)#16 | 1,985,710(0.00%)#2,156 |
| 17. | Waukee | 80 | 4,675(1.71%)#17 | 1,985,710(0.00%)#2,209 |
| 18. | Harlan | 80 | 4,675(1.71%)#18 | 1,985,710(0.00%)#2,222 |
| 19. | Shueyville | 79 | 4,675(1.69%)#19 | 1,985,710(0.00%)#2,243 |
| 20. | Charles City | 78 | 4,675(1.67%)#20 | 1,985,710(0.00%)#2,258 |
| 21. | Greene | 74 | 4,675(1.58%)#21 | 1,985,710(0.00%)#2,329 |
| 22. | Coralville | 60 | 4,675(1.28%)#22 | 1,985,710(0.00%)#2,611 |
| 23. | Cedar Falls | 53 | 4,675(1.13%)#23 | 1,985,710(0.00%)#2,784 |
| 24. | Ankeny | 50 | 4,675(1.07%)#24 | 1,985,710(0.00%)#2,868 |
| 25. | Asbury | 41 | 4,675(0.88%)#25 | 1,985,710(0.00%)#3,215 |
| 26. | Clive | 38 | 4,675(0.81%)#26 | 1,985,710(0.00%)#3,333 |
| 27. | Windsor Heights | 38 | 4,675(0.81%)#27 | 1,985,710(0.00%)#3,357 |
| 28. | Pella | 37 | 4,675(0.79%)#28 | 1,985,710(0.00%)#3,389 |
| 29. | Orange City | 35 | 4,675(0.75%)#29 | 1,985,710(0.00%)#3,493 |
| 30. | Sioux Center | 32 | 4,675(0.68%)#30 | 1,985,710(0.00%)#3,631 |
| 31. | Osage | 31 | 4,675(0.66%)#31 | 1,985,710(0.00%)#3,700 |
| 32. | Burlington | 30 | 4,675(0.64%)#32 | 1,985,710(0.00%)#3,722 |
| 33. | Iowa Falls | 29 | 4,675(0.62%)#33 | 1,985,710(0.00%)#3,823 |
| 34. | Indianola | 26 | 4,675(0.56%)#34 | 1,985,710(0.00%)#3,987 |
| 35. | Marion | 25 | 4,675(0.53%)#35 | 1,985,710(0.00%)#4,039 |
| 36. | Clinton | 25 | 4,675(0.53%)#36 | 1,985,710(0.00%)#4,042 |
| 37. | Oskaloosa | 25 | 4,675(0.53%)#37 | 1,985,710(0.00%)#4,054 |
| 38. | Postville | 25 | 4,675(0.53%)#38 | 1,985,710(0.00%)#4,078 |
| 39. | Washington | 22 | 4,675(0.47%)#39 | 1,985,710(0.00%)#4,253 |
| 40. | Altoona | 20 | 4,675(0.43%)#40 | 1,985,710(0.00%)#4,378 |
| 41. | Le Mars | 20 | 4,675(0.43%)#41 | 1,985,710(0.00%)#4,397 |
| 42. | Mason City | 19 | 4,675(0.41%)#42 | 1,985,710(0.00%)#4,447 |
| 43. | Red Oak | 19 | 4,675(0.41%)#43 | 1,985,710(0.00%)#4,487 |
| 44. | Muscatine | 17 | 4,675(0.36%)#44 | 1,985,710(0.00%)#4,613 |
| 45. | Primghar | 17 | 4,675(0.36%)#45 | 1,985,710(0.00%)#4,701 |
| 46. | Volga | 17 | 4,675(0.36%)#46 | 1,985,710(0.00%)#4,704 |
| 47. | Northwood | 16 | 4,675(0.34%)#47 | 1,985,710(0.00%)#4,794 |
| 48. | Monona | 16 | 4,675(0.34%)#48 | 1,985,710(0.00%)#4,798 |
| 49. | Park View | 14 | 4,675(0.30%)#49 | 1,985,710(0.00%)#4,984 |
| 50. | Clarinda | 13 | 4,675(0.28%)#50 | 1,985,710(0.00%)#5,096 |
| 51. | Toledo | 13 | 4,675(0.28%)#51 | 1,985,710(0.00%)#5,131 |
| 52. | Kingsley | 13 | 4,675(0.28%)#52 | 1,985,710(0.00%)#5,143 |
| 53. | Dike | 11 | 4,675(0.24%)#53 | 1,985,710(0.00%)#5,417 |
| 54. | Maharishi Vedic City | 11 | 4,675(0.24%)#54 | 1,985,710(0.00%)#5,436 |
| 55. | Perry | 10 | 4,675(0.21%)#55 | 1,985,710(0.00%)#5,484 |
| 56. | Huxley | 10 | 4,675(0.21%)#56 | 1,985,710(0.00%)#5,512 |
| 57. | Kent Estates | 10 | 4,675(0.21%)#57 | 1,985,710(0.00%)#5,551 |
| 58. | Woodbine | 10 | 4,675(0.21%)#58 | 1,985,710(0.00%)#5,564 |
| 59. | Beacon | 10 | 4,675(0.21%)#59 | 1,985,710(0.00%)#5,590 |
| 60. | Glenwood | 8 | 4,675(0.17%)#60 | 1,985,710(0.00%)#5,823 |
| 61. | Okoboji | 8 | 4,675(0.17%)#61 | 1,985,710(0.00%)#5,908 |
| 62. | Waterloo | 7 | 4,675(0.15%)#62 | 1,985,710(0.00%)#5,930 |
| 63. | Fairfax | 7 | 4,675(0.15%)#63 | 1,985,710(0.00%)#6,005 |
| 64. | Colfax | 7 | 4,675(0.15%)#64 | 1,985,710(0.00%)#6,027 |
| 65. | Battle Creek | 7 | 4,675(0.15%)#65 | 1,985,710(0.00%)#6,079 |
| 66. | Sabula | 7 | 4,675(0.15%)#66 | 1,985,710(0.00%)#6,088 |
| 67. | Centerville | 6 | 4,675(0.13%)#67 | 1,985,710(0.00%)#6,164 |
| 68. | Eldora | 6 | 4,675(0.13%)#68 | 1,985,710(0.00%)#6,196 |
| 69. | Slater | 6 | 4,675(0.13%)#69 | 1,985,710(0.00%)#6,235 |
| 70. | Laurens | 6 | 4,675(0.13%)#70 | 1,985,710(0.00%)#6,252 |
| 71. | Woodburn | 6 | 4,675(0.13%)#71 | 1,985,710(0.00%)#6,308 |
| 72. | Monmouth | 6 | 4,675(0.13%)#72 | 1,985,710(0.00%)#6,309 |
| 73. | Estherville | 5 | 4,675(0.11%)#73 | 1,985,710(0.00%)#6,363 |
| 74. | Cascade | 5 | 4,675(0.11%)#74 | 1,985,710(0.00%)#6,404 |
| 75. | Guthrie Center | 5 | 4,675(0.11%)#75 | 1,985,710(0.00%)#6,433 |
| 76. | Dunlap | 5 | 4,675(0.11%)#76 | 1,985,710(0.00%)#6,442 |
| 77. | Aplington | 5 | 4,675(0.11%)#77 | 1,985,710(0.00%)#6,476 |
| 78. | Ruthven | 5 | 4,675(0.11%)#78 | 1,985,710(0.00%)#6,484 |
| 79. | Walker | 5 | 4,675(0.11%)#79 | 1,985,710(0.00%)#6,485 |
| 80. | Bennett | 5 | 4,675(0.11%)#80 | 1,985,710(0.00%)#6,502 |
| 81. | Cresco | 4 | 4,675(0.09%)#81 | 1,985,710(0.00%)#6,556 |
| 82. | Monroe | 4 | 4,675(0.09%)#82 | 1,985,710(0.00%)#6,607 |
| 83. | Manson | 4 | 4,675(0.09%)#83 | 1,985,710(0.00%)#6,614 |
| 84. | Clarksville | 4 | 4,675(0.09%)#84 | 1,985,710(0.00%)#6,642 |
| 85. | Winfield | 4 | 4,675(0.09%)#85 | 1,985,710(0.00%)#6,665 |
| 86. | Newell | 4 | 4,675(0.09%)#86 | 1,985,710(0.00%)#6,681 |
| 87. | Fontanelle | 4 | 4,675(0.09%)#87 | 1,985,710(0.00%)#6,715 |
| 88. | Alleman | 4 | 4,675(0.09%)#88 | 1,985,710(0.00%)#6,736 |
| 89. | Kellerton | 4 | 4,675(0.09%)#89 | 1,985,710(0.00%)#6,744 |
| 90. | Ledyard | 4 | 4,675(0.09%)#90 | 1,985,710(0.00%)#6,755 |
| 91. | Kalona | 3 | 4,675(0.06%)#91 | 1,985,710(0.00%)#6,810 |
| 92. | Center Point | 3 | 4,675(0.06%)#92 | 1,985,710(0.00%)#6,814 |
| 93. | Lake Mills | 3 | 4,675(0.06%)#93 | 1,985,710(0.00%)#6,850 |
| 94. | Quasqueton | 3 | 4,675(0.06%)#94 | 1,985,710(0.00%)#6,948 |
| 95. | Eldon | 3 | 4,675(0.06%)#95 | 1,985,710(0.00%)#6,951 |
| 96. | University Park | 3 | 4,675(0.06%)#96 | 1,985,710(0.00%)#6,971 |
| 97. | Churdan | 3 | 4,675(0.06%)#97 | 1,985,710(0.00%)#6,975 |
| 98. | Lamont | 3 | 4,675(0.06%)#98 | 1,985,710(0.00%)#6,976 |
| 99. | New Providence | 3 | 4,675(0.06%)#99 | 1,985,710(0.00%)#7,020 |
| 100. | Somers | 3 | 4,675(0.06%)#100 | 1,985,710(0.00%)#7,029 |
Common Questions
What are the Top 10 Cities with the Most Immigrants from Philippines in Iowa?
Top 10 Cities with the Most Immigrants from Philippines in Iowa are:
#1
396
#2
303
#3
298
#4
242
#5
190
#6
145
#7
137
#8
122
#9
113
#10
112
What city has the Most Immigrants from Philippines in Iowa?
Ames has the Most Immigrants from Philippines in Iowa with 396.
What is the Total Immigrants from Philippines in the State of Iowa?
Total Immigrants from Philippines in Iowa is 4,675.
What is the Total Immigrants from Philippines in the United States?
Total Immigrants from Philippines in the United States is 1,985,710.