Cities with the Most Immigrants from Northern Europe in Virginia
RELATED REPORTS & OPTIONS
Northern Europe
Virginia
Compare Cities
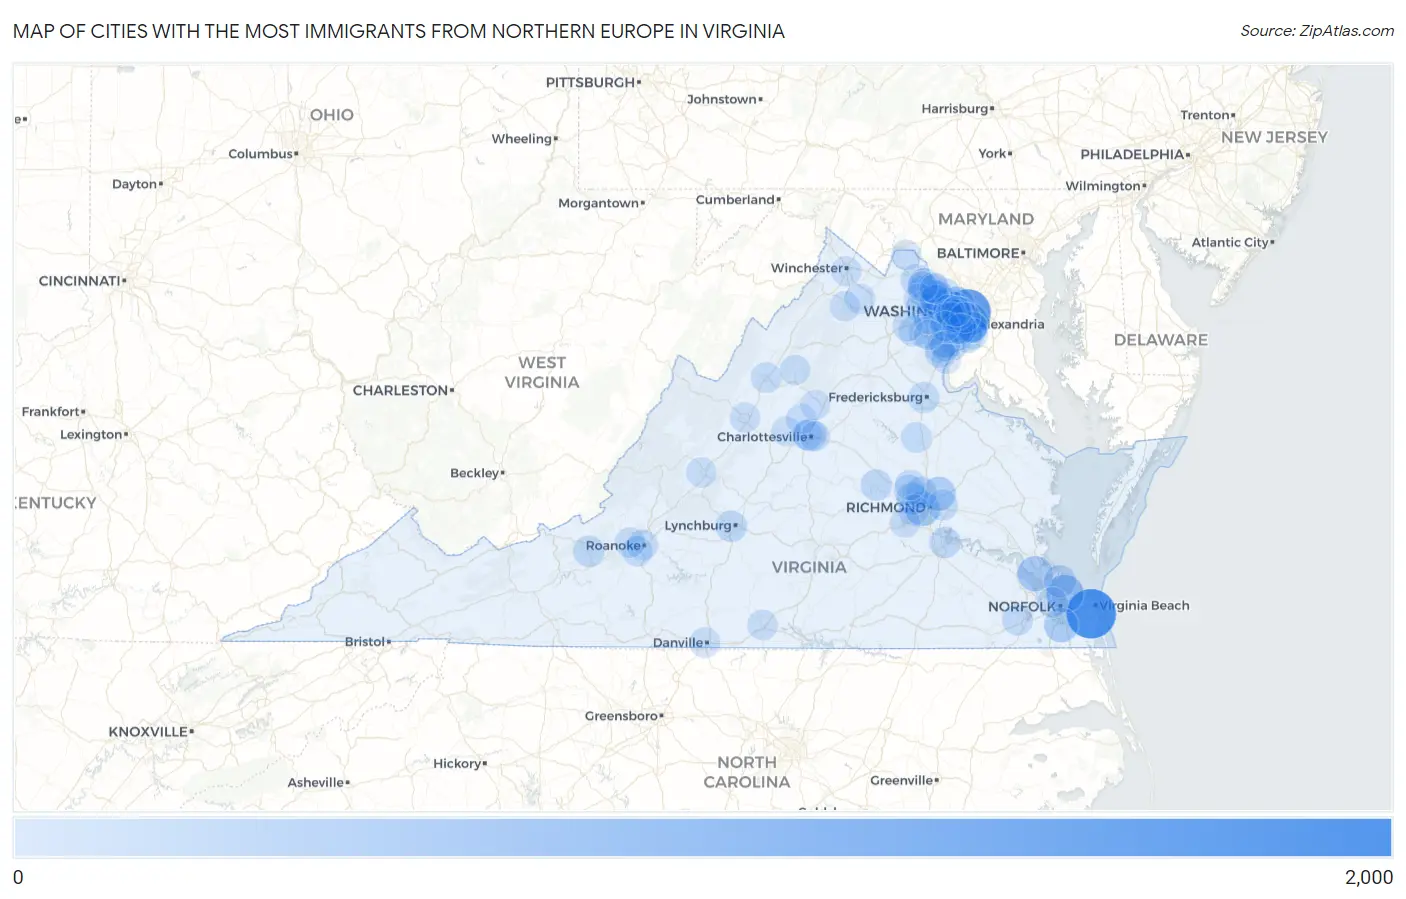
Map of Cities with the Most Immigrants from Northern Europe in Virginia
0
2,000
Cities with the Most Immigrants from Northern Europe in Virginia
| City | Northern Europe | vs State | vs National | |
| 1. | Virginia Beach | 1,798 | 25,764(6.98%)#1 | 944,917(0.19%)#30 |
| 2. | Arlington | 1,520 | 25,764(5.90%)#2 | 944,917(0.16%)#37 |
| 3. | Alexandria | 903 | 25,764(3.50%)#3 | 944,917(0.10%)#95 |
| 4. | Norfolk | 712 | 25,764(2.76%)#4 | 944,917(0.08%)#132 |
| 5. | Mclean | 612 | 25,764(2.38%)#5 | 944,917(0.06%)#164 |
| 6. | Reston | 494 | 25,764(1.92%)#6 | 944,917(0.05%)#204 |
| 7. | Newport News | 476 | 25,764(1.85%)#7 | 944,917(0.05%)#209 |
| 8. | Richmond | 445 | 25,764(1.73%)#8 | 944,917(0.05%)#234 |
| 9. | Chesapeake | 421 | 25,764(1.63%)#9 | 944,917(0.04%)#264 |
| 10. | Mechanicsville | 378 | 25,764(1.47%)#10 | 944,917(0.04%)#312 |
| 11. | Ashburn | 282 | 25,764(1.09%)#11 | 944,917(0.03%)#433 |
| 12. | Oakton | 258 | 25,764(1.00%)#12 | 944,917(0.03%)#501 |
| 13. | Charlottesville | 257 | 25,764(1.00%)#13 | 944,917(0.03%)#502 |
| 14. | Tuckahoe | 236 | 25,764(0.92%)#14 | 944,917(0.02%)#575 |
| 15. | Hampton | 229 | 25,764(0.89%)#15 | 944,917(0.02%)#597 |
| 16. | Lorton | 222 | 25,764(0.86%)#16 | 944,917(0.02%)#621 |
| 17. | Lake Ridge | 221 | 25,764(0.86%)#17 | 944,917(0.02%)#625 |
| 18. | Wolf Trap | 206 | 25,764(0.80%)#18 | 944,917(0.02%)#677 |
| 19. | Fairfax | 192 | 25,764(0.75%)#19 | 944,917(0.02%)#729 |
| 20. | Franklin Farm | 189 | 25,764(0.73%)#20 | 944,917(0.02%)#742 |
| 21. | Tysons | 176 | 25,764(0.68%)#21 | 944,917(0.02%)#788 |
| 22. | Fair Oaks | 164 | 25,764(0.64%)#22 | 944,917(0.02%)#860 |
| 23. | Annandale | 163 | 25,764(0.63%)#23 | 944,917(0.02%)#865 |
| 24. | Huntington | 160 | 25,764(0.62%)#24 | 944,917(0.02%)#890 |
| 25. | Lynchburg | 155 | 25,764(0.60%)#25 | 944,917(0.02%)#922 |
| 26. | Burke | 154 | 25,764(0.60%)#26 | 944,917(0.02%)#931 |
| 27. | Goochland | 148 | 25,764(0.57%)#27 | 944,917(0.02%)#977 |
| 28. | Leesburg | 145 | 25,764(0.56%)#28 | 944,917(0.02%)#989 |
| 29. | Laurel | 142 | 25,764(0.55%)#29 | 944,917(0.02%)#1,016 |
| 30. | Lansdowne | 141 | 25,764(0.55%)#30 | 944,917(0.01%)#1,022 |
| 31. | Blacksburg | 139 | 25,764(0.54%)#31 | 944,917(0.01%)#1,037 |
| 32. | Hopewell | 137 | 25,764(0.53%)#32 | 944,917(0.01%)#1,053 |
| 33. | Fredericksburg | 129 | 25,764(0.50%)#33 | 944,917(0.01%)#1,121 |
| 34. | Braddock | 125 | 25,764(0.49%)#34 | 944,917(0.01%)#1,159 |
| 35. | South Riding | 121 | 25,764(0.47%)#35 | 944,917(0.01%)#1,183 |
| 36. | Highland Springs | 118 | 25,764(0.46%)#36 | 944,917(0.01%)#1,220 |
| 37. | Fort Hunt | 112 | 25,764(0.43%)#37 | 944,917(0.01%)#1,278 |
| 38. | Dranesville | 112 | 25,764(0.43%)#38 | 944,917(0.01%)#1,280 |
| 39. | Falls Church | 111 | 25,764(0.43%)#39 | 944,917(0.01%)#1,293 |
| 40. | Great Falls | 108 | 25,764(0.42%)#40 | 944,917(0.01%)#1,328 |
| 41. | Kingstowne | 107 | 25,764(0.42%)#41 | 944,917(0.01%)#1,339 |
| 42. | Suffolk | 106 | 25,764(0.41%)#42 | 944,917(0.01%)#1,347 |
| 43. | West Springfield | 106 | 25,764(0.41%)#43 | 944,917(0.01%)#1,350 |
| 44. | Mount Vernon | 106 | 25,764(0.41%)#44 | 944,917(0.01%)#1,356 |
| 45. | Short Pump | 104 | 25,764(0.40%)#45 | 944,917(0.01%)#1,378 |
| 46. | Belle Haven | 103 | 25,764(0.40%)#46 | 944,917(0.01%)#1,396 |
| 47. | Bon Air | 100 | 25,764(0.39%)#47 | 944,917(0.01%)#1,445 |
| 48. | Linton Hall | 98 | 25,764(0.38%)#48 | 944,917(0.01%)#1,465 |
| 49. | Harrisonburg | 96 | 25,764(0.37%)#49 | 944,917(0.01%)#1,503 |
| 50. | Manassas | 91 | 25,764(0.35%)#50 | 944,917(0.01%)#1,583 |
| 51. | Roanoke | 90 | 25,764(0.35%)#51 | 944,917(0.01%)#1,600 |
| 52. | Centreville | 89 | 25,764(0.35%)#52 | 944,917(0.01%)#1,616 |
| 53. | Woodburn | 84 | 25,764(0.33%)#53 | 944,917(0.01%)#1,699 |
| 54. | Cave Spring | 80 | 25,764(0.31%)#54 | 944,917(0.01%)#1,752 |
| 55. | Midlothian | 78 | 25,764(0.30%)#55 | 944,917(0.01%)#1,792 |
| 56. | Dale City | 76 | 25,764(0.29%)#56 | 944,917(0.01%)#1,814 |
| 57. | Lake Land Or | 76 | 25,764(0.29%)#57 | 944,917(0.01%)#1,832 |
| 58. | Danville | 73 | 25,764(0.28%)#58 | 944,917(0.01%)#1,870 |
| 59. | West Falls Church | 71 | 25,764(0.28%)#59 | 944,917(0.01%)#1,915 |
| 60. | Salem | 71 | 25,764(0.28%)#60 | 944,917(0.01%)#1,916 |
| 61. | Wyndham | 71 | 25,764(0.28%)#61 | 944,917(0.01%)#1,922 |
| 62. | Portsmouth | 70 | 25,764(0.27%)#62 | 944,917(0.01%)#1,934 |
| 63. | Sterling | 69 | 25,764(0.27%)#63 | 944,917(0.01%)#1,963 |
| 64. | Brambleton | 69 | 25,764(0.27%)#64 | 944,917(0.01%)#1,965 |
| 65. | Herndon | 67 | 25,764(0.26%)#65 | 944,917(0.01%)#2,009 |
| 66. | South Boston | 66 | 25,764(0.26%)#66 | 944,917(0.01%)#2,042 |
| 67. | Countryside | 65 | 25,764(0.25%)#67 | 944,917(0.01%)#2,065 |
| 68. | Merrifield | 63 | 25,764(0.24%)#68 | 944,917(0.01%)#2,101 |
| 69. | Mantua | 63 | 25,764(0.24%)#69 | 944,917(0.01%)#2,120 |
| 70. | Vienna | 62 | 25,764(0.24%)#70 | 944,917(0.01%)#2,135 |
| 71. | Brandermill | 61 | 25,764(0.24%)#71 | 944,917(0.01%)#2,178 |
| 72. | Shenandoah Farms | 61 | 25,764(0.24%)#72 | 944,917(0.01%)#2,191 |
| 73. | Springfield | 60 | 25,764(0.23%)#73 | 944,917(0.01%)#2,200 |
| 74. | Gainesville | 60 | 25,764(0.23%)#74 | 944,917(0.01%)#2,202 |
| 75. | Belmont | 57 | 25,764(0.22%)#75 | 944,917(0.01%)#2,307 |
| 76. | Lovettsville | 57 | 25,764(0.22%)#76 | 944,917(0.01%)#2,318 |
| 77. | Staunton | 55 | 25,764(0.21%)#77 | 944,917(0.01%)#2,360 |
| 78. | Bailey S Crossroads | 54 | 25,764(0.21%)#78 | 944,917(0.01%)#2,385 |
| 79. | Franconia | 54 | 25,764(0.21%)#79 | 944,917(0.01%)#2,392 |
| 80. | Difficult Run | 53 | 25,764(0.21%)#80 | 944,917(0.01%)#2,439 |
| 81. | Montclair | 52 | 25,764(0.20%)#81 | 944,917(0.01%)#2,462 |
| 82. | Burke Centre | 52 | 25,764(0.20%)#82 | 944,917(0.01%)#2,464 |
| 83. | Shenandoah | 52 | 25,764(0.20%)#83 | 944,917(0.01%)#2,487 |
| 84. | Leesylvania | 51 | 25,764(0.20%)#84 | 944,917(0.01%)#2,507 |
| 85. | Lexington | 51 | 25,764(0.20%)#85 | 944,917(0.01%)#2,526 |
| 86. | Idylwood | 50 | 25,764(0.19%)#86 | 944,917(0.01%)#2,545 |
| 87. | University Of Virginia | 50 | 25,764(0.19%)#87 | 944,917(0.01%)#2,552 |
| 88. | Potomac Mills | 50 | 25,764(0.19%)#88 | 944,917(0.01%)#2,559 |
| 89. | Free Union | 48 | 25,764(0.19%)#89 | 944,917(0.01%)#2,636 |
| 90. | Winchester | 46 | 25,764(0.18%)#90 | 944,917(0.00%)#2,682 |
| 91. | Rose Hill Cdp Fairfax County | 46 | 25,764(0.18%)#91 | 944,917(0.00%)#2,685 |
| 92. | Front Royal | 45 | 25,764(0.17%)#92 | 944,917(0.00%)#2,715 |
| 93. | Union Mill | 44 | 25,764(0.17%)#93 | 944,917(0.00%)#2,786 |
| 94. | Pantops | 44 | 25,764(0.17%)#94 | 944,917(0.00%)#2,787 |
| 95. | Twin Lakes | 44 | 25,764(0.17%)#95 | 944,917(0.00%)#2,793 |
| 96. | Buckhall | 43 | 25,764(0.17%)#96 | 944,917(0.00%)#2,807 |
| 97. | Crozet | 42 | 25,764(0.16%)#97 | 944,917(0.00%)#2,868 |
| 98. | One Loudoun | 42 | 25,764(0.16%)#98 | 944,917(0.00%)#2,875 |
| 99. | Cascades | 40 | 25,764(0.16%)#99 | 944,917(0.00%)#2,934 |
| 100. | Cherry Hill | 39 | 25,764(0.15%)#100 | 944,917(0.00%)#2,973 |
Common Questions
What are the Top 10 Cities with the Most Immigrants from Northern Europe in Virginia?
Top 10 Cities with the Most Immigrants from Northern Europe in Virginia are:
#1
1,798
#2
1,520
#3
903
#4
712
#5
612
#6
494
#7
476
#8
445
#9
421
#10
378
What city has the Most Immigrants from Northern Europe in Virginia?
Virginia Beach has the Most Immigrants from Northern Europe in Virginia with 1,798.
What is the Total Immigrants from Northern Europe in the State of Virginia?
Total Immigrants from Northern Europe in Virginia is 25,764.
What is the Total Immigrants from Northern Europe in the United States?
Total Immigrants from Northern Europe in the United States is 944,917.